Tandem Duplication in NBS Gene Families: Drivers of Disease Resistance and Targets for Crop Improvement
This article provides a comprehensive analysis of tandem duplication's role in the evolution and expansion of Nucleotide-Binding Site-Leucine Rich Repeat (NBS-LRR) gene families, the primary mediators of plant disease resistance.
Tandem Duplication in NBS Gene Families: Drivers of Disease Resistance and Targets for Crop Improvement
Abstract
This article provides a comprehensive analysis of tandem duplication's role in the evolution and expansion of Nucleotide-Binding Site-Leucine Rich Repeat (NBS-LRR) gene families, the primary mediators of plant disease resistance. We explore the foundational principles establishing tandem duplication as a key evolutionary driver, detail cutting-edge bioinformatics methodologies for its identification, and address common analytical challenges. Through comparative genomics and expression profiling, we validate the functional significance of tandemly duplicated NBS clusters in pathogen response. This synthesis is intended to equip researchers and breeders with the knowledge to harness these dynamic genetic elements for developing durable disease resistance in crops.
The Evolutionary Arms Race: How Tandem Duplication Shapes NBS Gene Families
NBS-LRR Genes as Central Players in Plant Effector-Triggered Immunity
Plants have evolved a sophisticated, multi-layered immune system to defend against pathogen attacks. The first layer, Pattern-Triggered Immunity (PTI), is initiated when cell surface-localized pattern recognition receptors (PRRs) detect conserved pathogen-associated molecular patterns (PAMPs) [1]. However, successful pathogens often deliver effector proteins into plant cells to suppress PTI. In response, plants have evolved intracellular NBS-LRR proteins (also known as NLRs) that recognize these effectors and initiate a more robust second layer of defense termed Effector-Triggered Immunity (ETI) [2] [1]. The NBS-LRR gene family represents the largest and most important class of disease resistance (R) genes in plants, with approximately 80% of cloned R genes encoding NBS-LRR proteins [3] [4]. These proteins function as specialized immune receptors that can detect pathogen effectors either through direct binding or by monitoring the status of host proteins that effectors target [5] [1].
NBS-LRR proteins are members of the STAND (Signal Transduction ATPase with Numerous Domains) family of ATPases and are characterized by a conserved nucleotide-binding site (NBS) domain and C-terminal leucine-rich repeats (LRRs) [2] [5]. Based on their N-terminal domains, they are classified into two major subfamilies: TNLs (containing Toll/interleukin-1 receptor domains) and CNLs (containing coiled-coil domains) [5] [4]. A third, smaller subfamily of RNLs (containing RPW8 domains) has also been identified, which often function as "helper" NLRs in signaling cascades [6] [7]. The NBS domain facilitates nucleotide binding and hydrolysis, which powers conformational changes during activation, while the LRR domain is primarily involved in effector recognition and autoinhibition [1] [4]. These proteins exhibit a modular structure, and recent research has revealed that specific protein fragments alone can sometimes initiate defense signaling [2].
Structural Characteristics and Functional Mechanisms
Domain Architecture and Molecular Switching
NBS-LRR proteins are among the largest proteins in plants, ranging from approximately 860 to 1,900 amino acids, and contain at least four distinct domains joined by linker regions [5]. The N-terminal domain (TIR, CC, or RPW8) is involved in protein-protein interactions and downstream signaling. The central NBS domain contains several conserved motifs characteristic of the STAND family of ATPases, including the P-loop, kinase-2, RNBS, GLPL, and MHD motifs [5] [4]. These motifs are critical for nucleotide binding and hydrolysis, which drive the conformational changes that regulate the protein's "on" and "off" states [1]. The C-terminal LRR domain typically consists of multiple leucine-rich repeats that form a solenoid structure, providing a versatile surface for protein-protein interactions [5].
These proteins function as molecular switches in disease signaling pathways, with their activation state regulated by nucleotide binding and hydrolysis [2] [1]. In the inactive state, NBS-LRR proteins are maintained in an auto-inhibited conformation, often with ADP bound to the NBS domain. Upon effector recognition, nucleotide exchange occurs (ADP to ATP), triggering conformational changes that activate the protein and initiate downstream signaling [1]. This signaling frequently culminates in a hypersensitive response (HR), a form of programmed cell death at the infection site that restricts pathogen spread [1].
Effector Recognition Strategies
NBS-LRR proteins have evolved sophisticated mechanisms to detect pathogen effectors, primarily through three recognition strategies:
- Direct Recognition: Some NBS-LRR proteins directly bind to pathogen effectors through their LRR domains. This receptor-ligand model provides specific recognition but can be vulnerable to effector evolution that alters binding surfaces [1].
- Guard Model: In this indirect recognition system, NBS-LRR proteins "guard" host proteins ("guardees") that are targeted by pathogen effectors. When effectors modify these guardees, the NBS-LRR proteins detect the alteration and activate defense responses. A classic example involves the Arabidopsis RIN4 protein, which is guarded by the RPM1 and RPS2 NBS-LRR proteins [1].
- Decoy Model: Plants have evolved proteins that mimic authentic pathogen targets but lack their functional domains ("decoys"). When effectors interact with these decoys, nearby NBS-LRR proteins detect the interaction and initiate immunity. Some NBS-LRR proteins have integrated decoy domains within their structure, creating a self-contained surveillance system [1].
Table 1: Effector Recognition Strategies Employed by NBS-LRR Proteins
| Recognition Strategy | Mechanism | Example | Advantages |
|---|---|---|---|
| Direct Recognition | LRR domain directly binds pathogen effector | N protein recognizing TMV helicase | High specificity for particular effectors |
| Guard Model | Monitors modifications of host "guardee" proteins | RPM1/RPS2 guarding RIN4 in Arabidopsis | Detects multiple effectors targeting same host protein |
| Decoy Model | Uses mimic proteins to trap effectors | RPS5 recognizing AvrPphB cleavage of PBS1 | Expands recognition spectrum without fitness costs |
Genomic Distribution and Evolution of NBS-LRR Genes
Genomic Organization and Tandem Duplication
NBS-LRR genes are notably non-randomly distributed in plant genomes, frequently occurring in clusters as a result of both segmental and tandem duplications [5] [4]. This clustering facilitates the generation of diversity through unequal crossing-over and gene conversion, enabling plants to rapidly evolve new recognition specificities [5]. Tandem duplication appears to be a primary driver of NBS-LRR gene family expansion, with studies in pepper revealing that 54% of NBS-LRR genes form 47 gene clusters distributed across all chromosomes [4]. Similarly, research in tobacco identified 1226 NBS genes across three Nicotiana genomes, with whole-genome duplication significantly contributing to family expansion [8].
The evolution of NBS-LRR genes follows a birth-and-death model, where gene duplications create new recognition specificities, followed by density-dependent purifying selection [5]. Different domains of NBS-LRR proteins experience distinct selective pressures: the NBS domain is typically subject to purifying selection, maintaining conserved structural and functional elements, while the LRR region often shows evidence of diversifying selection, particularly in solvent-exposed residues that interact with pathogens [5]. This heterogeneous evolution generates substantial diversity, with Arabidopsis NBS-LRR proteins potentially existing in over 9×10^11 variants based on LRR diversity alone [5].
Table 2: NBS-LRR Gene Family Size Across Plant Species
| Plant Species | Total NBS-LRR Genes | CNL Subfamily | TNL Subfamily | RNL Subfamily | Reference |
|---|---|---|---|---|---|
| Arabidopsis thaliana | ~150-207 | Majority | Significant minority | Limited | [5] [3] |
| Oryza sativa (rice) | ~400-505 | All | None (absent in cereals) | Limited | [5] [3] |
| Nicotiana benthamiana | 156 | 25 CNL-type | 5 TNL-type | 4 with RPW8 domain | [6] |
| Salvia miltiorrhiza | 196 | 61 CNLs | 2 TNLs | 1 RNL | [3] |
| Capsicum annuum (pepper) | 252 | 248 nTNLs | 4 TNLs | Included in nTNLs | [4] |
| Asparagus officinalis | 27 | Majority | Limited | Limited | [7] |
| Vernicia montana | 149 | 98 with CC domains | 12 with TIR domains | Not specified | [9] |
Lineage-Specific Evolution and Subfamily Distribution
The composition of NBS-LRR subfamilies varies substantially across plant lineages, reflecting distinct evolutionary paths. TNL proteins are completely absent from cereal genomes, suggesting they were lost in the cereal lineage after divergence from other monocots [5]. In contrast, gymnosperms like Pinus taeda exhibit significant TNL expansion, with TNLs comprising 89.3% of typical NBS-LRRs [3]. Some eudicots, including sesame (Sesamum indicum) and Vernicia fordii, have also lost TNL genes [9].
Recent studies in medicinal plants reveal interesting evolutionary patterns. In Salvia miltiorrhiza, researchers identified a marked reduction in TNL and RNL subfamily members compared to other angiosperms [3]. Similarly, analysis of asparagus species (Asparagus officinalis, A. kiusianus, and A. setaceus) showed a progressive contraction of NLR genes during domestication, with 63, 47, and 27 NLR genes identified in A. setaceus, A. kiusianus, and A. officinalis, respectively [7]. This reduction in NLR repertoire correlated with increased disease susceptibility in the domesticated species, suggesting that artificial selection for yield and quality traits may have inadvertently compromised immune capacity [7].
Research Reagent Solutions for NBS-LRR Studies
Table 3: Essential Research Reagents for NBS-LRR Gene Functional Analysis
| Reagent/Resource | Function/Application | Example Tools/Databases | |
|---|---|---|---|
| HMM Profiles | Identification of NBS domains in genomic sequences | PF00931 (NB-ARC) from Pfam database | [3] [8] [6] |
| Domain Databases | Characterization of protein domain architecture | Pfam, SMART, NCBI CDD, InterProScan | [8] [6] [7] |
| Genomic Resources | Reference sequences for identification and analysis | Plant GARDEN, Dryad Digital Repository, NCBI | [8] [7] |
| VIGS System | Functional characterization through gene silencing | Tobacco rattle virus-based vectors | [9] |
| Promoter Analysis Tools | Identification of regulatory elements | PlantCARE database | [6] [7] |
| Phylogenetic Analysis Software | Evolutionary relationship reconstruction | MEGA, Clustal W, OrthoFinder | [8] [6] [7] |
| Subcellular Localization Predictors | Protein localization prediction | CELLO v.2.5, Plant-mPLoc, WoLF PSORT | [6] [7] |
Experimental Protocols for NBS-LRR Gene Analysis
Genome-Wide Identification and Classification
Objective: To systematically identify and classify NBS-LRR genes in a plant genome.
Methodology:
- Sequence Retrieval: Obtain the complete genome assembly and annotated protein sequences for the target species from appropriate databases [8] [7].
- HMM Search: Perform Hidden Markov Model searches using HMMER software with the NB-ARC domain model (PF00931) from the Pfam database. Apply an E-value cutoff of <1×10^-20 to ensure specificity [8] [6].
- Domain Verification: Validate candidate sequences using domain architecture analysis with multiple databases:
- Use Pfam, SMART, and NCBI's Conserved Domain Database (CDD) to identify NBS domains [6]
- Confirm CC domains using NCBI CDD or COILS software [8] [4]
- Identify TIR domains using PFAM domains (PF01582, PF00560, PF07723, PF07725) [8]
- Detect LRR domains using PFAM domains (PF12779, PF13306, PF13516, PF13855, PF14580) [8]
- Classification: Categorize genes based on domain composition into eight subfamilies: CN, CNL, N, NL, RN, RNL, TN, TNL [8] [6].
Notes: This protocol successfully identified 196 NBS-LRR genes in Salvia miltiorrhiza [3], 252 in pepper [4], and 156 in Nicotiana benthamiana [6], demonstrating its broad applicability.
Functional Characterization Using Virus-Induced Gene Silencing (VIGS)
Objective: To determine the functional role of candidate NBS-LRR genes in disease resistance.
Methodology:
- Gene Selection: Identify candidate NBS-LRR genes with differential expression during pathogen infection or those located in genomic regions associated with resistance [9].
- Vector Construction: Clone a 200-300 bp fragment of the target gene into a TRV-based VIGS vector [9].
- Plant Transformation: Introduce the constructed vector into plant tissues using Agrobacterium-mediated transformation. For tobacco and related species, use hairy root transformation systems [9] [10].
- Pathogen Challenge: Inoculate silenced plants with the target pathogen. For Fusarium wilt studies, use root dipping methods with fungal spore suspensions [9].
- Phenotypic Assessment: Evaluate disease symptoms using standardized scoring systems and measure pathogen biomass through quantitative PCR [9].
- Expression Analysis: Confirm gene silencing and assess expression of defense markers using RT-qPCR [9].
Application Example: This approach demonstrated that Vm019719, a CNL gene from Vernicia montana, confers resistance to Fusarium wilt, while its allelic counterpart in susceptible V. fordii (Vf11G0978) contained a promoter deletion that compromised defense activation [9].
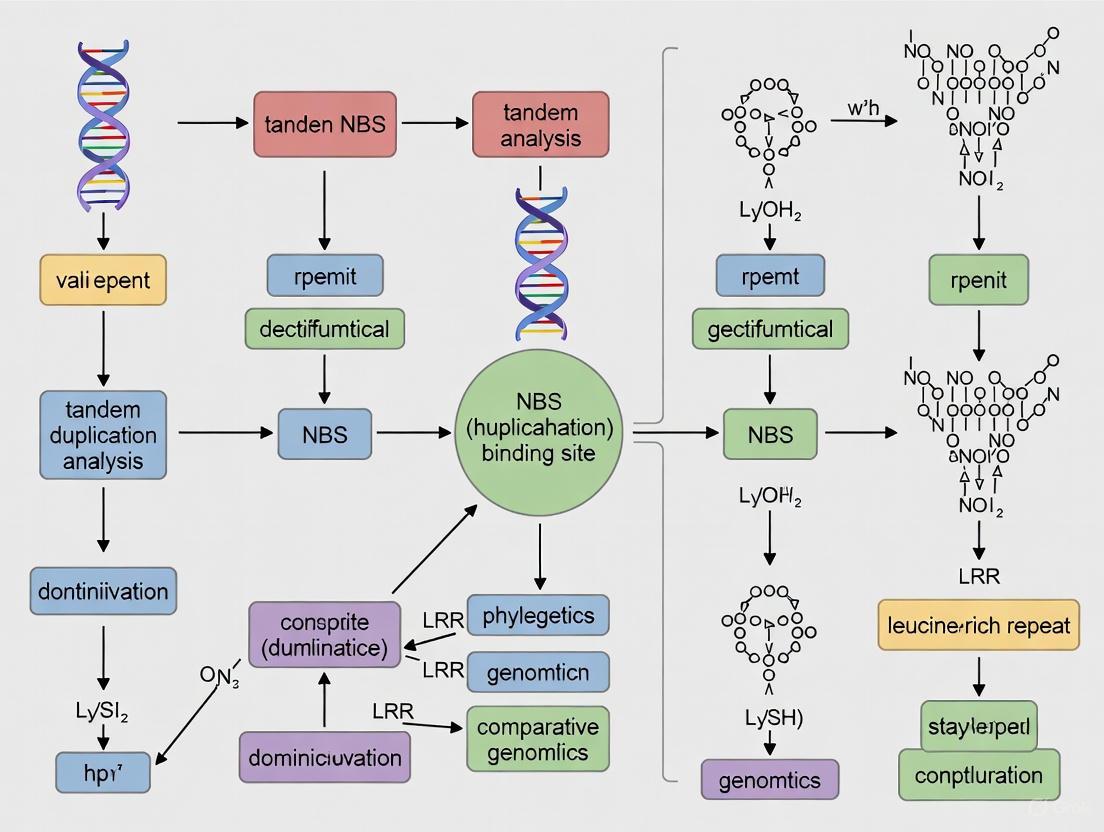
Diagram 1: Experimental workflow for comprehensive NBS-LRR gene analysis in plant immunity research
Tandem Duplication Analysis in NBS-LRR Gene Families
Objective: To identify and characterize tandem duplication events in NBS-LRR gene clusters.
Methodology:
- Chromosomal Mapping: Map the physical positions of all identified NBS-LRR genes on chromosomes using annotation data and visualization tools like TBtools [7] [4].
- Tandem Gene Identification: Define tandem duplicates as adjacent NBS-LRR genes separated by ≤ 8 non-NBS-LRR genes or located within a 200 kb genomic region [7] [4].
- Cluster Analysis: Group tandemly duplicated genes into clusters and analyze their distribution patterns across chromosomes.
- Sequence Analysis: Calculate non-synonymous (Ka) and synonymous (Ks) substitution rates for tandem duplicates using KaKs_Calculator with appropriate evolutionary models [8].
- Selection Pressure Assessment: Interpret Ka/Ks ratios: Ka/Ks > 1 indicates positive selection, Ka/Ks ≈ 1 indicates neutral evolution, and Ka/Ks < 1 suggests purifying selection [8].
Application: This protocol revealed 47 NBS-LRR gene clusters in pepper, comprising 54% of all identified NBS-LRR genes, highlighting the prominent role of tandem duplication in the evolution of this gene family [4].
Application Notes and Technical Considerations
Practical Implementation Guidance
When implementing the protocols described above, several technical considerations are essential for success:
Domain Verification Specificity: Use multiple domain databases for verification, as different tools may have varying sensitivities for detecting certain domains, particularly for atypical NBS-LRR proteins that lack complete domain suites [6]. For example, in Nicotiana benthamiana, 60 of 156 identified NBS-LRRs were "N-type" proteins containing only the NBS domain [6].
Expression Analysis Integration: Combine RNA-seq data with pathogen challenge experiments to identify candidate NBS-LRR genes with potential functional roles. Studies in tobacco responding to black shank and bacterial wilt demonstrated that many NBS-LRR genes show pathogen-induced expression patterns [8].
VIGS Optimization: For virus-induced gene silencing, include appropriate controls: empty vector controls, non-silenced plants, and plants silenced for a positive control gene (e.g., PDS for photobleaching visualization). Optimal silencing typically occurs 2-3 weeks post-inoculation [9].
Troubleshooting Common Challenges
Low HMM Search Sensitivity: If initial HMM searches yield few candidates, adjust E-value cutoffs less stringently (e.g., 1×10^-10) and supplement with BLASTp searches using known NBS-LRR sequences as queries [7].
Atypical NBS-LRR Proteins: When encountering truncated NBS-LRR variants (lacking LRR or N-terminal domains), retain them for analysis as they may function as adaptors or regulators of typical NBS-LRR proteins [5] [6].
Functional Redundancy: For species with large NBS-LRR families, expect functional redundancy. Consider multiple gene silencing or CRISPR-Cas9 mutagenesis of gene clusters rather than single genes [2].
Diagram 2: NBS-LRR-mediated immunity signaling pathways showing direct and indirect effector recognition
NBS-LRR genes stand as central players in plant effector-triggered immunity, providing remarkable diversity in pathogen recognition through their variable molecular structures and complex genomic organization. Their evolution through mechanisms such as tandem duplication has enabled plants to maintain a vast, adaptable immune repertoire capable of recognizing rapidly evolving pathogens. The experimental approaches outlined in this article—from genome-wide identification and classification to functional characterization using VIGS and tandem duplication analysis—provide researchers with comprehensive tools to investigate this crucial gene family.
Recent advances in our understanding of NBS-LRR genes have revealed several promising directions for future research. The emerging paradigm of NLR pairs functioning together in disease resistance presents exciting opportunities for engineering novel resistance specificities [2]. Additionally, the discovery that specific protein fragments from different NBS-LRRs can initiate defense signaling suggests potential strategies for creating synthetic resistance proteins with enhanced recognition capabilities [2]. Furthermore, the growing appreciation of crosstalk between PTI and ETI indicates that future crop improvement strategies should consider both immune layers simultaneously rather than in isolation [1].
As genomic technologies continue to advance, the ability to identify, characterize, and deploy NBS-LRR genes for crop improvement will accelerate dramatically. The integration of pan-genomic analyses with advanced genome editing techniques holds particular promise for developing durable, broad-spectrum disease resistance in agricultural crops, potentially reducing reliance on chemical pesticides and enhancing global food security.
The nucleotide-binding site and leucine-rich repeat (NBS-LRR) gene family represents one of the largest and most critical classes of disease resistance (R) genes in plants, enabling recognition of diverse pathogens and initiation of immune responses [11] [12]. Understanding the evolutionary mechanisms driving the expansion and diversification of this gene family is fundamental to plant disease resistance research. Tandem duplication has emerged as a primary force generating the remarkable diversity and species-specific adaptation of NBS-LRR genes across plant genomes [13] [14]. Unlike whole-genome duplication (WGD) events that affect all genes simultaneously, tandem duplication operates at a local scale, creating clusters of genetically linked paralogs that evolve rapidly through birth-and-death evolution [15] [16]. This process facilitates the generation of novel recognition specificities essential for keeping pace with rapidly evolving pathogens [11]. This Application Note delineates standardized protocols for investigating tandem duplication's role in NBS-LRR family evolution and provides a curated research toolkit to support experimentation in this field.
Genome-wide analyses across numerous plant species consistently demonstrate significant variation in NBS-LRR gene numbers, largely driven by lineage-specific tandem duplication events [12] [14]. The following table summarizes the distribution of NBS-LRR genes identified in various plant species, highlighting patterns of tandem duplication.
Table 1: NBS-LRR Gene Distribution Across Plant Genomes
| Plant Species | Total NBS-LRR Genes | Genes in Tandem Clusters | Clustering Percentage | Primary Expansion Mechanism | Reference |
|---|---|---|---|---|---|
| Arabidopsis thaliana | ~200 | ~28 (14%) | ~14% | Segmental & Tandem | [16] |
| Manihot esculenta (Cassava) | 327 | 206 (in 39 clusters) | 63% | Tandem Duplication | [11] |
| Asparagus officinalis | 49 loci | ~24 (in clusters) | ~50% | Tandem Duplication | [13] |
| Nicotiana benthamiana | 156 | Information not specified | Information not specified | Not specified | [6] |
| Rosaceae species (average) | 182 (average) | Variable across species | Variable | Lineage-Specific Tandem Expansion | [12] |
| Diploid Potato Genotypes | Highly variable | Abundant and dispersed | Information not specified | Lineage-Specific Tandem Expansion | [14] |
The data reveal that tandem duplication contributes substantially to NBS-LRR family sizes, with some species exhibiting over 50% of their NBS-LRR genes organized in tandem clusters [11] [13]. This organizational pattern promotes frequent sequence exchanges between paralogs and the generation of novel resistance specificities [11]. Recent studies utilizing spatial transcriptomics have further demonstrated that tandem duplicates often exhibit preserved expression profiles across cell types due to retention of ancestral regulatory elements, though they can also diverge asymmetrically with one copy maintaining broad expression while another specializes [17].
Experimental Protocols for NBS-LRR Tandem Duplication Analysis
Genome-Wide Identification of NBS-LRR Genes
Principle: Automated mining of plant genome sequences using conserved domain models to identify complete sets of NBS-LRR genes.
Materials:
- High-quality genome assembly (chromosome-level preferred)
- Annotated protein or gene sequence file
- HMMER software suite (v3.0+)
- Pfam domain profiles (NB-ARC: PF00931; TIR: PF01582; CC: PF18052; LRR: PF00560, etc.)
Procedure:
- Domain Search: Execute HMMER search against the proteome using NB-ARC (PF00931) hidden Markov model (HMM): Use E-value cutoff < 1×10⁻²⁰ for initial identification [11] [6].
Candidate Verification: Confirm NBS domain presence in candidate sequences using Pfam database (http://pfam.xfam.org/) and NCBI's Conserved Domain Database (CDD) with E-value < 0.01 [13] [6].
Classification: Classify sequences into TNL, CNL, and RNL subfamilies based on N-terminal domains:
Manual Curation: Remove partial sequences and verify domain architecture through SMART tool and multiple sequence alignment.
Identification of Tandemly Duplicated Genes
Principle: Tandem duplicates are defined as closely related genes located within close genomic proximity, often organized in clusters.
Materials:
- Chromosomal coordinates of identified NBS-LRR genes
- BLAST+ software suite
- Custom scripts for genomic distance calculation
Procedure:
- Chromosomal Mapping: Map all NBS-LRR genes to their genomic positions using annotation files.
Cluster Definition: Apply cluster criteria:
- Maximum intergenic distance: <200 kb
- Minimum cluster size: ≥2 NBS-LRR genes
- Maximum unrelated genes between NBS-LRR genes: ≤8 [13]
Family Assignment: Group clustered genes into families using BLAST all-against-all with thresholds:
- Alignment coverage >70% of longer gene
- Sequence identity >70% in aligned region [13]
Visualization: Generate chromosomal distribution maps showing cluster locations using visualization tools.
Evolutionary and Phylogenetic Analysis
Principle: Reconstruct evolutionary relationships to identify duplication timing and functional divergence.
Materials:
- Multiple sequence alignment software (ClustalW, MUSCLE)
- Phylogenetic analysis software (MEGA6+)
- MEME suite for motif discovery
Procedure:
- Sequence Alignment: Extract NB-ARC domains (from P-loop to MHDV motifs) and align using ClustalW or MUSCLE with default parameters [11] [13].
Phylogenetic Reconstruction: Construct maximum likelihood trees in MEGA:
Motif Analysis: Identify conserved motifs using MEME suite:
- Motif count: 10
- Width range: 6-50 amino acids [6]
Selection Pressure Analysis: Calculate non-synonymous (Ka) to synonymous (Ks) substitution rates:
- Ka/Ks < 1: Purifying selection
- Ka/Ks > 1: Positive selection
- Ka/Ks ≈ 1: Neutral evolution [14]
Figure 1: Computational workflow for identifying and analyzing tandemly duplicated NBS-LRR genes.
Table 2: Key Research Reagent Solutions for NBS-LRR Tandem Duplication Studies
| Category | Specific Tool/Resource | Application | Key Features |
|---|---|---|---|
| Domain Databases | Pfam (PF00931, PF01582) | NBS-LRR identification | Curated HMM profiles for conserved domains |
| NCBI Conserved Domain Database | Domain verification | Comprehensive domain annotation | |
| Sequence Analysis | HMMER Suite | Domain searches | Statistical rigor for domain detection |
| MEME Suite | Motif discovery | Identifies conserved sequence motifs | |
| BLAST+ | Sequence similarity | Gene family assignment | |
| Phylogenetic Analysis | MEGA6+ | Evolutionary relationships | Maximum likelihood methods, bootstrap testing |
| ClustalW/MUSCLE | Sequence alignment | Multiple sequence alignment | |
| Genomic Analysis | Geneious Prime | Genome visualization | Integrates multiple data types |
| TBtools | Genomic data mining | User-friendly interface for large datasets | |
| Expression Analysis | Spatial Transcriptomics | Cell-type specific expression | Reveals expression divergence in paralogs [17] |
Tandem duplication serves as a primary evolutionary mechanism driving the expansion, diversification, and lineage-specific adaptation of NBS-LRR gene families in plants. The protocols and resources detailed in this Application Note provide a standardized framework for investigating this phenomenon across species. The functional bias of tandemly duplicated NBS-LRR genes toward stress response roles [16] [14], coupled with their rapid birth-and-death evolution, positions them as critical components in plant-pathogen coevolutionary dynamics. Implementation of these methodologies will accelerate the discovery of novel resistance genes and enhance understanding of plant immunity evolution, ultimately supporting breeding programs aimed at developing durable disease resistance in crop species.
Application Note: Observational Evidence and Biological Significance
Empirical Evidence from Plant Genomes
Recent high-quality genome assemblies have consistently revealed that Nucleotide-Binding Site Leucine-Rich Repeat (NBS-LRR) genes, the primary disease resistance genes in plants, are not randomly distributed across chromosomes. Instead, they show a pronounced tendency to cluster in specific genomic regions, particularly near telomeres (the physical ends of chromosomes), and this clustering is predominantly driven by tandem duplication events [18] [13].
A landmark study on pepper (Capsicum annuum) provided a quintessential example. The research identified 288 canonical NLR (NBS-LRR) genes and found their chromosomal distribution to be highly uneven. Chromosome 09 harbored the highest density, with 63 NLR genes, and a significant majority of these genes were located in telomeric regions. The study conclusively demonstrated that tandem duplication was the primary mechanism for the expansion of this gene family, accounting for 18.4% (53 out of 288) of the NLR genes, with Chr08 and Chr09 being the main hotspots for these events [18].
Similar patterns have been observed in other species. In garden asparagus (Asparagus officinalis), nearly 50% of NBS-encoding genes are present in clusters, with one cluster on chromosome 6 alone hosting 10% of all identified genes. Phylogenetic and synteny analyses confirmed that recent duplications, including both tandem and segmental events, have driven the recent expansion of the NBS-LRR family [13]. Furthermore, the assembly of the black wolfberry (Lycium ruthenicum) genome also identified tandem duplication as a key process enriching the number of disease resistance-related genes [19].
Table 1: Documented Evidence of NBS Gene Clustering in Telomeric Regions
| Species | Total NBS Genes Identified | Key Finding | Primary Expansion Mechanism | Citation |
|---|---|---|---|---|
| Pepper (Capsicum annuum) | 288 | Significant clustering near telomeres; Chr09 has highest density (63 genes) | Tandem duplication (18.4% of genes) | [18] |
| Garden Asparagus (Asparagus officinalis) | 68 (49 loci) | Nearly 50% of genes present in clusters; one cluster hosts 10% of all genes | Tandem and segmental duplications | [13] |
| Black Wolfberry (Lycium ruthenicum) | 154 | Tandem duplications enriched resistance gene number | Tandem duplication | [19] |
Functional and Evolutionary Implications
The clustering of tandemly duplicated NBS genes in telomeric regions is not a genomic curiosity but a key evolutionary strategy with critical functional consequences:
- Rapid Generation of Novel Resistance Specificities: Tandem duplication creates arrays of closely related genes. Telomeric regions are known for high recombination rates. The combination of gene duplication and elevated recombination facilitates the emergence of new NBS-LRR alleles through mechanisms like gene conversion and unequal crossing over, enabling plants to keep pace with rapidly evolving pathogens [18] [13].
- Effector-Triggered Immunity (ETI): NBS-LRR proteins are intracellular immune receptors that recognize specific pathogen effector proteins, activating a robust defense response often involving a hypersensitive response (HR) to restrict pathogen spread. The diversity generated in these telomeric clusters provides a rich repertoire of receptors for pathogen recognition [18].
- Coordinated Regulation: The clustering of these genes may also facilitate their coordinated transcriptional regulation. The pepper NLR study found that 82.6% of the NLR gene promoters were enriched with cis-regulatory elements responsive to defense hormones like salicylic acid (SA) and jasmonic acid (JA), suggesting a potential for co-regulation of clustered genes during pathogen attack [18].
Experimental Protocols
This section provides a detailed methodology for identifying tandemly duplicated NBS genes and characterizing their genomic distribution, particularly their enrichment in telomeric regions.
Protocol 1: Genome-Wide Identification and Classification of NBS-LRR Genes
Objective: To comprehensively identify all NBS-LRR genes in a sequenced genome and classify them based on their domain architecture.
Table 2: Key Research Reagent Solutions for Gene Identification
| Reagent/Resource | Function/Explanation | Example/Source |
|---|---|---|
| Reference Genome & Annotation | The high-quality genome sequence and gene models for the organism of interest. | E.g., Pepper 'Zhangshugang' genome [18] |
| Known NBS Protein Sequences | A set of verified NBS proteins from a related species used as queries for homology search. | E.g., NBS proteins from Arabidopsis thaliana or Allium sativum [18] [13] |
| HMM Profile for NBS Domain | A statistical model (Hidden Markov Model) that defines the conserved NBS domain, allowing for sensitive domain-based searches. | PF00931 (NB-ARC) from Pfam database [18] |
| Domain Databases | Tools to identify and validate protein domains and motifs for precise gene classification. | NCBI Conserved Domain Database (CDD), Pfam, SMART [18] [13] |
Workflow:
Homology-Based Search:
- Retrieve known NBS-LRR protein sequences from a closely related model species (e.g., Arabidopsis for dicots).
- Perform a BLASTP search (E-value cutoff ~1x10-30) against the target proteome. Retain all significant hits [13].
- Use the identified hits as new queries for iterative BLAST searches against the target genome until no new candidates are found.
Domain-Based Search:
- Use HMMER software (e.g., v3.3.2) to search the entire proteome using the NBS (NB-ARC, PF00931) HMM profile (E-value cutoff ~1x10⁻⁵) [18].
- Combine the results from the homology and HMM searches, and remove redundant entries.
Domain Validation and Classification:
- Validate the presence of the NBS domain in all candidate sequences using the NCBI CDD (cd00204) and Pfam [18] [13].
- Check for the presence and completeness of N-terminal (TIR, CC, RPW8) and C-terminal (LRR) domains using tools like Pfam, SMART, and the COILS program (for coiled-coil domains) [13].
- Classify the genes into categories (e.g., TNL, CNL, RNL, NL) based on their domain architecture.
Protocol 2: Analysis of Tandem Duplications and Telomeric Clustering
Objective: To identify tandemly duplicated NBS genes and determine their enrichment in telomeric regions.
Table 3: Key Research Reagent Solutions for Genomic Analysis
| Reagent/Resource | Function/Explanation | Example/Source |
|---|---|---|
| Genome Annotation File (GFF/GTF) | Contains the physical positions of all genes on the chromosomes, essential for mapping. | From the genome database (e.g., NCBI, Ensembl) |
| Synteny Analysis Tool | Software to identify regions of conserved gene order, revealing segmental duplications. | MCScanX (often integrated into toolkits like TBtools) [18] |
| Tandem Duplication Detector | Algorithm or pipeline to identify tandemly arrayed genes. | Custom criteria or tools like DTDHM/TD-COF [20] [21] |
| Circos/Advanced Circos | Software for visualizing chromosomal data, ideal for showing gene distribution and duplications. | Advanced Circos in TBtools [18] |
Workflow:
Define Tandem Duplications and Clusters:
- Tandem Duplication: Operationally define two or more NBS-encoding genes of the same phylogenetic clade located within a specified physical distance (e.g., < 200 kb) with no more than a set number of non-NBS genes intervening (e.g., < 8 genes) [13].
- Gene Cluster: A genomic region containing at least two NBS-LRR genes meeting the tandem duplication criteria.
Map Genomic Locations:
- Extract the chromosomal coordinates for all identified NBS-LRR genes from the genome annotation file.
- Calculate the relative distance of each gene from the closest telomere using chromosome length and gene position data.
Identify Tandem Duplication Events:
- Use a synteny analysis tool like MCScanX to perform intra-genomic self-alignment and identify duplicate gene pairs.
- Filter the results to identify gene pairs located on the same chromosome and in close physical proximity, corresponding to your tandem duplication criteria [18].
- Alternatively, employ specialized tandem duplication detection tools like DTDHM or TD-COF, which integrate read depth, split read, and paired-end mapping signals from sequencing data for high-accuracy detection [20] [21].
Determine Telomeric Enrichment:
- Compare the density of NBS genes (particularly tandem duplicates) in the terminal ~10% of each chromosome arm to the density in the internal 80%.
- Perform a statistical test (e.g., Chi-squared test) to assess whether the observed clustering in telomeric regions is significant.
The Scientist's Toolkit
Table 4: Essential Research Reagents and Computational Tools
| Category | Item | Specific Function in Analysis |
|---|---|---|
| Bioinformatics Software | TBtools | Integrative toolkit; used for MCScanX synteny analysis, Circos plot generation, and general data visualization [18]. |
| HMMER | Profile HMM searches for identifying conserved NBS (NB-ARC) domains in protein sequences [18]. | |
| DTDHM / TD-COF | Specialized pipelines for accurately detecting tandem duplications from next-generation sequencing data by hybridizing multiple signals [20] [21]. | |
| Databases & Web Servers | Pfam / NCBI CDD | Databases of protein family models and conserved domains for validating NBS and other domains in candidate genes [18] [13]. |
| PlantCARE | Database for predicting cis-regulatory elements in promoter sequences, useful for understanding gene regulation [18]. | |
| STRING | Database for predicting protein-protein interactions, which can help identify hub genes in NBS-mediated immune networks [18]. | |
| Experimental Validation | RT-qPCR | Validating the differential expression of candidate NBS genes identified through transcriptomic analysis in response to pathogen challenge [18]. |
The nucleotide-binding site-leucine-rich repeat (NBS-LRR) gene family constitutes one of the most critical lines of defense in the plant immune system, encoding intracellular receptors that recognize pathogen effectors and trigger robust immune responses. Among the mechanisms driving the evolution and expansion of this diverse gene family, tandem duplication stands out as a predominant force, enabling plants to rapidly generate novel resistance specificities against evolving pathogens. This Application Note examines the role of tandem duplication in shaping NBS families across economically significant plant lineages—cereals (barley), Solanaceae (pepper, tobacco, potato), and fruits (passion fruit)—to provide researchers with comparative insights and methodological frameworks for studying this evolutionary phenomenon. The dynamic birth-and-death evolution of these genes, largely fueled by tandem duplication events, creates a valuable reservoir of genetic diversity that can be harnessed for crop improvement and disease resistance breeding programs.
Comparative Case Studies of Tandem Duplication
Table 1: Comparative Analysis of Tandem Duplication in NBS-LRR Gene Families
| Plant Species | Family/Type | Total NBS Genes | TNL Genes | CNL Genes | RNL Genes | Key Findings on Tandem Duplication |
|---|---|---|---|---|---|---|
| Barley (Hordeum vulgare) | Cereals | 467 NBS-LRR [22] | Not specified | Not specified | Not specified | Major expansion mechanism for the NBS-LRR family [22] |
| Passion fruit (Passiflora edulis Sims.) | Fruits | 25 PeCNLs [22] | Not present in purple passion fruit | 25 CNLs identified [22] | Not specified | 17 gene pairs underwent tandem duplication; Genes clustered on chromosome 3 [22] |
| Nine Solanaceae species (e.g., pepper, tobacco, potato) | Solanaceae | 819 total [23] | 182 TNLs [23] | 583 CNLs [23] | 54 RNLs [23] | Tandem duplication contributes to scattered chromosomal distribution, particularly at chromosomal termini [23] |
| Cotton (Gossypium raimondii) | Eudicots | 355 NBS-encoding genes [24] | TIR-containing subgroup [24] | CC-containing subgroup [24] | Not specified | Tandem duplication leads to functional diversity; TIR-type genes show distinct evolutionary patterns [24] |
Detailed Case Analysis
Cereals: Barley (Hordeum vulgare)
With 467 NBS-LRR genes identified, barley represents one of the larger reservoirs of resistance genes among cereals [22]. Tandem duplication has served as a major expansion mechanism for this family, allowing barley to maintain a diverse arsenal of resistance specificities. This expansion is particularly significant for cereal crops facing evolving fungal and bacterial pathogens in agricultural environments. The genomic organization of these tandemly duplicated genes creates hotspots of resistance gene diversity that can be exploited in marker-assisted breeding programs.
Solanaceae: Pepper, Tobacco, and Potato
A comprehensive analysis of nine Solanaceae species revealed 819 NBS-LRR genes, further classified into 583 CNL, 182 TNL, and 54 RNL types [23]. Whole genome duplication (WGD) has played a significant role in the expansion of these gene families, but tandem duplication events have been crucial for the functional diversification and species-specific adaptation of resistance genes. These genes predominantly localize to chromosomal termini [23], regions known for high recombination rates that facilitate the tandem duplication process and subsequent neofunctionalization.
Gene clustering and rearrangement within the NBS-LRR family contribute to their scattered chromosomal distribution [23]. This distribution pattern is consistent with the birth-and-death evolution model, where new resistance genes are created through tandem duplication and some copies are maintained while others are eliminated or pseudogenized over evolutionary time.
Fruits: Passion Fruit (Passiflora edulisSims.)
In purple passion fruit, 25 CNL genes have been identified, with 17 gene pairs arising through tandem duplication events [22]. Most of these PeCNL genes are clustered on chromosome 3 [22], indicating a hot spot for resistance gene evolution in this species. Passion fruit CNL genes were found to contain cis-elements involved in plant growth, hormones, and stress response, suggesting that tandem duplication has contributed not only to pathogen resistance but potentially to broader stress adaptation.
Transcriptome analysis identified specific tandemly duplicated genes (PeCNL3, PeCNL13, and PeCNL14) as differentially expressed under Cucumber mosaic virus infection and cold stress [22]. This indicates that recent tandem duplicates may have acquired functions beyond pathogen recognition, possibly through subfunctionalization or neofunctionalization after duplication.
Experimental Protocols for Tandem Duplication Analysis
Genomic Identification of NBS-LRR Genes
Protocol 1: Identification and Classification of NBS-LRR Genes
Step 1: Initial Sequence Collection
- Obtain reference NBS-LRR protein sequences from databases such as Ensembl Plants or PRGDB (Plant Resistance Gene Database). For example, one study used 51 CNL protein sequences from A. thaliana as queries [22].
- Download the proteome of your target species from relevant genomic databases (e.g., NCBI, Sol Genomics Network, or species-specific databases).
Step 2: Homology Search
- Perform a BLASTp search of reference sequences against the target proteome using a standalone BLAST or web-based tools.
- Apply an initial E-value cutoff (e.g., 1×10⁻¹⁵ used in cotton studies [24]) to identify potential NBS-encoding genes.
Step 3: Domain Verification and Classification
- Confirm the presence of characteristic NBS-LRR domains (NB-ARC, LRR) and N-terminal domains (TIR, CC, or RPW8) using:
- Classify genes into TNL, CNL, or RNL subfamilies based on domain architecture.
Step 4: Physicochemical Characterization
- Use tools like ExPASy ProtParam to calculate protein length, molecular weight, isoelectric point, and other properties [22].
Identifying Tandem Duplication Events
Protocol 2: Analysis of Tandem Duplications
Step 1: Determine Genomic Positions
- Map all identified NBS-LRR genes to their chromosomal locations using genome annotation files.
Step 2: Define Tandem Duplicates
- Apply established criteria for identifying tandem duplicates, typically:
- Genes belonging to the same phylogenetic clade
- Located within a specified physical distance (e.g., ≤ 200 kb)
- Separated by ≤ 5 non-NBS-LRR genes [15]
- Apply established criteria for identifying tandem duplicates, typically:
Step 3: Validate Duplication Events
- Perform multiple sequence alignment of putative tandem duplicates using ClustalW or MAFFT.
- Construct phylogenetic trees to confirm close evolutionary relationships.
- Calculate synonymous (Ks) and nonsynonymous (Ka) substitution rates to estimate divergence times and selection pressures.
Step 4: Comparative Analysis
- Compare tandem duplication patterns across related species to identify conserved and lineage-specific expansion events.
Expression and Functional Analysis
Protocol 3: Expression Profiling of Tandemly Duplicated Genes
Step 1: Transcriptome Data Acquisition
- Obtain RNA-seq data from public databases (e.g., NCBI SRA) under various stress conditions or from different tissues.
Step 2: Expression Analysis
- Map reads to the reference genome and calculate expression values (FPKM or TPM) for each NBS-LRR gene.
- Identify differentially expressed NBS-LRR genes under stress conditions compared to controls.
Step 3: Machine Learning Validation
- Apply Random Forest or other classifier models to identify multi-stress responsive genes, as demonstrated in passion fruit [22].
- Validate key candidate genes through qRT-PCR under controlled stress treatments.
Visualization of Workflows and Relationships
Experimental Workflow for Tandem Duplication Analysis
NBS-LRR Gene Classification and Evolution
The Scientist's Toolkit
Table 2: Essential Research Reagents and Resources for NBS-LRR Gene Analysis
| Category | Resource/Reagent | Specific Function | Example Sources/Implementations |
|---|---|---|---|
| Genomic Databases | Species-specific genome portals | Access to annotated genome sequences and gene models | Sol Genomics Network (Solanaceae), Passion Fruit Genomic Database, Cotton Research Institute database [22] [23] [24] |
| Domain Analysis Tools | Pfam, InterProScan, SMART | Identification of protein domains (NBS, LRR, TIR, CC) | Pfam (PF00931 for NBS domain), InterPro, SMART database [22] [24] |
| Coiled-Coil Prediction | MARCOIL, Paircoil2 | Detection of coiled-coil domains in CNL and RNL proteins | MARCOIL program, Paircoil2 web server [22] [24] |
| Phylogenetic Analysis | ClustalW, MEGA, OrthoFinder | Multiple sequence alignment and phylogenetic tree construction | ClustalW for alignment, MEGA for tree building, OrthoFinder for species trees [23] [24] |
| Expression Analysis | RNA-seq datasets, Random Forest classifiers | Differential expression analysis and identification of multi-stress responsive genes | NCBI SRA for transcriptome data, machine learning approaches [22] |
| Duplication Analysis | Custom Perl/Python scripts, BLAST+ | Identification of tandem and segmental duplication events | Scripts for gene position analysis, BLAST for homology detection [22] [24] |
Tandem duplication serves as a fundamental evolutionary mechanism driving the expansion and diversification of NBS-LRR gene families across plant lineages. The case studies presented herein—from the extensive families in barley (467 genes) and Solanaceae (819 genes total) to the more compact passion fruit CNL family (25 genes)—demonstrate both conserved patterns and lineage-specific innovations in resistance gene evolution. The methodological framework provided enables researchers to systematically identify, characterize, and validate tandemly duplicated NBS-LRR genes in species of interest. This knowledge provides a foundation for harnessing the natural diversity of resistance genes through marker-assisted breeding, genetic engineering, and genome editing approaches aimed at enhancing crop resilience against rapidly evolving pathogens.
From Sequence to Function: A Toolkit for Identifying and Analyzing Tandem Duplications
The nucleotide-binding site-leucine-rich repeat (NBS-LRR) gene family represents one of the largest classes of plant disease resistance (R) genes, playing a critical role in plant immune responses by recognizing pathogen effectors and triggering defense mechanisms [25] [26]. Bioinformatics approaches for identifying and characterizing these genes have become indispensable in plant genomics research, enabling researchers to catalogue resistance gene analogs (RGAs) across sequenced genomes and facilitate the discovery of potential disease resistance genes for crop improvement programs.
This application note details an integrated bioinformatics workflow for NBS gene identification, classification, and evolutionary analysis with special emphasis on detecting tandem duplication events. The protocol leverages three core tools: HMMER for domain-based identification, MCScanX for duplication analysis, and phylogenetic tools for evolutionary relationship inference. The workflow is presented within the context of studying tandem duplication events, which have been shown to be a primary mechanism for the expansion and adaptation of NBS gene families in plants [26] [27] [28].
Background and Significance
NBS-LRR genes are modular proteins typically consisting of three fundamental components: an N-terminal domain (TIR, CC, or RPW8), a central NB-ARC/NBS domain, and a C-terminal domain rich in leucine repeats (LRR) [29]. Based on their N-terminal features, plant NBS-LRR genes are historically divided into several subfamilies: TNL (TIR-NBS-LRR), CNL (CC-NBS-LRR), RNL (RPW8-NBS-LRR), and various truncated forms lacking complete domain structures [25] [26].
Research across multiple plant species has revealed dramatic variation in NBS-LRR gene counts, from 73 in Akebia trifoliata to 2,151 in Triticum aestivum (bread wheat) [25]. This expansion occurs primarily through gene duplication events, with tandem duplication being particularly significant for rapid adaptation to evolving pathogen populations [30] [28]. Studies in Arabidopsis thaliana have demonstrated that different modes of gene duplication (whole-genome, segmental, tandem, and transposed duplications) contribute differently to gene family evolution, with tandem duplicates often showing distinct evolutionary patterns and functional diversification [27] [31].
The comprehensive workflow for NBS gene family analysis integrates multiple bioinformatics tools into a cohesive pipeline, progressing from initial identification through evolutionary analysis. The process begins with genome-wide identification of NBS domain-containing genes using HMMER, followed by domain architecture analysis and classification. The identified genes are then mapped to chromosomes to determine genomic distribution, after which duplication events are detected using MCScanX. Finally, evolutionary relationships are inferred through phylogenetic analysis, with particular emphasis on understanding the patterns and implications of tandem duplication events.
The following diagram illustrates the complete analytical workflow:
Detailed Experimental Protocols
Genome-Wide Identification of NBS Genes Using HMMER
Principle: Hidden Markov Models (HMMs) provide a statistical framework for identifying distant homologs based on conserved domain architecture. The NB-ARC domain (Pfam: PF00931) serves as the signature domain for NBS gene identification [25] [26] [29].
Procedure:
Data Preparation
- Download the complete proteome file in FASTA format for your target species from sources such as Phytozome, NCBI, or EnsemblPlants.
- Obtain the corresponding genome annotation file (GFF/GTF format).
HMMER Search
- Download the HMM profile for PF00931 from the Pfam database.
- Run HMMER search against the proteome:
- Use an E-value cutoff of < 1×10⁻¹⁰ for significant hits [26].
Verification of Domain Architecture
Classification
- Classify genes into subfamilies based on domain architecture:
- CNL: CC-NBS-LRR
- TNL: TIR-NBS-LRR
- RNL: RPW8-NBS-LRR
- NL: NBS-LRR (no distinct N-terminal domain)
- CN/TN/N: Truncated forms lacking LRR domain [25]
- Classify genes into subfamilies based on domain architecture:
Table 1: Representative NBS Gene Counts Across Plant Species
| Species | Total NBS Genes | CNL | TNL | RNL | Other | Reference |
|---|---|---|---|---|---|---|
| Nicotiana tabacum | 603 | 224 (37.1%) | 73 (12.1%) | - | 306 (50.8%) | [25] |
| Solanum melongena (eggplant) | 269 | 231 (85.9%) | 36 (13.4%) | 2 (0.7%) | - | [26] |
| Malus domestica (apple) | 1,015 | ~50% | ~50% | - | - | [33] |
| Asparagus officinalis | 68 | 37 (54.4%) | - | - | 31 (45.6%) | [32] |
Tandem Duplication Analysis Using MCScanX
Principle: MCScanX identifies collinear blocks and gene duplication events through comparison of genomic sequences and gene positions [28]. Tandem duplicates are defined as closely related genes located within a specified genomic distance.
Procedure:
Input File Preparation
- Prepare a BLASTP output file of all-vs-all protein sequence comparisons:
- Format the GFF file to MCScanX requirements (tab-delimited with columns: geneID, chromosome, start, end).
Running MCScanX
Parameters: -b (BLASTP input), -s (match score), -m (match size)
Tandem Duplication Detection
- Use the
duplicate_gene_classifierutility included in MCScanX: - Extract gene pairs with classification code "3" (tandem duplicates) [28].
- Use the
Analysis of Tandem Duplicates
- Calculate non-synonymous (Ka) and synonymous (Ks) substitution rates using ParaAT and KaKs_Calculator:
- Estimate duplication time using the formula: T = Ks/2λ, with λ ≈ 1.5×10⁻⁸ substitutions/site/year [28].
Table 2: Tandem Duplication Patterns Across Plant Species
| Species | Total Genes | Tandem Duplicated Genes (TDGs) | Percentage | Major Functional Enrichment | Reference |
|---|---|---|---|---|---|
| Paspalum vaginatum | 28,712 | 2,542 | 8.85% | Ion transmembrane transporter activity, ABC transport | [28] |
| Oryza sativa | ~40,000 | ~3,112 | 7.78% | Not specified | [28] |
| Zea mays | ~40,000 | ~1,896 | 4.74% | Not specified | [28] |
| Setaria italica | ~34,000 | ~3,927 | 11.55% | Not specified | [28] |
| Sorghum bicolor | ~34,000 | ~3,679 | 10.82% | Not specified | [28] |
The following diagram illustrates the analytical decision process for characterizing duplication events:
Phylogenetic Analysis
Principle: Phylogenetic reconstruction reveals evolutionary relationships among NBS genes, helping to identify orthologous and paralogous relationships and subfamily diversification.
Procedure:
Sequence Alignment
- Perform multiple sequence alignment of NBS protein sequences using MUSCLE or MAFFT:
- Trim poorly aligned regions using trimAl or similar tools.
Phylogenetic Tree Construction
- Build a phylogenetic tree using Maximum Likelihood method with MEGA or IQ-TREE:
- Use Neighbor-Joining method as alternative with bootstrap analysis (1000 replicates) [34].
Integration with Duplication Data
- Map tandem duplication events onto phylogenetic clusters.
- Identify clades with high frequencies of recent tandem duplicates.
Selection Pressure Analysis
- Calculate Ka/Ks ratios for tandem duplicate pairs.
- Interpret selection pressures: Ka/Ks < 1 (purifying selection), Ka/Ks > 1 (positive selection), Ka/Ks ≈ 1 (neutral evolution).
The Scientist's Toolkit: Research Reagent Solutions
Table 3: Essential Bioinformatics Tools for NBS Gene Family Analysis
| Tool/Resource | Function | Application in NBS Analysis | Key Parameters |
|---|---|---|---|
| HMMER v3.1+ | Domain identification | Identify NB-ARC domain (PF00931) | E-value < 1×10⁻¹⁰ [25] |
| Pfam Database | Domain repository | Verify NBS, TIR, LRR, RPW8 domains | E-value < 0.01 [26] |
| NCBI CDD | Domain verification | Confirm conserved domain architecture | Default parameters [25] |
| MCScanX | Genome duplication analysis | Detect tandem and segmental duplications | -b 2, -s 5, -m 50 [28] |
| MUSCLE v3.8+ | Multiple sequence alignment | Align NBS protein sequences | Default parameters [25] |
| MEGA11 | Phylogenetic analysis | Construct evolutionary trees | Bootstrap = 1000 [25] [34] |
| KaKs_Calculator | Selection pressure analysis | Calculate Ka/Ks ratios | NG model [25] |
Applications and Case Studies
NBS Family Analysis in Nicotiana Species
A recent study identified 1,226 NBS genes across three Nicotiana genomes (N. tabacum, N. sylvestris, and N. tomentosiformis), with 603 members in the allotetraploid N. tabacum. The research demonstrated that approximately 76.62% of NBS members in N. tabacum could be traced back to their parental genomes, and whole-genome duplication contributed significantly to NBS gene family expansion [25]. Integration of RNA-seq analysis identified NBS genes responsive to black shank and bacterial wilt pathogens, providing candidates for further functional characterization.
Tandem Duplication in Eggplant NBS Genes
In eggplant (Solanum melongena), researchers identified 269 SmNBS genes unevenly distributed across chromosomes, with predominant presence on chromosomes 10, 11, and 12. Evolutionary analysis demonstrated that tandem duplication events were the primary mechanism for SmNBS expansion. Expression analysis via qRT-PCR revealed that nine SmNBSs showed differential expression patterns in response to Ralstonia solanacearum stress, with one gene (EGP05874.1) potentially involved in resistance response [26].
Genomic Convergence in Root Plants
A comprehensive study of 205 Archaeplastida genomes revealed evidence of genomic convergence through tandem duplication across different lineages of root plants. Tandem duplication-derived genes were enriched in enzymatic catalysis and biotic stress responses, suggesting adaptations to environmental pressures. The analysis particularly highlighted that environmental factors related to soil microbes were significantly associated with tandem duplication frequency, supporting the hypothesis that tandem duplication drives adaptation to soil microbial pressures in terrestrial root plants [30].
Troubleshooting and Technical Considerations
HMMER Sensitivity Adjustment
- For divergent NBS genes, consider relaxing E-value threshold to 1×10⁻⁵ or constructing a clade-specific HMM profile using confirmed NBS sequences from related species [33].
Tandem Duplication Definition
- Consistently apply cluster definition parameters: typically <200 kb between neighboring NBS-LRR genes and no more than eight intervening genes [32].
Phylogenetic Artifacts
- For large NBS families, consider subfamily-specific phylogenetic analyses to improve resolution of recent duplication events.
Selection Pressure Interpretation
- Exercise caution when interpreting Ka/Ks ratios for recent tandem duplicates, as the method assumes substitution saturation which may not be reached in recently diverged sequences.
The integrated workflow combining HMMER, MCScanX, and phylogenetic analysis provides a powerful approach for comprehensive characterization of NBS gene families with emphasis on tandem duplication events. This protocol enables researchers to identify the complete repertoire of NBS genes in a plant genome, classify them into subfamilies, detect expansion mechanisms, and infer evolutionary relationships. The emphasis on tandem duplication is particularly relevant given the prominent role this mechanism plays in plant adaptation to biotic stresses, offering insights for crop improvement programs aiming to enhance disease resistance.
Tandem repeats (TRs), patterns of nucleotides repeated in a head-to-tail fashion, constitute a substantial portion of eukaryotic genomes, contributing significantly to genetic variation, regulation of gene expression, and genome evolution [35] [36]. In the context of plant genomics, TR analysis is paramount for understanding the evolution and function of nucleotide-binding site-leucine-rich repeat (NBS-LRR) gene families, which form the cornerstone of plant innate immunity [25] [9]. These disease resistance genes are often organized in complex clusters resulting from tandem and segmental gene duplication events, followed by divergent evolution [37]. The high mutation rate of TRs, significantly greater than that of single nucleotide variants, makes them a potent source of genetic diversity [38]. Advanced detection and accurate genotyping of these repeats are therefore critical for deciphering the evolutionary dynamics of NBS-LRR genes and their role in disease resistance mechanisms, with direct applications in molecular breeding and crop improvement [25] [9].
A Landscape of Tandem Repeat Detection Tools
The development of software for tandem repeat detection has evolved through multiple generations, from early algorithms to modern tools that leverage sophisticated statistical models and handle various sequencing technologies.
Table 1: Overview of Tandem Repeat Detection Software
| Tool | Primary Function | Key Methodology | Notable Features |
|---|---|---|---|
| TRF (Tandem Repeats Finder) [39] | DNA TR detection & masking | Bernoulli trials identifying pairs of identical length-k runs | Heavily used; effective for consensus subunit identification |
| HipSTR [38] | Genome-wide STR genotyping | Uses sequencing reads that span the TR | Genotypes allele sequence; limited by read length |
| GangSTR [38] | Genome-wide STR genotyping | Uses mate-pair distance & STR-spanning reads | Genotypes STRs longer than sequencing read length |
| ExpansionHunter [38] | Genome-wide STR genotyping & expansion detection | Uses mate-pair distance & STR-spanning reads | Targets a predefined catalogue of STR loci |
| EHdn (ExpansionHunter de novo) [38] | Detection of rare STR expansions | Uses mate-pair distance without a predefined catalogue | Identifies novel STR expansion loci |
| STRling [38] | Detection of rare STR expansions | Uses mate-pair distance without a predefined catalogue | Low processor time; identifies novel loci |
| pytrf [36] | Identification of exact & approximate TRs | Optimized sliding window & dynamic programming | Python package; fast running time |
| ULTRA [39] | Detection & masking of decayed TRs | Hidden Markov Model (HMM) | Improved sensitivity for degenerate repeats; stable scores |
Early tools like Tandem Repeats Finder (TRF) have served as benchmarks for years, modeling repetitive regions through a series of Bernoulli trials [39]. While fast and effective, its scoring distribution can be unstable on random sequence, and it may miss highly decayed repeats [39]. A significant shift came with tools adopting Hidden Markov Models (HMMs). TANTAN, for instance, uses a simple HMM to compute the probability of a residue being part of a TR but can struggle with repeats containing indels [39]. The more recent ULTRA tool implements an HMM that bridges the gap between simplicity and a highly complex model, specifically designed to track frame shifts caused by insertions and deletions. This allows it to sensitively detect degenerate TRs missed by other software while maintaining a low false annotation rate [39].
The advent of high-throughput sequencing spurred the development of genotyping-focused tools. First-generation tools like HipSTR are limited to genotyping TRs shorter than the sequencing read length [38]. Second-generation tools, including GangSTR and ExpansionHunter, overcome this by integrating information from the distance between paired-end sequencing reads, enabling the genotyping of longer repeats and expansions [38]. For the discovery of novel, large expansions without a pre-specified catalog, tools like ExpansionHunter denovo (EHdn) and STRling are particularly effective, with the latter two demonstrating lower computational demands [38].
Finally, the pytrf package represents a practical advancement for the bioinformatics community. Written in C and compiled as a Python package, it offers seamless integration into larger Python-based workflows and Jupyter notebooks. It provides fast identification of both exact and approximate tandem repeats, showing top-tier performance in running time compared to other tools [36].
Benchmarking Performance in Tandem Repeat Analysis
Selecting the most appropriate TR detection tool requires an understanding of their performance characteristics, which vary based on the specific application, such as masking genomic sequence versus genotyping STRs from sequencing data.
Performance in Genomic Sequence Masking
A critical application of TR detectors is to "mask" repetitive regions to prevent false homology matches during sequence annotation. Benchmarking of masking tools on genomic sequences with different compositional biases reveals performance differences.
Table 2: Benchmarking of TR Detection Tools on Genomic Sequence Masking
| Tool | Human Genome (Chr18) Coverage | AT-rich Genomes Coverage | False Discovery Rate (FDR) | Key Strength |
|---|---|---|---|---|
| ULTRA (Sensitive) [39] | ~25% | ~35% | Low (est. <5%) | High sensitivity to decayed repeats |
| TANTAN (Sensitive) [39] | ~15% | ~20% | Medium (est. ~10-15%) | Fast computation |
| TRF (Sensitive) [39] | ~10% | ~45% | High on AT-rich (est. >20%) | Effective on perfect repeats in AT-rich genomes |
| pytrf [36] | N/A | N/A | N/A | Fast running time with comparable memory usage |
In one benchmark, ULTRA demonstrated substantially higher coverage of the human genome (chromosome 18) than TANTAN and TRF under both sensitive and conservative parameterizations. Crucially, this increased sensitivity did not come at the cost of a higher false discovery rate (FDR), which remained lower than that of TANTAN and significantly lower than TRF's FDR on AT-rich genomes [39]. TRF showed unusually high coverage on AT-rich genomes (e.g., Plasmodium falciparum), but this was accompanied by a high FDR, suggesting over-labeling of non-repetitive sequence [39].
Performance in STR Genotyping from Sequencing Data
For genotyping STRs from short-read sequencing data, benchmarks using the Genome in a Bottle (GIAB) consortium samples provide insights. HipSTR, GangSTR, and ExpansionHunter all perform well in genotyping common STRs, including the CODIS core forensic STRs [38]. In terms of call rate and memory usage, GangSTR and ExpansionHunter outperform HipSTR [38]. For detecting rarer, large STR expansions, EHdn, STRling, and GangSTR outperformed another tool, STRetch, in benchmarking analyses. EHdn and STRling were noted for using considerably less processor time compared to GangSTR [38].
Diagram 1: Generalized Workflow for Advanced Tandem Repeat Detection. This flowchart illustrates the common steps in TR analysis, from seed identification to final genotyping, integrating methods used by tools like ULTRA and GangSTR.
Application Notes: Protocol for Tandem Repeat Analysis in NBS-LRR Genes
The following protocol outlines a comprehensive workflow for identifying and characterizing tandem repeats within NBS-LRR gene families, integrating both sequence-based and genotyping approaches.
Protocol Part 1: Identification of Tandem Repeats in Plant Genomes
Objective: To identify and annotate tandem repeats across a plant genome of interest, with a focus on localizing repeats within NBS-LRR gene clusters.
Materials and Reagents:
- Genome Assembly: High-quality, chromosome-level assembly of the target plant genome (e.g., Nicotiana tabacum, Vernicia montana) in FASTA format.
- Software Tools:
- Computing Resources: High-performance computing cluster with sufficient memory (≥32 GB RAM recommended) and multi-core processors.
Procedure:
- Data Preparation:
- Download or assemble the genome sequence. Ensure the FASTA file is properly formatted.
- Genome-Wide TR Detection:
- Run
pytrfon the genome FASTA file to identify exact and approximate tandem repeats. Example command for microsatellites:pytrf -i genome.fa -o repeats_pytrf.bed -m 1 -M 6 -r 5. - In parallel, run
ULTRAwith sensitive parameters to capture degenerate repeats:ultra genome.fa -o repeats_ultra.bed.
- Run
- NBS-LRR Gene Identification:
- Using HMMER, search the annotated proteome or translated genome for the NB-ARC domain (PF00931). Command:
hmmsearch --domtblout nbs_results.txt Pfam-A.hmm protein.fasta. - Confirm domain architecture of candidate genes using the NCBI Conserved Domain Database (CDD) [25].
- Using HMMER, search the annotated proteome or translated genome for the NB-ARC domain (PF00931). Command:
- Integrative Analysis:
- Use genomic coordinates from the previous steps to overlap the TR annotations with the locations of identified NBS-LRR genes.
- Calculate the density of TRs within NBS-LRR clusters compared to the genomic average.
Protocol Part 2: Genotyping STRs in Population Sequencing Data
Objective: To genotype short tandem repeats in a population of sequenced individuals to assess polymorphism and association with disease resistance phenotypes.
Materials and Reagents:
- Sequencing Data: Whole-genome short-read sequencing data (Illumina) from multiple individuals, in FASTQ format. A minimum of 30x coverage is recommended.
- Reference Genome: The same genome assembly used for read alignment.
- Software Tools:
- Benchmark Data: GIAB HG002 "truth set" for validating STR calls in your pipeline [40].
Procedure:
- Read Alignment and Processing:
- Align sequencing reads to the reference genome using a splice-aware aligner like Hisat2 [25].
- Sort and mark duplicates in the resulting BAM files using tools like SAMtools or Picard.
- STR Genotyping:
- Run
GangSTRusing the aligned BAM files and a reference catalog of STR positions. Command example:GangSTR --bam sample.bam --ref genome.fa --regions str_catalog.bed --out sample_gangstr. - For expansion detection, run
STRling:strling call -f genome.fa sample.bam sample_strling.
- Run
- Variant Filtering and Annotation:
- Filter the raw VCF outputs from the genotyping tools for quality (e.g., read depth, allele balance).
- Annotate the filtered STR variants, overlaying them with the annotated NBS-LRR gene regions from Protocol Part 1.
- Validation (Optional but Recommended):
- Use the GIAB HG002 benchmark dataset to calculate the precision and recall of your genotyping pipeline for STRs [40].
Diagram 2: Tandem Duplication Drives NBS-LRR Gene Family Evolution. This diagram conceptualizes how tandem repeats and duplication events contribute to the evolution of new resistance specificities in plants.
Table 3: Research Reagent Solutions for Tandem Repeat Analysis
| Reagent / Resource | Function / Purpose | Example / Source |
|---|---|---|
| Curated TR Catalogs | Provides benchmark set of TR regions for tool validation and targeted analysis. | GIAB HG002 Truth Set V2.0 [40] |
| Pfam Profile HMMs | Identifies conserved protein domains (e.g., NBS) in protein sequences. | PF00931 (NB-ARC), PF00560 (LRR) [25] |
| Reference Genomes | High-quality assembly essential for accurate read mapping & variant calling. | Nicotiana tabacum (Zenodo: 8256256) [25] |
| Python Ecosystem | Environment for running & integrating tools like pytrf into custom pipelines. | Jupyter Notebooks, Biopython [36] |
The landscape of tandem repeat detection has matured significantly, offering researchers a suite of sophisticated tools for diverse applications. For masking decayed repeats in genomic sequence, HMM-based tools like ULTRA provide superior sensitivity and low false discovery rates. For genotyping STRs from population sequencing data, GangSTR and ExpansionHunter offer robust solutions, while EHdn and STRling excel at discovering novel expansions. The integration of these tools into a structured protocol, as outlined, empowers researchers to systematically investigate the role of tandem repeats in the evolution and function of critical gene families like the NBS-LRR genes, thereby accelerating research in plant immunity and molecular breeding.
Application Notes
Quantitative Comparison of Duplication Mechanisms in Plant Genomes
Table 1: Genomic Distribution of NBS-Encoding Genes Across Plant Species
| Plant Species | Total NBS Genes | Tandem Duplicates | Segmental Duplicates | Whole Genome Events | Key Findings |
|---|---|---|---|---|---|
| Soybean | Not specified | Predominant mechanism | Present | Two rounds | NBS genes evolve 1.5× faster (synonymous) and 2.3× faster (nonsynonymous) than flanking non-NBS genes [41] |
| Brassica rapa | 92 | Major expansion force | Present from WGT | Whole genome triplication | Tandem duplication generated Brassica lineage-specific genes after WGT [42] |
| Garden Asparagus | 49 loci | Recent expansion | Present | Not specified | ~50% of genes in clusters; recent duplications dominated expansion [32] |
| Nicotiana tabacum | 603 | Present | Present from WGD | Allotetraploidization | 76.62% of NBS members traceable to parental genomes; WGD significant contributor [25] |
| Arabidopsis thaliana | 167 | Varies by family | Present from polyploidy | Two ancient rounds | Family-specific patterns; some families dominated by tandem, others by segmental duplication [27] |
Evolutionary Dynamics and Selection Patterns
Table 2: Evolutionary Rates and Selection Pressures in NBS Gene Families
| Analysis Type | TNL Subfamily | CNL Subfamily | Non-NBS Genes | Implications |
|---|---|---|---|---|
| Evolutionary rate | Higher nucleotide substitution rate [41] | Lower nucleotide substitution rate [41] | Baseline rate | Different evolutionary patterns for pathogen recognition [41] |
| Selection pressure | Significant positive selection in tandem families [41] | Significant positive selection in tandem families [41] | Not applicable | Combined effects of diversifying selection and sequence exchanges [41] |
| Post-duplication fate | Faster expansion in Brassica [42] | Slower expansion in Brassica [42] | Not applicable | Differential selective constraints after ancient duplication [42] |
| Functional retention | Stress resistance adaptation [43] | Stress resistance adaptation [43] | Various functions | TD retains genes involved in environmental adaptation [43] |
Experimental Protocols
Protocol 1: Genome-Wide Identification and Classification of NBS-Encoding Genes
Materials and Reagents
- High-quality genome assembly and annotation files
- HMMER software (v3.0 or higher)
- Pfam domain profiles (PF00931 for NBS, PF01582 for TIR)
- NCBI Conserved Domain Database (CDD) access
- BLAST+ suite
- Multiple sequence alignment tool (MUSCLE, CLUSTALW)
- Phylogenetic analysis software (MEGA, RAxML)
Experimental Workflow
Step 1: Initial Gene Identification
- Perform HMMER search against the proteome using PF00931 (NB-ARC domain) with "trusted cutoff" threshold [44]
- Validate candidates using NCBI CDD with E-value cutoff of 0.01 [32]
- Iterate search using identified sequences as queries until no new candidates emerge [32]
Step 2: Domain Architecture Classification
- Identify N-terminal domains using Pfam (TIR: PF01582) and SMART databases [32] [44]
- Confirm coiled-coil (CC) domains using COILS program (threshold 0.9) or PAIRCOIL2 (P-score 0.025) [32] [44]
- Classify genes into structural groups (TNL, CNL, TN, CN, NL, N) [25]
Step 3: Cluster Definition and Mapping
- Define gene clusters as containing ≥2 genes within <200 kb distance, with ≤8 non-NBS genes between neighbors [32]
- Map chromosomal distribution and identify cluster hotspots [32]
Protocol 2: Differentiating Duplication Mechanisms and Dating Events
Materials and Reagents
- MCScanX software package
- BLASTP for self-comparison
- KaKs_Calculator 2.0
- Custom scripts for synteny analysis
- Circos or Circoletto for visualization [32]
Experimental Workflow
Step 1: Tandem Duplication Identification
- Perform all-against-all BLASTP of predicted CDSs [32]
- Define gene families: alignment coverage >70% of longer gene, identity >70% [32]
- Identify tandem genes as closely related family members clustered on chromosomes [32]
Step 2: Segmental Duplication Detection
- Use MCScanX with default parameters for synteny analysis [25]
- Compare 30-gene regions (15 flanking genes each side) between genomic segments [32]
- Define segmentally duplicated regions: >5 gene pairs with syntenic relationships (E-value < 1×10⁻¹⁰) [32]
Step 3: Whole Genome Triplication Analysis
- Identify triplicated syntenic blocks from ancestral WGT event [44]
- Analyze gene retention and loss patterns across triplicated regions [42]
- Calculate Ks values to date duplication events [25]
Step 4: Evolutionary Rate Calculations
- Extract orthologous gene pairs from synteny analysis [25]
- Calculate Ka (nonsynonymous) and Ks (synonymous) substitution rates using KaKs_Calculator 2.0 with Nei-Gojobori model [25]
- Identify selection pressures: Ka/Ks >1 positive selection, <1 purifying selection [41]
The Scientist's Toolkit: Research Reagent Solutions
Table 3: Essential Resources for NBS Gene Family Analysis
| Resource Type | Specific Tool/Database | Function in Analysis | Key Features |
|---|---|---|---|
| Domain Databases | Pfam (PF00931, PF01582) | Identifying NBS and TIR domains | Curated HMM profiles [32] [44] |
| NCBI Conserved Domain Database | Domain verification and classification | Comprehensive domain annotation [32] [25] | |
| Software Tools | HMMER v3.1b2+ | Hidden Markov Model searches | Trusted cutoff thresholds [25] [44] |
| MCScanX | Synteny and duplication analysis | Genome evolution visualization [25] | |
| KaKs_Calculator 2.0 | Evolutionary rate calculation | Multiple substitution models [25] | |
| MEME Suite | Motif discovery and analysis | E-value < 1×10⁻¹⁰ [32] | |
| Genomic Resources | BRAD Database | Brassica genomics | Comparative genomics tools [44] |
| TAIR10 | Arabidopsis genomics | Reference genome and annotation [44] | |
| Experimental Validation | RNA-Seq data (NCBI SRA) | Expression profiling | Tissue-specific expression patterns [32] [25] |
Interpretation Guidelines
Distinguishing Duplication Mechanisms
True tandem duplication is indicated by closely related genes clustered within 200 kb with no more than 8 intervening genes [32]. Segmental duplication shows larger-scale syntenic blocks with multiple conserved gene pairs [32] [27]. Whole genome triplication manifests as three homologous regions with differential gene loss, particularly evident in Brassica species [42] [44].
Evolutionary Interpretation
Recent tandem duplications often show signatures of positive selection (Ka/Ks >1) and sequence exchanges, indicating rapid evolution for pathogen recognition [41]. Segmental duplicates from ancient polyploidy typically show stronger purifying selection (Ka/Ks <1) with conserved functions [25]. The "birth-and-death" evolution model is supported by frequent tandem duplication and gene loss, especially in pathogen-response genes [45] [27].
Technical Considerations
When analyzing allopolyploids like Nicotiana tabacum, trace NBS genes to parental genomes (N. sylvestris and N. tomentosiformis) to distinguish pre- and post-polyploidization duplicates [25]. For species with known WGT events (Brassica), compare gene retention rates between NBS and non-NBS genes to identify selective pressures [42] [44].
In plant genomes, NBS-LRR genes constitute one of the largest and most critical gene families for disease resistance, often evolving through tandem duplication events [46]. These duplications create complex clusters of paralogs that are a primary source of novel disease resistance specificities [47]. However, understanding how these structural variations translate to functional expression differences requires integrating multiple omics datasets. This Application Note provides a detailed protocol for systematically linking tandem duplication events in NBS gene families to expression patterns using RNA-Seq and promoter cis-element analysis, framed within a broader research context on duplication dynamics in plant immunity genes.
Background and Significance
Tandem Duplication in NBS-LRR Gene Families
The NBS-LRR gene family exhibits remarkable diversity in copy number across plant species, ranging from 73 members in Akebia trifoliata to 2,151 in Triticum aestivum (wheat) [25]. This expansion occurs primarily through gene duplication mechanisms, with tandem duplication being particularly significant for clustering resistance genes in the genome [46]. Studies across numerous species including radish, soybean, and tobacco have consistently demonstrated that NBS-LRR genes are frequently arranged in tandemly duplicated arrays [47] [46] [8]. These genomic configurations are highly conducive to unequal recombination and chromosomal rearrangements that generate new, chimeric paralogs, representing a major source of novel disease resistance phenotypes [47].
Recent research on the barley genome has revealed that natural selection has specifically favored lineages where arms-race genes (particularly pathogen defense genes like NBS-LRRs) are physically associated with duplication-prone genomic regions [45]. This "cooperation" between genes and duplication-inducing elements enables more efficient generation of genetic diversity, which is especially beneficial for host-pathogen evolutionary arms races [45]. The functional implications of these duplication events are profound, as demonstrated in soybean where CRISPR/Cas9-induced tandem duplications led to the development of novel disease resistance gene paralogs with intact open reading frames that may confer new resistance specificities [47].
Regulatory Consequences of Duplication
Gene duplication events can significantly alter gene expression through multiple mechanisms. Tandem duplications can amplify regulatory elements along with coding sequences, potentially leading to dosage effects on expression levels. Additionally, duplication can create novel cis-regulatory landscapes through the rearrangement of promoter elements and enhancers. In plant genomes, cis-regulatory elements (CREs) including promoters, enhancers, and other regulatory sequences fine-tune the precise timing, location, and level of gene transcription [48]. When duplication events occur, these regulatory elements may be copied, disrupted, or recombined, creating novel expression patterns that natural selection can act upon.
The integration of functional genomics approaches - including chromatin accessibility assays, nascent transcription profiling, and sequence conservation analysis - has proven powerful for characterizing these regulatory elements in plant genomes [48]. In rice, for instance, integrative analyses have revealed distinct classes of regulatory targets marked by conserved noncoding sequences, intergenic bi-directional transcripts, and regions of open chromatin [48]. Understanding how duplication events impact these regulatory architectures is crucial for linking structural variation to expression divergence in NBS gene families.
Application Notes: Experimental Design and Workflow
Key Research Reagents and Solutions
Table 1: Essential Research Reagents for Duplication-Expression Analysis
| Reagent Category | Specific Examples | Application Note |
|---|---|---|
| Genome Assembly | Barley MorexV3 [45], Soybean W82 [47], Nicotiana genomes [8] | High-quality, contiguous assemblies are crucial for resolving repetitive NBS-LRR clusters |
| NBS-LRR Identification | HMMER with PF00931 (NB-ARC) [46] [8], NCBI CDD for TIR/CC/LRR domains [8] | Ensures comprehensive and consistent annotation across species |
| Duplication Detection | MCScanX [46] [8], BLASTP for synteny [8] | Identifies both tandem and segmental duplications; MCScanX specifically detects collinear blocks |
| CRISPR Tools | dCas9-KRAB (Addgene: 85969, 46911) [49], sgRNA design tools | Enables targeted perturbation of duplicated clusters for functional validation |
| Expression Validation | RNA-Seq alignment (HISAT2 [8]), quantification (Cufflinks [8]), ddPCR [47] | ddPCR provides precise copy number validation; RNA-Seq gives comprehensive expression profiles |
Integrated Workflow for Linking Duplication to Expression
The following diagram illustrates the comprehensive workflow for integrating genomic, transcriptomic, and regulatory element data to establish functional links between duplication events and expression patterns in NBS gene families:
Quantitative Data Framework
Table 2: Expected NBS-LRR Family Statistics Across Species (Based on Published Studies)
| Plant Species | Total NBS Genes | Tandem Duplications | Segmental Duplications | Key References |
|---|---|---|---|---|
| Nicotiana tabacum (Tobacco) | 603 | 48 clusters detected | Contribution from whole-genome duplication [8] | [8] |
| Raphanus sativus (Radish) | 225 | 15 tandem events | 20 segmental events [46] | [46] |
| Glycine max (Soybean) | 314 (putative) | Rpp1L (4-copy) and Rps1 (22-copy) clusters [47] | Not specified | [47] |
| Arabidopsis thaliana | 164 | Not specified | Not specified | [46] |
| Brassica oleracea | 244 | Not specified | Not specified | [46] |
Detailed Protocols
Protocol 1: Identification of Tandemly Duplicated NBS-LRR Genes
Objective: To systematically identify and characterize tandemly duplicated NBS-LRR gene clusters from plant genome assemblies.
Materials and Reagents:
- High-quality genome assembly (e.g., Barley MorexV3 [45], Nicotiana genomes [8])
- HMMER software (v3.1b2 or higher) [46] [8]
- PFAM profile PF00931 (NB-ARC domain) [46] [8]
- MCScanX software [46] [8]
- NCBI Conserved Domain Database (CDD) [8]
- Custom Perl/Python scripts for parsing results
Methodology:
NBS-LRR Identification:
- Perform HMMER search against the proteome using PF00931 (NB-ARC domain) with default parameters and e-value threshold of 1e-5 [46].
- Verify identified candidates using NCBI CDD to confirm presence of characteristic domains (NBS, TIR, CC, LRR) [8].
- Classify genes into subfamilies (TNL, CNL, RNL) based on domain architecture.
Duplication Detection:
- Perform all-vs-all BLASTP of the identified NBS-LRR proteins with e-value cutoff of 1e-10 [8].
- Process BLAST results using MCScanX with default parameters to identify collinear blocks [46].
- Specifically flag tandem duplication events defined as paralogous genes located within 100kb of each other with ≥70% sequence similarity.
Cluster Characterization:
- Calculate Ka/Ks ratios for each gene pair using KaKs_Calculator 2.0 with Nei-Gojobori method to infer selection pressure [8].
- Annotate clusters with genomic coordinates, gene orientations, and intergenic distances.
- Cross-reference with known resistance gene annotations where available.
Troubleshooting Note: Fragmented genome assemblies may underestimate true cluster sizes. Consider using optical mapping or Hi-C data to improve contiguity in repetitive regions.
Protocol 2: RNA-Seq Analysis of Duplication-Induced Expression Patterns
Objective: To quantify expression differences between duplicated NBS-LRR genes and identify potential neofunctionalization.
Materials and Reagents:
- RNA extraction kit (e.g., NucleoSpin RNA)
- Strand-specific RNA-Seq library preparation kit
- Illumina sequencing platform
- HISAT2 aligner [8]
- Cufflinks suite (v2.2.1) [8] or modern alternatives like StringTie
- Trimmomatic for quality control [8]
Methodology:
Experimental Design:
- Include multiple biological replicates (≥3) for each condition/tissue.
- Consider time-course experiments post-pathogen inoculation to capture dynamic responses.
- Include both resistant and susceptible genotypes when possible.
Library Preparation and Sequencing:
- Extract total RNA from tissues of interest using standard protocols.
- Prepare stranded RNA-Seq libraries to accurately assign reads to sense/antisense strands.
- Sequence on Illumina platform to achieve minimum 20 million reads per sample.
Differential Expression Analysis:
- Quality control of raw reads using Trimmomatic with parameters: LEADING:20, TRAILING:20, SLIDINGWINDOW:4:20, MINLEN:36 [8].
- Align cleaned reads to reference genome using HISAT2 with --rna-strandness RF parameter [8].
- Quantify transcript abundance using Cufflinks with FPKM normalization [8].
- Identify differentially expressed genes using Cuffdiff with FDR correction (q-value < 0.05) [8].
Expression Divergence Assessment:
- Compare expression profiles of tandem duplicates across tissues/conditions.
- Calculate expression correlation coefficients between duplicate pairs.
- Identify cases of expression neofunctionalization where duplicates show divergent patterns.
Troubleshooting Note: High sequence similarity between duplicates may cause cross-mapping of reads. Consider counting reads at polymorphic positions only or using expectation-maximization approaches to properly assign multi-mapping reads.
Protocol 3: Promoter Cis-Element Analysis of Duplicated NBS-LRR Genes
Objective: To identify conserved and divergent regulatory elements in promoters of tandemly duplicated NBS-LRR genes.
Materials and Reagents:
- Genomic sequences of target species
- MEME Suite (v5.0 or higher) for motif discovery
- HOMER software for motif analysis
- Plant cis-element databases (PlantPAN, PlantCARE)
- Custom scripts for promoter extraction and analysis
Methodology:
Promoter Sequence Extraction:
- Extract 1-3kb sequences upstream of transcription start sites for all NBS-LRR genes.
- Include 5' UTR sequences when annotated.
- Group promoters by duplication status and phylogenetic relationship.
De Novo Motif Discovery:
- Use MEME with parameters: -mod anr -nmotifs 20 -minw 6 -maxw 30 [48].
- Compare motif enrichment in duplicated vs. singleton NBS-LRR promoters.
- Perform motif scanning with FIMO to identify instances of discovered motifs.
Known Motif Analysis:
- Use HOMER's findMotifs.pl with parameters: -size 200 -len 8,10,12.
- Cross-reference identified motifs with plant cis-element databases.
- Test specifically for defense-related elements (e.g., W-boxes, GCC-boxes).
Conservation and Divergence Assessment:
- Align promoter sequences of tandem duplicates using MUSCLE or MAFFT.
- Identify rapidly evolving regions and conserved blocks.
- Correlate promoter divergence with expression divergence.
Troubleshooting Note: Some regulatory elements may be located at greater distances upstream, downstream, or in introns. Consider including these regions if initial promoter analysis yields limited insights.
Protocol 4: Integrative Analysis and Validation
Objective: To functionally link duplication events, cis-element variation, and expression differences.
Materials and Reagents:
- CRISPR/Cas9 system for genome editing [47]
- dCas9-KRAB constructs for CRISPRi (Addgene: 85969) [49]
- Transgenic plant transformation materials
- Pathogen isolates for phenotypic assays
- ddPCR reagents for copy number validation [47]
Methodology:
Multi-Omics Data Integration:
- Create unified database with genomic, transcriptomic, and regulatory data.
- Perform correlation analyses between duplication patterns, cis-element content, and expression profiles.
- Identify candidate cis-elements potentially responsible for expression differences.
CRISPR-Based Validation:
- Design sgRNAs targeting candidate regulatory elements in duplicated NBS-LRR genes [47].
- For CRISPRi experiments, target dCas9-KRAB to regions between -50 and +300 bp relative to TSS for maximal repression efficiency [49].
- Transform constructs into appropriate plant systems and regenerate transgenic lines.
Phenotypic Assessment:
- Challenge edited lines with relevant pathogens.
- Quantify disease resistance using standardized scales.
- Measure expression changes of targeted genes using qRT-PCR.
Functional Confirmation:
- Test candidate cis-elements using reporter assays (e.g., luciferase, GUS).
- Validate protein-DNA interactions for prioritized motifs using EMSA or ChIP.
- Establish causal relationships between specific cis-element variants and expression differences.
Troubleshooting Note: CRISPR editing efficiency can vary significantly between species and target sites. Include multiple independent transgenic lines for each construct to control for position effects and ensure reproducible results.
Anticipated Results and Interpretation
Expected Findings
The integrated approach outlined in these protocols is expected to reveal:
- Significant expression divergence between recently duplicated NBS-LRR genes, with older duplicates showing greater divergence.
- Correlation between promoter cis-element variation and expression differences among duplicates.
- Enrichment of specific defense-related motifs (e.g., W-boxes, GCC-boxes) in duplicated NBS-LRR promoters compared to random gene sets.
- Identification of candidate cis-elements responsible for neofunctionalization events following duplication.
Data Interpretation Framework
When interpreting results, consider the following evolutionary scenarios:
- Conserved function: Duplicates with similar expression patterns and conserved promoter architectures likely maintain redundant functions.
- Subfunctionalization: Duplicates with complementary expression patterns and partitioned cis-element repertoires may have undergone division of ancestral functions.
- Neofunctionalization: Duplicates with novel expression patterns and gained cis-elements may have evolved new functions.
The following diagram illustrates the decision framework for classifying duplication outcomes based on integrated omics data:
This detailed protocol provides a comprehensive framework for investigating the functional consequences of tandem duplication events in NBS-LRR gene families. By integrating genomic, transcriptomic, and regulatory data, researchers can move beyond simple cataloging of duplication events to understanding their functional significance in plant immunity. The approaches outlined here are particularly valuable for crop improvement programs seeking to harness natural genetic variation or engineer novel resistance specificities through targeted genome editing [45] [47]. As demonstrated in recent studies, this integrated understanding of duplication-expression relationships can ultimately contribute to developing more durable disease resistance in agricultural systems.
Navigating Analytical Challenges in Tandem Duplication Studies
Accurate genome annotation is fundamental for meaningful genetic analysis, yet researchers face significant challenges when working with complex gene families characterized by tandem duplications, pseudogenes, and sequence divergence. These difficulties are particularly pronounced in NBS-LRR gene families, which are crucial for plant disease resistance and have evolved through diverse duplication mechanisms [50]. The presence of defunct pseudogenes with high sequence similarity to functional genes, combined with ancient repeats that have accumulated mutations over evolutionary time, creates substantial barriers to precise gene model prediction and functional characterization [51]. This protocol addresses these challenges within the broader context of tandem duplication analysis in NBS gene families research, providing structured methodologies to distinguish functional genes from pseudogenes, account for sequence divergence in ancient repeats, and generate biologically meaningful annotations that support downstream evolutionary and functional studies.
Key Challenges in Annotating Complex Gene Families
Pseudogenes and Their Impact on Annotation
Pseudogenes represent decaying genomic sequences that have lost their protein-coding capacity but retain significant homology to functional genes, creating substantial annotation challenges. In plant genomes, pseudogenes are predominantly non-processed (duplicated) types rather than processed (retroposed) types, with fragmented and single-exon pseudogenes being the most abundant categories across species [51]. These pseudogenic sequences often arise from the same duplication mechanisms that generate functional diversity in gene families, including whole genome duplication, tandem duplication, and transposition events [51].
Table 1: Classification and Features of Pseudogenes in Plant Genomes
| Pseudogene Type | Formation Mechanism | Structural Characteristics | Relative Abundance |
|---|---|---|---|
| Non-processed | Genome/chromosomal duplication | Retains exon-intron structure of ancestral gene | ~10x more abundant than processed in most plants |
| Processed | Reverse transcription of mRNA | Lacks introns, has poly-A tail, flanking direct repeats | Minority (2x less than non-processed in V. vinifera) |
| Fragmented | Partial duplication or decay | Incomplete gene model, missing exons | Most abundant type across species |
| Single-exon | From single-exon parents or extreme decay | Single exon structure | Highly abundant |
The genomic distribution of pseudogenes reveals important patterns that complicate annotation. Pseudogenes demonstrate higher tendencies toward genomic dispersion compared to functional genes, with dispersed pseudogenes typically being more fragmented and exhibiting higher sequence divergence at flanking regions [51]. Those derived from tandem and proximal duplications appear in excess compared to functional loci, likely reflecting the high evolutionary rate associated with these duplication mechanisms in plant genomes [51].
Sequence Divergence in Ancient Repeats
Ancient repeats, including evolutionarily old tandem duplications, present distinct annotation challenges due to accumulated mutations that obscure their origins and functions. These sequences have typically undergone substantial sequence divergence through nucleotide substitutions, indels, and structural rearrangements, making accurate identification and classification difficult [15] [51].
In NBS-LRR gene families, different evolutionary patterns have been observed between TIR-NBS-LRR (TNL) and non-TIR-NBS-LRR (non-TNL) genes, with TNLs generally showing greater Ks values and Ka/Ks ratios than non-TNLs, suggesting different evolutionary trajectories and selection pressures [50]. This divergence complicates gene model prediction and functional inference, particularly when ancient repeats have undergone subfunctionalization or neofunctionalization while maintaining structural similarity to their progenitor sequences.
Experimental Protocols and Workflows
Comprehensive Pseudogene Identification and Classification
Principle: Systematically identify and classify pseudogenes based on sequence homology, structural features, and disablements relative to functional parental loci.
Materials:
- High-quality genome assembly
- Annotated gene set for the target organism
- Related genomic resources (UniProt, Pfam, RepBase)
Procedure:
Initial Homology Search
- Use translated coding exons of each functional locus to query the hard-masked genomic sequences using tBlastN [51]
- Merge hits not overlapping coding sequence coordinates that match consecutive exons of query loci
- When genomic regions match overlapping pseudogene models, retain only the model with highest homology to functional genes
Pseudogene Classification
- Non-processed pseudogenes: Predict when introns occur at all expected positions based on parental gene model
- Processed pseudogenes: Classify when no introns are predicted though expected based on parental gene model
- Ambiguous pseudogenes: Designate those showing features of both duplicated and processed types
- Fragmented/single-exon pseudogenes: Identify when alignments don't cover intron positions
Genomic Context Analysis
- Map pseudogenes to intergenic, intronic, and untranslated regions
- Analyze distribution patterns across genomic compartments
- Determine orientation relative to functional genes
Duplication Mechanism Inference
- Interrogate genomic intra- and inter-species collinearity maps
- Classify duplication modes using priority: WGD > tandem > proximal > transposed > dispersed
- Compare duplication mode distributions between pseudo- and functional gene complements
Tandem Duplication Analysis in NBS-LRR Gene Families
Principle: Identify and characterize tandemly duplicated genes in disease resistance gene families to understand their expansion patterns and evolutionary history.
Materials:
- Chromosome-scale genome assemblies
- Annotated NBS-LRR gene set
- Transcriptome data (RNA-seq) for expression validation
Procedure:
Gene Family Identification
- Compile complete set of NBS-LRR genes using hidden Markov models (HMMs) of characteristic domains
- Classify into TNL and non-TNL subtypes based on N-terminal domains
- Annotate gene structures, including exon-intron organization
Tandem Array Detection
- Identify TDGs as paralogous genes located within 10 consecutive genes in the same genomic neighborhood [14]
- Define gene clusters based on physical proximity and sequence similarity
- Compare genomic distributions across genotypes or species
Evolutionary Analysis
- Calculate synonymous (Ks) and nonsynonymous (Ka) substitution rates
- Determine Ka/Ks ratios to infer selection pressures
- Identify lineage-specific expansions through phylogenetic analysis
Functional Divergence Assessment
- Analyze expression patterns across tissues and conditions
- Examine promoter sequence divergence
- Assess protein sequence evolution and functional specialization
Table 2: NBS-LRR Gene Characteristics in Five Rosaceae Species
| Species | Total NBS-LRR Genes | TNL Genes (%) | Non-TNL Genes (%) | Mean Exon Number | Multi-Gene Families (%) |
|---|---|---|---|---|---|
| Fragaria vesca (strawberry) | 144 | 15.97 | 84.03 | 4.86 | 32.64 |
| Malus domestica (apple) | 748 | 29.28 | 70.72 | 5.20 | 68.98 |
| Pyrus bretschneideri (pear) | 469 | 47.12 | 52.88 | 4.81 | 63.33 |
| Prunus persica (peach) | 354 | 36.16 | 63.84 | 4.18 | 65.82 |
| Prunus mume (mei) | 352 | 43.47 | 56.53 | 4.52 | ~40.05 |
Integrated Annotation Workflow
The following workflow diagram illustrates the comprehensive approach to addressing annotation challenges in complex gene families:
Annotation Workflow for Complex Gene Families: This comprehensive pipeline integrates pseudogene identification, tandem duplication analysis, and manual curation to produce high-quality annotations for complex gene families with extensive duplication histories.
The Scientist's Toolkit: Research Reagent Solutions
Table 3: Essential Tools and Resources for Annotation of Complex Gene Families
| Tool/Resource | Type | Function | Application Context |
|---|---|---|---|
| MAKER2 [52] | Annotation Pipeline | Integrates multiple evidence sources for gene prediction | Genome annotation projects with limited experimental data |
| EvidenceModeler [52] | Evidence Integration | Combines ab initio and evidence-based gene predictions | Weighting and combining different annotation evidence types |
| AUGUSTUS [53] | Ab Initio Predictor | Predicts gene structures using computational models | Initial gene discovery, especially in novel genomes |
| BRAKER [52] | Annotation Pipeline | Uses RNA-seq data for automated gene prediction | Evidence-based annotation when transcriptome data available |
| OrthoParaMap [15] | Evolutionary Analysis | Maps gene duplications to phylogenetic trees | Determining segmental vs. tandem duplication origins |
| BUSCO [52] | Quality Assessment | Assesses annotation completeness using universal genes | Benchmarking annotation quality across projects |
| Apollo [52] | Manual Curation | Web-based collaborative genome annotation | Community annotation and expert curation |
| DiagHunter [15] | Segmental Duplication Detection | Identifies large-scale duplication blocks | Analyzing whole genome duplication events |
Troubleshooting and Quality Control
Common Annotation Problems and Solutions
Problem: High proportion of fragmented genes in annotation.
- Solution: Integrate transcriptomic evidence (RNA-seq) using tools like StringTie or PASA to improve gene model completeness [52].
Problem: Difficulty distinguishing functional genes from pseudogenes.
- Solution: Implement disablement analysis looking for premature stop codons, frameshifts, and disrupted splicing signals while considering transcriptional evidence [51].
Problem: Inconsistent annotation of tandemly duplicated genes.
- Solution: Use standardized criteria for tandem array definition (genes within 10 consecutive loci) and apply consistent naming conventions [14].
Problem: Lineage-specific genes incorrectly annotated as pseudogenes.
- Solution: Employ cross-species comparisons and consider expression evidence before classifying sequences as pseudogenes [50].
Quality Assessment Metrics
- Completeness: Assess using BUSCO scores against conserved single-copy ortholog sets [52]
- Accuracy: Evaluate by comparison with manually curated gene sets (e.g., HAVANA annotations) [53]
- Consistency: Check annotation against orthogonal evidence (transcriptome, homology, domain content)
- Evolutionary Plausibility: Verify expected patterns of sequence divergence and selection pressures
Accurate annotation of complex gene families with abundant pseudogenes and ancient repeats requires integrated approaches that combine computational prediction, evolutionary analysis, and experimental validation. The protocols outlined here provide a structured framework for addressing these challenges, with particular emphasis on NBS-LRR gene families and their characteristic tandem duplication patterns. By implementing these methodologies, researchers can generate biologically meaningful annotations that support downstream functional and evolutionary studies, ultimately enhancing our understanding of genome evolution and gene family dynamics in plants and other organisms.
Tandem repeats (TRs) are ubiquitous sequences within genomes, characterized by patterns of nucleotides repeated consecutively and adjacently [54]. These sequences are fundamental to genetic diversity, gene regulation, and genome evolution. In the specific context of newborn screening (NBS) gene families research, the accurate identification of tandem duplications is critical, as variations in these regions are implicated in a significant number of inherited metabolic diseases (IMDs) and other genetic disorders [55] [56]. Highly divergent tandem repeats, which have accumulated mutations over evolutionary timescales, present a particular challenge for detection and analysis [57]. Their identification is essential for a comprehensive understanding of the full spectrum of genetic variation underlying human disease.
This Application Note addresses the pressing need for advanced strategies to enhance the detection sensitivity of these elusive genomic elements. By integrating state-of-the-art algorithms, leveraging long-read sequencing technologies, and employing sophisticated bioinformatic workflows, researchers can overcome traditional limitations. The protocols detailed herein are designed to empower investigations into the role of tandem duplications within NBS gene families, ultimately contributing to improved diagnostic yields and a deeper understanding of disease etiology.
Current Challenges in Divergent Tandem Repeat Detection
The detection of highly divergent tandem repeats is fraught with technical difficulties. Short-read sequencing technologies, while high-throughput and cost-effective, are notoriously inadequate for resolving repetitive regions due to their limited read length, which leads to mapping ambiguities and an inability to span large repeat expansions [58]. This often results in a significant false discovery rate and low sensitivity for tandem repeat variations [58].
Even with advanced tools, the accurate identification of ancient repeats is challenging because accumulated mutations make the repeating pattern almost imperceptible at the sequence level [57]. Different detection programs can yield markedly different results for the same input sequence, creating uncertainty in analysis and interpretation [57]. Furthermore, sequencing errors inherent in long-read technologies, though they provide the necessary length, can obscure the true repeat structure, especially for repeats with low copy numbers or long unit lengths [59].
Tool Comparison and Performance Metrics
Selecting the appropriate computational tool is a critical first step in any tandem repeat analysis pipeline. The performance of these tools varies significantly based on the nature of the repeat (e.g., unit length, copy number, divergence) and the sequencing technology used. The table below summarizes key features and performance characteristics of several state-of-the-art tools.
Table 1: Comparison of Tandem Repeat Detection Tools
| Tool Name | Key Algorithm | Optimal Use Case | Strengths | Limitations |
|---|---|---|---|---|
| DetectRepeats [57] | Seed-and-extend with empirical log-odds scoring | Identifying highly divergent repeats in both nucleotide and protein sequences; part of the DECIPHER R/Bioconductor package. | High sensitivity for ancient repeats; relatively few false positives; incorporates structural repeat information. | Requires training on empirical data for optimal performance. |
| EquiRep [59] | Equivalent class construction via self-alignment and graph-based cycle detection | Accurate detection from error-prone long reads; robust to sequencing errors, long units, and low copy numbers. | Superior performance on long units and low frequencies; robust to sequencing errors. | Preprint status (as of Nov 2024); method is computationally complex. |
| tandem-genotypes [56] | Careful alignment of long reads allowing for rearrangements | Robust detection of pathogenic repeat expansions from PacBio and nanopore reads, even at low coverage. | Robust to systematic errors and inexact repeats; works with low-coverage WGS data. | Designed primarily for detecting expansions relative to a reference. |
| Wide Tool (PMC11656428) [54] | k-mer screening and clustering for de novo identification | De novo detection of diverse repeat types (direct, inverted, microsatellites, HORs) in genomic sequences. | Versatile; detects a wide range of repeat structures without prior knowledge; rapid analysis. | False clustering can occur in large, complex genomes. |
Detailed Experimental Protocols
Protocol 1: Detecting Highly Divergent Repeats with DetectRepeats
Application: This protocol is designed for the sensitive identification of ancient tandem repeats that have low sequence similarity, using the DetectRepeats algorithm within the R/DECIPHER environment [57]. It is particularly useful for evolutionary studies and comprehensive genome annotation.
Reagents and Equipment:
- Hardware: Standard computer workstation
- Software: R environment, DECIPHER package from Bioconductor
- Input Data: FASTA file containing genomic sequences (nucleotide or protein)
Procedure:
- Installation and Setup: Install the DECIPHER package in R using the Bioconductor manager.
Data Import: Load your target sequence(s) into the R session.
Repeat Detection: Execute the
DetectRepeatsfunction with empirical scoring enabled for maximum sensitivity.Result Interpretation: Review the output object, which contains the coordinates of detected repeats, their unit alignments, and log-odds scores. Repeats with positive scores are considered significant.
Troubleshooting Tip: If the results contain many false positives, consider adjusting the useEmpirical parameter or the underlying substitution matrix to better match the composition of your target sequences [57].
Protocol 2: Identifying Repeats in Error-Prone Long Reads with EquiRep
Application: This protocol utilizes EquiRep for the robust detection of tandem repeats directly from noisy long-read sequencing data (e.g., from Oxford Nanopore or PacBio), without requiring an assembled reference genome [59]. It is ideal for characterizing complex repeats and de novo assemblies.
Reagents and Equipment:
- Hardware: Computer with sufficient memory to handle long-read data
- Software: EquiRep tool (https://github.com/example/EquiRep)
- Input Data: Long-read sequences in FASTA/FASTQ format
Procedure:
- Software Installation: Download and compile EquiRep from its source code repository.
Run Analysis: Execute EquiRep on your long-read data file.
Output Analysis: EquiRep generates an output file detailing the consensus repeat unit and its copy number for each input read identified as containing a tandem repeat.
Troubleshooting Tip: For data with exceptionally high error rates, consider adjusting the k-mer size used in the initial seed-chaining step (-k parameter) to balance sensitivity and specificity [59].
Protocol 3: Genome-Wide Pathogenic Expansion Screening with tandem-genotypes
Application: This protocol is tailored for screening whole-genome long-read sequencing data to identify pathogenic tandem repeat expansions, such as those associated with neurological disorders, by comparing to a reference genome [56].
Reagents and Equipment:
- Hardware: High-performance computing cluster recommended for WGS data
- Software: LAST aligner, tandem-genotypes tool
- Input Data: Long-read WGS data (FASTQ), human reference genome (FASTA)
Procedure:
- Alignment: Align long reads to the reference genome using the LAST aligner, which is robust to the high error rate and can handle rearrangements.
Repeat Genotyping: Run
tandem-genotypeson the alignment output to predict copy number changes across all tandem repeats in the reference.Prioritization: Filter the results to prioritize expansions that exceed known pathogenic thresholds. The output can be sorted by predicted copy number change to highlight the most significant hits.
Troubleshooting Tip: Ensure the flanking sequences of the repeat regions are unique and correctly aligned, as this is critical for tandem-genotypes to accurately anchor and count the repeats [56].
Workflow Visualization and Decision Guide
The following diagram illustrates the logical workflow for selecting the appropriate strategy and tool based on the research objective and input data type.
The Scientist's Toolkit: Research Reagent Solutions
Table 2: Essential Materials and Tools for Tandem Repeat Analysis
| Category | Item | Function/Description |
|---|---|---|
| Sequencing Technologies | PacBio SMRT Sequencing | Provides long reads (HiFi mode offers high accuracy) capable of spanning large repeat expansions. [58] |
| Oxford Nanopore Technologies | Generates ultra-long reads for resolving massive repeat arrays and complex structural variations. [58] | |
| Bioinformatic Tools | DECIPHER R Package | A comprehensive environment for sequence analysis, containing the DetectRepeats function. [57] |
| LAST Aligner | An alignment tool specialized for error-prone long reads, used as a precursor for tandem-genotypes. [56] | |
| EquiRep | A standalone tool designed for accurate tandem repeat unit reconstruction from noisy long reads. [59] | |
| Reference Databases | PDB Database | Source of high-quality protein structures for benchmarking and empirical training of detection algorithms. [57] |
| Genomic Reference (e.g., GRCh38) | Standard reference genome for alignment-based variant detection and genotyping. [56] |
The strategic integration of advanced computational tools and modern long-read sequencing technologies is paramount for unlocking the complex landscape of highly divergent tandem repeats. The application notes and detailed protocols provided here offer a robust framework for researchers in the NBS gene families field to enhance the sensitivity and accuracy of their tandem duplication analyses. By adopting these methods, scientists are better equipped to uncover novel genetic variations, elucidate disease mechanisms, and ultimately improve the diagnostic yield for a wide range of genetic disorders.
The accurate interpretation of genetic variants in duplicated regions presents a significant challenge in genomics, particularly in the study of Nucleotide-Binding Site-Leucine Rich Repeat (NBS-LRR) gene families. These regions are characterized by sequences that are repeated multiple times throughout the genome, including tandem duplications, segmental duplications, and transposable elements [60]. When sequencing reads from these multiple copies are mapped to a reference genome, they often align to each other instead of their original genomic positions, a phenomenon known as "collapsing" [60]. This mapping error creates characteristic signatures in genomic data that can bias variant identification, including excess heterozygosity, deviations in read ratios, and increased sequencing depth [60]. For NBS gene families, which play crucial roles in plant immune defense and often exhibit extensive duplication, these technical challenges are particularly relevant as they can obscure true pathogenic variants or create false positives [61] [8].
Biological Significance of Duplications in NBS Gene Families
Evolutionary Patterns and Duplication Mechanisms
NBS gene families expand primarily through various duplication mechanisms that shape their evolutionary trajectory. Research on the ZmNBS gene family in maize has revealed subtype-specific duplication preferences: canonical CNL/CN genes predominantly originate from dispersed duplications, while N-type genes are enriched in tandem duplications [61]. Evolutionary rate analysis further shows that whole-genome duplication (WGD)-derived genes experience strong purifying selection (low Ka/Ks ratio), whereas tandem and proximal duplications (TD/PD) frequently show signs of relaxed or positive selection, indicating their potential for neofunctionalization [61].
In Nicotiana species, systematic identification of NBS genes has demonstrated that whole-genome duplication contributes significantly to family expansion, with allotetraploid N. tabacum containing approximately 603 NBS members—roughly the combined total of its parental species (N. sylvestris: 344; N. tomentosiformis: 279) [8]. This expansion creates a complex genomic landscape where distinguishing pathogenic variants becomes technically challenging yet biologically crucial.
Functional Implications of Duplication
Duplication events in NBS gene families serve as important generators of genetic diversity, particularly in host-pathogen arms races. When genes are duplicated, one copy can maintain ancestral functions while the other is free to explore novel mutations without adverse selective consequences [45]. Studies in barley have demonstrated that natural selection favors lineages where pathogen defense genes are physically associated with duplication-prone genomic regions, creating a cooperative association between arms-race genes and duplication-inducing elements [45]. This evolutionary dynamic makes accurate variant interpretation in these regions essential for understanding disease resistance mechanisms and guiding crop improvement strategies.
Detection and Filtering Methodologies for Multicopy Regions
Computational Approaches for Identifying Multicopy Regions
Table 1: Methods for Identifying Multicopy Regions in Genomic Data
| Method | Primary Signature Detected | Strengths | Limitations | Applicability to NBS Genes |
|---|---|---|---|---|
| ParaMask [60] | Excess heterozygosity combined with read-ratio deviations and depth | Flexible EM framework accounts for inbreeding; high recall (99.5% in simulations) | Requires population-level data | Broad applicability to any species, including plant NBS families |
| Read Depth Analysis [60] | Excess sequencing depth | Simple threshold-based implementation | High error rates due to overlapping distributions | Effective for large CNVs in NBS clusters |
| Heterozygosity Excess [60] | Deviation from Hardy-Weinberg proportions | High specificity | Low sensitivity, power decreases with rare SNPs | Limited for recently diverged NBS paralogs |
| Read Ratio Deviation [60] | Allele ratios centered at 0.25/0.75 instead of 0.5 | Identifies specific copy configuration | High variance at low allele frequencies | Useful for differentiating recent tandem duplications |
| Optical Genome Mapping (OGM) [62] | Direct visualization of label patterns on long DNA molecules | Can span entire duplicated segments on single molecules; resolves complex structures | Upper size limit (~550 kb) for consistent resolution | Ideal for complex NBS rearrangements within size limit |
The ParaMask method represents a significant advancement by combining multiple signatures in a unified framework. Its Expectation-Maximization approach simultaneously fits unknown levels of inbreeding, avoiding overly conservative assumptions of random mating that reduce power in inbred species [60]. The method proceeds through three steps: (1) classifying single-copy and multicopy regions from heterozygosity levels, (2) refining classification using read-ratio deviations, and (3) integrating signals with clustering of multicopy haplotypes to identify breakpoints [60]. This comprehensive approach achieved 99.5% recall in simulations with random mating and 99.4% recall with inbreeding, demonstrating robust performance across diverse population structures [60].
Experimental Validation Techniques
While computational prediction is essential for initial identification, experimental validation remains crucial for confirming complex duplications. Optical Genome Mapping (OGM) has emerged as a powerful technique for resolving complex structural variants, including interspersed duplications. In one study, OGM successfully resolved the structure of paired interspersed duplications (244/323 kb) on chromosome 13 by analyzing multiple molecules >300 kb that completely spanned the smaller duplication [62]. However, the technology has limitations—researchers noted an upper size limit of approximately 550 kb for duplications that could be consistently resolved, as larger segments (>627 kb) proved challenging to span with multiple molecules [62].
Fluorescence in situ hybridization (FISH) provides complementary validation for megabase-scale duplications, as demonstrated in a case involving duplications on chromosomes 16 (2.01 Mb) and 17 (564 kb) that were linked on short-read sequencing [62]. OGM molecules spanning the 564 kb segment revealed a translocation between chromosomes, which was subsequently confirmed by FISH, highlighting how structural resolution can uncover clinically relevant rearrangements that would otherwise be misinterpreted [62].
Interpretation Framework for Pathogenic Variants in Duplicated Regions
Specialized Classification Guidelines
Interpreting variants in duplicated regions requires extending standard variant classification guidelines to address duplication-specific challenges. The following framework adapts American College of Medical Genetics and Genomics (ACMG) criteria for duplicated regions:
Population Frequency (PM2/BA1): Apply stricter frequency thresholds in duplicated regions due to reduced constraint. Variants with population frequency >1% in control databases may represent technical artifacts from misalignment rather than true polymorphisms [60].
Computational Evidence (PP3/BP4): De-weight computational predictions for missense variants in duplicated genes, as these tools are typically trained on single-copy genes and may have reduced accuracy for rapidly evolving duplicates [61].
Functional Evidence (PS3/BS3): Require functional validation specifically in the genomic context of interest, as gene duplicates may exhibit divergent functions despite sequence similarity [8].
Segregation Evidence (PP1/BS4): Exercise caution with segregation evidence, as duplicated regions may exhibit non-Mendelian inheritance patterns due to copy number variation and reference mapping biases [60].
Contextualizing Pathogenicity in NBS Gene Families
For NBS gene families specifically, additional biological considerations inform variant interpretation:
Subfamily-Specific Constraints: Different NBS subfamilies exhibit distinct evolutionary patterns. CC-NBS-LRR (CNL) genes typically evolve under stronger purifying selection, making protein-truncating variants more likely to be pathogenic. In contrast, N-type genes with tandem duplication histories show more relaxed constraint [61].
Core vs. Adaptive Subgroups: Studies of ZmNBS genes identify "core" subgroups (e.g., ZmNBS31, ZmNBS17-19) with limited presence-absence variation versus highly variable "adaptive" subgroups (e.g., ZmNBS1-10, ZmNBS43-60) [61]. Variants in core genes are more likely to impact essential functions, while adaptive genes may tolerate more variation.
Expression Context: Consider expression patterns, as constitutively highly expressed NBS genes (like ZmNBS31) likely play fundamental roles in basal immunity, making damaging variants potentially more severe [61].
Experimental Protocols for Duplication Analysis in NBS Genes
Protocol 1: Comprehensive Identification of NBS Gene Families
This protocol adapts methodologies from recent pan-genomic studies of NBS genes [61] [8]:
Step 1: Domain Identification
- Perform HMMER searches (v3.1b2) using PFAM model PF00931 (NB-ARC domain) against the target proteome.
- Confirm TIR and LRR domains using PFAM models (PF01582, PF00560, PF07723, PF07725, PF12779, PF13306, PF13516, PF13855, PF14580, PF03382, PF01030, PF05725).
- Validate coiled-coil (CC) domains using NCBI Conserved Domain Database (CDD).
- Retain only genes containing complete domain structures confirmed by CDD.
Step 2: Phylogenetic Classification
- Perform multiple sequence alignment of NBS-LRR protein sequences using MUSCLE v3.8.31 with default parameters.
- Construct neighbor-joining phylogenetic tree with 1000 bootstrap replicates using MEGA11.
- Classify sequences into subfamilies (CN, CNL, N, NL, RN, RNL, TN, TNL) based on domain architecture and phylogenetic clustering.
Step 3: Duplication Mode Analysis
- Perform self-BLASTP against the proteome to identify paralogous relationships.
- Identify segmental duplications using MCScanX with default parameters.
- Detect tandem duplications as genes from the same family located within 100 kb with no more than one intervening gene.
- Calculate non-synonymous (Ka) and synonymous (Ks) substitution rates using KaKs_Calculator 2.0 with Nei-Gojobori model.
Protocol 2: ParaMask Implementation for Filtering Multicopy NBS Regions
This protocol details the application of ParaMask specifically for NBS gene analysis [60]:
Input Preparation
- Obtain population-level VCF file from sequencing data (minimum 20 individuals recommended).
- Ensure adequate sequencing depth (≥30X for whole genome) for accurate heterozygosity estimation.
EM-Based Classification
- Run initial Expectation-Maximization step to estimate inbreeding coefficient and classify variants based on heterozygosity excess.
- Parameters: minimum minor allele frequency 0.05, minimum quality score 30.
- This step typically classifies 41.4% of single-copy and 50.5% of duplicated SNPs correctly.
Read-Ratio Refinement
- Apply read-ratio deviation test to variants with uncertain classification from step 1.
- Thresholds: significant deviation from expected 0.5 ratio for heterozygotes (p < 0.01 after multiple testing correction).
- This step correctly classifies an additional 40.7% of SNPs in duplicated regions.
Haplotype Clustering
- Integrate proximity information to cluster multicopy SNPs into haplotypes.
- Define multicopy regions as contiguous segments containing ≥3 significant SNPs within 50 kb.
- Combine with depth information to define final multicopy regions for masking.
Table 2: Key Research Reagent Solutions for Duplication Analysis
| Category | Specific Tool/Resource | Function/Application | Considerations for NBS Genes |
|---|---|---|---|
| Software Tools | ParaMask [60] | Identifies multicopy regions in population genomic data | Flexible EM framework handles inbreeding; applicable to any species |
| MCScanX [8] | Detects segmental and tandem duplications from whole-genome data | Essential for classifying duplication modes in NBS families | |
| KaKs_Calculator [8] | Calculates Ka/Ks ratios to infer selection pressure | Critical for distinguishing purifying vs. positive selection in duplicates | |
| Domain Databases | PFAM PF00931 [8] | Hidden Markov model for NB-ARC domain identification | Foundation for comprehensive NBS gene identification |
| NCBI Conserved Domain Database [8] | Validates domain completeness and identifies CC domains | Ensures only complete NBS genes are retained for analysis | |
| Experimental Technologies | Bionano OGM [62] | Resolves complex structural variants by visualizing label patterns on long DNA molecules | Upper size limit ~550 kb for duplicated segments |
| FISH [62] | Validates megabase-scale rearrangements and translocations | Essential for resolving alternative structures of large duplications | |
| Population Databases | gnomAD-SV [63] | Provides population frequencies for structural variants | Critical for filtering common polymorphisms in duplicated regions |
| Database of Genomic Variants (DGV) [63] | Catalogs structural variants observed in control populations | Reference for distinguishing pathogenic SVs from benign duplicates |
Workflow Visualization for Variant Interpretation in Duplicated Regions
The following diagram illustrates the comprehensive workflow for interpreting variants in duplicated regions of NBS gene families:
Variant Interpretation Workflow in Duplicated NBS Regions
This workflow emphasizes the critical iterative process between computational prediction and experimental validation, particularly important for complex NBS gene families where duplication creates challenging interpretation scenarios.
Accurate interpretation of pathogenic variants in duplicated regions requires specialized methodologies that address the unique challenges of these complex genomic landscapes. For NBS gene families, understanding evolutionary patterns—including core versus adaptive subgroups, subfamily-specific duplication preferences, and varying selection pressures—provides essential context for variant classification [61]. Integrating advanced computational methods like ParaMask [60] with experimental validation using technologies such as OGM [62] creates a robust framework for distinguishing true pathogenic variants from technical artifacts. This integrated approach enables researchers to navigate the complexities of duplicated regions while leveraging their evolutionary significance in plant immunity and disease resistance.
Tandem repeats (TRs) represent one of the most prevalent features of genomic sequences, playing critical roles in genetic diversity, gene regulation, and disease pathogenesis [64] [65]. In the specific context of nucleotide-binding site (NBS) gene families, which are crucial for plant disease resistance, tandem duplications have been identified as significant drivers of gene family evolution and diversification [29]. The accurate detection of these repeats is therefore fundamental to understanding plant adaptation mechanisms and disease resistance.
However, TR prediction remains challenging due to algorithmic limitations and the inherent complexity of repeat structures. Current detectors often produce different, non-overlapping inferences, reflecting characteristics of their underlying algorithms rather than the true biological distribution of TRs [64]. This validation protocol addresses these challenges by providing a standardized framework for benchmarking TR prediction algorithms, with particular emphasis on their application in NBS gene family research.
Benchmarking Datasets and Quantitative Standards
Reference Datasets for Validation
A comprehensive benchmarking strategy requires carefully curated datasets with known TR properties. The table below summarizes key dataset types and their applications in validation workflows.
Table 1: Benchmarking Datasets for Tandem Repeat Algorithm Validation
| Dataset Type | Description | Key Features | Application in Validation |
|---|---|---|---|
| Simulated Sequences | Algorithmically generated sequences with predefined TR patterns [64] | Controlled divergence (PAM units), unit length variation, indel events | Testing sensitivity/specificity under controlled conditions |
| Platinum Pedigree | Mendelian inheritance-based variant map [66] | ~537,486 tandem repeats; high-confidence regions | Gold standard for real-world performance testing |
| Negative Set | Sequences without TRs simulated via Markov models [64] | Based on empirical k-mer frequencies from human genome | False positive rate assessment |
| NBS Gene Families | Plant resistance gene sequences with characterized tandem duplications [29] | Domain architecture patterns, orthogroup classifications | Domain-specific performance evaluation |
Performance Metrics and Statistical Framework
Robust validation requires multiple statistical measures to evaluate algorithm performance. The model-based phylogenetic classifier approach, which entails maximum-likelihood estimation of repeat divergence, has demonstrated particular utility for filtering false-positive predictions [64]. Key quantitative metrics include:
- Power detection curves across varying degrees of TR divergence (40-120 PAM units)
- Unit length sensitivity for minimal repeat units from 1-25 characters
- Copy number accuracy for repeats with 2-15 units in tandem
- False discovery rates in negative control datasets
- Algorithm concordance measured through overlapping predictions
Experimental Protocols for Benchmarking TR Prediction
Protocol 1: Statistical Validation Framework for TR Detectors
This protocol outlines the procedure for evaluating the accuracy of tandem repeat prediction algorithms using simulated sequence data.
Materials and Reagents
Table 2: Research Reagent Solutions for TR Detection Benchmarking
| Reagent/Resource | Function/Application | Specifications |
|---|---|---|
| ALF (Artificial Life Framework) | Simulates TR evolution along phylogenetic trees [64] | Implements TN93 (DNA) and LG (protein) substitution models |
| Markov Model Generator | Generates negative control sequences without TRs [64] | k-mer size ≤3; based on empirical genomic frequencies |
| PfamScan HMM | Identifies NBS domains in protein sequences [29] | Default e-value 1.1e-50; Pfam-A_hmm background model |
| OrthoFinder Package | Determines orthogroups and evolutionary relationships [29] | v2.5.1; DIAMOND for sequence similarity; MCL clustering |
| TRF (Tandem Repeats Finder) | Annotates tandem repeats in insertion sequences [65] | Default parameters; identifies TR copies of short motifs |
Procedure
Sequence Simulation:
- Generate positive TR sequences using ALF with the following parameters:
- Repeat unit length (l): 1-25 characters
- Repeat unit count (n): 2-15 units
- Evolutionary divergence: 40, 80, and 120 PAM units
- Substitution models: TN93 for DNA, LG for proteins
- Indel events: Zipfian distribution for length (for high-divergence sets only)
- Generate negative control sequences without TRs using (k-1)-th order Markov models based on empirical k-mer frequencies (k≤3) from the target genome [64]
- Generate positive TR sequences using ALF with the following parameters:
Algorithm Testing:
- Execute TR prediction tools (e.g., TRsv, EquiRep, HHrepID, T-REKS) on both positive and negative datasets
- For NBS gene applications, include domain-specific tools (PRGminer) in the evaluation [67]
Statistical Classification:
- Apply model-based phylogenetic classification to predicted repeats
- Calculate maximum-likelihood estimates of repeat divergence
- Filter false positives using statistical significance thresholds established from negative set performance [64]
Performance Assessment:
- Calculate sensitivity as TP/(TP+FN) where TP=true positives, FN=false negatives
- Calculate specificity as TN/(TN+FP) where TN=true negatives, FP=false positives
- Generate receiver operating characteristic (ROC) curves across divergence levels
Multi-Algorithm Consensus:
- Compare predictions across multiple detectors
- Apply statistical filtering to reconcile conflicting predictions
- Generate consensus TR callsets for highest confidence regions [64]
Workflow Visualization
Protocol 2: NBS Gene Family-Specific TR Detection and Validation
This protocol addresses the specific challenges of identifying tandem repeats within NBS gene families, accounting for their unique domain architecture and evolutionary patterns.
Materials and Reagents
- Plant Genomic Data: 34+ species covering mosses to monocots and dicots [29]
- Domain Databases: Pfam, InterPro for NBS domain identification
- RNA-seq Data: Tissue-specific, abiotic/biotic stress expression profiles
- VIGS System: For functional validation of NBS genes in resistant plants [29]
Procedure
NBS Gene Identification:
- Perform PfamScan with HMM search using NB-ARC domain model (e-value 1.1e-50)
- Classify genes based on domain architecture (NBS, NBS-LRR, TIR-NBS, etc.)
- Identify species-specific structural patterns [29]
Evolutionary Analysis:
- Cluster NBS sequences into orthogroups using OrthoFinder v2.5.1
- Construct phylogenetic tree via maximum likelihood algorithm (FastTreeMP, 1000 bootstraps)
- Identify tandem duplication events through genomic position analysis [29]
TR Detection in NBS Genes:
- Apply specialized TR detectors (TRsv, EquiRep) to NBS sequences
- Annotate TRs within specific protein domains (NBS, LRR, TIR)
- Identify TR variations between susceptible and tolerant genotypes [29]
Functional Correlation:
- Analyze expression profiling under biotic/abiotic stresses
- Correlate TR variations with expression changes (FPKM values)
- Perform protein-ligand interaction studies for TR-containing domains [29]
Experimental Validation:
- Select candidate TR-containing NBS genes for functional testing
- Implement Virus-Induced Gene Silencing (VIGS) in resistant plants
- Assess virus titer changes to confirm functional role [29]
Workflow Visualization
Applications to NBS Gene Family Research
The integration of validated TR detection methods has revealed critical insights into NBS gene family evolution and function:
- Tandem Duplication Patterns: Identification of 603 orthogroups with core and unique tandem duplications in plant NBS genes [29]
- Domain Architecture Diversity: Discovery of classical and species-specific structural patterns encompassing significant diversity among plant species [29]
- Expression Regulation: Correlation of specific TR variations with differential expression under biotic and abiotic stresses [29]
- Disease Resistance Mechanisms: Demonstration of GaNBS (OG2) role in virus tittering through TR-mediated functions [29]
Recent advances in long-read sequencing have further enhanced these applications, enabling more accurate characterization of TR regions in NBS genes. Tools like TRsv simultaneously detect tandem repeat variations, structural variations, and short indels, providing comprehensive variant profiling in complex genomic regions [65].
Robust benchmarking and validation of tandem repeat prediction algorithms is essential for accurate characterization of NBS gene families and their evolutionary dynamics. The protocols outlined here provide a standardized framework for assessing algorithm performance, with specific adaptations for the challenges presented by NBS domain architectures. As long-read sequencing technologies continue to improve, these validation methodologies will enable researchers to fully leverage the rich biological information contained within tandem repeat regions of disease resistance genes.
Validating Functional Significance and Cross-Species Genomic Convergence
Application Note
Plant nucleotide-binding site-leucine-rich repeat (NBS-LRR) genes constitute the largest family of disease resistance (R) genes, playing critical roles in effector-triggered immunity (ETI) against diverse pathogens [68]. Tandem duplication has been identified as a major mechanism for the expansion and evolution of this gene family, generating clusters of genetically linked NBS genes that often confer resistance to rapidly evolving pathogens [12]. The oomycete pathogen Phytophthora capsici causes devastating root rot in pepper (Capsicum annuum) and represents an ideal system for studying the expression dynamics of tandemly duplicated NBS genes under pathogen stress [69] [70]. This application note presents a comprehensive framework for profiling the expression of tandemly duplicated NBS genes during P. capsici infection, integrating genomic, transcriptomic, and functional validation approaches.
Key Findings from Literature
Recent studies across multiple plant species have revealed the significance of tandem duplications in NBS-LRR gene family expansion and pathogen resistance:
Table 1: Documented NBS-LRR Genes and Tandem Duplication Events in Various Plant Species
| Plant Species | Total NBS-LRR Genes | Tandemly Duplicated Clusters | Key Pathogens Studied | Reference |
|---|---|---|---|---|
| Sweet orange (Citrus sinensis) | 111 | Not specified | Penicillium digitatum | [71] |
| Rosaceae species (12 genomes) | 2188 | Multiple clusters observed | Various pathogens | [12] |
| Pepper (Capsicum annuum) | Not specified | QTL regions on chromosome P5 | Phytophthora capsici | [69] [70] |
| Passion fruit (Passiflora edulis) | 25 (purple), 21 (yellow) | 17 tandem duplication gene pairs | Cucumber mosaic virus, cold stress | [72] |
| Mango (Mangifera indica) | 47-106 across cultivars | Both tandem and segmental duplication events | Fungal and bacterial pathogens, cold stress | [68] |
| Euryale ferox (basal angiosperm) | 131 | 87 genes clustered at 18 multigene loci | Various pathogens | [73] |
Quantitative trait loci (QTL) mapping in pepper has identified major genomic regions on chromosome P5 associated with P. capsici resistance, with clusters of candidate NBS-LRR and receptor-like kinase (RLK) genes located within these regions [69] [70]. These findings highlight tandemly duplicated NBS genes as promising candidates for further expression validation under pathogen stress.
Protocol
Identification of Tandemly Duplicated NBS Genes
Principle: Tandemly duplicated NBS genes are defined as NBS-encoding genes located within 200 kb of each other on the same chromosome with ≥70% sequence similarity [12].
Procedure:
- Compile Reference Sequences: Obtain genome assembly and annotation files for your target species from databases such as GenBank, Phytozome, or species-specific databases (e.g., MangoBase for mango, CoGe for basal angiosperms) [68] [73].
- Identify NBS-LRR Genes:
- Validate Protein Domains:
- Identify Tandem Duplications:
- Extract genomic coordinates of all NBS-LRR genes from GFF3 annotation files
- Calculate physical distance between adjacent NBS-LRR genes on each chromosome
- Classify genes separated by ≤ 200 kb as potential tandem duplicates [12]
- Perform multiple sequence alignment of candidate tandem duplicates to confirm sequence similarity
Table 2: Key Bioinformatics Tools for Identifying Tandemly Duplicated NBS Genes
| Tool Category | Specific Tool | Purpose | Key Parameters |
|---|---|---|---|
| Domain Search | HMMER v3.3.2 | Identify NBS domains | E-value ≤ 1.0 for initial search; ≤ 0.0001 for confirmation |
| Domain Validation | Pfam, InterPro, CDD | Confirm domain architecture | E-value ≤ 0.0001 |
| Coiled-Coil Prediction | Paircoil2 | Identify CC domains | P-value = 0.025 |
| Sequence Alignment | ClustalW, MEGA | Assess sequence similarity | Default parameters |
| Genomic Visualization | TBtools, GSDS 2.0 | Visualize gene structures and chromosomal locations | Default parameters |
Plant Material Preparation and Pathogen Inoculation
Materials:
- Pepper seeds (Capsicum annuum) with known P. capsici resistance (e.g., CM334) and susceptible cultivars [69] [70]
- P. capsici isolates of varying virulence (e.g., KPC-7, JHAI1-7, MY-1) [70]
- Growth chambers with controlled temperature (25-28°C) and humidity conditions
- Root inoculation system: pots, sterile soil, pathogen culture materials
Pathogen Preparation and Inoculation:
- Maintain P. capsici isolates on V8 agar medium at 25°C in darkness
- Prepare zoospore suspension by flooding 7-10 day old cultures with sterile distilled water
- Adjust zoospore concentration to 10⁴ zoospores/mL using a hemocytometer
- Grow pepper plants under controlled conditions (16/8 h light/dark, 25°C, 70% RH) until 4-6 leaf stage
- Inoculate using root-dip method: carefully uproot plants, wash roots, dip in zoospore suspension for 30 min, then replant in fresh pots [69] [70]
- Include control plants dipped in sterile water
- Maintain high soil moisture for 48 hours post-inoculation to promote infection
Disease Assessment:
- Monitor disease symptoms daily using standardized rating scale:
- 1: No visible symptoms
- 2: Limited water-soaked lesions on stem collar
- 3: Extensive lesions with partial wilting
- 4: Complete wilting and plant death [70]
- Calculate disease severity indices and Area Under Disease Progress Curve (AUDPC) for quantitative analysis [69]
Expression Profiling of Tandemly Duplicated NBS Genes
Sample Collection:
- Collect root and stem tissue samples at multiple time points: 0, 6, 12, 24, 48, and 72 hours post-inoculation (hpi)
- Immediately flash-freeze samples in liquid nitrogen and store at -80°C
- Include biological replicates (≥3 plants per time point)
RNA Extraction and Quality Control:
- Extract total RNA using commercially available kits (e.g., TRIzol method)
- Treat with DNase I to remove genomic DNA contamination
- Verify RNA quality using Agilent Bioanalyzer (RIN ≥ 7.0)
- Quantify RNA concentration using Qubit Fluorometer
Gene Expression Analysis:
- Reverse Transcription: Synthesize cDNA using High-Capacity cDNA Reverse Transcription Kit with 1 μg total RNA input
- Quantitative PCR (qPCR):
- Design primers flanking intron-exon junctions for target tandem NBS genes
- Include reference genes (e.g., Actin, EF1α, GAPDH) for normalization
- Perform qPCR reactions in technical triplicates using SYBR Green chemistry
- Use thermal cycling conditions: 95°C for 10 min, followed by 40 cycles of 95°C for 15 s and 60°C for 1 min
- Calculate relative expression using 2^(-ΔΔCt) method
- RNA-Seq for Comprehensive Profiling:
- Prepare sequencing libraries using Illumina TruSeq Stranded mRNA kit
- Sequence on Illumina platform (≥30 million 150 bp paired-end reads per sample)
- Process raw reads: quality control (FastQC), adapter trimming (Trimmomatic), and alignment to reference genome (HISAT2/STAR)
- Quantify gene expression using featureCounts and calculate FPKM/TPM values
- Identify differentially expressed genes (DEGs) using DESeq2 with threshold of |log2FC| ≥ 1 and adjusted p-value < 0.05
Data Integration and Validation
Co-expression Network Analysis:
- Construct weighted gene co-expression networks using WGCNA R package
- Identify modules of co-expressed genes containing tandemly duplicated NBS genes
- Correlate module eigengenes with disease progression and resistance traits
Machine Learning Validation:
- Apply Random Forest classifier to identify multi-stress responsive NBS genes as described in mango and passion fruit studies [68] [72]
- Use expression profiles of tandem NBS genes across time points and treatments as features
- Rank genes by their importance scores for further functional validation
Functional Validation via VIGS:
- Select top candidate tandemly duplicated NBS genes showing significant induction upon P. capsici infection
- Design virus-induced gene silencing (VIGS) constructs using Tobacco Rattle Virus (TRV) system
- Infiltrate 2-4 leaf stage pepper plants with Agrobacterium carrying TRV::NBS constructs
- Include TRV::empty vector and TRV::PDS (phytoene desaturase) as controls
- Challenge silenced plants with P. capsici 3-4 weeks post-infiltration and assess changes in susceptibility
Visualizations
NBS-LRR-Mediated Immune Signaling Pathway
Experimental Workflow for Expression Profiling
The Scientist's Toolkit
Table 3: Essential Research Reagents and Solutions for NBS Gene Expression Studies
| Category | Specific Reagent/Solution | Function/Purpose | Example Sources/Protocols |
|---|---|---|---|
| Bioinformatics Tools | HMMER v3.3.2 | Identify NBS domains in genomic sequences | [73] [12] |
| Pfam, InterPro, CDD | Validate domain architecture of candidate NBS proteins | [68] [12] | |
| Paircoil2 | Confirm presence of coiled-coil domains in CNL proteins | [68] [72] | |
| MEME Suite | Identify conserved motifs in NBS domains | [12] | |
| Pathogen Culture | V8 Agar Medium | Maintain Phytophthora capsici cultures | [70] |
| Zoospore Suspension | Standardized inoculum for infection assays | [69] [70] | |
| Molecular Biology | TRIzol Reagent | High-quality RNA extraction from plant tissues | [71] [72] |
| DNase I Treatment | Remove genomic DNA contamination from RNA preps | Standard molecular biology protocols | |
| SYBR Green Master Mix | qPCR analysis of gene expression | [71] | |
| Illumina TruSeq Kit | RNA-seq library preparation | [69] [72] | |
| Functional Validation | TRV VIGS Vectors | Virus-induced gene silencing for functional validation | Adapted from established plant VIGS protocols |
| Agrobacterium tumefaciens | Delivery of VIGS constructs into plant tissues | Standard plant transformation methods |
This application note provides a comprehensive framework for profiling the expression of tandemly duplicated NBS genes under pathogen stress, with specific application to Phytophthora capsici infection in pepper. The integrated approach combining bioinformatics identification, transcriptional profiling, and functional validation enables researchers to identify key regulators of disease resistance within expanded NBS gene families. The protocols outlined leverage established methods from multiple plant systems [68] [69] [70] and can be adapted for studying tandemly duplicated genes in other plant-pathogen systems. The identification of key tandemly duplicated NBS genes responding to pathogen stress provides valuable candidates for marker-assisted breeding and genetic engineering approaches to enhance disease resistance in crop plants.
Intracellular immune responses in plants are often mediated by Nucleotide-binding domain and Leucine-rich Repeat (NLR) proteins, which function as critical receptors in effector-triggered immunity (ETI) [18] [74]. The NLR gene family exhibits remarkable expansion and diversification in plant genomes, primarily driven by gene duplication events [18] [75]. Among these, tandem duplication serves as a key evolutionary mechanism for generating new NLR genes, frequently resulting in spatially clustered gene arrangements on chromosomes that facilitate the rapid evolution of disease resistance specificities [18] [74]. These tandemly duplicated NLR paralogs often undergo functional specialization, evolving into sensor-helper pairs or complex network architectures [74]. This application note provides detailed protocols for the comprehensive identification of tandemly duplicated NLR genes, the subsequent reconstruction of protein interaction networks, and the computational prediction of hub NLR proteins, which are pivotal nodes coordinating immune signaling.
Key Concepts and Quantitative Background
Tandem Duplication as a Driver of NLR Expansion
Quantitative analyses across various plant species confirm that tandem duplication is a major evolutionary force responsible for the expansion and diversification of the NLR family. The table below summarizes findings from recent genome-wide studies.
Table 1: Documented NLR Tandem Duplication Events in Plant Genomes
| Plant Species | Total Canonical NLRs Identified | NLRs from Tandem Duplication | Percentage from Tandem Duplication | Primary Genomic Locations | Reference |
|---|---|---|---|---|---|
| Capsicum annuum (Pepper) | 288 | 53 | 18.4% | Chromosomes 08 and 09 | [18] |
| Carica papaya (Papaya) | 59 | Not Specified (Major Force) | Not Specified | Multiple chromosomes | [75] |
| Oryza sativa (Rice) | Pit1 and Pit2 | 2 (Pit1-Pit2 pair) | N/A | Adjacent genes, 9 kbp apart | [74] |
Functional Outcomes of Tandem Duplication
Tandem duplication can lead to several functional outcomes for NLR paralogs:
- Sensor-Helper Specialization: As exemplified by the rice Pit1-Pit2 pair, where Pit1 acts as an executor inducing cell death and Pit2 functions as a regulator that suppresses Pit1 activity [74].
- Neo-functionalization: Positive selection on key residues can lead to new functions, such as altered subcellular localization and novel interaction capabilities [74].
- Hub Formation: Certain NLR paralogs, such as Caz01g22900 and Caz09g03820 in pepper, can evolve into hub nodes within PPI networks, potentially coordinating immune signaling [18].
Application Notes: Integrated Protocol for Hub NLR Identification
This integrated protocol outlines a workflow for identifying tandemly duplicated NLR genes and characterizing their roles within protein interaction networks.
Figure 1: Workflow for identifying hub NLRs from tandem duplication events. The process involves identification, network analysis, and experimental validation.
Stage 1: Genome-Wide Identification of NLR Genes and Tandem Duplicates
Protocol 1.1: Identification of NLR Genes
Objective: To comprehensively identify all canonical NLR genes within a plant genome.
Materials & Reagents:
- High-quality reference genome and corresponding annotation file (e.g., GFF3 format).
- Software Tools: HMMER v3.3.2, NCBI CD-Search, Pfam batch search, RGAugury (customized pipeline), InterProScan, TBtools [18] [75].
Method:
- Sequence Retrieval: Obtain the complete proteome file from the reference genome.
- Domain-Centric Identification: a. Perform a HMMER search against the entire proteome using the NB-ARC domain profile (PF00931) with an E-value cutoff of (1 \times 10^{-5}) [18]. b. Alternatively, use a customized RGAugury pipeline that incorporates searches for the RPW8 domain in addition to standard NBS, TIR, CC, and LRR domains [75].
- Domain Validation: Confirm the presence and completeness of domains (NBS, TIR/CC/RPW8, LRR) in all candidate sequences using NCBI's Conserved Domain Database (CDD) and Pfam batch search [18].
- Redundancy Removal: Manually inspect and remove redundant or partial sequences to generate a high-confidence set of canonical NLR genes.
Protocol 1.2: Identification of Tandemly Duplicated NLRs
Objective: To identify NLR genes generated by tandem duplication events.
Materials & Reagents:
Method:
- All-vs-All BLAST: Conduct a BLASTP search of the confirmed NLR protein sequences against themselves.
- Synteny Analysis: Input the BLAST results and the genome annotation file into MCScanX to identify tandem duplication events [18].
- Confirmation: Use DupGen_finder to classify duplication modes and specifically extract gene pairs involving tandem duplication (TD) [75].
- Visualization: Generate chromosomal distribution maps using visualization tools like Advanced Circos in TBtools to observe clusters of tandemly duplicated NLRs [18].
Stage 2: Protein-Protein Interaction (PPI) Network Construction and Hub Prediction
Protocol 2.1: PPI Network Construction for NLRs
Objective: To build a protein-protein interaction network among identified NLR proteins.
Materials & Reagents:
- Software Tools: STRING database, Cytoscape, Deep Learning PPI predictors (e.g., GNNs, Transformers) [18] [76] [77].
Method:
- Interaction Prediction: a. Experimental Data Integration: If available, use co-immunoprecipitation (co-IP) coupled with mass spectrometry data to identify physical interactions, as demonstrated for the rice Pit1-Pit2 complex [74]. b. Computational Prediction: Submit the protein sequences of identified NLRs to the STRING database to predict functional associations and interactions. A confidence score > 0.4 is typically used [18]. c. (Advanced) Deep Learning Prediction: For a more nuanced prediction, employ deep learning models such as Graph Neural Networks (GNNs) that can integrate sequence, structural, and evolutionary data to predict PPIs [76].
- Network Visualization and Assembly: Import the interaction data into network visualization software like Cytoscape. Use layout algorithms (e.g., force-directed) to generate a clear visual representation of the NLR interactome [77].
Protocol 2.2: Identification and Prioritization of Hub NLRs
Objective: To computationally identify hub nodes within the constructed NLR interaction network.
Materials & Reagents:
- Software Tools: Cytoscape with NetworkAnalyzer plugin, or custom Python/R scripts utilizing network libraries (e.g., NetworkX) [18] [77].
Method:
- Network Topology Analysis: Calculate key network centrality metrics for each node (NLR protein) in the network:
- Degree Centrality: The number of connections a node has.
- Betweenness Centrality: The number of shortest paths that pass through a node.
- Hub Definition: Define hub nodes as those ranking in the top (X\%) (e.g., top 10%) for degree and/or betweenness centrality.
- Prioritization: Overlay the results from the tandem duplication analysis (Protocol 1.2). Prioritize hub NLRs that are also members of tandemly duplicated clusters for further validation, as these are of high evolutionary and functional interest [18].
Stage 3: Expression and Functional Validation of Candidate Hub NLRs
Protocol 3.1: Transcriptomic Validation
Objective: To assess the expression profile of candidate hub NLRs under pathogen challenge.
Materials & Reagents:
- RNA-seq Data: Publicly available data (e.g., from NCBI SRA) from resistant and susceptible cultivars infected with the target pathogen.
- Software Tools: HISAT2, DESeq2, TBtools [18].
Method:
- Data Processing: Map RNA-seq reads to the reference genome using HISAT2.
- Differential Expression: Identify significantly differentially expressed genes (DEGs) using DESeq2 with thresholds of ( \lvert \log_2 \text{Fold Change} \rvert \geq 1 ) and FDR < 0.05 [18].
- Expression Correlation: Check if the expression of the candidate hub NLR is significantly induced during the resistant response.
Protocol 3.2: Functional Characterization via Mutagenesis
Objective: To experimentally validate the function of a candidate hub NLR.
Materials & Reagents:
- Plant materials (e.g., resistant cultivar, Nicotiana benthamiana for transient assays).
- Cloning vectors, Agrobacterium tumefaciens strain.
- Equipment: Confocal microscope for localization studies if using fluorescent tags [74].
Method:
- Generation of Constructs: Clone the candidate hub NLR gene into an appropriate expression vector (e.g., with an estradiol-inducible promoter or a constitutive promoter for transient expression).
- Cell Death Assay: Transiently express the candidate gene in N. benthamiana leaves and observe for the induction of hypersensitive response (HR)-like cell death [74].
- Co-expression and Suppression Tests: Co-express the candidate hub NLR with its identified interactors (e.g., a tandem paralog like Pit2) to assess functional modulation [74].
The Scientist's Toolkit
Table 2: Essential Research Reagents and Computational Tools
| Category / Item | Function / Description | Application in Protocol |
|---|---|---|
| Bioinformatics Software | ||
| TBtools | Integrative toolkit for biological data analysis. | Chromosomal visualization, synteny analysis (Protocol 1.2) [18] [75]. |
| HMMER v3.3.2 | Profile HMM-based sequence search. | Initial NLR identification via NB-ARC domain (PF00931) (Protocol 1.1) [18]. |
| MCScanX & DupGen_finder | Identifies gene duplication modes and syntenic blocks. | Specifically identifying tandem duplication events (Protocol 1.2) [18] [75]. |
| Databases & Platforms | ||
| STRING Database | Database of known and predicted protein-protein interactions. | PPI network construction (Protocol 2.1) [18] [76]. |
| Cytoscape | Network visualization and analysis platform. | PPI network assembly, visualization, and hub identification via topology analysis (Protocol 2.1, 2.2) [77]. |
| NCBI CDD / Pfam | Databases of protein domain annotations. | Validation of NLR domain architecture (Protocol 1.1) [18]. |
| Experimental Reagents | ||
| Estradiol-inducible System | Allows controlled, inducible gene expression. | Functional analysis of NLRs without constitutive lethality (Protocol 3.2) [74]. |
| Nicotiana benthamiana | Model plant for transient expression assays. | Rapid functional testing of NLR-induced cell death (HR) (Protocol 3.2) [74]. |
| Co-IP & Mass Spectrometry | Techniques for identifying physical protein interactors. | Experimental validation of NLR protein complexes (Protocol 2.1) [74]. |
Concluding Workflow and Data Interpretation
The following diagram summarizes the logical and functional relationships that may be discovered between tandemly duplicated NLRs, leading to the identification of a key hub NLR.
Figure 2: Functional logic of a tandemly duplicated NLR pair. Paralog A functions as an executor of immunity, while Paralog B evolves a regulatory role, fine-tuning the immune response. The executor is identified as the key hub NLR.
Data Integration and Interpretation:
- Hub Validation: A protein is confirmed as a bona fide hub NLR if it is a) tandemly duplicated, b) central in the PPI network, c) differentially expressed during infection, and d) functionally capable of inducing a defense response [18] [74].
- Evolutionary Insight: The functional divergence of tandem duplicates, such as the executor-suppressor relationship in the rice Pit1-Pit2 pair, illustrates a common evolutionary trajectory that fine-tunes the immune response and prevents autoimmunity [74].
- Application in Breeding: Identified hub NLRs, such as the candidates Caz01g22900 and Caz09g03820 in pepper, serve as high-priority targets for developing molecular markers for disease resistance breeding programs [18].
Application Notes
This document provides a detailed methodological framework for investigating the role of tandem duplication in the evolution of plant disease resistance genes, specifically NBS-LRR genes, under soil microbial pressure. The protocols are designed for researchers analyzing genomic data to understand adaptive convergent evolution.
Tandem duplication (TD) is a crucial evolutionary mechanism enabling plants to rapidly adapt to biotic stresses, including pathogen pressure from soil microbes. Recent comparative genomics studies reveal that TD is a predominant force driving the expansion of disease resistance (R) gene families, particularly the Nucleotide Binding Site-Leucine Rich Repeat (NBS-LRR) family [78]. This expansion often exhibits patterns of convergent evolution, where unrelated plant lineages independently evolve similar genetic adaptations to similar environmental pressures, such as specific soil microbiota [78]. The following application notes and protocols standardize the process of identifying, characterizing, and validating tandemly duplicated NBS-LRR genes, facilitating research into plant adaptive evolution and resistance breeding.
Quantitative Evidence of Tandem Duplication in Plant Genomes
Comprehensive genomic surveys across diverse plant species consistently show high numbers of genes derived from tandem duplication, underscoring its significance in genome evolution and adaptation.
Table 1: Prevalence of Tandemly Duplicated Genes in Selected Plant Genomes
| Plant Species | Total NBS-LRR Genes Identified | Genes from Species-Specific/Tandem Duplication | Primary Evolutionary Force for NBS Expansion |
|---|---|---|---|
| Malus × domestica (Apple) | 748 | 66.04% | Recent species-specific duplication [50] |
| Pyrus bretschneideri (Pear) | 469 | 48.61% | Recent species-specific duplication [50] |
| Prunus persica (Peach) | 354 | 37.01% | Recent species-specific duplication [50] |
| Prunus mume (Mei) | 352 | 40.05% | Recent species-specific duplication [50] |
| Fragaria vesca (Strawberry) | 144 | 61.81% | Recent species-specific duplication [50] |
| Akebia trifoliata | 73 | 45.2% (31 genes via tandem duplication) | Tandem and dispersed duplications [79] |
| 26 Aurantioideae Species | Varies by species | Tandem Duplication (TD) reported as a "predominant duplication type" [78] | Tandem duplication [78] |
Experimental Protocols
Protocol 1: Genome-Wide Identification of NBS-LRR Genes
Objective: To systematically identify all NBS-LRR genes in a target plant genome.
Materials & Reagents:
- High-Quality Genome Assembly: Annotated genome sequence of the target species in FASTA and GFF3 format [79].
- HMMER Software: For hidden Markov model (HMM)-based searches [15] [79].
- Pfam Profile: The NB-ARC domain HMM profile (PF00931) [79].
- BLASTP Suite: For sequence similarity searches [79].
- Perl/Python Scripts: For automating data parsing and redundancy removal.
Procedure:
- Sequence Retrieval: Obtain the complete proteome file of the target species.
- HMM Search: Use the
hmmsearchcommand from the HMMER suite to scan the proteome against the NB-ARC domain profile (PF00931). Use an E-value cutoff (e.g., 1.0 or 10^−4) to identify significant matches [79]. - BLASTP Analysis: Perform a BLASTP search using known NBS protein sequences as queries against the target proteome to complement the HMM search.
- Merge and Remove Redundancy: Combine candidate genes from both searches and remove duplicate entries.
- Domain Validation: Confirm the presence of the NBS domain in all candidate genes by analyzing them against the Pfam or NCBI Conserved Domain Database (CDD) [79]. Manually verify or remove sequences lacking the core NBS domain.
- Subfamily Classification: Classify identified NBS genes into subfamilies (TNL, CNL, RNL) by checking for the presence of TIR (PF01582), RPW8 (PF05659), and LRR (PF08191) domains using Pfam/CDD. Predict Coiled-coil (CC) domains using tools like COILS with a threshold of 0.5 [79].
Protocol 2: Identification and Evolutionary Analysis of Tandem Duplications
Objective: To identify tandemly duplicated NBS-LRR genes and assess their evolutionary history.
Materials & Reagents:
- List of Mapped NBS Genes: Output from Protocol 1, with genomic coordinates from the GFF3 annotation file [79].
- Bioinformatics Tools: OrthoParaMap or similar custom software for mapping duplications [15]; MCScanX for analyzing genome collinearity and duplication modes.
- Calculation Scripts: Custom Perl/Python scripts for calculating Ka (nonsynonymous substitutions), Ks (synonymous substitutions), and Ka/Ks ratios using models like NG or YN [50].
Procedure:
- Define Tandem Duplicates: Define tandem duplicates as NBS-LRR genes located within a specified physical distance on the same chromosome (e.g., within 5-10 genes of each other or a set physical distance like 100kb) [15] [79] [16].
- Map Gene Locations: Map all identified NBS genes to their chromosomal positions using the genome annotation file.
- Identify Tandem Arrays: Cluster genes that meet the tandem duplicate criteria into tandem arrays.
- Calculate Evolutionary Rates:
- Extract the coding sequences of the tandemly duplicated gene pairs.
- Perform multiple sequence alignment of the protein sequences, then back-translate to codon-aligned nucleotide sequences.
- Use a tool like
KaKs_Calculatorto compute Ka, Ks, and Ka/Ks values for each pair.
- Interpret Ka/Ks Ratios:
- Ka/Ks ≈ 1: Suggests neutral evolution.
- Ka/Ks < 1: Indicates purifying selection, where harmful mutations are removed [50] [78].
- Ka/Ks > 1: Suggests positive selection, driving adaptive evolution. Tandem duplicates often show higher Ka/Ks ratios than other duplication types, indicating faster functional divergence [78].
Protocol 3: Expression Analysis of Tandemly Duplicated NBS Genes
Objective: To characterize the expression profiles of tandemly duplicated NBS genes under different conditions or in different tissues.
Materials & Reagents:
- RNA-seq Data: Publicly available or newly generated transcriptome datasets from various tissues, developmental stages, or pathogen/stress treatments [79].
- Computing Environment: Server with adequate RAM and CPU for transcriptome analysis.
- Bioinformatics Software: HISAT2/StringTie or similar tools for RNA-seq alignment and transcript assembly; DESeq2/edgeR for differential expression analysis.
Procedure:
- Data Acquisition: Download RNA-seq data (e.g., from NCBI SRA) relevant to your research question, such as data from root tissues (for soil microbial interaction) or pathogen-infected samples.
- Read Mapping and Quantification: Map the RNA-seq reads to the reference genome of your target species and quantify transcript abundances.
- Expression Profiling: Extract the expression values (e.g., FPKM or TPM) for all NBS-LRR genes, focusing on those in tandem arrays.
- Identify Differentially Expressed Genes (DEGs): Perform differential expression analysis between experimental conditions (e.g., infected vs. control) to identify NBS genes that are significantly up-regulated or down-regulated.
- Validate Functional Relevance: Correlate the expression of specific tandem arrays with resistance phenotypes. Genes showing significant up-regulation in response to pathogens are strong candidates for functional disease resistance genes [16].
The Scientist's Toolkit: Essential Research Reagents & Solutions
Table 2: Key Reagents and Resources for Tandem Duplication Analysis in NBS Genes
| Item Name | Function/Application | Specification/Example |
|---|---|---|
| Pfam Domain Profiles | Identifying conserved protein domains in candidate NBS-LRR genes. | NB-ARC (PF00931), TIR (PF01582), LRR (PF08191) [79]. |
| HMMER Software Suite | Probing proteomes for genes containing NBS domains using HMMs. | hmmsearch command with E-value cutoff [15] [79]. |
| Genome Annotation File (GFF3/GTF) | Providing genomic coordinates of genes for mapping tandem arrays and phylogenetic analysis. | File containing gene locations, exon/intron boundaries, and functional annotations [79]. |
| Ka/Ks Calculation Pipeline | Quantifying selective pressure on duplicated gene pairs. | Software like KaKs_Calculator implementing NG or YN model [50]. |
| RNA-seq Datasets | Profiling gene expression and identifying condition-specific or tissue-specific expression of tandem duplicates. | Data from public repositories (e.g., NCBI SRA) or newly generated sequences [79]. |
Visualization of Research Workflows
The following diagrams illustrate the logical relationships and experimental workflows described in the protocols.
Figure 1: Overall experimental workflow for identifying and analyzing tandemly duplicated NBS-LRR genes, integrating the three main protocols.
Figure 2: Conceptual model of how tandem duplication driven by soil microbial pressure leads to convergent evolution of disease resistance in plants.
This application note provides a standardized framework for conducting comparative synteny analysis of Nucleotide-Binding Site Leucine-Rich Repeat (NBS-LRR) gene clusters across plant families, with emphasis on Solanaceae species. The protocol addresses the pressing need to understand how tandem duplication events drive the evolution of plant immune genes, creating the dramatic variation in NBS gene number and organization observed across species [80] [81]. We integrate pan-genomic approaches with synteny analysis to resolve complex evolutionary patterns including species-specific expansions, contractions, and divergent selection pressures acting on NBS clusters [82] [12].
The methodologies outlined enable researchers to identify evolutionarily dynamic genomic regions housing NBS clusters, reconstruct their evolutionary history, and detect signatures of birth-and-death evolution [37]. This workflow is particularly valuable for contextualizing orphan crops within well-studied plant families by leveraging knowledge transfer from model species, ultimately accelerating the identification and characterization of disease resistance genes for crop improvement [82].
Quantitative Patterns of NBS Gene Family Evolution
Table 1: NBS-LRR Gene Distribution and Evolutionary Patterns Across Plant Families
| Plant Family | Species | NBS Gene Count | Dominant Subclasses | Evolutionary Pattern | Primary Duplication Mechanism | Reference |
|---|---|---|---|---|---|---|
| Solanaceae | Tomato (S. lycopersicum) | 267-294 | CNL, NL | "Expansion followed by contraction" | Tandem duplication | [80] [81] |
| Potato (S. tuberosum) | 438-443 | CNL, NL | "Consistent expansion" | Tandem duplication | [80] [81] | |
| Pepper (C. annuum) | 306-684 | CNL, NL | "Shrinking" | Tandem duplication | [80] [81] | |
| Tobacco (N. tabacum) | 603 | CNL, NL | Allotetraploid expansion | Whole-genome duplication | [8] | |
| Rosaceae | 12 species (e.g., apple, strawberry) | 2188 (total) | Varies by species | Multiple patterns including "continuous expansion" and "first expansion then contraction" | Species-specific duplication/loss | [12] |
| Poaceae | Maize (Z. mays) | ~129 | CNL | "Contracting" | Tandem duplication, transposable element loss | [80] [12] |
| Rice (O. sativa) | 464-508 | CNL | "Contracting" | Tandem duplication | [80] [12] | |
| Fabaceae | Soybean (G. max) | >500 | CNL, TNL | "Consistently expanding" | Tandem and segmental duplication | [12] |
Table 2: NBS Gene Classification and Domain Architecture in Solanaceae
| NBS Subclass | N-Terminal Domain | Central Domain | C-Terminal Domain | Representative Solanaceae Genes | Relative Abundance |
|---|---|---|---|---|---|
| TNL | TIR (Toll/Interleukin-1 Receptor) | NBS (NB-ARC) | LRR (Leucine-Rich Repeat) | RPS4 (Arabidopsis orthologs) | Low (~22 ancestral TNLs) [80] |
| CNL | CC (Coiled-Coil) | NBS (NB-ARC) | LRR (Leucine-Rich Repeat) | Rpi-blb2 (Potato), SW5 (Tomato) | High (~150 ancestral CNLs) [80] |
| RNL | RPW8 (Resistance to Powdery Mildew 8) | NBS (NB-ARC) | LRR (Leucine-Rich Repeat) | ADR1 (Arabidopsis orthologs) | Very low (~4 ancestral RNLs) [80] |
| NL | None | NBS (NB-ARC) | LRR (Leucine-Rich Repeat) | Various | Moderate |
| N | None | NBS (NB-ARC) | None | Various | High (~45.5% in Nicotiana) [8] |
Evolutionary Dynamics and Genomic Context of NBS Clusters
NBS-LRR genes are not randomly distributed across plant genomes but frequently form physical clusters through repeated tandem duplication events [80] [37]. These clusters often reside in duplication-prone genomic regions characterized by long tandem repeats and specific sequence features that promote recurrent duplication events [45]. This non-random genomic distribution creates evolutionary hotspots where NBS genes undergo rapid birth-and-death evolution, resulting in lineage-specific expansions and contractions [45] [37].
The dynamic evolution of NBS clusters is driven by several interrelated mechanisms. Tandem duplication serves as the primary engine for NBS gene expansion, creating arrays of phylogenetically related genes through unequal crossing over [80] [37]. Segmental and whole-genome duplications (WGD) provide additional evolutionary material, particularly in polyploid species like tobacco, where allopolyploidization contributed significantly to NBS gene content [83] [8]. Following duplication, frequent gene loss and fractionation occur, with some lineages experiencing massive pseudogenization and subsequent elimination of NBS genes [80]. This creates the diverse evolutionary patterns observed across plant families, from the consistent expansion seen in potato to the contraction pattern observed in pepper [80].
Different evolutionary pressures act on NBS genes based on their duplication mechanism. WGD-derived genes typically experience strong purifying selection (low Ka/Ks ratios), preserving essential functions, while tandemly duplicated genes often show signs of relaxed or positive selection, enabling functional diversification [61]. This differential selection pressure facilitates the emergence of novel pathogen recognition specificities while maintaining core immune signaling components [45].
Detailed Experimental Protocols
Genome-Wide Identification and Classification of NBS-LRR Genes
Principle: Comprehensive identification of NBS-LRR genes from genome assemblies using conserved domain searches and hierarchical classification based on protein architecture [80] [12] [8].
Protocol:
Data Acquisition: Download genome assembly sequences and annotated protein sequences from relevant databases (Phytozome, Sol Genomics Network, Rosaceae.org) [80] [12].
HMMER Search: Perform Hidden Markov Model searches using HMMER v3.1b2 or later against the target proteomes using the NB-ARC domain (PF00931) as query [12] [8].
Use expectation value threshold of 10^-4 for initial identification [80].
BLAST Confirmation: Conduct complementary BLASTP searches using known NBS domains as queries with E-value threshold of 1.0 to ensure comprehensive identification [12].
Domain Architecture Analysis: Submit candidate sequences to:
- Pfam database (for TIR, LRR, RPW8 domains)
- NCBI Conserved Domain Database (for CC domains)
- SMART database (motif validation)
- COILS program (with threshold 0.9 for CC prediction) [80]
Classification: Categorize genes into subclasses (TNL, CNL, RNL, NL, N) based on presence/absence of specific domains [8].
Manual Curation: Remove redundant hits and validate domain organization through manual inspection.
Comparative Synteny Analysis of NBS Clusters
Principle: Identification of conserved syntenic blocks containing NBS genes across multiple species to reconstruct evolutionary history and detect lineage-specific rearrangements [82].
Protocol:
Whole-Genome Alignment: Perform all-against-all BLASTP searches of proteomes from target species using optimized parameters [8].
Synteny Detection: Process BLAST results with MCScanX to identify collinear blocks:
Default parameters with -s 100 for scoring matrix optimization [8].
NBS Cluster Delineation: Define NBS clusters as genomic regions containing ≥2 NBS genes within 200 kb [80] [37].
Synteny Visualization: Generate synteny plots using modified versions of JCVI or Circos packages.
Evolutionary Rate Calculation: For syntenic NBS gene pairs, calculate non-synonymous (Ka) and synonymous (Ks) substitution rates using KaKs_Calculator 2.0 with Nei-Gojobori method [8].
Phylogenetic Reconstruction of NBS Gene Families
Principle: Construction of phylogenetic trees to resolve evolutionary relationships among NBS genes and identify orthologous and paralogous relationships [80] [81].
Protocol:
Sequence Alignment: Extract NBS domains and perform multiple sequence alignment using MUSCLE v3.8.31 with default parameters [8].
Model Selection: Determine best-fit substitution model using ModelTest or ProtTest.
Tree Construction: Build phylogenetic trees using maximum likelihood method with MEGA11 or RAxML:
Use 1000 bootstrap replicates to assess node support [8].
Tree Reconciliation: Reconcile gene trees with species trees to infer duplication and loss events using NOTUNG or similar software.
Ancestral Gene Estimation: Reconstruct ancestral NBS gene content using maximum parsimony or maximum likelihood methods [12].
Pan-Genomic Analysis of NBS Gene Presence-Absence Variation
Principle: Characterization of core and accessory NBS genes across multiple genomes or accessions to understand intraspecific diversity [82] [61].
Protocol:
Genome Selection: Curate diverse panel of high-quality genomes representing species diversity, applying divergence time thresholds (e.g., 6 million years) to ensure phylogenetic independence [82].
Orthogroup Inference: Identify orthologous groups using OrthoMCL or OrthoFinder with standard parameters.
Syntenic Orthologs: Identify syntenic orthologs using MCScanX and manual verification.
PAV Profiling: Classify NBS genes as:
- Core: Present in ≥90% of genomes
- Shell: Present in 10-90% of genomes
- Cloud: Present in <10% of genomes [61]
Association Analysis: Correlate PAV patterns with pathogen resistance phenotypes when available.
Workflow Visualization
NBS Cluster Synteny Analysis Workflow: This diagram outlines the integrated computational pipeline for comparative analysis of NBS gene clusters across species, highlighting the three major phases of analysis.
The Scientist's Toolkit
Table 3: Essential Research Reagents and Computational Tools for NBS Synteny Analysis
| Category | Tool/Resource | Function | Application Notes |
|---|---|---|---|
| Genome Databases | Sol Genomics Network (solgenomics.net) | Solanaceae genome data | Primary resource for tomato, potato, pepper genomes [80] |
| Genome Database for Rosaceae (rosaceae.org) | Rosaceae genome data | Curated genomes for apple, strawberry, peach [12] | |
| Phytozome (phytozome.net) | Comparative plant genomics | Multi-species platform with annotation consistency [80] | |
| Domain Detection | HMMER v3.1b2+ | Hidden Markov Model searches | NB-ARC domain (PF00931) identification [8] |
| Pfam Database | Protein family annotation | TIR (PF01582), LRR, RPW8 (PF05659) domains [12] | |
| NCBI CDD | Conserved domain detection | CC domain confirmation [8] | |
| COILS Program | Coiled-coil prediction | Threshold 0.9 for reliable CC identification [80] | |
| Synteny Analysis | MCScanX | Collinearity detection | Standard for plant comparative genomics [8] |
| JCVI / pyGenomeViz | Synteny visualization | Python libraries for publication-quality figures | |
| OrthoFinder | Orthogroup inference | Resolves evolutionary relationships [12] | |
| Evolutionary Analysis | MEGA11 / RAxML | Phylogenetic reconstruction | ML methods with bootstrap testing [8] |
| KaKs_Calculator 2.0 | Selection pressure analysis | Nei-Gojobori method for Ka/Ks [8] | |
| NOTUNG | Tree reconciliation | Duplication/loss inference [12] | |
| Specialized Resources | Solanaceae Pan-Genome Database (SolPGD) | Pan-genome data integration | http://www.bioinformaticslab.cn/SolPGD [82] |
| RENSeq | NBS-LRR gene enrichment | Targeted sequencing for complex clusters [81] |
Concluding Remarks
The integrated protocols presented here enable comprehensive analysis of NBS cluster evolution through synteny and pan-genomic approaches. The Solanaceae family serves as an exemplary system for these studies due to its combination of economically important crops, varied NBS evolutionary patterns, and available genomic resources [82] [80]. These methods reveal how tandem duplication acts as a key evolutionary force driving NBS gene family expansion and contraction, with direct implications for understanding plant-pathogen coevolution [45] [37].
Future methodological developments will likely focus on single-cell genomic approaches to understand NBS expression dynamics, long-read sequencing to resolve complex cluster regions, and machine learning to predict resistance specificities from sequence data. The continuing expansion of genomic resources for orphan crops within Solanaceae and other families will further enhance the utility of these comparative approaches for crop improvement [82].
Conclusion
Tandem duplication is not a mere genomic artifact but a fundamental, convergent evolutionary strategy that fuels the diversification of NBS-LRR gene families, enabling plants to compete in the perpetual arms race against pathogens. The integration of advanced bioinformatics tools, multi-omics data, and comparative genomics provides an unprecedented ability to decode this dynamic process. Future research must focus on moving from correlation to causation by functionally characterizing candidate genes emerging from these analyses. The implications are profound for biomedical and agricultural research, paving the way for engineering synthetic NBS clusters and deploying marker-assisted selection to develop crop varieties with broad-spectrum, durable disease resistance, ultimately enhancing global food security.
References
- 1. Recent Advances in Effector-Triggered Immunity in Plants [https://www.mdpi.com/1422-0067/22/9/4709]
- 2. NB-LRR proteins: Pairs, pieces, perception, partners and ... [https://pmc.ncbi.nlm.nih.gov/articles/PMC2910844/]
- 3. Genome-Wide Characterization and Expression Pattern ... [https://pmc.ncbi.nlm.nih.gov/articles/PMC12469828/]
- 4. Phylogenetic, Structural, and Evolutionary Insights into ... [https://pmc.ncbi.nlm.nih.gov/articles/PMC11899730/]
- 5. Plant NBS-LRR proteins: adaptable guards - PubMed Central [https://pmc.ncbi.nlm.nih.gov/articles/PMC1557992/]
- 6. Genome-wide identification and characterization of NBS ... [https://www.nature.com/articles/s41598-025-03507-5]
- 7. Comparative analysis of the NLR gene family in ... [https://www.frontiersin.org/journals/plant-science/articles/10.3389/fpls.2025.1681919/full]
- 8. Genome-Wide Identification of NBS-LRR Family in Three ... [https://www.mdpi.com/2073-4425/16/6/680]
- 9. Functional characterization of NBS-LRR genes reveals an ... [https://bmcbiol.biomedcentral.com/articles/10.1186/s12915-024-01836-x]
- 10. A novel TIR-NBS-LRR gene regulates immune response to ... [https://www.sciencedirect.com/science/article/pii/S2214514122000733]
- 11. Identification and distribution of the NBS-LRR gene family in ... [https://pmc.ncbi.nlm.nih.gov/articles/PMC4422547/]
- 12. Genome-wide analysis of NBS-LRR genes in Rosaceae ... [https://www.frontiersin.org/journals/genetics/articles/10.3389/fgene.2022.1052191/full]
- 13. Segmental and Tandem Duplications Driving the Recent ... [https://www.mdpi.com/2073-4425/9/12/568]
- 14. Genetic Divergence of Lineage-Specific Tandemly ... [https://www.frontiersin.org/journals/plant-science/articles/10.3389/fpls.2022.875202/full]
- 15. The roles of segmental and tandem gene duplication in the evolution of large gene families in Arabidopsis thaliana - PMC [https://pmc.ncbi.nlm.nih.gov/articles/PMC446195/]
- 16. Importance of Lineage-Specific Expansion of Plant ... [https://pmc.ncbi.nlm.nih.gov/articles/PMC2556807/]
- 17. Spatial transcriptomics illuminates evolutionary fates - PMC [https://pmc.ncbi.nlm.nih.gov/articles/PMC12622374/]
- 18. Genome-Wide Identification and Functional Evolution of NLR ... [https://pmc.ncbi.nlm.nih.gov/articles/PMC12562843/]
- 19. The chromosome-scale genome of black wolfberry (Lycium ... [https://www.sciencedirect.com/science/article/pii/S2468265925000010]
- 20. DTDHM: detection of tandem duplications based on hybrid ... [https://pmc.ncbi.nlm.nih.gov/articles/PMC11285389/]
- 21. TD-COF: A new method for detecting tandem duplications ... [https://www.sciencedirect.com/science/article/pii/S2352711024002516]
- 22. Comparative genomics and bioinformatics approaches ... [https://pmc.ncbi.nlm.nih.gov/articles/PMC10929019/]
- 23. Genome-Wide Analysis of the NBS-LRR Gene Family and ... [https://www.mdpi.com/2311-7524/10/12/1293]
- 24. Systematic Analysis and Comparison of Nucleotide-Binding ... [https://journals.plos.org/plosone/article?id=10.1371/journal.pone.0068435]
- 25. Genome-Wide Identification of NBS-LRR Family in Three ... [https://pmc.ncbi.nlm.nih.gov/articles/PMC12192410/]
- 26. Genome-Wide Analysis Revealed NBS-LRR Gene ... [https://www.mdpi.com/2073-4395/13/10/2583]
- 27. The roles of segmental and tandem gene duplication in the ... [https://bmcplantbiol.biomedcentral.com/articles/10.1186/1471-2229-4-10]
- 28. Genome-wide analysis of tandem duplicated genes and ... [https://www.frontiersin.org/journals/plant-science/articles/10.3389/fpls.2022.971999/full]
- 29. Comparative analysis, diversification, and functional ... [https://www.nature.com/articles/s41598-024-62876-5]
- 30. Genomic convergence in terrestrial root plants through ... [https://www.sciencedirect.com/science/article/pii/S2211124724011379]
- 31. Different patterns of gene structure divergence following gene ... [https://bmcgenomics.biomedcentral.com/articles/10.1186/1471-2164-14-652]
- 32. Segmental and Tandem Duplications Driving the Recent ... [https://pmc.ncbi.nlm.nih.gov/articles/PMC6316259/]
- 33. Genome-Wide Identification and Expression Analysis of NBS ... [https://pmc.ncbi.nlm.nih.gov/articles/PMC4169499/]
- 34. Genome-wide identification, phylogenetic and expression ... [https://www.frontiersin.org/journals/plant-science/articles/10.3389/fpls.2025.1596930/full]
- 35. Repetitive DNA sequence detection and its role in the ... [https://www.nature.com/articles/s42003-023-05322-y]
- 36. Pytrf: a python package for finding tandem repeats from ... [https://bmcbioinformatics.biomedcentral.com/articles/10.1186/s12859-025-06168-3]
- 37. Tandem and segmental gene duplication and ... [https://www.sciencedirect.com/science/article/abs/pii/S0168952504000228]
- 38. A comparison of software for analysis of rare and common ... [https://journals.plos.org/plosone/article?id=10.1371/journal.pone.0300545]
- 39. ULTRA: A Model Based Tool to Detect Tandem Repeats - PMC [https://pmc.ncbi.nlm.nih.gov/articles/PMC6508075/]
- 40. Analysis and benchmarking of small and large genomic ... [https://pmc.ncbi.nlm.nih.gov/articles/PMC11952744/]
- 41. Relative evolutionary rates of NBS-encoding genes ... [https://pubmed.ncbi.nlm.nih.gov/21080199/]
- 42. Genome-wide identification of NBS-encoding resistance ... [https://pmc.ncbi.nlm.nih.gov/articles/PMC2777221/]
- 43. The impact of tandem duplication on gene evolution in ... [https://www.sciencedirect.com/science/article/pii/S2095311921636985]
- 44. Genome-wide comparative analysis of NBS-encoding genes ... [https://bmcgenomics.biomedcentral.com/articles/10.1186/1471-2164-15-3]
- 45. Do duplication-inducing elements 'cooperate' with genes in ... [https://pmc.ncbi.nlm.nih.gov/articles/PMC12573847/]
- 46. Genome-wide identification and characterization of NBS ... [https://pmc.ncbi.nlm.nih.gov/articles/PMC7814608/]
- 47. Novel disease resistance gene paralogs created by ... [https://pmc.ncbi.nlm.nih.gov/articles/PMC8184530/]
- 48. Uncovering the multi-layer cis-regulatory landscape of rice via ... [https://genomebiology.biomedcentral.com/articles/10.1186/s13059-025-03715-2]
- 49. Genome-scale perturbation of lncRNA expression using ... [https://pmc.ncbi.nlm.nih.gov/articles/PMC7917014/]
- 50. Species-specific duplications driving the recent expansion of ... [https://bmcgenomics.biomedcentral.com/articles/10.1186/s12864-015-1291-0]
- 51. Structural characterization and duplication modes of ... [https://www.nature.com/articles/s41598-021-84778-6]
- 52. Tips for improving genome annotation quality [https://www.maxapress.com/article/id/67e36fa6fa6c5866a7a3e810]
- 53. Progress, Challenges, and Surprises in Annotating the Human ... [https://pmc.ncbi.nlm.nih.gov/articles/PMC7116059/]
- 54. -Wide Tool for Genome de novo Identification and... Sensitive [https://pmc.ncbi.nlm.nih.gov/articles/PMC11656428/]
- 55. Frontiers | Incidence and disease spectrum of inherited metabolic... [https://www.frontiersin.org/journals/pediatrics/articles/10.3389/fped.2025.1629840/full]
- 56. robust detection of tandem repeat expansions from long DNA ... [https://genomebiology.biomedcentral.com/articles/10.1186/s13059-019-1667-6]
- 57. Accurate detection of tandem repeats exposes ubiquitous ... [https://pmc.ncbi.nlm.nih.gov/articles/PMC12418385/]
- 58. Get ready for short tandem repeats analysis using long ... [https://www.frontiersin.org/journals/genetics/articles/10.3389/fgene.2025.1610026/full]
- 59. Accurate Detection of Tandem Repeats from Error-Prone ... [https://pmc.ncbi.nlm.nih.gov/articles/PMC11580891/]
- 60. ParaMask: a new method to identify multicopy genomic ... [https://pmc.ncbi.nlm.nih.gov/articles/PMC12551310/]
- 61. Evolutionary Conservation and Pre-Activated Immunity of ... [https://www.frontiersin.org/journals/plant-science/articles/10.3389/fpls.2025.1656786/full]
- 62. Exploring the size limits of Bionano optical genome mapping ... [https://genomemedicine.biomedcentral.com/articles/10.1186/s13073-025-01571-0]
- 63. Structural Variants: Mechanisms, Mapping, and Interpretation ... [https://pmc.ncbi.nlm.nih.gov/articles/PMC12385565/]
- 64. Repeat or not repeat?—Statistical validation of tandem ... [https://pmc.ncbi.nlm.nih.gov/articles/PMC3488214/]
- 65. TRsv: simultaneous detection of tandem repeat variations ... [https://genomebiology.biomedcentral.com/articles/10.1186/s13059-025-03718-z]
- 66. a long-read benchmark for genetic variants - PubMed - NIH [https://pubmed.ncbi.nlm.nih.gov/40759746/]
- 67. PRGminer: harnessing deep learning for the prediction of ... [https://www.frontiersin.org/journals/plant-science/articles/10.3389/fpls.2025.1411525/full]
- 68. Comparative genomics profiling revealed multi-stress ... [https://pmc.ncbi.nlm.nih.gov/articles/PMC10642748/]
- 69. Genomic regions and candidate genes linked with ... [https://pmc.ncbi.nlm.nih.gov/articles/PMC8684135/]
- 70. Identifying candidate genes for Phytophthora capsici ... [https://www.nature.com/articles/s41598-019-46342-1]
- 71. Genome-wide identification, characterization, and ... [https://www.sciencedirect.com/science/article/abs/pii/S0378111922009374]
- 72. Comparative genomics and bioinformatics approaches ... [https://www.frontiersin.org/journals/genetics/articles/10.3389/fgene.2024.1358134/full]
- 73. Genome-Wide Analysis of NBS-LRR Genes From an Early ... [https://pmc.ncbi.nlm.nih.gov/articles/PMC9140740/]
- 74. An NLR paralog Pit2 generated from tandem duplication of ... [https://www.nature.com/articles/s41467-024-48943-5]
- 75. Phylogenetic Analyses and Transcriptional Survey Reveal ... [https://www.mdpi.com/2073-4395/13/4/970]
- 76. Recent advances in deep learning for protein-protein interaction [https://pmc.ncbi.nlm.nih.gov/articles/PMC12168265/]
- 77. Visualization of protein interaction networks: problems and ... [https://bmcbioinformatics.biomedcentral.com/articles/10.1186/1471-2105-14-S1-S1]
- 78. Comparative Genomics Reveals Gene Duplication and ... [https://www.mdpi.com/2311-7524/11/2/209]
- 79. Identification and Characterization of NBS Resistance ... [https://www.frontiersin.org/journals/plant-science/articles/10.3389/fpls.2021.758559/full]
- 80. Distinct Patterns of Gene Gain and Loss [https://pmc.ncbi.nlm.nih.gov/articles/PMC5427506/]
- 81. Genome-Wide Comparative Analyses Reveal the Dynamic ... [https://www.frontiersin.org/journals/plant-science/articles/10.3389/fpls.2016.01205/full]
- 82. Solanaceae pan-genomes reveal extensive fractionation and ... [https://pmc.ncbi.nlm.nih.gov/articles/PMC11956106/]
- 83. Segmental and Tandem Duplications Driving the Recent ... [https://pubmed.ncbi.nlm.nih.gov/30477134/]