Strategies for Enhancing Long-Term Stability in Enzymatic Hydrogen Peroxide Sensors
Enzymatic hydrogen peroxide (H₂O₂) sensors are pivotal in biomedical research, clinical diagnostics, and drug development for monitoring metabolites and disease biomarkers.
Strategies for Enhancing Long-Term Stability in Enzymatic Hydrogen Peroxide Sensors
Abstract
Enzymatic hydrogen peroxide (H₂O₂) sensors are pivotal in biomedical research, clinical diagnostics, and drug development for monitoring metabolites and disease biomarkers. However, their widespread application is hindered by limited long-term stability, driven by factors such as enzyme inactivation and sensor fouling. This article synthesizes current research to address these challenges, exploring the fundamental mechanisms of sensor degradation and presenting advanced solutions. We examine innovative material designs, including nanostructured supports and biomimetic enzymatic cascades, alongside novel sensor architectures like self-powered systems. A comparative analysis of enzymatic versus non-enzymatic approaches provides a framework for selecting optimal sensor configurations based on application-specific requirements for stability, sensitivity, and cost. This resource is tailored for researchers and professionals seeking to develop robust, reliable H₂O₂ sensing platforms for long-term biomedical and clinical use.
Understanding the Core Challenges: Why Enzymatic H₂O₂ Sensors Lose Stability
The Critical Role of H₂O₂ Sensing in Biomedical and Clinical Applications
Why is the long-term stability of enzymatic H₂O₂ sensors a major concern in clinical research?
Enzymatic H₂O₂ sensors often rely on biological recognition elements like horseradish peroxidase (HRP). While these enzymes provide excellent initial selectivity, their practical application is restricted by inherent drawbacks, including high cost, complicated fabrication, and a lack of stability over time [1]. The enzymatic activity degrades with use and storage, leading to signal drift and unreliable data in long-term experiments, which is critical for continuous monitoring in biomedical applications [1] [2].
What are the primary alternatives to enzymatic sensors?
Non-enzymatic (or enzymeless) electrochemical sensors are a leading alternative. These sensors use advanced nanomaterials to catalyze the reaction of H₂O₂ directly, bypassing the need for fragile enzymes. Catalysts such as nickel oxide (NiO) octahedrons decorated on 3D graphene hydrogel (3DGH) have demonstrated high sensitivity, a wide linear range, and significantly improved long-term stability [1]. Other approaches involve using biomimetic materials and nanozymes—synthetic nanomaterials that mimic the catalytic activity of natural enzymes—which offer better stability and broader application conditions [2].
What common interferents affect H₂O₂ sensing in biological samples?
Biological fluids contain various molecules that can interfere with H₂O₂ measurements. Key interferents include other reactive oxygen species (ROS) like peroxynitrite (ONOO⁻) and hypochlorous acid (HOCl), as well as common biochemicals such as ascorbic acid (AA), uric acid (UA), and dopamine (DA) [3] [4]. A well-designed sensor must exhibit high selectivity for H₂O₂ over these substances.
How does pH impact H₂O₂ sensing?
The pH of the sample medium can significantly impact the sensor's performance. Many optical probes rely on pH-sensitive indicator dyes, such as fluorescein, whose fluorescence is highly dependent on the pH of the environment [3]. For consistent and quantitative results, the pH must be carefully controlled and buffered, or pH-independent sensing materials should be selected.
Troubleshooting Guide: Common Experimental Challenges
| Challenge | Root Cause | Proposed Solution |
|---|---|---|
| Signal Drift | Enzyme deactivation (enzymatic sensors); Fouling of electrode surface; Unstable power source (for conventional electrochemistry). | Transition to non-enzymatic catalysts (e.g., NiO, nanozymes); Implement a self-powered sensor design to eliminate external power variability [2]. |
| Low Sensitivity | Inefficient electron transfer between catalyst and electrode; Depleted enzyme activity. | Use composite materials with high surface area (e.g., 3D graphene hydrogel) [1]; Decorate substrate with catalytic nanostructures (e.g., Pt, Au, MnO₂) [4]. |
| Poor Selectivity | Catalyst reacts with other ROS (e.g., ONOO⁻) or biological molecules (e.g., UA, AA). | Employ selective catalysts like Prussian blue or its derivatives [5]; Use a selective membrane coating (if compatible); Optimize the applied electrochemical potential. |
| Short Sensor Lifespan | Physical degradation of the enzyme or the sensing material; Leaching of catalytic components. | Utilize robust, structurally stable supports like 3D graphene; Employ synthetic nanozymes known for their operational and storage stability [1] [2]. |
Quantitative Performance Data for H₂O₂ Sensors
The following table summarizes the performance metrics of selected sensor types, highlighting the potential of non-enzymatic strategies for stable sensing.
| Sensor Type / Material | Detection Limit | Linear Range | Sensitivity | Key Stability / Selectivity Notes |
|---|---|---|---|---|
| Enzymatic (HRP-based) | ~ Low nM range | Varies | High, but degrades | Lacks long-term stability; susceptible to environmental conditions [1] [2]. |
| 3DGH/NiO25 Nanocomposite | 5.3 µM [1] | 10 µM – 33.58 mM [1] | 117.26 µA mM⁻¹ cm⁻² [1] | Good selectivity, reproducibility, and long-term stability; Non-enzymatic [1]. |
| Luminol-based (with catalyst) | 1.8 nM [5] | Not Specified | Not Specified | Chemiluminescence assay; Not a continuous sensor [5]. |
| Flexible Sensors (General) | 100 nM – 1 mM [4] | Varies | Varies | Performance depends heavily on substrate and nanostructures used (e.g., Pt, Fe₃O₄) [4]. |
| H₂O₂ Self-Powered Sensor | Not Specified | Not Specified | Depends on OCP/Current | No external power needed; potential for high stability with nanozyme catalysts [2]. |
Experimental Protocols for Key Methodologies
Protocol: Fabrication of a Non-Enzymatic 3DGH/NiO Sensor Electrode
This protocol is adapted from recent research on developing stable, enzymeless sensors [1].
Principle: A three-dimensional graphene hydrogel (3DGH) provides a high-surface-area, conductive scaffold. Nickel oxide (NiO) octahedrons serve as the durable, non-enzymatic electrocatalyst for H₂O₂ reduction.
Materials & Reagents:
- Graphene Oxide (GO): Synthesized via a modified Hummers method.
- Nickel Precursor: Nickel(II) nitrate hexahydrate (Ni(NO₃)₂·6H₂O).
- Hard Template: Mesoporous silica (SBA-15).
- Solvent: Anhydrous ethanol (EtOH).
- Etching Solution: Sodium hydroxide (NaOH, 2 M).
- Buffer: Phosphate buffer solution (PBS, 0.1 M, pH 7.4).
Procedure:
- Synthesis of NiO Octahedrons:
- Dissolve 10 mg of SBA-15 silica in 100 mL of ethanol containing 10 mg of nickel nitrate hexahydrate. Stir for 24 hours at room temperature.
- Dry the mixture at 80°C for 48 hours. Grind the resulting powder and repeat the impregnation and drying steps.
- Calcinate the final product in a muffle furnace at 550°C for 3 hours with a heating rate of 2°C per minute.
- To remove the silica template, treat the calcinated powder with 2 M NaOH at 60°C. Wash repeatedly with ethanol and deionized water, then dry in a vacuum oven at 70°C for 12 hours.
- Self-Assembly of 3DGH/NiO Nanocomposite:
- Disperse 48 mg of GO in 32 mL of deionized water with 12 mg of the as-prepared NiO octahedrons. Use bath sonication for 2 hours followed by probe sonication for 1.5 hours to create a homogeneous suspension.
- Transfer the mixture to a 45 mL Teflon-lined autoclave and maintain at 180°C for 12 hours for the hydrothermal reaction.
- After natural cooling to room temperature, wash the resulting 3DGH/NiO25 hydrogel numerous times with deionized water. Finally, freeze-dry the product to obtain the final nanocomposite.
- Electrode Modification:
- Prepare an ink by dispersing the 3DGH/NiO25 nanocomposite in a suitable solvent (e.g., water/ethanol mixture with a binder like Nafion).
- Drop-cast a calculated volume of the ink onto a clean glassy carbon electrode (GCE) and allow it to dry under ambient conditions.
Protocol: Measuring H₂O₂ in a Real Sample (Milk)
This procedure outlines the application of a developed sensor for real-sample analysis, demonstrating its practical utility [1].
Principle: The non-enzymatic sensor electrocatalyzes the reduction of H₂O₂, producing a current proportional to its concentration. The standard addition method is used to account for the complex sample matrix.
Materials:
- Prepared 3DGH/NiO25-modified working electrode.
- Standard Ag/AgCl reference electrode and a platinum wire counter electrode (for three-electrode setup).
- Electrochemical workstation (e.g., for chronoamperometry).
- Fresh milk samples.
- Standard H₂O₂ solutions of known concentration.
Procedure:
- Sample Preparation: Dilute the milk sample with a supporting electrolyte (e.g., 0.1 M PBS, pH 7.4) to minimize matrix effects. Filter if necessary.
- Calibration: Perform chronoamperometry measurements in standard H₂O₂ solutions in PBS to establish a calibration curve (current vs. concentration).
- Standard Addition:
- Measure the current response of the prepared milk sample.
- Spike the milk sample with known, successive increments of standard H₂O₂ solution.
- Measure the current after each addition.
- Analysis: Plot the current response against the added H₂O₂ concentration. The absolute value of the x-intercept of this plot corresponds to the concentration of H₂O₂ in the original milk sample.
Essential Research Reagent Solutions
The table below lists key materials used in the development of advanced H₂O₂ sensors.
| Research Reagent | Function in H₂O₂ Sensor Development |
|---|---|
| Graphene Oxide (GO) / 3D Graphene Hydrogel (3DGH) | Provides a high-surface-area, conductive 3D scaffold that prevents restacking, enhances electron transport, and supports catalyst loading [1]. |
| Transition Metal Oxides (e.g., NiO, MnO₂, Fe₃O₄) | Act as non-enzymatic, nanozyme catalysts for H₂O₂ reduction or oxidation, offering high stability and abundance [1] [4]. |
| Prussian Blue (PB) and Analogues | A well-known "artificial peroxidase" biomimetic catalyst. It selectively reduces H₂O₂ at low potentials, minimizing interference from other species [5] [2]. |
| Noble Metal Nanostructures (e.g., Pt, Au, Ag NPs) | Serve as highly active catalysts for H₂O₂ decomposition, often used to enhance sensitivity in both electrochemical and colorimetric sensors [4]. |
| Luminol | A chemiluminescent probe that reacts with H₂O₂ to produce light. Used in highly sensitive assays, but typically in an irreversible, non-continuous manner [5]. |
| Phosphate Buffered Saline (PBS) | The standard medium for maintaining a stable pH (typically 7.4) during electrochemical and optical sensing, which is crucial for obtaining reproducible results [1] [3]. |
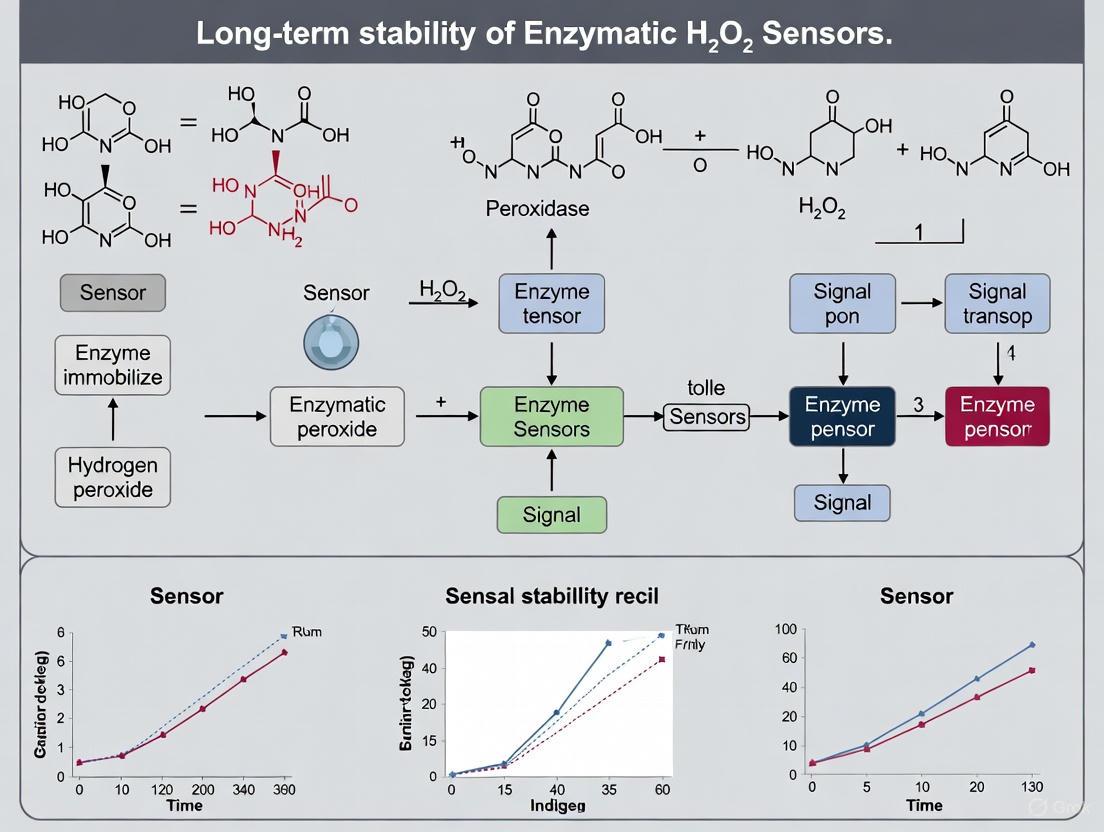
Sensor Architecture & Workflow Diagrams
Frequently Asked Questions (FAQs)
Q1: What are the most common causes of signal drift in enzymatic hydrogen peroxide sensors? The primary causes are the three degradation pathways covered in this guide: enzyme leaching (the physical loss of the enzyme from the sensor surface), enzyme inactivation (the loss of enzymatic activity), and surface fouling (the non-specific adsorption of proteins or other molecules onto the sensor surface). Enzyme inactivation can occur when the sensor is exposed to harsh environmental conditions, such as incorrect pH or temperature, or by direct chemical inactivation from its own substrate, hydrogen peroxide [6] [7] [8].
Q2: How can I experimentally determine which degradation pathway is affecting my sensor? A systematic troubleshooting approach is required. The diagnostic flow diagram below outlines a series of experiments to isolate the root cause. Key steps include measuring recovered activity after washing and re-calibration, inspecting the electrode surface, and testing with fresh enzyme solution [7].
Q3: Why are non-enzymatic sensors being developed for hydrogen peroxide detection? While enzymatic sensors are highly selective, their operational lifetime is limited by the inherent instability of the biological component. Non-enzymatic sensors, often based on nanomaterials like ceria nanoparticles (CNPs) or metal oxides (e.g., NiO), offer superior stability across a wider range of pH and temperatures, and are not susceptible to enzyme-specific degradation pathways [8] [1]. This makes them promising for long-term or harsh condition applications.
Q4: What is the role of nanomaterials in mitigating these degradation pathways? Nanomaterials play a dual role. They provide a high-surface-area scaffold that can increase enzyme loading and reduce leaching through strong physical adsorption or covalent bonding. Secondly, conductive nanomaterials like carbon nanotubes or graphene hydrogel can enhance electron transfer, which can improve both sensitivity and stability [7] [1]. Using nanostructured materials like 3D graphene hydrogel prevents agglomeration and increases the number of electrochemically active sites [1].
Troubleshooting Guide: Diagnostic Flowchart
The following diagram outlines a logical workflow for diagnosing the primary degradation pathways in enzymatic H₂O₂ sensors.
Quantitative Data on Degradation Pathways and Mitigation
The following table summarizes experimental data related to sensor degradation and the efficacy of various mitigation strategies, as reported in the literature.
Table 1: Experimental Data on Degradation Pathways and Mitigation Strategies
| Degradation Pathway | Experimental Observation / Mitigation Strategy | Key Quantitative Result / Performance Change | Source |
|---|---|---|---|
| Enzyme Inactivation | H₂O₂-induced inactivation of carbonyl reductase in tobacco BY-2 cells. | 1.0 mM H₂O2 led to enzyme inactivation and programmed cell death, while a 0.5 mM dose was sublethal. | [6] |
| Enzyme Inactivation | Horseradish peroxidase (HRP) activity loss due to environmental factors. | HRP loses >60% activity when pH shifts from 8 to 4, and ~30% activity when temperature drops from 40°C to 20°C. | [8] |
| Mitigation: Advanced Materials | Use of 3D Graphene Hydrogel/NiO octahedron nanocomposite (non-enzymatic). | Achieved wide linear range (10 µM–33.58 mM) and good sensitivity (117.26 µA mM⁻¹ cm⁻²), avoiding enzyme-specific degradation. | [1] |
| Mitigation: Advanced Materials | Use of Ceria Nanoparticles (CNPs) with varying Ce³⁺:Ce⁴⁺ ratios (non-enzymatic). | Enabled pico-molar detection (LOQ: 0.1 pM) and remained functional across a wide range of pH and temperatures. | [8] |
| Mitigation: Immobilization | Co-immobilization of Catalase (CAT) and D-amino acid oxidase (DAAO) on a cationic carrier. | Retained ~80% of the enzyme's specific activity post-immobilization, enhancing stability. | [9] |
Detailed Experimental Protocols
Protocol: Investigating Enzyme Inactivation via Chronoamperometry
This protocol is designed to quantitatively assess the stability of an enzymatic H₂O₂ sensor under operational conditions by monitoring signal decay over time.
- Principle: A constant potential is applied to the working electrode, and the current generated by the oxidation/reduction of H₂O₂ is measured continuously. A steady decrease in current under constant H₂O₂ concentration indicates a loss of enzymatic activity, potentially due to inactivation by H₂O₂ or other environmental factors [6] [10].
- Materials:
- Potentiostat and electrochemical cell.
- Enzymatic H₂O₂ sensor (working electrode), reference electrode (e.g., Ag/AgCl), and counter electrode.
- Stirred phosphate buffer (0.1 M, pH 7.4) at constant temperature.
- Standard H₂O₂ solution.
- Procedure:
- Place the electrochemical cell containing the buffer solution in a temperature-controlled holder.
- Immerse the three-electrode system and begin stirring.
- Apply the predetermined working potential (e.g., +0.7 V vs. Ag/AgCl for H₂O₂ oxidation).
- Allow the background current to stabilize.
- Inject a known volume of standard H₂O₂ solution to achieve a specific concentration (e.g., 0.5 mM).
- Record the amperometric current until a stable plateau is reached. This is your initial signal (Iinitial).
- Continue the experiment for several hours, periodically spiking the same amount of H₂O₂ and recording the steady-state current.
- Plot the normalized current (I / Iinitial) over time. The slope of the decay is a direct measure of the sensor's operational stability.
Protocol: Assessing Surface Fouling in Complex Media
This protocol tests the sensor's antifouling properties and its practical applicability in real biological samples.
- Principle: The sensor's performance is compared in a clean buffer versus a complex, protein-rich medium like blood serum or milk. A significant loss of sensitivity and linearity in the complex medium indicates surface fouling [8] [1].
- Materials:
- Fully characterized enzymatic H₂O₂ sensor.
- Phosphate buffer (0.1 M, pH 7.4).
- Blood serum or milk sample.
- Standard H₂O₂ solutions.
- Procedure:
- Calibrate the sensor in phosphate buffer by successively adding standard H₂O₂ solutions and measuring the current response. Record the calibration curve (current vs. concentration) and calculate the sensitivity.
- Rinse the sensor thoroughly with clean buffer.
- Immerse the sensor in the serum or milk sample for a predetermined period (e.g., 30-60 minutes) to simulate exposure.
- Rinse the sensor again to remove loosely adsorbed material.
- Perform a second calibration in fresh phosphate buffer.
- Compare the post-exposure sensitivity and linear range to the initial values. A large discrepancy confirms that surface fouling has occurred.
Research Reagent Solutions
The following table lists key materials used in the construction and testing of advanced H₂O₂ sensors, as cited in the literature.
Table 2: Key Research Reagents for H₂O₂ Sensor Development and Testing
| Research Reagent | Function / Role in Research | Example from Literature |
|---|---|---|
| Horseradish Peroxidase (HRP) | A common enzyme used in enzymatic H₂O₂ sensors. Catalyzes the oxidation of a mediator (e.g., ABTS) by H₂O₂, enabling indirect detection. | Immobilized on the inner surface of a solid-state nanopore for H₂O₂ sensing [11]. |
| Ceria Nanoparticles (CNPs) | Enzyme-free catalytic material. Mimics catalase activity, reducing H₂O₂ while cycling between Ce³⁺ and Ce⁴⁺ oxidation states. Offers high stability. | Used in a non-enzymatic sensor for picomolar H₂O₂ detection; performance is tuned by the Ce³⁺:Ce⁴⁺ ratio [8]. |
| 3D Graphene Hydrogel (3DGH) | A high-surface-area, conductive scaffold. Prevents restacking of graphene sheets, facilitating electron transfer and providing ample sites for catalyst immobilization. | Served as a support for NiO octahedrons, creating a highly sensitive non-enzymatic H₂O₂ sensor [1]. |
| Nickel Oxide (NiO) | A transition metal oxide with good electrocatalytic properties for H₂O₂ reduction. Used in non-enzymatic sensors for its stability and low cost. | Synthesized as octahedrons and decorated on 3DGH to create a composite sensor electrode [1]. |
| Carbon Nanotubes (CNTs) | Nanomaterial used to modify electrodes. Enhances electrical conductivity, increases surface area, and can improve enzyme loading and stability when used in composites. | Incorporated into an iron-nickel alloy/ionic liquid crystal composite to enhance the electrochemical response for H₂O₂ determination [12]. |
The Impact of Hydrogen Peroxide Byproducts on Sensor Component Integrity
Troubleshooting Guide: Common H₂O₂ Sensor Failure Modes
This guide addresses frequent issues researchers encounter due to hydrogen peroxide byproducts in enzymatic hydrogen peroxide sensors, along with diagnostic steps and solutions.
Symptom 1: Gradual Signal Drift and Loss of Sensitivity
- Problem: Sensor output signal gradually declines over time, requiring frequent recalibration.
- Underlying Cause: Hydrogen peroxide (H₂O₂) byproducts cause photobleaching of optical components and oxidative degradation of the sensing elements [13]. In electrochemical sensors, H₂O₂ can degrade the electrocatalyst layer, reducing its activity [14].
- Diagnostic Steps:
- Compare calibration curves from initial use and current state; a reduction in slope indicates sensitivity loss [13].
- For optical sensors, measure emission intensity at reference wavelengths to check for photobleaching [13].
- Test sensor performance in a standard H₂O₂ solution to check for reduced electrocatalytic response [14].
- Solutions:
- Incorporate catalase (CAT) to create an enzymatic cascade. Catalase decomposes H₂O₂ into water and oxygen, preventing its accumulation [13] [15].
- Use more robust, H₂O₂-resistant materials in the sensor construction, such as certain metal-organic frameworks (MOFs) or ordered carbonaceous frameworks (OCFs) [16] [17].
Symptom 2: Reduced Biocatalytic Enzyme Activity
- Problem: The primary enzyme (e.g., Glucose Oxidase, GOx) loses activity, leading to slower response times and reduced signal.
- Underlying Cause: High local concentrations of H₂O₂ can denature the enzyme, destroying its active site and reducing its catalytic turnover [13].
- Diagnostic Steps:
- Monitor reaction kinetics; a lengthening time to reach signal plateau suggests reduced enzymatic activity [13].
- Measure the sensor's response to a known concentration of substrate over time.
- Solutions:
Symptom 3: Cytotoxicity and Inflammatory Response in Implantable Sensors
- Problem: Implanted sensors trigger a foreign body response, leading to biofouling and isolation from the analyte.
- Underlying Cause: Accumulated H₂O₂ is cytotoxic and causes oxidative stress to surrounding tissues, exacerbating inflammatory responses [13].
- Diagnostic Steps:
- Perform histology on tissue surrounding explanted sensors to assess immune cell infiltration.
- Measure in vivo sensor performance degradation rates consistent with biofouling.
- Solutions:
Symptom 4: Unstable Baseline and Increased Noise
- Problem: The sensor baseline becomes unstable or shows increased signal noise.
- Underlying Cause: H₂O₂ can cause non-specific oxidative damage to sensor components, including electrodes and polymers, leading to erratic behavior [13] [4].
- Diagnostic Steps:
- Run the sensor in analyte-free solution and observe baseline stability.
- Perform electrochemical impedance spectroscopy to detect changes in electrode surface properties.
- Solutions:
Experimental Protocols for Validating Sensor Integrity
Protocol 1: Quantifying H₂O₂-Induced Photobleaching in Optical Sensors
This method assesses the detrimental impact of H₂O₂ on the optical components of a sensor [13].
- Sensor Preparation: Prepare your optical sensor (e.g., Pdot-GOx transducer).
- H₂O₂ Exposure:
- Divide the sensor solution into aliquots.
- Incubate these aliquots with different concentrations of H₂O₂ (e.g., 0 mM, 10 mM, 100 mM) for a set period.
- Luminescence Measurement:
- Use a spectrofluorometer to measure the emission spectra of each aliquot after exposure.
- Excitate the sensor at its optimal wavelength (e.g., 380 nm for PDHF Pdots) and record the emission intensities at key wavelengths (e.g., 425 nm and 672 nm for Pdots) [13].
- Data Analysis:
- Calculate the emission intensity ratio (I~672~/I~425~).
- Plot the emission ratio against the H₂O₂ concentration used during incubation. A significant decrease in the ratio indicates H₂O₂-induced photobleaching [13].
Protocol 2: Evaluating the Protective Effect of an Enzymatic Cascade
This protocol tests the effectiveness of adding catalase to protect sensor components [13] [15].
- Sensor Fabrication: Fabricate two sets of sensors:
- Control Sensor: With only the primary enzyme (e.g., GOx).
- Test Sensor: With the primary enzyme and catalase co-immobilized (e.g., GOx/CAT).
- Stability Testing:
- Challenge both sensors by continuously or intermittently exposing them to a solution containing a high concentration of the substrate (e.g., glucose) in a buffer.
- This continuously generates H₂O₂ in situ.
- Performance Monitoring:
- At regular time intervals, calibrate both sensors to measure their sensitivity (e.g., the slope of the calibration curve).
- Also, measure the response time to reach a signal plateau.
- Result Interpretation:
- The test sensor (GOx/CAT) should retain a significantly higher percentage of its initial sensitivity and a faster response time compared to the control sensor, demonstrating the protective role of catalase [13].
The Scientist's Toolkit: Key Research Reagent Solutions
Table 1: Essential reagents for developing stable enzymatic H₂O₂ sensors.
| Research Reagent | Function in Sensor Development | Key Utility |
|---|---|---|
| Catalase (CAT) | Decomposes hydrogen peroxide (H₂O₂) into water and oxygen, preventing its accumulation and protecting sensor components [13]. | Core component for creating enzymatic cascades to enhance sensor stability and biocompatibility [13] [15]. |
| Chitosan | A biopolymer used to form a hydrogel matrix for enzyme immobilization. Offers biocompatibility and high permeability [15]. | Creates a protective microenvironment for enzymes; can be cross-linked for improved stability in aqueous solutions [15]. |
| Glutaraldehyde | A crosslinking agent that forms stable bonds within polymeric matrices like chitosan [15]. | Enhances the mechanical and chemical stability of the immobilization matrix, preventing dissolution and enzyme leakage [15]. |
| Prussian Blue (PB) | An electrocatalyst that efficiently reduces H₂O₂ at low applied potentials [14]. | Used in electrochemical sensors for selective H₂O₂ detection, minimizing interference from other electroactive species [14]. |
| Ordered Carbonaceous Frameworks (OCFs) | Synthetic materials, such as Fe-porphyrin-derived OCFs, that mimic the catalytic activity of natural enzymes like peroxidases [17]. | Serves as a stable, non-enzymatic catalyst for H₂O₂ detection, overcoming the instability of biological enzymes [17]. |
| Metal-Organic Frameworks (MOFs) | Porous materials that can encapsulate catalytic molecules like hemin, preventing their aggregation and enhancing dispersion [16]. | Used to create biomimetic catalysts for H₂O₂ sensing with improved stability and sensitivity [16]. |
Frequently Asked Questions (FAQs)
Q1: Why is hydrogen peroxide a particular problem for long-term sensor stability? H₂O₂ is a strong oxidizing agent. In sensors, it attacks multiple components: it photobleaches optical dyes, denatures enzymatic proteins, causes oxidative damage to electrodes and polymers, and induces cytotoxicity in vivo, leading to biofouling. This multi-target degradation directly compromises sensitivity, stability, and lifespan [13] [4].
Q2: What are the main advantages of using an enzymatic cascade (e.g., GOx/CAT) over just using a more robust enzyme? While engineering robust enzymes is one strategy, the GOx/CAT cascade offers a direct and efficient solution to the root problem—H₂O₂ removal. Catalase provides a physical and chemical barrier by rapidly decomposing H₂O₂ into harmless products (H₂O and O₂) before it can damage GOx or other sensor components. This approach is highly effective and can be generalized to protect various sensor architectures [13].
Q3: Are there non-enzymatic strategies to mitigate H₂O₂ damage? Yes, non-enzymatic strategies are a major research focus. These include using nanomaterial-based catalysts like Prussian Blue or other transition metal hexacyanoferrates [14], metal oxides (e.g., NiO) decorated on 3D graphene [1], and biomimetic structures such as hemin-encapsulated MOFs [16] or ordered carbonaceous frameworks (OCFs) [17]. These materials mimic the function of peroxidases or catalase while offering greater stability.
Q4: How can I test whether my sensor's failure is due to H₂O₂ damage or other factors like enzyme leaching? A controlled experiment is key. Compare the stability of two sensors: one with your standard configuration and another with added H₂O₂-scavenging capability (e.g., with catalase or a non-enzymatic catalyst). If the scavenger-equipped sensor shows significantly improved longevity, H₂O₂ damage is a likely failure mode. To rule out leaching, measure enzyme activity in the storage buffer after sensor use [15].
Diagnostic Diagrams for H₂O₂ Sensor Failure
Analyzing the Limitations of Traditional Immobilization and Electrode Materials
Troubleshooting Guides
Guide 1: Addressing Limited Operational Stability in Enzymatic H₂O₂ Sensors
Problem: Gradual loss of sensor signal and sensitivity during repeated use or over time. Primary Issue: Enzyme leaching or denaturation from the electrode surface. Solution: Evaluate and optimize your enzyme immobilization strategy.
| Troubleshooting Step | Procedure & Key Parameters | Expected Outcome & Quantitative Benchmark |
|---|---|---|
| 1. Diagnose Leaching | Immerse the sensor in a gentle buffer (e.g., 0.1 M PBS, pH 7.4) for 1-2 hours with mild agitation. Measure the enzyme activity in the buffer supernatant. | A well-immobilized enzyme should show <5% activity in the supernatant after 2 hours [18]. |
| 2. Assess Denaturation | Subject the sensor to its intended operational conditions (e.g., temperature, pH) and monitor activity loss over time via chronoamperometry. | A robust sensor should retain >90% initial activity after 10-15 operational cycles or 24 hours of continuous use [18] [19]. |
| 3. Switch Immobilization Method | If leaching is high, transition from physical adsorption to covalent bonding (e.g., using EDC/NHS chemistry on a carboxylated surface) or entrapment within a polymer matrix like Nafion or alginate. | Covalent immobilization can reduce leaching to <2% and significantly enhance operational stability, allowing for 50+ reuses [18] [19]. |
| 4. Optimize Support Matrix | Use a hydrophilic, inert support like glyoxyl-agarose to minimize uncontrolled enzyme-support interactions that can cause denaturation. | This can lead to a 10-100 fold increase in functional stability compared to poorly controlled immobilization [18]. |
Guide 2: Overcoming Mass Transfer and Conductivity Limitations
Problem: Reduced sensor sensitivity, slow response time, or poor signal-to-noise ratio. Primary Issue: Inefficient diffusion of H₂O₂ to the active site or poor electrical communication between the enzyme and the electrode. Solution: Redesign the electrode nanomaterial composite for enhanced performance.
| Troubleshooting Step | Procedure & Key Parameters | Expected Outcome & Quantitative Benchmark |
|---|---|---|
| 1. Analyze Pore Size | Characterize the support material using BET surface area analysis. Ensure the average pore diameter is significantly larger than the enzyme's hydrodynamic radius. | A pore size 5-10 times larger than the enzyme can minimize diffusion limitations, improving response time to <3-5 seconds [18]. |
| 2. Enhance Electrode Conductivity | Integrate high-surface-area, conductive nanomaterials. Synthesize a composite by drop-casting a dispersion of 3D Graphene Hydrogel (3DGH) and metal oxides (e.g., NiO) onto the electrode. | The 3DGH structure provides a vast surface area and superior electron transport, leading to a sensitivity increase of over 100 µA mM⁻¹ cm⁻² for H₂O₂ detection [1]. |
| 3. Incorporate Nanozymes | Decorate your electrode with peroxidase-mimicking nanomaterials like Prussian Blue (PB) or Fe@PCN-224. These provide catalytic sites and can work in tandem with enzymes. | PB-based sensors can achieve a low detection limit (e.g., 5.19 nM) and maintain nearly stable current output for over 2300 seconds [20] [21]. |
Frequently Asked Questions (FAQs)
FAQ 1: What are the fundamental trade-offs when choosing a classical enzyme immobilization technique?
Each classical method presents a unique set of advantages and disadvantages that directly impact sensor performance. The table below provides a comparative summary.
| Technique | Key Advantages | Key Disadvantages & Impact on Sensor Stability |
|---|---|---|
| Adsorption / Ionic Binding | Simple, inexpensive, minimal enzyme conformation change [19]. | Weak binding leads to enzyme leaching during operation, resulting in rapid signal drift and short sensor lifespan [18] [19]. |
| Entrapment / Encapsulation | High enzyme loading, protects enzyme from harsh microenvironment (e.g., surfactants) [18]. | Mass transfer limitations can slow response time; potential for enzyme leakage if matrix pores are too large [18] [19]. |
| Covalent Binding | Strong attachment prevents leaching, allowing for excellent reusability and long-term operational stability [18] [19]. | Risk of enzyme denaturation if protocol is poorly controlled; multi-step process requiring specific support functionalization [18] [22]. |
| Cross-Linking | High enzyme stability; carrier-free approach [19]. | Can lead to significant activity loss due to diffusion issues and harsh chemical conditions during aggregation [19]. |
FAQ 2: Beyond enzymes, what are the limitations of traditional electrode materials like bare gold or glassy carbon?
Traditional electrode materials often lack the necessary catalytic activity and surface area for high-performance sensors.
- Low Sensitivity and High Overpotential: Bare electrodes often require a high applied voltage to oxidize/reduce H₂O₂, which can also oxidize other interfering species, reducing selectivity [21] [1].
- Fouling and Passivation: The electrode surface can be contaminated by adsorption of proteins or reaction by-products, leading to a continuous decline in signal [23] [1].
- Limited Functional Groups: It is challenging to achieve high-density, stable enzyme immobilization on bare electrodes without extensive surface modification.
FAQ 3: My enzymatic sensor works initially but fails in complex real samples like serum or milk. What could be the cause?
This is a classic issue of biofouling and interferents.
- Biofouling: Proteins and other biomolecules in the sample can non-specifically adsorb onto your sensor surface, blocking the active sites and reducing sensitivity.
- Electrochemical Interferents: Species like ascorbic acid (AA), uric acid (UA), and acetaminophen are common in biological fluids and are easily oxidized at similar potentials as H₂O₂, creating a false positive signal [23] [1].
- Solution: Incorporate a protective, selective membrane like Nafion. Nafion is a perfluorosulfonated polymer that carries a negative charge, effectively repelling common anionic interferents like AA and UA while allowing neutral H₂O₂ to diffuse through [20] [21].
FAQ 4: Are non-enzymatic sensors a viable alternative for long-term H₂O₂ monitoring?
Yes, non-enzymatic sensors are a promising strategy to overcome the intrinsic instability of biological components. They utilize nanomaterials with inherent peroxidase-like activity (nanozymes).
| Aspect | Enzymatic Sensors | Non-Enzymatic Sensors |
|---|---|---|
| Selectivity | Very High due to specific enzyme-substrate recognition [24]. | Moderate to Low; can be affected by other electroactive species [20] [24]. |
| Long-Term Stability | Limited by enzyme denaturation over time (days to weeks) [23] [24]. | Excellent; inorganic materials are stable for weeks to months [20] [1]. |
| Sensitivity | Can be very high. | Can be engineered to be very high with advanced nanomaterials [21] [1]. |
| Key Challenge | Maintaining enzyme activity under operational stress. | Achieving sufficient selectivity in complex media [20] [24]. |
For applications requiring extreme long-term stability over absolute biological specificity, non-enzymatic sensors are a highly viable alternative.
Experimental Protocols for Cited Key Studies
This protocol details the creation of a highly stable metal-organic framework (MOF) based non-enzymatic sensor.
1. Synthesis of PCN-224 MOF:
- Dissolve 50 mg of H₂TCPP (tetrakis(4-carboxyphenyl)porphyrin), 150 mg of ZrOCl₂·8H₂O, and 1.4 g of benzoic acid in 50 mL of DMF.
- Heat the solution at 90°C for 5 hours with stirring.
- Collect the resulting PCN-224 nanoparticles by centrifugation and wash three times with fresh DMF.
2. Iron Incorporation to form Fe@PCN-224:
- Disperse 60 mg of PCN-224 and 80 mg of FeCl₃ in 20 mL DMF.
- Stir for 30 minutes at room temperature, then heat at 120°C with stirring (300 rpm) for 8 hours.
- Collect Fe@PCN-224 by centrifugation, wash three times with DMF, and store in fresh DMF.
3. Electrode Modification:
- Prepare a homogeneous ink by dispersing Fe@PCN-224 in a Nafion solution (e.g., 0.5% in ethanol).
- Drop-cast a precise volume (e.g., 5 µL) of the ink onto a polished glassy carbon electrode (GCE).
- Allow the solvent to evaporate at room temperature to form a stable Fe@PCN-224/Nafion/GCE sensor.
This method creates a 3D conductive network decorated with catalytic NiO octahedrons.
1. Synthesis of NiO Octahedrons (Hard Template Method):
- Dissolve 10 mg of mesoporous silica (SBA-15) in 100 mL of ethanol containing 10 mg of Ni(NO₃)₂·6H₂O. Stir for 24 hours.
- Dry the mixture at 80°C for 48 hours. Grind the powder and repeat the rinsing/drying process.
- Calcinate the product in a muffle furnace at 550°C for 3 hours (heating rate: 2°C/min).
- Remove the silica template by treating the product with 2 M NaOH at 60°C. Wash thoroughly with ethanol and water, then dry.
2. Self-Assembly of 3DGH/NiO Nanocomposite:
- Disperse 48 mg of Graphene Oxide (GO) and 12 mg of the as-synthesized NiO octahedrons in 32 mL deionized water via bath sonication (2 h) and probe sonication (1.5 h).
- Transfer the mixture to a 45 mL Teflon-lined autoclave and maintain at 180°C for 12 hours.
- After cooling, wash the resulting 3D hydrogel and freeze-dry to obtain the final 3DGH/NiO25 nanocomposite.
Experimental Workflow: Sensor Fabrication and Testing
The Scientist's Toolkit: Essential Research Reagents & Materials
This table lists key materials used in the featured experiments for developing advanced H₂O₂ sensors.
| Item | Function & Rationale |
|---|---|
| ZrOCl₂·8H₂O | Metal cluster source for constructing stable Zr-based MOFs (e.g., PCN-224) [20]. |
| Tetrakis(4-carboxyphenyl)porphyrin (H₂TCPP) | Organic linker molecule used to synthesize porphyrinic MOFs, which can host active metal ions [20]. |
| Nafion Perfluorinated Resin | A proton-conductive polymer used as a dispersant for nanomaterials and, crucially, as an anti-fouling/anti-interferent membrane [20] [21]. |
| Graphite Powder (for GO synthesis) | Starting material for synthesizing Graphene Oxide (GO), which is the precursor to 3D Graphene Hydrogels [1]. |
| Nickel(II) nitrate hexahydrate | Precursor for synthesizing nickel oxide (NiO) nanostructures, which provide excellent electrocatalytic activity for H₂O₂ oxidation [1]. |
| EDC & NHS | Cross-linking agents for zero-length covalent immobilization of enzymes onto surfaces containing carboxylic acid groups [22]. |
| Streptavidin | Protein pre-immobilized on surfaces to capture biotin-tagged enzymes or ligands, enabling oriented and controlled immobilization [22]. |
Logical Relationships in Sensor Material Design
Advanced Materials and Novel Sensor Architectures for Enhanced Durability
Frequently Asked Questions (FAQs)
Q1: What are the primary advantages and disadvantages of covalent cross-linking for enzymatic H₂O₂ sensors?
Covalent cross-linking creates strong, stable bonds between the enzyme and the support matrix, which significantly reduces enzyme leaching and extends the sensor's operational life. A key advantage is the excellent reusability; for instance, HRP-PDMS biosensors can be used up to 60 times while maintaining 90% of their initial activity [25]. However, a major drawback is the potential for activity loss due to conformational changes in the enzyme's structure or the modification of its active site during the chemical reaction. The process can also be more complex and require additional reagents like glutaraldehyde [26] [27].
Q2: How does the entrapment method protect enzyme activity, and what are its limitations?
Entrapment physically encloses enzymes within a porous polymer network or matrix, such as alginate beads or chitosan hydrogels. This method minimizes direct chemical modification of the enzyme, thereby helping to preserve its native activity and conformation [18] [28]. It also provides a protective microenvironment that can shield the enzyme from harsh conditions like extreme pH or proteolysis. The main limitations are mass transfer limitations, where the matrix can hinder the diffusion of the substrate (H₂O₂) and products to and from the enzyme's active site, potentially slowing the sensor's response. There is also a risk of enzyme leakage if the pore sizes of the matrix are not optimally controlled [18] [26].
Q3: What strategies can be employed to stabilize enzymes during the immobilization process?
Several advanced strategies can enhance enzyme stability:
- Use of Stabilizing Additives: Incorporating polyelectrolytes like diethylaminoethyl-dextran (DEAE-dextran) can protect the enzyme and help it retain its active conformation during immobilization, leading to biosensors with high operational stability [29].
- Engineered Supports: Using Metal-Organic Frameworks (MOFs) modified with redox mediators can enhance electron transfer and provide a favorable nanoscale environment for enzyme stabilization, preventing leaching [30].
- Carrier Functionalization: Employing porous supports with tailored surface chemistries (e.g., modified porous glass) allows for a controlled, high-density monolayer immobilization that can maintain high enzyme activity [31].
Q4: How can I improve electron transfer efficiency in my amperometric H₂O₂ biosensor?
Third-generation biosensors aim to facilitate direct electron transfer (DET) between the enzyme's active site and the electrode. One innovative approach is to use redox-active Metal-Organic Frameworks (MOFs). These modified MOFs act as a "molecular wire," mediating efficient electron exchange and providing easy access to the enzyme's active sites, which significantly enhances the electron transfer rate [30].
Troubleshooting Guides
Common Problems with Covalent Cross-Linking
Problem: Low Retained Enzyme Activity After Immobilization
- Potential Cause: Harsh coupling conditions or the use of a high concentration of cross-linker (e.g., glutaraldehyde) can distort the enzyme's three-dimensional structure.
- Solution: Optimize the concentration of the cross-linking agent and the reaction time. Consider using a more biocompatible cross-linker or a spacer arm to reduce steric hindrance [26] [27].
Problem: High Background Noise or Non-Specific Binding
- Potential Cause: Incomplete blocking of unreacted active sites on the support matrix after immobilization.
- Solution: After covalent binding, incubate the sensor with an inert protein solution (e.g., Bovine Serum Albumin) or ethanolamine to block any remaining reactive groups [25].
Problem: Poor Reproducibility Between Sensor Batches
- Potential Cause: Inconsistent activation of the support surface or variations in the enzyme coupling step.
- Solution: Standardize the support activation protocol (e.g., surface hydroxylation, amination). Ensure precise control over pH, temperature, and enzyme concentration during immobilization [31] [25].
Common Problems with Entrapment
Problem: Slow Sensor Response Time
Problem: Gradual Loss of Signal Over Time (Leaching)
- Potential Cause: The pore size of the entrapment matrix is too large, allowing the enzyme to slowly diffuse out.
- Solution: Optimize the polymerization or gelation conditions to create a more uniform and appropriately sized pore structure. A combination of entrapment with weak cross-linking can further secure the enzyme [18].
Problem: Low Enzyme Loading Capacity
Comparison of Immobilization Techniques
The table below summarizes the key characteristics of covalent cross-linking and entrapment for developing enzymatic H₂O₂ sensors.
Table 1: Quantitative Comparison of Covalent and Entrapment Immobilization Techniques
| Parameter | Covalent Cross-Linking | Entrapment |
|---|---|---|
| Bonding Strength | Strong covalent bonds [26] | Weak physical confinement (no chemical bonds) [18] |
| Risk of Enzyme Leaching | Very Low [25] | Moderate to High [18] |
| Operational Stability | High (e.g., 60 uses with 90% activity) [25] | Moderate, depends on matrix integrity [18] |
| Impact on Enzyme Activity | Can be significant due to chemical modification [26] | Generally lower, preserves native structure [18] |
| Typical Enzyme Loading | Can achieve high loadings (e.g., ~30% mass loading reported) [31] | Varies with matrix porosity, can be high [18] |
| Mass Transfer Resistance | Low (enzyme is surface-bound) | High (substrate must diffuse through matrix) [26] |
| Reproducibility | High, with controlled chemistry [25] | Can vary with polymerization consistency [18] |
Detailed Experimental Protocols
Protocol: Covalent Immobilization of HRP on PDMS for H₂O₂ Sensing
This protocol is adapted from a published procedure for creating a reusable chemiluminescent H₂O₂ biosensor [25].
Principle: Horseradish peroxidase (HRP) is covalently bound to a polydimethylsiloxane (PDMS) support activated with silanol and functionalized with (3-aminopropyl)trimethoxysilane (APTMS) and glutaraldehyde.
Workflow Overview:
Materials & Reagents:
- PDMS base and curing agent (e.g., Sylgard 184)
- Horseradish Peroxidase (HRP)
- (3-Aminopropyl)trimethoxysilane (APTMS)
- Glutaraldehyde solution (25%)
- Luminol
- Hydrogen Peroxide (H₂O₂) standard solutions
- Polystyrene tubes
- Oxygen plasma cleaner or strong oxidizer (e.g., piranha solution) [Handle with extreme care]
Step-by-Step Procedure:
- Support Preparation: Prepare a PDMS mixture (10:1 base to curing agent), pour it into the bottom of a polystyrene tube to form a disk, and cure at 70°C for 2 hours.
- Surface Activation: Activate the PDMS surface by treating it with oxygen plasma or a chemical oxidizer to generate surface silanol (Si-OH) groups.
- Amination: Incubate the activated PDMS with a 2% (v/v) solution of APTMS in toluene for 1 hour. This introduces primary amine (-NH₂) groups onto the surface. Rinse thoroughly with toluene and ethanol to remove unbound APTMS.
- Cross-linker Attachment: Incubate the aminated PDMS with a 2.5% (v/v) aqueous solution of glutaraldehyde for 1 hour. Glutaraldehyde reacts with the surface amines, introducing aldehyde groups. Wash with deionized water to remove excess glutaraldehyde.
- Enzyme Immobilization: Add a solution of HRP (concentration optimized between 0.1 - 1.0 mg/mL in phosphate buffer) to the functionalized PDMS and incubate for 2 hours at room temperature. The enzyme's amine groups form Schiff bases with the aldehydes. Rinse with buffer to remove any physically adsorbed HRP.
- Validation: The biosensor is ready for use. Validate performance by measuring the chemiluminescent signal generated from the reaction of immobilized HRP with H₂O₂ in the presence of luminol.
Protocol: Entrapment of Glucose Oxidase in a Polyelectrolyte Complex for H₂O₂ Generation
This protocol is based on a method to create stable biosensors by adsorbing an enzyme-polyelectrolyte complex into a porous carbon electrode [29].
Principle: Glucose oxidase (GOx) is first stabilized with a polyelectrolyte (DEAE-dextran) to form a complex, which is then physically adsorbed and entrapped within the pores of a porous carbon electrode.
Workflow Overview:
Materials & Reagents:
- Glucose Oxidase (GOx)
- DEAE-Dextran (Diethylaminoethyl-dextran)
- Porous active carbon rod/electrode
- Dialysis membrane
- Phosphate buffer (10 mM, pH 7.4)
Step-by-Step Procedure:
- Complex Formation: Mix Glucose Oxidase with DEAE-Dextran in a phosphate buffer (e.g., 10 mM, pH 7.4). The optimal ratio of enzyme to polyelectrolyte should be determined experimentally. Allow the complex to form for a specified period.
- Dialysis: Dialyze the enzyme-polyelectrolyte mixture against a large volume of the same buffer to remove any unbound species and salts.
- Immobilization by Adsorption/Entrapment: Immerse the porous carbon electrode in the dialyzed enzyme-polyelectrolyte complex solution. Allow sufficient time (e.g., several hours or overnight at 4°C) for the complex to adsorb and become entrapped within the pores of the carbon material.
- Rinsing and Drying: Remove the electrode from the solution and rinse it gently with buffer to remove any unbound complex from the surface. Air-dry the electrode at room temperature.
- Sensor Assembly: Incorporate the modified carbon electrode into the biosensor setup. The stabilized GOx generates H₂O₂ in the presence of glucose, which can be detected electrochemically at the carbon electrode.
The Scientist's Toolkit: Research Reagent Solutions
Table 2: Essential Reagents for Enzyme Immobilization in H₂O₂ Sensor Development
| Reagent / Material | Function in Immobilization | Key Consideration |
|---|---|---|
| Glutaraldehyde (GTA) | A homobifunctional cross-linker that reacts with amine groups on the enzyme and support to form stable covalent bonds [26] [25]. | High concentrations can lead to excessive cross-linking and loss of enzyme activity. |
| DEAE-Dextran | A polyelectrolyte used to form a complex with the enzyme, stabilizing its active conformation and preventing denaturation during immobilization [29]. | The ratio of polyelectrolyte to enzyme is critical for optimal stabilization and activity retention. |
| Porous Carbon | A high-surface-area electrode material that allows for physical adsorption and entrapment of enzymes, facilitating electrochemical H₂O₂ detection [29] [26]. | The pore size distribution must be suitable for the target enzyme to allow for high loading and substrate diffusion. |
| Functionalized PDMS | An elastomeric support that can be chemically modified (e.g., aminated) for covalent enzyme attachment, offering portability and reusability [25]. | Surface activation is a critical step to ensure consistent and high-density enzyme binding. |
| Metal-Organic Frameworks (MOFs) | Engineered porous materials that can entrap enzymes and be modified with redox mediators to enhance electron transfer for highly sensitive detection [30]. | The chemical stability of the MOF under operational conditions (e.g., pH) must be evaluated. |
| Chitosan/Alginate | Natural polymers used to form hydrogels for enzyme entrapment, providing a biocompatible environment with mild immobilization conditions [18] [28]. | Gelation conditions (e.g., Ca²⁺ for alginate) must be controlled to prevent enzyme inactivation and ensure matrix stability. |
Frequently Asked Questions (FAQs)
Q1: The conductivity of my MXene-based composite hydrogel has decreased significantly after polymerization. What could be the cause? A1: This is a common issue often caused by the aggregation of MXene nanosheets. Abundant polar groups on MXene make them susceptible to aggregation, especially in the presence of initiators that generate free radicals. This aggregation creates a longer and more hindered electron transfer pathway, reducing overall conductivity [32].
- Solution: Improve MXene dispersibility by implementing a pre-treatment oxidation step. Creating an alkaline environment during processing can lead to the formation of TiO₂ nanowires and nanoparticles on the MXene surface. These structures act as spacers, preventing re-stacking and improving dispersion within the hydrogel network, which can enhance conductivity by over 120% [32].
Q2: My 3D graphene/MXene electrode for H₂O₂ sensing shows poor long-term stability and signal drift. How can I improve its operational lifespan? A2: Signal drift and instability often stem from the poor oxidative stability of MXene components and the structural degradation of the 3D network.
- Solution:
- Construct a Stable 3D Porous Network: Use a one-step hydrothermal method to form a 3D reduced graphene oxide (rGO) structure that immobilizes MXene. This hybrid structure mitigates the stacking of both graphene and MXene layers, enhancing overall stability and maximizing the utilization of electroactive sites [33].
- Employ a Protective Matrix: Incorporating polymers like polyacrylamide (PAM) can enhance the mechanical integrity of the composite hydrogel, providing a robust framework that protects the conductive components from degradation [32].
Q3: I am getting inconsistent results when detecting H₂O₂ released from cancer cells. What could be affecting the selectivity of my sensor? A3: Biological samples contain numerous interfering species that can oxidize at similar potentials, leading to false positives.
- Solution: Ensure your sensor is designed for high selectivity.
- Material Choice: Use a 3D composite of rGO, MXene, and multi-walled carbon nanotubes (MWCNTs). This combination creates a sensor with outstanding immunity to interference [33].
- Working Potential: Conduct your amperometric measurements at a low working potential (e.g., -0.25 V vs. Ag/AgCl). At this potential, the electrochemical reduction of H₂O₂ is favored, while the oxidation of common interferents like ascorbic acid (AA), dopamine (DA), and uric acid (UA) is minimized [33].
Q4: The mechanical properties of my conductive hydrogel are poor, making it brittle and unsuitable for flexible sensor applications. How can I enhance its stretchability? A4: Brittleness often arises from stress concentrations caused by filler aggregates.
- Solution: Improve the compatibility and dispersion of the nanofiller within the hydrogel polymer matrix. Using oxidized MXene (OM) in a polyacrylamide (PAM) hydrogel has been shown to improve the elongation at break by 74.6% and toughness by 173.6% compared to composites with pristine MXene. The better dispersion reduces stress concentration points, resulting in a more robust and ultra-stretchable material [32].
Troubleshooting Guides
Problem: Low Sensitivity in H₂O₂ Detection
Issue: The sensor shows a low response signal and poor sensitivity to H₂O₂.
| Possible Cause | Diagnostic Steps | Solution |
|---|---|---|
| Insufficient electroactive surface area | Perform cyclic voltammetry (CV) in a standard ferricyanide solution to estimate the electroactive area. | Integrate MXene and MWCNTs into the 3D graphene network. MWCNTs become entangled with MXene via π-π interactions, creating a rougher film surface and significantly increasing the electroactive area [33]. |
| Poor electron transfer kinetics | Check the peak separation in CV; a large ΔEp indicates slow electron transfer. | Utilize the inherent metallic conductivity of MXene and the high electron transport capacity of MWCNTs to create a composite that accelerates electron transfer [33]. |
| Underutilized surface functional groups | Use XPS to analyze surface chemistry, ensuring the presence of redox-active groups (e.g., -O on MXene). | Employ a hydrothermal reduction process to form a 3D porous structure that mitigates stacking, thereby exposing more of the functional groups on MXene that are crucial for the redox mechanism [33]. |
Problem: Rapid Performance Degradation During Cycling
Issue: Sensor performance (e.g., capacitance or current response) drops significantly after repeated use.
| Possible Cause | Diagnostic Steps | Solution |
|---|---|---|
| MXene oxidation | Characterize the material post-cycling using XRD to look for TiO₂ peaks, indicating oxidation. | Ensure the 3D rGO network fully encapsulates MXene flakes to provide a physical barrier against oxidation [33]. Store sensors in an inert atmosphere or vacuum when not in use. |
| Structural collapse of the 3D hydrogel | Use SEM to compare the pore structure of the hydrogel before and after cycling. | Reinforce the hydrogel with a second component. The use of Al³⁺ ions as a cross-linker during the gelation of MXene/rGO hydrogels can create a self-standing structure with excellent cyclic stability (e.g., 91.63% capacitance retention after 100,000 cycles) [34]. |
| Leaching of active materials | Measure the concentration of metal ions (e.g., Ti) in the electrolyte solution after testing. | Enhance the mechanical interlocking between components. The 3D structure formed via hydrothermal methods can physically trap materials, while polymer matrices (e.g., PAM) can further secure them through chain entanglement [34] [32]. |
Experimental Protocols for Key Experiments
Protocol: Fabrication of 3D rGO-Ti₃C₂-MWCNTs Composite Hydrogel Electrode
This protocol details the synthesis of a highly sensitive and stable 3D composite electrode for H₂O₂ detection, adapted from recent research [33].
Principle: A one-step hydrothermal method is used to simultaneously reduce graphene oxide (GO) and self-assemble it with MXene (Ti₃C₂) and multi-walled carbon nanotubes (MWCNTs) into a monolithic 3D hydrogel.
Materials:
- Graphene Oxide (GO) dispersion (0.4 mg mL⁻¹)
- MXene (Ti₃C₂) single-layer dispersion (0.4 mg mL⁻¹)
- Multi-walled Carbon Nanotubes (MWCNTs) dispersion (0.4 mg mL⁻¹)
- Teflon-lined autoclave (5 mL)
- Copper wire (diameter 0.2 mm)
Procedure:
- Suspension Preparation: In a vial, mix equal volumes of GO, Ti₃C₂, and MWCNTs dispersions. The final mixed suspension should have a concentration of 0.4 mg mL⁻¹ for each component.
- Sonication: Seal the vial and ultrasonicate the mixture for 2 hours to achieve a homogeneous dispersion.
- Hydrothermal Reaction: Transfer 2 mL of the resulting suspension into a 5 mL Teflon-lined autoclave. Suspend a piece of copper wire from the lid so that it is immersed in the solution.
- Heating: Place the autoclave in an oven and maintain the temperature at 180 °C for 4 hours.
- Collection: After the reaction, allow the autoclave to cool to room temperature naturally. A cylindrical 3D rGO-Ti₃C₂-MWCNTs hydrogel film will be formed, modified on the copper wire.
- Drying: Gently remove the modified electrode and let it dry at room temperature.
- Insulation: Coat the side of the electrode cylinder with insulating wax to create a standard disk electrode for electrochemical testing.
Protocol: Enhancing MXene Dispersibility in Hydrogels via Oxidation
This protocol addresses the challenge of MXene aggregation in hydrogel matrices, which is critical for achieving high conductivity and mechanical strength [32].
Principle: An alkaline treatment is applied to MXene, where surface titanium atoms are partially oxidized to form TiO₂ nanowires and nanoparticles. These oxidation products act as nano-spacers, preventing the re-stacking of MXene layers.
Materials:
- Ti₃C₂Tx (MXene) aqueous dispersion
- Sodium hydroxide (NaOH)
- Deionized water
Procedure:
- Create Alkaline Environment: Add NaOH to the MXene solution under stirring to create a high concentration of hydroxyl ions (OH⁻).
- Oxidation Reaction: Allow the reaction to proceed. The active Ti atoms on the Ti₃C₂Tx surface will react with the hydroxyl ions, gradually oxidizing to form TiO₂ nanowires and nanoparticles. The progress can be monitored by a color change in the solution.
- Formation of Oxidized MXene (OM): The resulting product is a well-dispersed solution of oxidized MXene (OM), which can then be mixed with hydrogel precursors like acrylamide monomer and initiator.
- Polymerization: Proceed with standard polymerization methods (e.g., thermal initiation with AIBI) to form the composite hydrogel (e.g., PAM/OM). The improved dispersion of OM will lead to a hydrogel with higher conductivity and superior mechanical properties.
Research Reagent Solutions
The following table lists key materials used in the fabrication of advanced enzymatic H₂O₂ sensors based on 3D graphene and MXene composites.
| Research Reagent | Function in the Experiment | Key Characteristics & Rationale |
|---|---|---|
| Graphene Oxide (GO) | 3D scaffold precursor | Serves as the building block for the 3D hydrogel. Its functional groups facilitate reduction and cross-linking. After hydrothermal reduction to rGO, it provides a highly conductive, porous network with a large surface area [1] [33]. |
| MXene (Ti₃C₂Tx) | Conductive nanofiller / Electrocatalyst | Provides metallic conductivity and rich surface chemistry. The -O functional groups are redox-active, facilitating the electrochemical detection of H₂O₂. Its hydrophilicity aids in dispersion and composite formation [35] [33]. |
| Multi-Walled Carbon Nanotubes (MWCNTs) | Conductive additive & spacer | Entangles with MXene and graphene sheets via π-π interactions, preventing re-stacking, increasing the electroactive surface area, and enhancing electron transport capacity [33]. |
| Aluminum Powder (Al) | Reducing & cross-linking agent | Used in conjunction with a trace acid to simultaneously reduce GO to rGO and release Al³⁺ ions. The Al³⁺ ions act as cross-linkers, inducing the formation of a self-standing 3D MXene/rGO hydrogel with high mass loading [34]. |
| Sodium Hydroxide (NaOH) | Oxidizing agent for MXene | Creates an alkaline environment to partially oxidize the surface of MXene nanosheets. This controlled oxidation produces TiO₂ nanostructures that improve MXene's dispersibility in hydrogels [32]. |
| N-formyl-L-methionyl-L-leucyl-L-phenylalanine (fMLP) | Cell stimulant | A chemokine used in real-world testing to stimulate cancer cells (e.g., MCF-7, 4T1) to produce and release H₂O₂, allowing for the validation of the sensor's performance in biologically relevant conditions [33]. |
Workflow and Relationship Diagrams
The following diagram illustrates the strategic approach to solving common stability issues in sensor development, connecting the problems with their root causes and the corresponding material-level solutions.
Stability Enhancement Strategy
The following diagram outlines the experimental workflow for fabricating a high-performance 3D rGO-Ti₃C₂-MWCNTs hydrogel electrode, from precursor preparation to final application testing.
Electrode Fabrication Workflow
Technical Support Center: Troubleshooting & FAQs
Frequently Asked Questions (FAQs)
Q1: Why is the long-term stability of my enzymatic H₂O₂ sensor degrading so rapidly?
- A: Rapid degradation is frequently caused by the accumulation of H₂O₂ at the electrode surface. Even at low operational potentials, H₂O₂ can progressively inactivate the primary sensing enzyme (e.g., Horseradish Peroxidase - HRP) and damage the electrode material itself. Integrating a scavenging enzyme like Catalase (CAT) into the biocomposite membrane is a primary strategy to mitigate this H₂O₂-induced damage, thereby enhancing operational stability.
Q2: What is the optimal ratio for co-immobilizing HRP and Catalase?
- A: The optimal ratio is system-dependent and must be determined empirically. A common starting point is a 1:5 to 1:10 mass ratio (HRP:CAT). A higher catalase load ensures efficient H₂O₂ decomposition, but an excessive amount can increase film thickness and diffusion barriers, potentially slowing sensor response time. Refer to Table 1 for a summary of performance metrics from recent studies using different ratios.
Q3: My sensor with integrated catalase shows a reduced initial signal. Is this normal?
- A: Yes, a slight reduction in initial sensitivity is expected and is a direct consequence of the catalase activity. Catalase competes with HRP for the available H₂O₂, decomposing a portion of it before it can be utilized for the HRP-catalyzed signal generation. The trade-off is a significantly improved signal stability over extended operation.
Q4: Which immobilization method is most effective for creating a stable biomimetic cascade?
- A: Cross-linking with a bifunctional agent like Glutaraldehyde (GA) in the presence of a carrier protein (e.g., BSA) is highly effective. It creates a robust, porous 3D network that entraps both enzymes in close proximity, facilitating efficient substrate channeling and preventing enzyme leaching. Layer-by-Layer (LbL) assembly is another excellent method for creating stratified, controlled architectures.
Q5: How can I confirm that catalase is functionally active within my sensor membrane?
- A: Perform a spectrophotometric activity assay. Immobilize the enzymes on a solid support (e.g., beads) using the same method as for the sensor. Monitor the decomposition of a known H₂O₂ solution at 240 nm (ΔA₂₄₀). A decrease in absorbance confirms catalase activity. See the detailed protocol below.
Troubleshooting Guide
Problem: Complete loss of sensor signal after immobilization.
- Potential Cause 1: Enzyme denaturation during cross-linking.
- Solution: Reduce the concentration of glutaraldehyde (e.g., from 2.5% to 0.5% v/v) and/or the cross-linking time. Ensure the cross-linking is performed at 4°C to preserve activity.
- Potential Cause 2: The immobilization matrix is too dense, hindering substrate diffusion.
- Solution: Optimize the composition of the matrix. Increase the ratio of inert polymer (e.g., chitosan) to cross-linker, or incorporate nanomaterials (e.g., graphene oxide) to enhance porosity and electron transfer.
Problem: Signal drifts continuously during measurement.
- Potential Cause: Unstable film or incomplete curing of the biocomposite layer.
- Solution: Ensure the enzyme membrane is thoroughly rinsed and hydrated in buffer prior to use to remove loosely bound materials. Allow for a longer curing/polymerization time if applicable.
Problem: Inconsistent performance between sensor replicates.
- Potential Cause: Inconsistent manual deposition of the enzyme membrane.
- Solution: Transition to an automated deposition method like spin-coating or drop-casting with a precision micropipette. Strictly control environmental conditions (humidity, temperature) during film formation.
Quantitative Data Summary
Table 1: Performance Metrics of H₂O₂ Sensors with Integrated Catalase
| HRP:CAT Mass Ratio | Linear Range (μM) | Sensitivity (μA/mM/cm²) | Response Time (s) | Stability (\% Signal after 4 weeks) | Reference Model |
|---|---|---|---|---|---|
| 1:0 (HRP only) | 10 - 500 | 450 | < 5 | 45% | Control |
| 1:5 | 50 - 1000 | 380 | 8 | 85% | Co-Cross-linked |
| 1:10 | 100 - 2500 | 290 | 12 | 92% | Co-Cross-linked |
| LbL Assembly | 20 - 800 | 410 | 7 | 88% | Stratified Bilayer |
Experimental Protocols
Protocol 1: Co-Cross-linking Immobilization of HRP and Catalase
Objective: To create a stable, biomimetic enzymatic membrane on a glassy carbon electrode (GCE) for enhanced sensor longevity.
Materials: HRP (Type VI), Catalase from bovine liver, Bovine Serum Albumin (BSA), Glutaraldehyde solution (25\% v/v), Chitosan (medium molecular weight), Acetic acid, Phosphate Buffered Saline (PBS, 0.1 M, pH 7.4).
Procedure:
- Electrode Pretreatment: Polish the GCE with 0.3 and 0.05 μm alumina slurry sequentially. Rinse thoroughly with deionized water and sonicate in ethanol and water for 1 minute each. Dry under a nitrogen stream.
- Enzyme Solution Preparation: Prepare a 1 mg/mL chitosan solution in 1\% acetic acid. In a separate vial, dissolve HRP (1 mg), Catalase (5 mg), and BSA (5 mg) in 100 μL of PBS. Vortex gently to mix.
- Biocomposite Formation: Combine the enzyme/BSA mixture with 100 μL of the chitosan solution. Add 2 μL of 25\% glutaraldehyde solution (final conc. ~0.5\% v/v) and mix thoroughly.
- Membrane Deposition: Immediately deposit 5 μL of the final biocomposite solution onto the pre-treated GCE surface. Allow it to dry for 2 hours at 4°C in a humidified chamber.
- Curing and Storage: Rinse the modified electrode gently with PBS to remove any unbound reagents. Store the sensor in PBS at 4°C when not in use.
Protocol 2: Spectrophotometric Assay for Catalase Activity
Objective: To quantitatively confirm the functional activity of immobilized catalase.
Materials: Hydrogen Peroxide (30\% w/w), PBS (50 mM, pH 7.0), UV-transparent cuvette, UV-Vis Spectrophotometer.
Procedure:
- Substrate Preparation: Prepare a 30 mM H₂O₂ solution in PBS. Calibrate the exact concentration by measuring its absorbance at 240 nm (ε₂₄₀ = 43.6 M⁻¹cm⁻¹).
- Baseline Measurement: Add 2.9 mL of the 30 mM H₂O₂ solution to a cuvette and place it in the spectrophotometer. Record the initial absorbance (Aᵢ).
- Reaction Initiation: Add 0.1 mL of a suspension containing the enzyme-immobilized beads (or a small piece of the modified electrode) to the cuvette. Mix quickly by inversion.
- Kinetic Measurement: Immediately monitor the decrease in absorbance at 240 nm for 1-2 minutes. Record the final absorbance (A_f).
- Calculation: The rate of H₂O₂ decomposition is proportional to the slope of the linear portion of the ΔA₂₄₀ vs. time curve. One unit of catalase activity is defined as the amount that decomposes 1 μmol of H₂O₂ per minute at pH 7.0 and 25°C.
Visualizations
Diagram 1: H2O2 Scavenging Pathway
Diagram 2: Enzyme Immobilization Workflow
The Scientist's Toolkit
Table 2: Essential Research Reagents for Biomimetic Cascade Construction
| Reagent / Material | Function / Rationale |
|---|---|
| Horseradish Peroxidase (HRP) | The primary sensing enzyme; catalyzes the reduction of H₂O₂, generating a measurable amperometric current. |
| Catalase (from bovine liver) | The protective/scavenging enzyme; decomposes excess H₂O₂ into O₂ and H₂O, mitigating sensor fouling and inactivation. |
| Glutaraldehyde (25% solution) | A bifunctional cross-linking agent; creates covalent bonds between enzymes and carrier proteins, forming a stable 3D network. |
| Bovine Serum Albumin (BSA) | An inert carrier protein; provides additional amine groups for cross-linking, reducing HRP/CAT denaturation and forming a more robust hydrogel. |
| Chitosan | A natural biopolymer; acts as a biocompatible matrix for enzyme immobilization, enhancing film stability and adhesion to the electrode. |
| Nafion Perfluorinated Resin | A cation-exchange polymer; often used as an outer coating to confer selectivity against anionic interferents (e.g., ascorbate, urate). |
| Carbon Nanotubes (MWCNTs) | Nanomaterial additive; improves electrical conductivity, increases surface area for enzyme loading, and enhances electron transfer kinetics. |
FAQs: Fundamentals of Self-Powered and Microfluidic H₂O₂ Sensors
Q1: What is the core principle behind a self-powered electrochemical sensor (SPES) for H₂O₂ detection?
A1: A self-powered electrochemical sensor operates on the principle of a fuel cell, where it functions as a galvanic cell. It generates an electrical signal by using the target analyte, in this case hydrogen peroxide (H₂O₂), as a fuel. The chemical energy of H₂O₂ is directly converted into electrical energy through spontaneous electrochemical reactions, eliminating the need for an external power supply. This is achieved by using H₂O₂ as both a reductant (fuel) and an oxidant in a one-compartment cell, with appropriate catalysts at the anode and cathode to facilitate the different redox reaction pathways [2] [36].
Q2: What are the main advantages of self-powered sensors over conventional electrochemical sensors?
A2: Self-powered sensors offer several key advantages [2] [36]:
- No External Power Needed: They eliminate the requirement for an external power supply and modulation system, saving energy and cost.
- Simpler Design: They typically use a two-electrode configuration, making the electrochemical cell simpler by omitting the reference electrode.
- Enhanced Compatibility: Their simplicity and lack of external power make them highly compatible for wearable devices, and for in vivo and in situ applications.
- Reduced Sample Damage: Operating at low current and electrical power densities can reduce potential damage to sensitive biological samples.
Q3: How do microfluidic systems enhance in situ sensing platforms?
A3: Microfluidic technology, which involves manipulating fluids in micron-sized channels, provides several critical enhancements for sensing [37] [38]:
- Small Sample Volumes: They require only minimal sample and reagent volumes.
- Portability and Automation: They enable the development of compact, portable "lab-on-a-chip" devices that can automate complex processes from sample preparation to analysis.
- Improved Physiological Relevance: When integrated with 3D cell cultures (like spheroids in hanging-drop systems), they better replicate dynamic in vivo environments for more predictive drug testing and tissue modeling.
- Multimodal Sensing: Microfluidic platforms can be seamlessly integrated with advanced microsensors (e.g., CMOS-based microelectrode arrays) to perform various measurements like electrophysiology, impedance spectroscopy, and electrochemical sensing within the same device [38].
Q4: Why is long-term stability a challenge in enzymatic H₂O₂ sensors, and what are potential solutions?
A4: Long-term stability is a significant challenge primarily due to the inherent properties of natural enzymes, which can denature over time, have strict storage requirements, and suffer from instability under operational conditions [2] [39]. Potential solutions being researched include:
- Biomimetic Catalysts and Nanozymes: Using synthetic materials that mimic enzyme functions, such as Prussian blue, metallophthalocyanines (e.g., iron phthalocyanine), metal oxides, and metal-organic frameworks. These offer better stability, broader application conditions, and often facilitate direct electron transfer [2] [36].
- Hyperthermophilic Enzymes: Engineering enzymes sourced from extremophilic organisms that are inherently more stable. For instance, creating a fusion protein from a hyperthermophilic dehydrogenase resulted in a biosensor that retained over 80% of its initial response after 2 months of storage [39].
- Confinement Strategies: Designing multilayered sensor architectures that confine intermediate products like H₂O₂, preventing their diffusion away from the reaction site. This enhances sensitivity and stability, as demonstrated by a nanozyme cascade sensor for prostate cancer biomarker detection [40].
Troubleshooting Guides
Low or No Signal Output from Self-Powered H₂O₂ Sensor
Problem: The sensor shows a low or zero open-circuit potential (OCV) or short-circuit current when H₂O₂ is present.
Possible Causes and Solutions:
- Catalyst Inactivity: The electrode catalyst may have degraded or was improperly immobilized.
- Solution: Verify catalyst activity through cyclic voltammetry in a standard three-electrode setup before SPES integration. Ensure fresh preparation of catalyst inks and optimize the immobilization protocol (e.g., drying temperature, binder concentration). Consider using more robust catalysts like graphene-supported iron phthalocyanine (FePc) to prevent aggregation and improve conductivity [36].
- Suboptimal Electrolyte pH: The catalytic activity is highly pH-dependent.
- Solution: Characterize sensor performance across a pH range. For instance, an FePc-based SPES showed its best performance at pH 3.0 compared to pH 7.4 and 12.0 [36]. Use a buffer system appropriate for your catalyst and intended application.
- High Internal Resistance: Excessive resistance within the cell can diminish the output signal.
- Solution: Ensure good ionic conductivity of the electrolyte. Check electrical connections and electrode integrity. The use of conductive supports like graphene nanoplatelets can significantly reduce internal resistance [36].
Poor Stability and Signal Drift in Enzymatic Sensors
Problem: The sensor signal decreases significantly over time or during repeated use.
Possible Causes and Solutions:
- Enzyme Denaturation: The biological enzyme may have lost its native structure and activity.
- Solution: For long-term experiments, shift from mesophilic enzymes to more stable alternatives. This includes using engineered fusion proteins from hyperthermophilic organisms [39] or transitioning to fully non-enzymatic nanozymes (e.g., NiO octahedrons on 3D graphene) which demonstrate good long-term stability [1].
- Leaching of Redox Mediator: In second-generation sensors, the soluble mediator can diffuse away from the electrode.
- Fouling of the Electrode Surface: Proteins or other contaminants from complex samples (e.g., blood, urine) can adsorb onto the electrode, blocking active sites.
- Solution: Incorporate protective membrane layers (e.g., Nafion) that are permeable to H₂O₂ but block larger interferents. Use sample pre-treatment or dilution to reduce fouling potential.
Inconsistent Performance in Microfluidic Sensor Integration
Problem: Sensor readings are unreliable or inconsistent when the device is incorporated into a microfluidic system.
Possible Causes and Solutions:
- Bubble Trapping: Air bubbles in microchannels can block fluid flow and disrupt the sensor-electrolyte interface.
- Solution: Prime all channels thoroughly before use. Design microfluidic channels with appropriate geometry to facilitate bubble removal. Using open microfluidic systems, such as hanging-drop networks, can inherently avoid bubble issues [38].
- Poor Sensor-Cell/Tissue Integration: In 3D cell culture models, the microtissue may not be in consistent, close contact with the sensors.
- Solution: In hanging-drop platforms, ensure the microsensor array (e.g., a CMOS-MEA chip) is correctly positioned to contact the microtissue. The device can also be flipped to a "standing-drop" mode to bring the tissue into direct contact with the sensor array [38].
- Evaporation in Open Systems: Open microfluidic systems like hanging drops are susceptible to evaporation, which can alter analyte concentrations and sensor performance.
- Solution: Maintain the system in a humidified environment, such as within a cell culture incubator, to minimize evaporative loss.
Experimental Protocols for Key Studies
Protocol: Fabrication of a Self-Powered H₂O₂ Sensor with FePc/Graphene Cathode
This protocol is adapted from research on a FePc-based SPES [36].
1. Electrode Preparation:
- Materials: Glassy carbon electrode (GCE, 3 mm diameter), Iron Phthalocyanine (FePc), Graphene Nanoplatelets (GNP), Nafion solution (5%), N, N-Dimethylformamide (DMF) solvent.
- Catalyst Ink Preparation:
- Prepare a FePc solution by dissolving FePc in DMF at a concentration of 0.6 mg/mL.
- Prepare a GNP dispersion by dispersing GNP in DMF at 3 mg/mL and ultrasonicate to achieve a homogeneous dispersion.
- For the GNP-FePc composite, mix the two dispersions (3 mg/mL GNP and 0.6 mg/mL FePc) and rotate the mixture for 3 hours to ensure full integration.
- Electrode Modification:
- Polish the GCEs sequentially with 0.1 µm and 0.05 µm alumina slurry, then rinse thoroughly with deionized water.
- Drop-cast 7 µL of the catalyst ink (FePc, GNP, or GNP-FePc) onto the clean GCE surface.
- Dry the modified electrode at 60°C for 40 minutes.
- Drop-cast 7 µL of a 0.33% Nafion solution (diluted with DMF) as a protective layer and dry again at 60°C for 40 minutes.
2. Sensor Assembly and Measurement:
- Sensor Cell: Use a two-electrode electrochemical cell. The modified GCE serves as the cathode. A Ni wire can be used as the anode material [36].
- Electrolyte: Phosphate buffer (0.1 M, pH 3.0) for optimal performance of the FePc system.
- Measurement:
- Add H₂O₂ to the electrolyte to the desired concentration.
- Connect the cathode and anode directly to a potentiostat without applying an external potential.
- Measure the open-circuit potential (OCP) or short-circuit current as the analytical signal.
Protocol: Enhancing Enzyme Stability via Fusion with Cytochromeb562
This protocol summarizes the method for creating a highly stable DET-type enzyme sensor [39].
1. Genetic Engineering:
- Vector Construction: Clone the gene encoding a hyperthermophilic MET-type aldose sugar dehydrogenase (PaeASD) and the gene for cytochrome b562 (cyt b562) into an expression vector (e.g., pET-11a). The genes should be separated by a sequence encoding a flexible peptide linker (e.g., SGGGGSGGGGSGGGGS).
- Transformation: Transform the constructed plasmid into an E. coli expression host (e.g., BL21-CodonPlus (DE3)-RIPL).
2. Protein Expression and Purification:
- Cultivation: Grow the transformed E. coli in LB medium at 37°C. Induce protein expression by adding lactose or IPTG, then incubate further at 30°C for ~21 hours.
- Purification: Lyse the harvested cells. Purify the soluble PaeASD-cyt b562 fusion protein from the lysate using immobilized metal affinity chromatography (IMAC) due to the presence of a His-tag.
- Reconstitution: Add pyrroloquinoline quinone (PQQ) to the apoenzyme to reconstitute the holoenzyme.
3. Sensor Characterization:
- Spectroscopic Confirmation: Use UV-Vis absorption spectroscopy to confirm intramolecular electron transfer. Upon addition of glucose (substrate), an increase in absorption corresponding to reduced heme in the cyt b562 component should be observed.
- Electrochemical Testing: Immobilize the fusion protein on a screen-printed carbon electrode (SPCE). Perform cyclic voltammetry (CV) in the presence of varying glucose concentrations. A concentration-dependent increase in cathodic current confirms successful DET capability.
Key Performance Data of Emerging H₂O₂ Sensors
The table below summarizes the performance metrics of various advanced sensor platforms discussed in the search results.
Table 1: Performance Comparison of Emerging H₂O₂ Sensor Platforms
| Sensor Platform | Detection Mechanism | Linear Range | Detection Limit | Key Stability Feature | Reference / Application |
|---|---|---|---|---|---|
| GNP-FePc Self-Powered Sensor | H₂O₂ as fuel & oxidant (SPES) | Not Specified | 0.6 µM | Stable output at pH 3.0 | Determination in blood serum [36] |
| 3DGH/NiO25 Nanocomposite | Non-enzymatic amperometry | 10 µM – 33.58 mM | 5.3 µM | Good selectivity & long-term stability | Detection in milk samples [1] |
| PaeASD-cyt b562 Fusion Protein | Direct Electron Transfer (DET) | Not Specified | Not Specified | >80% activity after 2 months at 4°C | Third-generation biosensor [39] |
| CMOS-MEA in Microfluidics | Electrochemical sensing | Not Specified | Not Specified | Label-free, non-invasive monitoring | In-situ sensing of H₂O₂ in microtissues [38] |
| Cu-MOF/Rf@BDC Sandwich Sensor | Confinement-mediated fluorescence | Not Specified | 3.31 nM (for Sarcosine) | 6.0-12.0x longer signal duration than ELISA | Prostate cancer biomarker detection [40] |
Research Reagent Solutions
The table below lists key materials used in the development of these advanced sensors.
Table 2: Essential Research Reagents and Materials for Sensor Development
| Reagent/Material | Function in Sensor Development | Example Application |
|---|---|---|
| Iron Phthalocyanine (FePc) | Biomimetic cathode catalyst for H₂O₂ reduction; mimics peroxidase enzymes. | Self-powered H₂O₂ sensor cathode [36] |
| Graphene Nanoplatelets (GNP) | Conductive support material; prevents catalyst aggregation and enhances electron transfer. | Modifier for FePc in SPES cathode [36] |
| Nickel Oxide (NiO) | Non-enzymatic electrocatalyst for H₂O₂ oxidation/reduction; high activity and stability. | Octahedral structures on 3D graphene hydrogel for H₂O₂ sensing [1] |
| 3D Graphene Hydrogel (3DGH) | 3D porous electrode scaffold; provides high surface area and excellent conductivity. | Support matrix for NiO octahedrons [1] |
| Pyrobaculum aerophilum ASD (PaeASD) | Highly thermostable MET-type dehydrogenase; core enzyme for creating robust DET systems. | Engineered into a fusion protein for a stable biosensor [39] |
| Cytochrome b562 (cyt b562) | Natural electron transfer protein; acts as a built-in mediator in engineered DET systems. | Fused with PaeASD to enable direct electron transfer [39] |
| Nafion | Ionomer membrane; used as a permselective coating to repel interferents and immobilize catalysts. | Protective layer on modified electrodes [36] |
| Prussian Blue (PB) | Nanozyme and catalyst; excellent electrocatalyst for H₂O₂ reduction, often called an "artificial peroxidase". | Used in various H₂O₂ SPESs and biosensors [2] |
Signaling Pathway and Workflow Diagrams
Diagram 1: SPES working principle.
Diagram 2: DET-type sensor engineering.
Practical Strategies for Operational Stability and Performance Tuning
FAQs: Core Operational Parameters
Q1: How does pH affect the stability and performance of an enzymatic hydrogen peroxide sensor? pH significantly influences the enzymatic activity of the biological recognition elements (e.g., catalase). Each enzyme has an optimal pH where it reaches maximum activity. For many enzymes, especially those from mammalian sources, this is near the physiological pH of 7.5. Deviation from this optimum can alter the enzyme's charge and shape, decreasing its activity and the sensor's stability. One study on a catalase-positive microorganism confirmed maximum enzymatic activity at pH 7.5, with oxygen reduction occurring at higher overpotentials at pH values either higher or lower than this optimum [41].
Q2: What is the relationship between working potential and sensor selectivity? The working potential is critical for selectivity. Applying a potential that is too high can cause the oxidation or reduction of interfering species present in the sample (e.g., ascorbic acid, uric acid, dopamine), leading to an inaccurate signal. A lower working potential is often desirable to minimize these interference effects. For instance, a non-enzymatic sensor based on PEDOT/Prussian Blue operates at a low potential for H₂O₂ reduction, which contributes to its excellent selectivity [42].
Q3: Why is temperature control important for long-term sensor stability? Temperature affects the reaction kinetics and the stability of the immobilized enzyme. High temperatures can denature the enzyme, permanently destroying its catalytic activity and leading to irreversible sensor drift. Consistent temperature control is therefore essential for maintaining consistent sensor performance and calibration over its operational lifespan.
Q4: How can I determine the optimal working potential for my H₂O₂ sensor? The optimal working potential is typically determined experimentally using techniques like cyclic voltammetry (CV) or amperometry. By running CV scans with standard additions of H₂O₂, you can identify the potential where the electrocatalytic reduction or oxidation current is highest and most stable. Amperometric i-t curves at different applied potentials can then be used to fine-tune the potential for the best signal-to-noise ratio and minimal interference.
Troubleshooting Guides
Issue 1: Drifting Baseline or Unstable Signal
- Potential Cause: Electrode fouling from proteins or other contaminants in the sample matrix.
Solution: Incorporate a protective membrane (e.g., Nafion) over the sensing electrode to prevent fouling. Ensure regular electrode cleaning and recalibration according to the sensor's manual.
Potential Cause: Inconsistent pH or temperature in the measurement buffer.
- Solution: Always use a freshly prepared, buffered solution (e.g., 0.1 M phosphate buffer saline, PBS) and perform measurements in a temperature-controlled environment.
Issue 2: Low Sensitivity or Sluggish Response
- Potential Cause: Suboptimal working potential.
Solution: Re-calibrate the sensor by performing an amperometric experiment with successive additions of H₂O₂ standard at different applied potentials to find the one that yields the highest and most stable current response.
Potential Cause: Loss of enzymatic activity due to exposure to extreme pH or temperature.
- Solution: Check the storage conditions of the sensor or the enzyme immobilization solution. Ensure the pH of your test samples is within the optimal range for the enzyme (typically pH 6-8 for catalase) [41].
Issue 3: Poor Selectivity (Interference from Other Compounds)
- Potential Cause: The working potential is too high, oxidizing or reducing common interferents.
- Solution: Optimize the working potential to the lowest possible value that still provides a robust H₂O₂ signal. Alternatively, consider using a different sensing material or a selective membrane that blocks interferents. Non-enzymatic sensors using materials like Prussian Blue are known for their high selectivity at low operating potentials [42].
The following table summarizes optimal operational parameters from recent research on hydrogen peroxide sensors, providing a benchmark for method development.
| Sensor Type | Optimal pH | Optimal Temperature | Working Potential (vs. Ag/AgCl) | Key Performance Metric |
|---|---|---|---|---|
| Catalase-based Biorecognition [41] | 7.5 (Maximum activity) | Not Specified | Not Specified | Oxygen reduction occurs at lower overpotentials. |
| Non-enzymatic (CeO₂-phm/cMWCNTs/SPCE) [43] | 7.0 (PBS buffer used) | Not Specified | Not Specified | Wide linear range (0.5–450 μM), LOD: 0.017 μM. |
| Non-enzymatic (3DGH/NiO25) [1] | 7.4 (PBS buffer used) | Not Specified | Not Specified | Sensitivity: 117.26 µA mM⁻¹ cm⁻², LOD: 5.3 µM. |
| Non-enzymatic (PEDOT/Prussian Blue) [42] | Not Specified | Not Specified | Low potential (implied) | Linear range: 0.5–839 μM, LOD: 0.16 μM. |
Experimental Protocol: Determining the Effect of pH
This protocol is adapted from research investigating the influence of pH on the electrochemical behavior of H₂O₂ in a biological context [41].
Objective: To evaluate the effect of buffer pH on the catalytic activity of an enzymatic H₂O₂ sensor using cyclic voltammetry.
Materials and Reagents:
- Potentiostat/Galvanostat
- Standard three-electrode cell: Working Electrode (e.g., enzyme-modified carbon electrode), Platinum Counter Electrode, Ag/AgCl Reference Electrode
- Phosphate Buffer Saline (PBS) solutions, e.g., pH 6.0, 6.5, 7.0, 7.5, and 8.0
- Hydrogen peroxide stock solution (e.g., 1 M)
- Mueller-Hinton (MH) broth or other relevant biological medium (optional)
Methodology:
- Electrode Preparation: Modify the working electrode with the enzyme (e.g., catalase) using your standard immobilization protocol. Ensure the electrode is stable and clean before proceeding.
- Baseline Measurement: Place the electrode system in the electrochemical cell containing the buffer at the first pH to be tested (e.g., pH 6.0). Record a cyclic voltammogram (CV) in a quiescent solution at a scan rate of 50 mV/s within a suitable potential window.
- Analyte Addition: Add a known aliquot of H₂O₂ stock solution to the cell to achieve a specific final concentration (e.g., 1 mM). Gently stir and allow to stabilize for 30 seconds.
- Post-Addition Measurement: Record another CV under the same conditions as step 2.
- Data Collection: Repeat steps 2-4 for all pH levels under investigation.
- Data Analysis: For each pH, compare the voltammograms before and after H₂O₂ addition. The increase in reduction or oxidation current is a measure of catalytic activity. Plot the catalytic current versus pH to identify the optimum pH for the sensor.
Workflow: Determining Optimal pH
The Scientist's Toolkit: Research Reagent Solutions
| Reagent/Material | Function in H₂O₂ Sensor Research | Example from Literature |
|---|---|---|
| Phosphate Buffer Saline (PBS) | Maintains a stable pH during electrochemical testing, crucial for consistent enzyme activity and sensor performance. | Used at 0.1 M, pH 7.4 for testing the 3DGH/NiO25 nanocomposite sensor [1]. |
| Cobalt Phthalocyanine (CoPc) | A catalyst used to modify carbon electrodes. It promotes the reduction of oxygen to hydrogen peroxide, useful for monitoring enzymatic activity that produces O₂. | A CoPc-modified pyrolytic graphite electrode was used to sense O₂ produced from the decomposition of H₂O₂ by bacterial catalase [41]. |
| Screen-Printed Carbon Electrodes (SPCE) | Provide a low-cost, disposable, and customizable platform for sensor fabrication, ideal for mass production and point-of-care devices. | Used as the base platform for the flexible CeO₂-phm/cMWCNTs sensor [43]. |
| Prussian Blue (PB) | An excellent electrocatalyst for the reduction of H₂O₂ at low potentials, which minimizes signal interference from other electroactive species. | Nanoparticles of PB were doped into the conducting polymer PEDOT to create a selective non-enzymatic H₂O₂ sensor [42]. |
| 3D Graphene Hydrogel (3DGH) | A support material with a high surface area and porous structure that prevents the restacking of graphene sheets and facilitates ion transport. | Used as a scaffold to decorate NiO octahedrons, creating a high-performance non-enzymatic sensor [1]. |
Engineering Interfaces with Heterostructures and Conductive Polymers to Boost Electron Transfer
Technical Support Center: FAQs & Troubleshooting Guides
This technical support resource addresses common experimental challenges in developing enzymatic hydrogen peroxide (H₂O₂) sensors, with a specific focus on strategies to enhance long-term stability through improved electron transfer at engineered interfaces.
Frequently Asked Questions (FAQs)
Q1: What are the primary causes of long-term stability failure in enzymatic H₂O₂ sensors, and how can heterostructure interfaces address this? The main causes are enzyme denaturation and leaching, as well as the degradation of the electrical contact between the enzyme and the electrode surface. Heterostructures, such as metal-organic frameworks (MOFs) combined with conductive substrates, can create a stable, protective nanoenvironment for the enzyme. For instance, incorporating enzymes into the porous structure of a stable MOF like PCN-224 can shield them from harsh conditions while facilitating efficient electron transfer via the integrated conductive pathways, significantly improving operational lifespan [20].
Q2: My sensor signal degrades rapidly during continuous operation. What interface properties should I investigate? Rapid signal decay often points to issues with electron transfer kinetics or sensor fouling. Focus on:
- Electron Transfer Rate: Ensure your conductive polymer or heterostructure provides a direct and efficient pathway for electrons. Using materials with high catalytic activity, such as iron-based nanozymes (e.g., Fe@PCN-224), can boost the electron transfer rate for H₂O₂ reduction [20].
- Interferent Blocking: Incorporate a permselectivity layer, such as Nafion, which acts as a barrier to interfering species like ascorbic acid, while allowing H₂O₂ to pass through. This prevents fouling and maintains sensor sensitivity [20] [44].
Q3: How can I validate that my sensor's performance is limited by electron transfer and not by another factor? You can perform cyclic voltammetry (CV) and electrochemical impedance spectroscopy (EIS).
- CV: A large peak-to-peak separation in your CV readings indicates slow electron transfer kinetics.
- EIS: A large semicircle in the high-frequency region of a Nyquist plot signifies high charge-transfer resistance at the electrode interface. Improving the interface with conductive polymers or carbon nanomaterials like graphene nanoplatelets should shrink this semicircle, demonstrating enhanced electron transfer [36].
Q4: Are there self-powered sensor designs that can improve stability by simplifying the system? Yes, self-powered electrochemical sensors (SPES) that operate in a fuel-cell configuration eliminate the need for an external power supply, which can simplify the system and reduce potential failure points. These systems use the chemical energy from the reaction of H₂O₂ at the anode and cathode to generate a measurable current. Using robust, non-enzymatic catalyst materials like iron phthalocyanine (FePc) on graphene in these systems can further enhance long-term stability [36].
Troubleshooting Guide: Common Experimental Issues
| Symptom | Possible Cause | Solution |
|---|---|---|
| Low Sensitivity | Poor electron transfer between enzyme and electrode; Low catalytic activity of the interface. | Integrate conductive polymers or carbon nanomaterials (e.g., graphene nanoplatelets) to boost conductivity [36]. Use highly active nanozymes like Fe@PCN-224 [20]. |
| Signal Drift Over Time | Enzyme leaching or denaturation; Fouling of the electrode surface. | Stabilize enzymes within a porous MOF matrix [20]. Apply a Nafion permselectivity layer to block interferents [20] [44]. |
| Poor Selectivity | Interference from other electroactive species (e.g., ascorbic acid, uric acid). | Use a Nafion coating or other charge-selective membranes on the sensor surface [20] [44]. |
| High Background Noise | Non-specific binding; Unstable reference electrode; Electrical interference. | Implement a "Null" sensor (without the enzyme) to subtract background signals [44]. Ensure all calibrations are performed in a Faraday cage on an air table to reduce noise [44]. |
| Short Sensor Lifespan | Physical degradation of the catalytic layer; Dissolution or corrosion of components. | Employ ultra-stable framework materials like Zr-based MOFs for their strong metal-carboxylate bonds [20]. For non-enzymatic sensors, use inorganic catalysts known for their durability. |
Protocol 1: Fabrication of a Stable Fe@PCN-224/Nafion Modified Electrode
This protocol details the synthesis of a non-enzymatic nanozyme-based H₂O₂ sensor with demonstrated long-term stability [20].
1. Materials and Reagents
- Tetrakis(4-carboxyphenyl)porphyrin (H₂TCPP)
- Zirconyl chloride octahydrate (ZrOCl₂·8H₂O)
- Benzoic acid
- Dimethylformamide (DMF)
- Iron(III) chloride (FeCl₃)
- Nafion solution (10%)
- Phosphate Buffer Saline (PBS, pH 7.4)
2. Step-by-Step Methodology
- Synthesis of PCN-224: Dissolve 50 mg H₂TCPP, 150 mg ZrOCl₂·8H₂O, and 1.4 g benzoic acid in 50 mL DMF. Heat the solution at 90°C for 5 hours with stirring. Collect the resulting PCN-224 nanoparticles by centrifugation and wash three times with fresh DMF [20].
- Preparation of Fe@PCN-224: Disperse 60 mg of as-synthesized PCN-224 and 80 mg of FeCl₃ in 20 mL DMF. Stir for 30 minutes at room temperature, then heat at 120°C with stirring (300 rpm) for 8 hours. Collect the Fe@PCN-224 product by centrifugation and wash three times with DMF [20].
- Electrode Modification: Prepare an ink by dispersing Fe@PCN-224 in a diluted Nafion solution. Deposit a precise volume of this ink onto a polished glassy carbon electrode (GCE) and allow it to dry, forming the Fe@PCN-224/Nafion/GCE working electrode [20].
3. Characterization and Calibration
- Use Scanning Electron Microscopy (SEM) to confirm the hierarchical structure of the composite [20].
- Perform cyclic voltammetry (CV) and amperometric measurements in a standard three-electrode cell with a platinum counter electrode and a saturated calomel reference electrode.
- Calibrate the sensor by adding known concentrations of H₂O₂ to the stirred PBS and recording the amperometric response.
Quantitative Performance Data of Advanced H₂O₂ Sensors
The following table summarizes key performance metrics from recent studies, providing benchmarks for sensor development.
Table 1: Performance Metrics of Selected H₂O₂ Sensors from Literature
| Sensor Configuration | Detection Principle | Linear Range | Detection Limit | Reported Stability | Key Feature |
|---|---|---|---|---|---|
| Fe@PCN-224/Nafion/GCE [20] | Amperometric (Non-enzymatic) | 2 μM - 13,000 μM | 0.7 μM | Current decreased only 3.4% over 30 days | Ultra-stable Zr-MOF framework |
| THP-based Sensor [45] | Amperometric (Non-enzymatic) | Not Specified | 144 nM | High repeatability and stability | Exceptional sensitivity for biomedical use |
| GNP-FePc / Ni SPES [36] | Self-Powered (Fuel Cell) | Not Specified | 0.6 μM | Stable power output | No external power required; uses FePc nanozyme |
| Enzymatic Biosensor (in vivo) [44] | Amperometric (Enzymatic) | Biologically relevant ranges | Not Specified | Requires pre- and post-calibration | Designed for real-time measurement in blood-perfused tissue |
The Scientist's Toolkit: Research Reagent Solutions
Table 2: Essential Materials for Engineering Sensor Interfaces
| Material / Reagent | Function in Sensor Development |
|---|---|
| Nafion | A perfluorosulfonated ionomer used as a permselective membrane to block anionic interferents (e.g., ascorbate) and as a binder to immobilize materials on the electrode surface [20] [44]. |
| Graphene Nanoplatelets (GNPs) | A conductive carbon nanomaterial used to enhance electron transfer and prevent the aggregation of catalyst molecules like iron phthalocyanine (FePc), thereby improving sensitivity [36]. |
| PCN-224 (Zr-MOF) | A porous, ultra-stable metal-organic framework that provides a high-surface-area scaffold for immobilizing enzymes or hosting catalytic metal ions, enhancing stability and catalytic site density [20]. |
| Iron Phthalocyanine (FePc) | An enzyme-mimetic catalyst (nanozyme) for H₂O₂ reduction. Its structure mimics peroxidase enzymes but offers greater stability and tunability [36]. |
| Benzoic Acid | Used as a modulator in the synthesis of Zr-MOFs like PCN-224 to control crystal size and morphology [20]. |
Experimental Workflow and Performance Visualization
The following diagram illustrates the core workflow for developing a stable H₂O₂ sensor, from material synthesis to performance validation, as detailed in the protocols.
Figure 1: Workflow for Fabricating a Stable H₂O₂ Sensor.
This diagram compares the key stability-enhancing properties of different material interfaces discussed in the troubleshooting guide and protocols.
Figure 2: Interface Components for Sensor Stability.
Protective Membranes and Coatings for Anti-Fouling and Interference Elimination
A technical guide for researchers combating sensor degradation in complex biological environments
Troubleshooting Guide: FAQs for Experimental Challenges
Q1: My electrochemical sensor shows significant signal drift during prolonged incubation in cell culture medium. What protective strategies can help?
A: Signal drift in complex media like cell culture medium is typically caused by biofouling—the nonspecific adsorption of proteins, lipids, and other biomolecules onto your electrode surface. This creates an impermeable layer that degrades analytical characteristics. Consider these protective coatings [46]:
- Silicate sol-gel layers: Provide excellent long-term stability, maintaining detectable signals for up to 6 weeks in cell culture environments, though initial signal may drop by approximately 50% within the first 3 hours.
- Poly-L-lactic acid (PLLA): Offers good initial protection with minimal signal changes in early hours, but complete signal deterioration may occur after 72 hours.
- Poly(L-lysine)-g-poly(ethylene glycol): Combines the stability of poly-L-lysine with the antifouling properties of PEG, effectively sustaining catalyst performance.
Q2: How can I eliminate interference from redox-active species in my enzymatic H₂O₂ biosensor?
A: Redox-active interferents can be mitigated using conductive membranes that selectively filter species before they reach the electrode surface. A novel approach employs conductive membranes that allow target analytes and redox-inactive species to pass while electrochemically deactivating unwanted redox-active interferents [47]. These membranes act as molecular filters that selectively permit passage based on electrochemical activity rather than just size exclusion.
Q3: What coating strategies provide both antifouling protection and minimal impact on my sensor's catalyst performance?
A: The ideal coating must protect without interfering with the catalyst's function. Recent systematic screening of >10 antifouling layers identified that only sol-gel silicate, PLLA, and poly(L-lysine)-g-PEG successfully sustained catalyst performance during prolonged incubation while preserving electrochemical properties [46]. When evaluating coatings, test both protection and catalyst impact using a model redox mediator adsorbed on the electrode surface.
Q4: My non-enzymatic H₂O₂ sensor needs both stability in aqueous solution and prevention of catalyst aggregation. What material solutions exist?
A: Catalyst aggregation is a common challenge, particularly with biomimetic materials like hemin. Consider hemin-encapsulated metal-organic frameworks (MOFs) such as Hemin⊂MIL-88-NH₂ deposited on carbon nanotubes [16]. This approach:
- Encapsulates hemin molecules inside MOF pores to prevent aggregation
- Maintains catalytic activity in aqueous solutions
- Enhances electron transfer when combined with conductive materials like CNTs
- Provides a biomimetic peroxidase structure with improved dispersion
Protective Membranes and Coatings: Performance Comparison
Table 1: Antifouling layers for electrochemical sensors in biological environments
| Coating Type | Protection Mechanism | Stability Duration | Key Advantages | Limitations |
|---|---|---|---|---|
| Silicate sol-gel | Porous barrier, thermal stability | ~6 weeks | Exceptional long-term stability, biocompatible | Initial signal drop (~50% in 3h) |
| Poly-L-lactic acid (PLLA) | Physical barrier | <72 hours | Minimal initial signal change | Complete deterioration after 72h |
| Poly(L-lysine)-g-poly(ethylene glycol) | Repellent surface, hydration layer | Sustained performance | Combines stability with repellency | Requires optimization of chain lengths |
| Conductive membranes | Electrochemical filtering, molecular selectivity | Varies by application | Targets redox-active interferents specifically | May require specialized fabrication |
| Nafion membranes | Cation exchange, size exclusion | Long-term (30 days) [20] | High stability, efficient electron transfer | Specific to certain sensor configurations |
| Hemin⊂MIL-88-NH₂/CNT | Catalyst encapsulation, dispersion | Enhanced stability | Prevents molecular aggregation, maintains activity | Complex synthesis procedure |
Table 2: Performance metrics of featured H₂O₂ sensing platforms incorporating protective elements
| Sensor Platform | Linear Range (μM) | Detection Limit (μM) | Stability Profile | Application Context |
|---|---|---|---|---|
| Fe@PCN-224/Nafion/GCE [20] | 2-13,000 | 0.7 | Current decreased only 3.4% over 30 days | Fishery products, food safety |
| Self-powered H₂O₂ sensor (GNP-FePc) [36] | Not specified | 0.6 | Functional in blood serum | Medical diagnostics, point-of-care |
| Hemin⊂MIL-88-NH₂/CNT [16] | 0.5-1,830.5 | 0.45 | Enhanced stability vs. native hemin | Biomedical monitoring |
Experimental Protocols: Key Methodologies
Protocol: Applying Silicate Sol-Gel Antifouling Layers
Principle: Sol-gel silicate layers form porous, mechanically stable coatings that act as physical barriers against fouling agents while allowing analyte diffusion [46].
Procedure:
- Prepare silicate precursor solution following established sol-gel protocols
- Apply precursor to cleaned electrode surface using spin-coating or dip-coating methods
- Control coating thickness through processing parameters (spin speed, withdrawal rate)
- Age coating under controlled humidity and temperature
- Characterize porosity and thickness using appropriate analytical methods
- Validate protection efficacy in cell culture medium over time using electrochemical measurements
Validation: Test coated electrodes in cell culture medium for up to 6 weeks, monitoring signal retention compared to uncoated controls.
Protocol: Fabricating Fe@PCN-224/Nafion-Modified Electrodes for H₂O₂ Detection
Principle: Metal-organic frameworks provide enzyme-mimetic catalytic activity with superior stability, while Nafion acts as both dispersant and interferent barrier [20].
Procedure:
- Synthesize PCN-224 nanoparticles: Combine 50 mg H₂TCPP, 150 mg ZrOCl₂·8H₂O, and 1.4 g benzoic acid in 50 mL DMF. Heat at 90°C for 5 hours with stirring.
- Form Fe@PCN-224: Disperse 60 mg PCN-224 and 80 mg FeCl₃ in 20 mL DMF. Stir for 30 minutes at room temperature, then heat at 120°C for 8 hours with stirring at 300 rpm.
- Prepare electrode modification: Create homogeneous dispersion of Fe@PCN-224 in Nafion solution.
- Modify glassy carbon electrode (GCE): Apply Fe@PCN-224/Nafion mixture to polished GCE surface and allow to dry.
- Characterize: Use scanning electron microscopy to verify hierarchical structure and electrochemical methods to validate H₂O₂ detection performance.
Application: Detect H₂O₂ in complex samples like fishery products, validating against reference methods (e.g., photometrical methods).
Protocol: Implementing Conductive Membranes for Interference Mitigation
Principle: Conductive membranes electrochemically deactivate redox-active interferents while allowing passage of target analytes [47].
Procedure:
- Select appropriate conductive membrane material based on target analyte and expected interferents
- Integrate membrane as outer layer on sensor surface
- Optimize electrical potentials for selective deactivation of interferents
- Validate selectivity in solutions containing both target analyte and common interferents
- Test long-term stability of the deactivation function
Selection Framework for Protective Strategies
The following decision pathway illustrates the process for selecting appropriate anti-fouling and interference elimination strategies based on your specific research requirements:
The Scientist's Toolkit: Essential Research Reagents
Table 3: Key materials for implementing protective strategies in enzymatic H₂O₂ sensor research
| Material/Reagent | Function | Application Context | Key Considerations |
|---|---|---|---|
| Nafion (perfluorinated polymer) | Cation exchanger, dispersant, interferent barrier | Stabilizing MOF-based sensors, forming hierarchical structures | Forms coherent structures for efficient electron transfer [20] |
| Silicate sol-gel precursors | Porous antifouling coating | Long-term cell culture studies, implantable sensors | Provides mechanical/thermal stability, initial signal drop may occur [46] |
| Poly(ethylene glycol) (PEG) | Antifouling polymer, repellent surface | Biomedical applications, in vivo sensing | Various chain lengths available, biocompatible [46] |
| PCN-224 MOF | Porous coordination network, enzyme mimic | Non-enzymatic H₂O₂ sensing, stable aqueous applications | Extraordinary chemical stability, nanoporous channels [20] |
| Hemin | Peroxidase-mimetic catalyst | Biomimetic sensor design, H₂O₂ reduction | Requires encapsulation to prevent aggregation [16] |
| MIL-88-NH₂ MOF | Encapsulation scaffold for catalysts | Hemin dispersion, biomimetic peroxidase structures | Large pores with dangling amine bonds [16] |
| Graphene nanoplatelets (GNP) | Conductivity enhancement, support material | Improving electron transfer in self-powered sensors | Prevents catalyst aggregation, enhances sensitivity [36] |
| Iron phthalocyanine (FePc) | Enzyme mimetic catalyst | Cathode material in self-powered sensors, H₂O₂ reduction | Poor native conductivity, requires supporting materials [36] |
Protocols for Storage and Re-calibration to Maintain Sensor Accuracy Over Time
This technical support center provides targeted guidance for researchers working to enhance the long-term stability of enzymatic hydrogen peroxide (H₂O₂) sensors. The following troubleshooting guides and FAQs address common challenges in experimental research and development.
Troubleshooting Guides
Sensor Signal Drift Over Time
Problem: Gradual deviation of sensor readings from reference values during long-term experiments or storage.
- Potential Cause 1: Enzyme Denaturation
- Diagnosis: Check storage temperature records and enzyme activity assays. A decline in catalytic activity confirms this issue.
- Solution: Implement optimized storage protocols. For long-term stability, store enzymes at -20°C with stabilizing additives like glycerol. Hyperthermophilic enzymes from organisms like Pyrobaculum aerophilum can retain over 80% activity after 2 months at 4°C due to innate structural stability [39].
- Potential Cause 2: Underlying Sensor Component Drift
- Diagnosis: Observe signal changes in control sensors without enzymes, or use electrochemical impedance spectroscopy.
- Solution: Utilize automated drift compensation algorithms. Systems employing cluster-based calibration and statistical tools like Exponential Moving Average (EMA) have demonstrated a 57.80% reduction in RMSE [48].
- Potential Cause 3: Leaching of Redox Mediators
- Diagnosis: Inspect sensor solution for discoloration or test supernatant for mediator presence.
- Solution: Transition to third-generation biosensors utilizing Direct Electron Transfer (DET). A DET-type dehydrogenase fusion protein showed minimal signal loss after prolonged storage [39].
Loss of Sensor Sensitivity
Problem: Reduced sensor response per unit concentration of H₂O₂.
- Potential Cause 1: Enzyme Stabilization Matrix Failure
- Diagnosis: Analyze formulation integrity under microscopy or check stabilizer concentration.
- Solution: Reformulate with layered stabilization. "Glassy sugars" like trehalose replace water molecules and form a rigid protective matrix around the enzyme, while proteins like Bovine Serum Albumin (BSA) act as sacrificial targets for oxidative damage [49].
- Potential Cause 2: Electrode Fouling
- Diagnosis: Inspect electrode surface or test performance in a standard solution after cleaning.
- Solution: Use nanostructured electrode materials. 3D graphene hydrogels decorated with NiO octahedrons provide a large, stable surface area that resists fouling and maintains sensitivity [1].
Frequently Asked Questions (FAQs)
Q1: What is the recommended long-term storage protocol for H₂O₂ sensor strips or electrodes? For maximum shelf life, H₂O₂ sensors should be stored in moisture-proof, barrier packaging with desiccants to maintain low water activity. The storage environment should be kept at stable, cool temperatures, ideally at -20°C or lower for the enzyme component. Using formulations containing glassy sugar matrices (e.g., trehalose) and protective polymers can enable shelf lives exceeding 24 months [49].
Q2: How can I distinguish between signal drift caused by the enzyme and drift from the physical transducer? A controlled experimental setup is required. Prepare a set of sensors without the enzyme layer and subject them to the same conditions as your functional sensors. Monitor the electrochemical background signal (e.g., via Cyclic Voltammetry in a blank buffer). Drift in the non-enzymatic sensors indicates transducer/platform issues, while additional drift in the functional sensors points to enzyme-specific degradation [1] [39].
Q3: Are there alternatives to traditional enzymes that offer better stability for long-term sensing applications? Yes, two promising alternatives are:
- Hyperthermophilic Enzymes: Enzymes sourced from extremophiles, such as the aldose sugar dehydrogenase from Pyrobaculum aerophilum, are inherently more robust and can retain significant activity after extended storage [39].
- Non-Enzymatic Nanocomposites: Materials like NiO octahedrons decorated on 3D graphene hydrogels can catalyze H₂O₂ oxidation without a biological enzyme, eliminating instability associated with proteins. These sensors demonstrate good reproducibility and long-term stability [1].
Q4: What are the best practices for calibrating a large network of sensors deployed in the field? For field-deployed networks, manual calibration is impractical. Instead, implement zero-touch calibration systems. These systems use:
- Collaborative Calibration: Nearby sensors in the network cross-reference each other's readings to identify and correct outliers [50] [48].
- AI and Drift Detection: Machine learning models analyze data streams to detect anomalous drift patterns and automatically push corrected calibration coefficients to sensors Over-the-Air (OTA) [50] [51].
- "Golden Sensor" Referencing: A few, periodically validated, high-precision sensors are used as references to calibrate the entire network [51].
Table 1: Performance Data of Stabilization & Calibration Strategies
| Strategy | Key Performance Metric | Result | Reference |
|---|---|---|---|
| Hyperthermophilic DET Enzyme | Activity Retention (2 months at 4°C) | >80% | [39] |
| Layered Enzyme Formulation | Activity Retention (45°C stress test, 6 months) | ≥90% | [49] |
| Cluster-based Auto-calibration | Reduction in Root Mean Square Error (RMSE) | 57.80% | [48] |
| 3DGH/NiO25 Nanocomposite | Detection Limit for H₂O₂ | 5.3 µM | [1] |
| Zero-Touch Calibration | Reduction in Manual Maintenance Costs | 70-90% | [50] |
Table 2: Research Reagent Solutions for Stable H₂O₂ Sensors
| Reagent / Material | Function in H₂O₂ Sensor | Key Insight |
|---|---|---|
| PaeASD-cyt b562 Fusion Protein | DET-type enzyme for 3rd gen biosensors | Engineered from hyperthermophilic source for intrinsic thermal and long-term stability [39]. |
| Trehalose | Glassy Sugar Stabilizer | Forms a vitrified matrix that replaces water, reducing molecular mobility and preventing enzyme denaturation in dried films [49]. |
| Bovine Serum Albumin (BSA) | Protective Protein | Acts as a molecular crowder, stabilizes enzyme conformations, and serves as a sacrificial agent for oxidative species [49]. |
| 3D Graphene Hydrogel (3DGH) | Electrode Nanomaterial | Provides a high-surface-area, conductive scaffold that resists aggregation and facilitates electron transfer, enhancing sensitivity and stability [1]. |
| NiO Octahedrons | Nanocatalyst | Serves as a highly active, stable non-enzymatic catalyst for H₂O₂ oxidation, circumventing enzyme-related instability [1]. |
Experimental Protocols
Protocol 1: Accelerated Aging Test for Sensor Shelf-Life Prediction
This protocol is used to rapidly assess the long-term stability of sensor formulations [49].
- Preparation: Prepare multiple identical batches of the sensor (e.g., test strips or modified electrodes).
- Stress Conditioning: Place the batches in a controlled environmental chamber at an elevated temperature (e.g., 45°C or 60°C). Control samples are stored at the intended storage temperature (e.g., -20°C or 4°C).
- Sampling and Testing: At predetermined intervals (e.g., 1, 2, 4, 8 weeks), remove samples from the stress environment.
- Activity Assay: Measure the key performance metrics of the sampled sensors, such as sensitivity to a standard H₂O₂ solution and Michaelis-Menten constant (Km), using chronoamperometry or cyclic voltammetry.
- Data Analysis: Use the Arrhenius equation to model the degradation rate and extrapolate the expected shelf life at the intended storage temperature. A common industry benchmark is ≥90% activity retention after a 6-month stress test at 45°C as a proxy for 24-month stability at room temperature [49].
Protocol 2: Automated Drift Detection and Correction in Sensor Networks
This protocol outlines a data-driven approach for maintaining accuracy in deployed sensors [48] [51].
- Data Collection: Sensor nodes continuously log their readings alongside metadata (timestamp, location, internal temperature).
- Clustering: Nodes are grouped into clusters based on spatial proximity and data similarity.
- Ground-Truth Estimation: Within each cluster, a reference value is estimated using interpolation techniques like Inverse Distance Weighting (IDW) from the readings of neighboring, stable sensors.
- Drift Detection: Advanced statistical tools are applied:
- The Two-Sample Kolmogorov-Smirnov (TSKS) test compares the distribution of a sensor's recent readings to its historical data to detect significant shifts.
- The Exponential Moving Average (EMA) smooths short-term fluctuations to reveal long-term drift trends.
- Correction: If drift is detected, a Root Update Estimator (RUE) adjusts the sensor's predicted values. Calibration coefficients can be updated Over-the-Air (OTA) via a cloud-based management platform [51].
Stabilization Strategy Diagram
Benchmarking Sensor Performance: From Laboratory Validation to Real-World Application
Standardized Metrics for Assessing Long-Term Stability and Reproducibility
This technical support center provides troubleshooting guides and FAQs to help researchers address common challenges in developing enzymatic hydrogen peroxide (H₂O₂) sensors, with a focus on enhancing long-term stability and reproducibility for drug development and scientific research.
Troubleshooting Common Sensor Performance Issues
How can I troubleshoot a continuous decline in sensor sensitivity over time?
A continuous decline in sensitivity often indicates enzyme denaturation or leaching from the electrode surface.
- Root Cause: Loss of enzymatic activity or detachment of the biological recognition element from the transducer.
- Solution: Implement advanced enzyme immobilization strategies.
- Stabilizing Additives: Incorporate polyelectrolytes like diethylaminoethyl-dextran (DEAE-dextran). These additives stabilize enzymes via electrostatic interactions, helping them retain an active conformation and significantly extending the biosensor's operational lifetime [29].
- Robust Matrices: Use novel porous active carbon materials for immobilization. This porous structure physically adsorbs and protects the enzyme-polyelectrolyte complex, preventing leaching and denaturation without requiring harsh chemical coupling agents [29].
What should I do if my sensor shows inconsistent results between batches?
Inconsistent results between batches typically point to issues with the reproducibility of the electrode modification process.
- Root Cause: Irreproducible enzyme immobilization or inconsistent electrode surface preparation.
- Solution: Standardize fabrication protocols and use standardized materials.
- Controlled Immobilization: Ensure the formation of a single-layer of enzymatic probes on supporting nanoarrays. This provides a uniform platform for subsequent modification and molecular imprinting, leading to higher reproducibility [52].
- Molecular Imprinting: Apply a Molecular Imprinting Polymer (MIP) coat on the enzyme surface. This not only enhances selectivity but also standardizes the enzyme's micro-environment, minimizing batch-to-batch variation [52].
How can I address poor sensor selectivity against common interferents?
Poor selectivity occurs when substances like ascorbic acid, uric acid, or dopamine also generate a signal, interfering with H₂O₂ measurement.
- Root Cause: The enzyme's inherent ability to catalyze reactions of other compounds or non-specific binding on the electrode.
- Solution: Use molecular imprinting to create a highly selective protective layer.
- Bio-imprinting: Form MIPs directly on the surface of immobilized enzymes (e.g., Glucose Oxidase). Using density functional theory (DFT) to calculate the optimal functional monomer for the MIP ensures the creation of specific 3D cavities that preferentially permit access to the target molecule (e.g., β-D-glucose), thereby dramatically improving specificity among its isomers and other interferents [52].
Frequently Asked Questions (FAQs)
What are the key quantitative metrics for reporting long-term stability?
Long-term stability should be quantified using two primary metrics, as demonstrated in recent studies:
- Operational Stability: Measure the retention of the original sensor response (current or sensitivity) after a specific number of assay cycles or over continuous operation time. A high-quality sensor should maintain a large percentage of its initial activity over many cycles or hours [29].
- Shelf-Life Stability: Report the percentage of initial response retained after storage under defined conditions (e.g., at 4°C in buffer) for an extended period. For example, a non-enzymatic sensor based on Fe@PCN-224 exhibited only a 3.4% signal decrease after 30 days, demonstrating excellent long-term stability [53].
Which metrics are essential for demonstrating sensor reproducibility?
Reproducibility should be assessed at multiple levels:
- Intra-batch Reproducibility: The relative standard deviation (RSD) of signals from multiple sensors (e.g., n=5) fabricated in the same batch. A low RSD (e.g., <5%) indicates a robust and consistent fabrication protocol [53].
- Inter-batch Reproducibility: The RSD of signals from sensors fabricated in different batches, often on different days. This metric validates the reliability of the entire manufacturing process [43].
What are the best practices for calibrating H₂O₂ sensors to ensure data reliability?
Regular and proper calibration is critical for reliable data.
- Frequency: Calibrate sensors frequently. Electrochemical sensors for H₂O₂, especially those in demanding environments, can drift at rates of 2-5% per month, necessitating monthly or even more frequent calibration [54] [55].
- Procedure:
Experimental Protocols for Stability & Reproducibility Assessment
Protocol 1: Accelerated Operational Stability Testing
This test evaluates how a sensor withstands repeated use.
- Preparation: Place the sensor in a stirred electrochemical cell containing a suitable buffer (e.g., 0.1 M PBS, pH 7.4) at a controlled temperature (e.g., 25°C).
- Cyclic Measurement: Using amperometry at a fixed applied potential, successively add a known concentration of H₂O₂ standard to achieve a target concentration (e.g., 100 µM).
- Recording: Record the amperometric response (current) for each addition.
- Repetition: Repeat steps 2-3 for a predetermined number of cycles (e.g., 50-100 cycles).
- Analysis: Plot the normalized sensor response (% of initial current) versus the cycle number. The decay rate indicates operational stability [29].
Protocol 2: Long-Term Shelf-Life Study
This test assesses the sensor's stability during storage.
- Initial Testing: Fabricate a batch of sensors (n ≥ 3) and record their initial amperometric response to a fixed concentration of H₂O₂.
- Storage: Store the sensors under defined conditions (e.g., dry at 4°C, or immersed in a specific buffer).
- Periodic Testing: At regular intervals (e.g., daily for the first week, then weekly), retest the sensors using the same H₂O₂ concentration and measurement parameters.
- Analysis: Calculate the percentage of initial response retained at each time point. A stable sensor will show a slow decay curve [53].
The following table summarizes key stability and reproducibility metrics from recent research on H₂O₂ sensors, providing benchmarks for performance evaluation.
Table 1: Performance Metrics of Recent H₂O₂ Sensors
| Sensor Material / Type | Key Stability Metric | Reproducibility (RSD) | Reference |
|---|---|---|---|
| Fe@PCN-224/Nafion/GCE (Non-enzymatic) | ~3.4% signal decrease after 30 days [53] | Information missing | [53] |
| CeO2-phm/cMWCNTs/SPCE (Non-enzymatic) | Information missing | Intra-batch & Inter-batch reproducibility data missing from provided context [43] | [43] |
| Enzyme-Polyelectrolyte Complex (Enzymatic) | Extended operational stability; retained high activity over many measurements [29] | Good reproducibility achieved [29] | [29] |
| 3DGH/NiO25 Nanocomposite (Non-enzymatic) | Good long-term stability [1] | Good reproducibility [1] | [1] |
Experimental Workflow Visualization
The following diagram illustrates a comprehensive workflow for developing a stable and reproducible enzymatic H₂O₂ sensor, integrating key steps from enzyme engineering to performance validation.
The Scientist's Toolkit: Essential Research Reagents & Materials
Table 2: Key Materials for Stable H₂O₂ Sensor Development
| Material / Reagent | Function in Research | Rationale for Use |
|---|---|---|
| DEAE-Dextran | Enzyme stabilizing polyelectrolyte [29]. | Protects enzyme conformation via electrostatic interactions, drastically improving operational stability [29]. |
| Porous Active Carbon | Electrode material / immobilization matrix [29]. | High surface area and porous structure protect immobilized enzymes, preventing leaching and denaturation [29]. |
| Nafion | Ionomer / protective membrane [53]. | Disperses nanomaterials, immobilizes them on the electrode, and acts as an interferent barrier (e.g., repels negatively charged ascorbic acid) [53]. |
| Molecular Imprinting Polymers (MIPs) | Selectivity-enhancing coating [52]. | Creates specific 3D cavities on the sensor surface, shielding the enzyme and allowing selective access to the target analyte, improving both selectivity and stability [52]. |
| Metal-Organic Frameworks (MOFs) e.g., PCN-224, Fe@PCN-224 | Nanozyme / enzyme mimic [53]. | Offers ultra-stability, high surface area, and enzyme-like catalytic activity for H₂O₂, bypassing the inherent instability of biological enzymes [53]. |
The accurate detection of hydrogen peroxide (H₂O₂) is critically important across biomedical research, clinical diagnostics, and drug development. As a key metabolic product and signaling molecule, H₂O₂ plays a dual role in cellular function—at normal physiological levels, it participates in cellular signaling and metabolism, but when allowed to accumulate, it can cause oxidative damage to lipids, proteins, and DNA, leading to various diseases [57] [13]. Traditional detection methods like fluorescence, chemiluminescence, and spectrophotometry are often complex, expensive, and time-consuming [57]. Electrochemical sensors provide a simpler, rapid, and cost-effective alternative, but their long-term operational stability remains a significant challenge, particularly for enzymatic sensors [57] [13]. This technical support article provides a comparative analysis and troubleshooting guide for researchers developing and working with H₂O₂ sensing platforms, with a specific focus on overcoming stability limitations within the context of thesis research aimed at improving enzymatic sensor performance.
Sensor Comparison: Mechanisms, Advantages, and Limitations
The core challenge in H₂O₂ sensor development lies in balancing sensitivity and selectivity with long-term stability and cost. The table below summarizes the key characteristics of the three main sensor types.
Table 1: Comparative analysis of enzymatic, non-enzymatic, and nanozyme-based H₂O₂ sensors.
| Feature | Enzymatic Sensors | Non-Enzymatic Sensors | Nanozyme-Based Sensors |
|---|---|---|---|
| Catalytic Element | Natural enzymes (e.g., HRP, Glucose Oxidase) [57] | Noble metals, metal oxides, carbon materials [57] [58] | Nanomaterials (e.g., Fe₃O₄, Pt-Ni alloys, MOFs) [57] [59] [60] |
| Mechanism | Catalytic oxidation/reduction of H₂O₂ at the enzyme's active center [57] | Direct electrocatalytic oxidation/reduction on the nanomaterial surface [58] | Enzyme-mimicking catalytic activity (e.g., peroxidase-like) [59] |
| Primary Advantage | High catalytic activity and substrate specificity [57] | Simple preparation, good stability, low cost [57] | Tunable activity, high stability, robust activity, lower cost than enzymes [59] [61] |
| Key Stability Challenge | Enzyme denaturation, leaching, inhibition by products (e.g., H₂O₂) [57] [13] | Electrode fouling ("poisoning") by intermediate species [58] | Potential specificity issues, complex optimization of nanozyme properties [59] |
| Typical Stability Duration | Short-term (days to weeks) [29] | Long-term (weeks to months) [57] | Long-term (up to 60 days reported) [60] |
Troubleshooting Guide: Common Experimental Issues and Solutions
Enzymatic Sensor Stability
- Problem: Rapid Signal Loss or Drift
- Potential Cause: Enzyme denaturation or inactivation due to the accumulation of the reaction product, H₂O₂, which can attack and degrade the enzyme's active site [13].
- Solution: Implement an enzymatic cascade system. Co-immobilize catalase (CAT) with your primary enzyme (e.g., glucose oxidase). Catalase will rapidly decompose the generated H₂O₂ into water and oxygen, protecting the primary enzyme and significantly improving the sensor's photostability, enzymatic activity, and biocompatibility [13].
- Problem: Inconsistent Performance Between Sensor Batches
- Potential Cause: Leaching of the enzyme or mediator from the electrode matrix, a common issue in carbon paste electrodes [29].
- Solution: Utilize advanced immobilization strategies. Adsorb a enzyme-polyelectrolyte complex (e.g., using diethylaminoethyl-dextran) into a porous active carbon electrode. The polyelectrolyte helps the enzyme retain its active conformation, while the porous structure provides a stable hosting environment, leading to extended operational stability and good reproducibility [29].
General Sensor Performance and Calibration
- Problem: Sensor Calibration Failure
- Potential Cause: Use of expired calibration solutions, improper solution preparation, or debris/fouling on the sensor surface [56].
- Solution: Always use fresh, within-date calibration solutions prepared precisely according to manufacturer or protocol instructions. Thoroughly clean the sensor electrode before calibration to remove any accumulated debris [56].
- Problem: Drift in Readings Over Time
- Potential Cause: Fouling of the sensor's membrane or electrode by biological growth or chemical deposits; aging of the sensor components; or temperature fluctuations [56].
- Solution: Establish a regular cleaning protocol using mild, manufacturer-recommended solutions. Regularly inspect and clean the membrane/electrode. Ensure temperature compensation is functioning correctly if working in non-isothermal environments [56].
- Problem: Low Sensitivity or Slow Response
- Potential Cause (Nanozyme/Non-enzymatic): Suboptimal catalytic activity of the nanomaterial or low surface area.
- Solution: Explore advanced nanomaterials with higher catalytic activity. For instance, Pt-Ni hydrogels with a 3D porous structure have demonstrated excellent peroxidase-like activity, high affinity for substrates, and rapid response times due to their large surface area and efficient electron transfer pathways [60].
The following diagram illustrates the core problem of H₂O₂-induced degradation in enzymatic sensors and the protective solution offered by an enzymatic cascade.
Essential Experimental Protocols
Protocol: Constructing a Stable Glucose Oxidase-Based Sensor with Catalase
This protocol is adapted from research demonstrating enhanced long-term stability for implantable optical sensors [13].
- Oxygen-Sensing Pdot Preparation: Synthesize or acquire oxygen-sensitive semiconducting polymer dots (Pdots). A common composition is poly(9,9-dihexylfluorenyl-2,7-diyl) (PDHF) doped with an oxygen-sensitive porphyrin like palladium(II) meso-tetra(pentafluorophenyl) porphine (PdTFPP) [13].
- Enzyme Complex Formation: Form a biocomplex by conjugating Glucose Oxidase (GOx) and Catalase (CAT) with the Pdots. This creates a Pdot-GOx/CAT transducer.
- Immobilization: Immobilize the Pdot-GOx/CAT complex onto your chosen electrode substrate (e.g., a glassy carbon electrode or a screen-printed electrode).
- Calibration: Calibrate the sensor in a standard phosphate buffer (e.g., 10 mM, pH ~7.4) by measuring the luminescence or electrochemical response against known glucose or H₂O₂ concentrations. The catalytic activity of GOx consumes oxygen, which is detected by the Pdots, while CAT simultaneously decomposes the harmful byproduct H₂O₂.
- Validation: Validate sensor performance by detecting H₂O₂ released from stimulated living cells (e.g., HeLa cells) and compare the results with a standard method like UV-vis spectrophotometry [13] [60].
Protocol: Evaluating Nanozyme Peroxidase-like Activity
This is a standard method for characterizing nanozymes, such as Pt-Ni hydrogels [60].
- Reagent Preparation: Prepare a solution of 3,3',5,5'-Tetramethylbenzidine (TMB) and a solution of H₂O₂ in a suitable buffer (e.g., acetate buffer, pH ~4).
- Nanozyme Addition: Add the nanozyme material (e.g., PtNi3 hydrogel) to the mixed TMB/H₂O₂ solution.
- Incubation and Measurement: Allow the catalytic reaction to proceed for a fixed time (e.g., 3-10 minutes) at room temperature.
- Detection: Measure the UV-Vis absorption spectrum of the solution. The oxidation of TMB by the nanozyme in the presence of H₂O₂ will produce a blue color with a characteristic absorption peak at 652 nm.
- Kinetic Analysis: Perform a steady-state kinetic assay by varying the concentrations of TMB and H₂O₂ to calculate Michaelis-Menten constants (Kₘ and Vₘₐₓ) and compare the nanozyme's affinity and catalytic activity to natural horseradish peroxidase (HRP) [60].
The Scientist's Toolkit: Key Research Reagents
Table 2: Essential materials and reagents for H₂O₂ sensor development and troubleshooting.
| Reagent/Material | Function in H₂O₂ Sensing | Example Use Case |
|---|---|---|
| Glucose Oxidase (GOx) | Biocatalyst that oxidizes glucose, consuming O₂ and producing H₂O₂. Serves as the recognition element [13] [29]. | Core enzyme in first-generation enzymatic glucose/H₂O₂ biosensors. |
| Horseradish Peroxidase (HRP) | Biocatalyst that reduces H₂O₂ while oxidizing a chromogenic substrate. A common enzymatic transducer [57] [59]. | Used in enzymatic sensors to catalyze a colorimetric or electrochemical reaction with H₂O₂. |
| Catalase (CAT) | Biocatalyst that decomposes H₂O₂ into water and oxygen. Used as a stabilizing agent [13]. | Added to enzymatic sensors in a cascade to remove damaging H₂O₂ byproduct, improving stability. |
| TMB (3,3',5,5'-Tetramethylbenzidine) | Chromogenic substrate. It is oxidized in the presence of HRP or peroxidase-like nanozymes and H₂O₂, producing a blue color [59] [60]. | Standard reagent for quantifying peroxidase activity in colorimetric assays and sensor characterization. |
| Pt-Ni Hydrogels | Nanozyme with excellent peroxidase-like and electrocatalytic activity for H₂O₂ reduction [60]. | Used as a stable, highly active enzyme-mimic in non-enzymatic colorimetric and electrochemical sensors. |
| DEAE-Dextran | A polyelectrolyte used to stabilize enzymes via electrostatic interactions during immobilization [29]. | Improves enzyme stability and retention of activity on electrode surfaces, extending sensor lifetime. |
Frequently Asked Questions (FAQs)
Q1: What is the single biggest factor limiting the long-term stability of enzymatic H₂O₂ sensors? The inherent instability of the biological enzyme is a primary constraint. Enzymes can denature under varying pH or temperature and can be inhibited or degraded by their own reaction products. Research shows that the continuous generation and accumulation of H₂O₂ itself during operation can deactivate the enzyme and degrade surrounding materials, leading to signal drift and failure [13].
Q2: Are nanozymes a direct and perfect replacement for natural enzymes? Not yet. While nanozymes offer superior stability, lower cost, and tunable activity, they often lack the exquisite substrate specificity of natural enzymes. This can lead to interference from other substances in complex samples. Furthermore, optimizing their catalytic activity and selectivity to match natural enzymes requires sophisticated nanomaterial engineering [59] [58].
Q3: My sensor readings are unstable. What are the first things I should check? First, verify your calibration. Ensure you are using a fresh, properly prepared calibration solution [56]. Second, inspect and clean your electrode surface for any visible fouling or debris [56]. Third, if working with enzymatic sensors, consider whether product (H₂O₂) accumulation might be damaging your biorecognition layer and test the addition of a stabilizer like catalase [13] or a polyelectrolyte [29].
Q4: For a thesis focused on improving enzymatic sensor stability, what is a promising research direction? Moving from single-enzyme systems to multi-enzyme cascades is a highly promising strategy. Mimicking metabolic pathways in cells, where the product of one enzyme is immediately processed by the next, can prevent the accumulation of harmful intermediates. Integrating catalase to decompose H₂O₂ as soon as it is generated by an oxidase is a prime example of this approach that has been shown to significantly enhance operational stability [13].
FAQs: Sensor Performance and Troubleshooting in Complex Matrices
FAQ 1: What are the most common causes of signal instability in enzymatic H₂O₂ sensors when testing in blood serum? Signal instability in serum is frequently caused by biofouling, where proteins and other biomolecules non-specifically adsorb to the sensor surface, blocking the active sites and reducing sensitivity [23]. Additionally, the complex composition of serum can lead to interference from other electroactive species (e.g., ascorbic acid, uric acid) that are oxidized at a similar potential, generating a false current signal [4] [62]. Enzyme inactivation or leaching from the sensor surface over time also contributes to signal drift and instability [23].
FAQ 2: How can I improve the selectivity of my H₂O₂ sensor in complex biological environments like whole blood? Employing a protective membrane is a common and effective strategy. For instance, a Nafion membrane can repel negatively charged interferents like ascorbate and urate while allowing neutral H₂O₂ molecules to pass through [20]. Another approach is the use of non-enzymatic sensors based on biomimetic materials, such as iron phthalocyanine or metal-organic frameworks (MOFs) like Fe@PCN-224, which offer inherent selectivity for H₂O₂ and are less susceptible to deactivation than enzymes [63] [20].
FAQ 3: My sensor performs well in buffer but its sensitivity drops significantly in cell culture media. What could be the issue? This performance drop is often attributed to the scavenging of H₂O₂ by components in the cell culture media [64]. Media often contains antioxidants or serum components that rapidly decompose H₂O₂ before it can reach the sensor's active surface. To validate if this is the issue, perform a standard addition experiment in the actual cell culture media to account for this scavenging effect and establish a reliable calibration curve [63].
FAQ 4: What are the best practices for calibrating a sensor intended for use in variable pH environments, such as in sweat or near cells? The performance of many H₂O₂ sensors, especially those using enzymatic or biomimetic catalysts, is highly pH-dependent [63] [3]. It is crucial to:
- Calibrate the sensor in a buffer that matches the pH of your target matrix as closely as possible.
- Use a pH sensor simultaneously to monitor and correct for any local pH fluctuations during the H₂O₂ measurement.
- Note that some sensor materials, like FePc-based cathodes, may show their best performance at a specific pH (e.g., pH 3.0) [63].
FAQ 5: For long-term stability studies, how can I distinguish between sensor drift and actual changes in H₂O₂ concentration? Implementing a robust continuous calibration protocol is key. This can be achieved by periodically spiking the sample with a known concentration of H₂O₂ and measuring the sensor's response. A consistent decrease in response to the same spike indicates sensor drift or fouling. Using a genetically encoded biosensor like HyPer as an internal reference in cell cultures can also provide an independent measure of intracellular H₂O₂ concentration for comparison [64].
Troubleshooting Guide: Common Experimental Issues
Table 1: Troubleshooting Common Problems in Complex Matrices
| Problem | Possible Cause | Solution |
|---|---|---|
| High Background Noise/Current | Interference from electroactive species (Ascorbic Acid, Uric Acid) in the sample [4] [62]. | Use a selective membrane (e.g., Nafion) [20] or apply a lower operating potential with a different electrocatalyst. |
| Signal Drift Over Time | Biofouling on the electrode surface [23] or degradation/leaching of the enzymatic or catalytic layer [23] [20]. | Incorporate an anti-fouling layer (e.g., hydrogel). Use more stable non-enzymatic catalysts (e.g., Fe@PCN-224) [20]. |
| Low Sensitivity & Poor Detection Limit | Passivation of the active catalytic sites [63] or H₂O₂ scavenging by the sample matrix itself [64]. | Optimize the catalyst loading and electrode morphology. Use standard addition method for calibration to correct for scavenging [63]. |
| Poor Reproducibility Between Sensors | Inconsistent electrode modification or fabrication process [63]. | Standardize the preparation protocol (e.g., drop-casting volume, drying conditions) [63]. |
| Sensor Works in Buffer but Fails in Biological Fluid | Combined effects of fouling, interference, and matrix scavenging [64]. | Validate the sensor step-by-step: first in buffer, then in spiked serum, and finally in the real sample. Use a protective membrane and matrix-matched calibration. |
Quantitative Performance in Biological Matrices
Table 2: Exemplary Performance Metrics of H₂O₂ Sensors in Complex Matrices
| Sensor Type / Material | Detection Limit (μM) | Linear Range | Matrix Tested | Key Finding / Stability Note |
|---|---|---|---|---|
| Self-Powered (FePc/GNP Cathode) [63] | 0.6 μM | Not specified | Blood Serum | Successfully determined H₂O₂ in serum using the standard addition method. |
| Non-enzymatic (Fe@PCN-224/Nafion) [20] | 0.7 μM | 2 - 13,000 μM | Fishery Products | High stability: current remained nearly stable over 2300 s; decreased only 3.4% over 30 days. |
| Genetically Encoded (HyPer Biosensor) [64] | (Intracellular) | (Monitors gradients) | Cell Cytoplasm (K-562, HeLa, MSCs) | Enables measurement of extracellular-to-intracellular H₂O₂ gradients, revealing antioxidant capacity. |
Essential Experimental Protocols
Protocol 1: Standard Addition Method for Matrix-Effects Correction
This method is critical for obtaining accurate concentration values in complex samples like serum, where the matrix can enhance or suppress the signal [63].
- Sample Aliquot: Divide the unknown sample into several equal-volume aliquots.
- Spike Addition: To each aliquot, add a known and increasing volume of a standard H₂O₂ solution.
- Dilution Control: Bring all aliquots to the same final volume with a compatible buffer.
- Measurement: Measure the sensor's response (e.g., current) for each spiked sample.
- Data Analysis: Plot the measured response against the concentration of the added H₂O₂ standard. The absolute value of the x-intercept of the best-fit line gives the concentration of H₂O₂ in the original, unspiked sample.
Protocol 2: Fabrication of a Graphene-Modified Biomimetic Sensor Electrode
This protocol outlines the preparation of a stable, non-enzymatic electrode using iron phthalocyanine (FePc) and graphene nanoplatelets (GNP) to prevent aggregation and improve conductivity [63].
- Materials: Glassy Carbon Electrode (GCE), FePc, Graphene Nanoplatelets (GNP), Dimethylformamide (DMF), Nafion solution, Polishing powder.
- Steps:
- GCE Preparation: Polish the GCE with 0.05 μm alumina slurry, then wash and dry it.
- Ink Preparation: Dissolve FePc in DMF (0.6 mg/mL). Separately, disperse GNP in DMF (3 mg/mL) and ultrasonicate. Create a GNP–FePc mixture and place it on a rotator for 3 hours to ensure homogeneous mixing.
- Modification: Drop-cast 7 μL of the GNP–FePc mixture onto the clean GCE surface.
- Drying: Dry the modified electrode at 60 °C for 40 minutes.
- Nafion Coating: Drop-cast 7 μL of a 0.33% Nafion solution (in DMF) onto the modified surface and dry again at 60 °C for 40 minutes. The Nafion layer acts as a protective barrier.
- The electrode is now ready for electrochemical testing after cooling to room temperature.
Protocol 3: Measuring Intracellular H₂O₂ Gradients Using HyPer Biosensor
This protocol uses a genetically encoded biosensor to compare the antioxidant capacity of different cell types by quantifying the gradient between external and internal H₂O₂ [64].
- Cell Preparation: Culture and transduce the cells of interest (e.g., cancer cells, stem cells) with a lentiviral vector encoding the HyPer-cyto biosensor.
- Oxidative Stress Induction: Expose the cells to a range of known extracellular H₂O₂ concentrations (e.g., from low μM to high loads >50 μM).
- Kinetic Measurement: Use flow cytometry to monitor the oxidation kinetics of the HyPer biosensor in real-time. The fluorescence ratio (Ex 490/Ex 420) is proportional to intracellular H₂O₂ concentration.
- Gradient Calculation: For each applied extracellular H₂O₂ concentration, the established intracellular concentration is measured. The gradient is calculated as [H₂O₂]extracellular / [H₂O₂]intracellular.
- Interpretation: A steeper gradient indicates a more potent antioxidant defense system in the cell cytoplasm.
The Scientist's Toolkit: Key Research Reagent Solutions
Table 3: Essential Materials for H₂O₂ Sensor Development and Validation
| Reagent / Material | Function / Application | Example Use Case |
|---|---|---|
| Nafion Perfluorinated Resin [63] [20] | A cation-exchange polymer used to coat electrodes. It repels negatively charged interferents and can help immobilize catalysts. | Creating a selective barrier on a Fe@PCN-224 modified electrode for H₂O₂ detection in fishery products [20]. |
| Graphene Nanoplatelets (GNP) [63] | A carbon nanomaterial with high conductivity and surface area. Used as a support to prevent aggregation of catalyst molecules and enhance electron transfer. | Dispersing Iron Phthalocyanine (FePc) to create a high-sensitivity cathode for a self-powered H₂O₂ sensor [63]. |
| Iron Phthalocyanine (FePc) [63] | A biomimetic catalyst with peroxidase-like activity. Serves as a stable, non-enzymatic alternative for H₂O₂ reduction. | Used as the cathode catalyst in a self-powered sensor for detecting H₂O₂ in blood serum [63]. |
| Metal-Organic Frameworks (e.g., PCN-224) [20] | Highly porous crystalline materials with ultra-stable structures and a high density of catalytic sites. Can be metalated (e.g., with Fe) to create nanozymes. | Fabricating Fe@PCN-224 for a non-enzymatic sensor with a wide linear range and excellent long-term stability [20]. |
| HyPer Biosensor [64] | A genetically encoded, fluorescent protein-based sensor for specific detection of H₂O₂ inside living cells. | Quantifying intracellular H₂O₂ concentrations and extracellular-to-intracellular gradients in various human cell lines [64]. |
Experimental Workflow and Decision Pathways
Cost-Benefit Analysis of Advanced Sensor Designs for Clinical and Research Settings
The accurate detection of hydrogen peroxide (H₂O₂) is critical in clinical diagnostics, food safety, and pharmaceutical research. A significant challenge in the field is maintaining long-term sensor stability, as enzymatic sensors are particularly susceptible to performance degradation over time. This technical support center provides targeted troubleshooting guidance to help researchers identify and resolve the most common issues that compromise sensor longevity, drawing from recent advances in material science and sensor design.
Troubleshooting Guide: Common H₂O₂ Sensor Failure Modes and Solutions
FAQ 1: What are the primary causes of signal drift in enzymatic H₂O₂ sensors, and how can they be mitigated?
- Problem: Signal drift, characterized by a gradual change in sensor output over time without variation in the target analyte concentration, is a frequent complaint.
- Solutions:
- Enzyme Denaturation: The biological activity of enzymes like Horseradish Peroxidase (HRP) can degrade due to environmental factors.
- Mitigation: Utilize protective encapsulation matrices. Three-dimensional nanoparticle structures, such as HRP-encapsulated protein nanoparticles (HEPNP), can shield the enzyme from denaturation, preserving activity [65].
- Hydrogen Peroxide Accumulation: H₂O₂, a product of the glucose oxidase reaction, is a strong oxidant that can cause photobleaching of optical components and reduce enzymatic activity [13].
- Mitigation: Implement an enzymatic cascade system. Co-immobilizing glucose oxidase with catalase (GOx/CAT) rapidly decomposes H₂O₂ into water and oxygen, preventing its accumulation and protecting the sensor components [13].
- Fouling: Surface fouling from proteins or other biomolecules in complex samples can impede analyte access.
- Mitigation: Use protective membranes like Nafion, which can act as a dispersant and interferent barrier, forming a uniform membrane that immobilizes sensing materials while reducing fouling [20].
- Enzyme Denaturation: The biological activity of enzymes like Horseradish Peroxidase (HRP) can degrade due to environmental factors.
FAQ 2: How can I improve the poor electron transfer efficiency of my sensor, which leads to low sensitivity?
- Problem: Low sensitivity, requiring high concentrations of H₂O₂ for a detectable signal, often stems from inefficient electron transfer between the enzyme's active site and the electrode.
- Solutions:
- Incorporate Conductive Nanomaterials: Modify the electrode surface with materials that enhance electrical conductivity.
- Reduced Graphene Oxide (rGO): rGO has a large surface area, extraordinary electrical character, and good conductivity. Using rGO-modified electrodes can significantly improve electron transfer from enzymatic nanoparticles to the electrode, enhancing the electrochemical signal [65].
- Metal-Organic Frameworks (MOFs): Porous conductive materials like Fe@PCN-224 provide a larger specific surface area and a higher density of accessible catalytic sites, facilitating efficient electron transfer [20].
- Incorporate Conductive Nanomaterials: Modify the electrode surface with materials that enhance electrical conductivity.
FAQ 3: My sensor lacks specificity and is affected by common interferents. How can I enhance its selectivity?
- Problem: Selectivity issues arise when substances like ascorbic acid, uric acid, or glucose produce a similar signal to H₂O₂, leading to false positives.
- Solutions:
- Use Perm-Selective Membranes: Nafion membranes can repel negatively charged interferents like ascorbic acid and uric acid at physiological pH, significantly improving selectivity for H₂O₂ detection [20].
- Leverage Enzyme Specificity: The inherent specificity of enzymes like glucose oxidase (for glucose sensors) and HRP remains a powerful tool. Ensuring these enzymes are properly immobilized and active is key to maintaining selectivity [65] [13].
Quantitative Performance Comparison of Sensor Strategies
The table below summarizes key performance metrics from recent sensor designs, providing a benchmark for evaluating your own system's performance.
Table 1: Performance Metrics of Advanced H₂O₂ Sensor Designs
| Sensor Design | Detection Principle | Linear Range | Limit of Detection (LOD) | Stability & Key Advantage | Reference |
|---|---|---|---|---|---|
| Fe@PCN-224/Nafion/GCE | Non-enzymatic Electrochemical | 2 μM - 13,000 μM | 0.7 μM | Current decreased only 3.4% over 30 days; Exceptional long-term stability [20]. | [20] |
| HEPNP/rGO/Au Electrode | Enzymatic Electrochemical (HRP) | 0.01 μM - 100 μM | 0.01 μM (10 nM) | High sensitivity and selectivity in human blood serum; 3D structure amplifies signal [65]. | [65] |
| Pdot-GOx/CAT | Enzymatic Optical | 4 mM - 16 mM (Physiological) | N/A | Enzymatic cascade (CAT) eliminates H₂O₂, improving photostability and biocompatibility for implantable sensors [13]. | [13] |
Experimental Protocol: Fabrication of a Stable Fe@PCN-224-Based H₂O₂ Sensor
This protocol details the synthesis of a highly stable non-enzymatic sensor based on Fe@PCN-224 metal-organic frameworks, which demonstrated minimal signal loss over a 30-day period [20].
Materials Required
- ZrOCl₂·8H₂O: Metal cluster source for MOF framework.
- Tetrakis(4-carboxyphenyl)porphyrin (H₂TCPP): Organic linker molecule.
- N,N-Dimethylformamide (DMF): Solvent for synthesis.
- Benzoic Acid: Modulator for controlling crystal growth.
- FeCl₃: Iron ion source for incorporating catalytic centers.
- Nafion (10% in water): Binder and protective membrane.
- Glassy Carbon Electrode (GCE): Working electrode substrate.
Step-by-Step Procedure
Synthesis of PCN-224 Nanoparticles:
- Dissolve 50 mg of H₂TCPP, 150 mg of ZrOCl₂·8H₂O, and 1.4 g of benzoic acid in 50 mL of DMF.
- Heat the solution at 90°C for 5 hours with stirring to form PCN-224 crystals.
- Collect the resulting nanoparticles by centrifugation and wash three times with fresh DMF to remove unreacted precursors [20].
Preparation of Fe@PCN-224:
- Disperse 60 mg of as-synthesized PCN-224 and 80 mg of FeCl₃ in 20 mL of DMF.
- Stir the mixture for 30 minutes at room temperature.
- Heat the solution at 120°C with stirring (300 rpm) for 8 hours to incorporate Fe³⁺ ions into the porphyrin units of the MOF.
- Collect the Fe@PCN-224 product by centrifugation and wash three times with DMF. The product can be stored in DMF for future use [20].
Electrode Modification (Fe@PCN-224/Nafion/GCE):
- Prepare an ink by dispersing Fe@PCN-224 in a dilute Nafion solution (e.g., 0.5% Nafion).
- Drop-cast a precise volume (e.g., 5-10 μL) of the ink onto a clean, polished surface of a Glassy Carbon Electrode (GCE).
- Allow the electrode to dry thoroughly at room temperature, forming a stable, hierarchical composite film ready for use [20].
The workflow for this fabrication process is summarized in the following diagram:
The Scientist's Toolkit: Essential Research Reagents
Table 2: Key Reagents for Enhancing H₂O₂ Sensor Stability
| Reagent | Function in Sensor Design | Rationale for Improved Stability |
|---|---|---|
| Catalase (CAT) | Co-immobilized enzyme in an enzymatic cascade [13]. | Rapidly decomposes harmful H₂O₂ byproduct, preventing oxidative damage to sensor components and local tissues. |
| Nafion | Cation-selective polymer membrane [20]. | Acts as a robust immobilization matrix and interferent barrier, repelling common anionic interferents and reducing surface fouling. |
| Reduced Graphene Oxide (rGO) | Electrode surface modifier [65]. | Provides high conductivity and large surface area, enhancing electron transfer efficiency and signal strength. |
| Fe-doped MOFs (e.g., Fe@PCN-224) | Nanozyme (enzyme mimic) catalytic core [20]. | Offers enzyme-like activity with superior framework stability and resistance to denaturation compared to biological enzymes. |
| Protein Nanoparticles (e.g., HEPNP) | Three-dimensional enzyme encapsulation matrix [65]. | Protects a large quantity of enzyme from denaturation, maintains enzymatic activity, and amplifies the electrochemical signal. |
Stabilization Pathways for Sensor Design
The core strategies for stabilizing enzymatic H₂O₂ sensors can be visualized as two complementary pathways addressing different degradation mechanisms. The following diagram illustrates the problem-solution relationships for both electrochemical and optical sensor platforms.
Conclusion
The pursuit of long-term stability in enzymatic H₂O₂ sensors is being successfully addressed through multi-faceted strategies that target the root causes of degradation. Key takeaways include the efficacy of biomimetic enzymatic cascades to neutralize destructive H₂O₂ byproducts, the superior performance of advanced nanostructured materials like 3D hydrogels and MXenes as stable enzyme supports, and the promise of novel architectures such as self-powered sensors for simplified, robust operation. The choice between highly specific enzymatic sensors and durable non-enzymatic alternatives hinges on the specific application, with hybrid approaches offering a compelling middle ground. Future progress will likely involve the integration of smart materials for self-healing capabilities, the development of multi-analyte sensing platforms for comprehensive metabolic panels, and rigorous long-term in vivo validation to bridge the gap from laboratory innovation to routine clinical and point-of-care application, ultimately enabling more reliable health monitoring and drug development tools.
References
- 1. Enzymeless electrochemical detection of hydrogen ... [https://www.nature.com/articles/s41598-025-10472-6]
- 2. Hydrogen Peroxide Fuel Cells and Self-Powered ... [https://pmc.ncbi.nlm.nih.gov/articles/PMC11852683/]
- 3. Possibilities and Challenges for Quantitative Optical ... [https://www.mdpi.com/2227-9040/5/4/28]
- 4. Flexible Sensors for Hydrogen Peroxide Detection: A Critical ... [https://pmc.ncbi.nlm.nih.gov/articles/PMC9104121/]
- 5. Hydrogen Peroxide Sensors for Biomedical Applications [https://www.mdpi.com/2227-9040/7/4/64]
- 6. Inactivation of Carbonyl-Detoxifying Enzymes by H2O2 Is a ... [https://pmc.ncbi.nlm.nih.gov/articles/PMC7070697/]
- 7. A Brief Review of How to Construct an Enzyme-Based H 2 ... [https://www.scirp.org/journal/paperinformation?paperid=106108]
- 8. Picomolar Detection of Hydrogen Peroxide using Enzyme- ... [https://www.nature.com/articles/s41598-017-01356-5]
- 9. Monitoring and control of the release of soluble O2 from H2O2 ... [https://pmc.ncbi.nlm.nih.gov/articles/PMC9545842/]
- 10. Electrocatalytic investigation of H2O2 reduction and ... [https://www.sciencedirect.com/science/article/abs/pii/S0927775723020101]
- 11. Hydrogen Peroxide Sensing Based on Inner Surfaces ... [https://pmc.ncbi.nlm.nih.gov/articles/PMC5478554/]
- 12. Efficient electrochemical sensor for determination of H 2 O ... [https://www.sciencedirect.com/science/article/abs/pii/S1572665720311826]
- 13. Enhancing the Long-Term Stability of a Polymer Dot ... [https://pmc.ncbi.nlm.nih.gov/articles/PMC8168372/]
- 14. Operational stability of amperometric hydrogen peroxide ... [https://www.sciencedirect.com/science/article/abs/pii/S0925400599001616]
- 15. Investigation of GOx Stability in a Chitosan Matrix [https://www.mdpi.com/1424-8220/23/1/465]
- 16. Hydrogen peroxide sensor using the biomimetic structure ... [https://www.sciencedirect.com/science/article/abs/pii/S0169433220335455]
- 17. Next-generation hydrogen peroxide sensors based on ... [https://pubmed.ncbi.nlm.nih.gov/40463503/]
- 18. A Comprehensive Guide to Enzyme Immobilization: All You ... [https://pmc.ncbi.nlm.nih.gov/articles/PMC11857967/]
- 19. Pros and Cons in Various Immobilization Techniques ... [https://link.springer.com/article/10.1007/s12010-023-04838-7]
- 20. A Long-Term Stable Sensor Based on Fe@PCN-224 for ... [https://pmc.ncbi.nlm.nih.gov/articles/PMC7918592/]
- 21. Highly sensitive and selective H2O2 sensors based on ... [https://www.sciencedirect.com/science/article/abs/pii/S0925400521013599]
- 22. Advantages/disadvantages of immobilization techniques in ... [https://www.xantec.com/news/whitepapers_newsletters_click_coupling_advantages_disadvantages.php]
- 23. Challenges and Strategies in Developing an Enzymatic ... [https://pmc.ncbi.nlm.nih.gov/articles/PMC8781831/]
- 24. Enzymatic vs Non-enzymatic Glucose Biosensors [https://synapse.patsnap.com/article/enzymatic-vs-non-enzymatic-glucose-biosensors-pros-and-cons]
- 25. New Reusable Solid Biosensor with Covalent ... [https://pmc.ncbi.nlm.nih.gov/articles/PMC7017489/]
- 26. Immobilized Enzymes in Biosensor Applications - PMC [https://pmc.ncbi.nlm.nih.gov/articles/PMC6337536/]
- 27. Covalent immobilization: A review from an enzyme ... [https://www.sciencedirect.com/science/article/pii/S1385894724095457]
- 28. Recent Strategies for the Immobilization of Therapeutic ... [https://pmc.ncbi.nlm.nih.gov/articles/PMC9003532/]
- 29. Improved operational stability of biosensors based on ... [https://www.sciencedirect.com/science/article/abs/pii/S0956566398000669]
- 30. Improving Biosensors: Scientists Solve Significant Enzyme ... [https://scitechdaily.com/improving-biosensors-scientists-solve-significant-enzyme-challenge-using-special-material/]
- 31. Solving The Enzyme Immobilization Problem - The Polymerist [https://polymerist.substack.com/p/solving-the-enzyme-immobilization]
- 32. Tailoring nanostructured MXene to adjust its dispersibility ... [https://www.sciencedirect.com/science/article/pii/S1359836824000027]
- 33. Highly Sensitive Detection of Hydrogen Peroxide in Cancer ... [https://pmc.ncbi.nlm.nih.gov/articles/PMC11201644/]
- 34. Fabrication of 3D MXene@graphene hydrogel with high ... [https://www.sciencedirect.com/science/article/abs/pii/S0013468623010678]
- 35. Advanced perspectives on MXene composite nanomaterials [https://pmc.ncbi.nlm.nih.gov/articles/PMC9826899/]
- 36. A Study on the Mechanism and Properties of a Self ... [https://www.mdpi.com/2079-6374/14/6/290]
- 37. A Systematic Analysis of Recent Technology Trends ... [https://www.mdpi.com/2072-666X/14/7/1293]
- 38. Seamless integration of CMOS microsensors into open ... [https://pubs.rsc.org/en/content/articlehtml/2025/lc/d4lc01000k]
- 39. Creation of a highly stable direct electron transfer-type ... [https://link.springer.com/article/10.1007/s10529-025-03587-3]
- 40. Multilayered Sandwich Structure Sensor: Confinement ... [https://pubmed.ncbi.nlm.nih.gov/40928184/]
- 41. Effect of pH on the Electrochemical Behavior of Hydrogen ... [https://pmc.ncbi.nlm.nih.gov/articles/PMC8685425/]
- 42. Enzymeless voltammetric hydrogen peroxide sensor based on the use... [https://link.springer.com/article/10.1007/s00604-016-2025-y]
- 43. A Flexible Electrochemical Sensor Based on Porous Ceria ... [https://pmc.ncbi.nlm.nih.gov/articles/PMC12563342/]
- 44. Use of Enzymatic Biosensors to Quantify Endogenous ATP or ... [https://pmc.ncbi.nlm.nih.gov/articles/PMC4684070/]
- 45. THP as a sensor for the electrochemical detection of H 2 O 2 [https://www.sciencedirect.com/science/article/pii/S0045206824006266]
- 46. Methods of Protection of Electrochemical Sensors against ... [https://pmc.ncbi.nlm.nih.gov/articles/PMC10831843/]
- 47. A novel conductive membrane sensor protection technique ... [https://www.sciencedirect.com/science/article/pii/S2590137023000638]
- 48. Enhanced drift self-calibration of low-cost sensor networks ... [https://www.sciencedirect.com/science/article/abs/pii/S0263224124010431]
- 49. Double Your Shelf Life: Long Lasting Fast Glucose Enzymes [https://bbisolutions.com/insights/news/enzyme-stabilization-glucose-sensors/]
- 50. Zero-Touch Calibration and Auto-Drift Compensation in ... [https://promwad.com/news/zero-touch-calibration-auto-drift-compensation-sensor-fleets]
- 51. Sensor Calibration at Scale: Automated Techniques for ... [https://runtimerec.com/sensor-calibration-at-scale-automated-techniques-for-millions-of-iot-devices/]
- 52. Simultaneously enhancing the selectivity and stability of ... [https://www.sciencedirect.com/science/article/abs/pii/S0925400522006815]
- 53. A Long-Term Stable Sensor Based on Fe@PCN-224 for ... [https://www.mdpi.com/2304-8158/10/2/419]
- 54. Troubleshooting VHP Generators | Common Issues and ... [https://qualia-bio.com/blog/troubleshooting-vhp-generators-common-issues-and-solutions/]
- 55. Overcoming H2O2 Gas Monitoring Challenges [https://www.badgermeter.com/blog/h2o2-gas-monitoring/]
- 56. Troubleshooting Common Issues with Dissolved Oxygen ... [https://www.boquinstrument.com/a-news-troubleshooting-common-issues-with-dissolved-oxygen-sensors.html]
- 57. A review on recent advances in hydrogen peroxide ... [https://www.sciencedirect.com/science/article/abs/pii/S1001841722001590]
- 58. Non-Enzymatic Electrochemical Sensing [https://encyclopedia.pub/entry/3186]
- 59. Nanozymes towards Personalized Diagnostics: A Recent ... [https://pmc.ncbi.nlm.nih.gov/articles/PMC10136715/]
- 60. Portable visual and electrochemical detection of hydrogen ... [https://www.nature.com/articles/s41378-023-00623-y]
- 61. Nanozyme-based sensors for detection of food biomarkers [https://www.sciencedirect.com/science/article/pii/S2046206922021945]
- 62. Recent Advances in Electrochemical Sensing of Hydrogen ... [https://www.mdpi.com/2079-4991/12/9/1475]
- 63. A Study on the Mechanism and Properties of a Self-Powered ... [https://pmc.ncbi.nlm.nih.gov/articles/PMC11202192/]
- 64. Resistance to H2O2-induced oxidative stress in human cells ... [https://pmc.ncbi.nlm.nih.gov/articles/PMC8818566/]
- 65. Electrochemical H 2 O 2 biosensor based on horseradish ... [https://nanoconvergencejournal.springeropen.com/articles/10.1186/s40580-020-00249-0]