Plant-Powered Purification: Optimizing Transpiration for Water Recycling in Closed Systems
This article explores the integration of plant transpiration as a core mechanism for water recycling within controlled, closed environments.
Plant-Powered Purification: Optimizing Transpiration for Water Recycling in Closed Systems
Abstract
This article explores the integration of plant transpiration as a core mechanism for water recycling within controlled, closed environments. Targeting researchers and drug development professionals, it provides a comprehensive examination of the foundational science, from stomatal regulation and water-carbon trade-offs to the hydraulic principles governing water movement. It details methodological approaches for system design and implementation, including the selection of plant species and monitoring techniques. The scope extends to troubleshooting common challenges like humidity balance and contamination, and presents validation frameworks through comparative analysis of efficiency metrics and case studies. The synthesis aims to provide a scientific basis for leveraging plant-based systems in applications requiring sustainable, biological water management, such as advanced life support and controlled agricultural environments for pharmaceutical production.
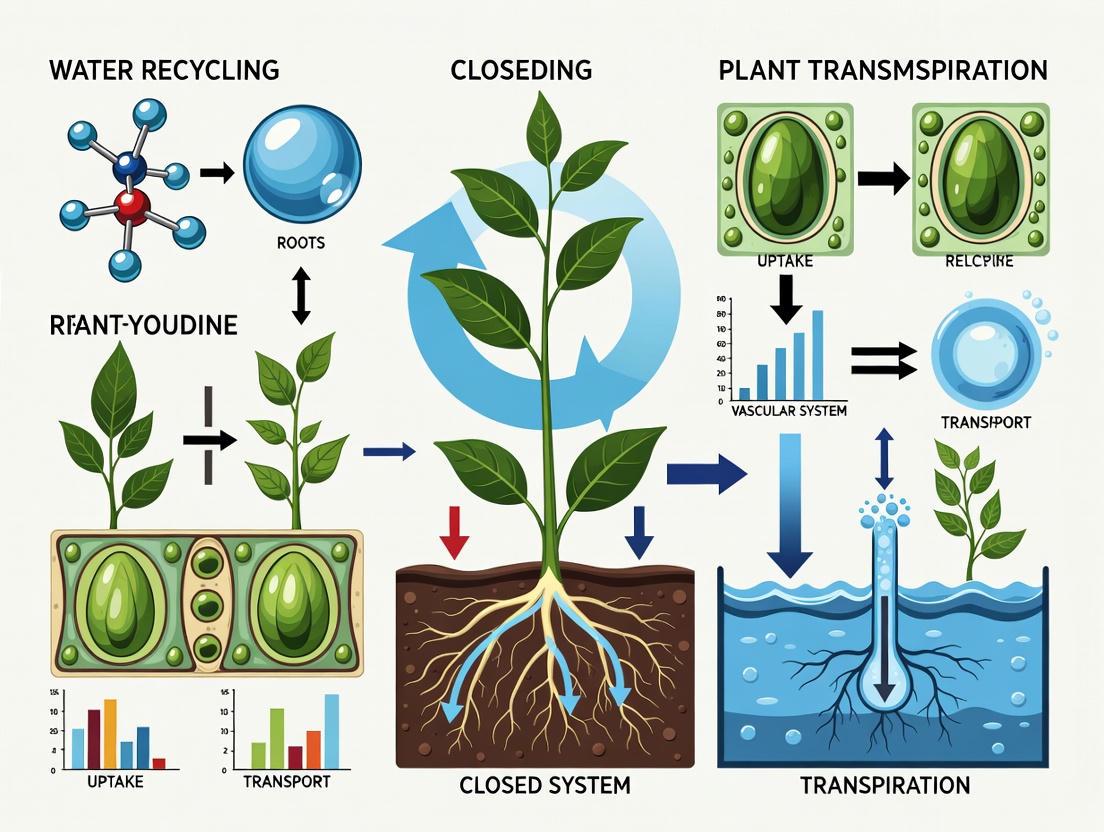
The Science of Plant-Powered Water Cycling: Principles of Transpiration and Stomatal Regulation
Transpiration, the process of water movement through plants and its subsequent evaporation from aerial parts, is a fundamental component of the global water cycle. In closed-system research, such as in controlled ecological life support systems (CELSS) for pharmaceutical production or biospace applications, understanding and managing transpiration is critical for efficient water recycling and system stability. This process links the soil-plant continuum to the atmosphere, serving as a natural engine that drives water purification and redistribution. This document provides detailed application notes and experimental protocols for quantifying and analyzing plant transpiration, with a specific focus on applications in closed-system water recycling research.
Quantitative Data on Global Transpiration Trends
Long-term studies have quantified significant changes in global plant transpiration, which is a crucial consideration for projecting water dynamics in long-duration closed systems. The table below summarizes key findings from recent multi-decadal analyses.
Table 1: Documented Trends in Global Plant Transpiration and Evapotranspiration (ET)
| Study Period | Annual Change Rate | Total Change Over Study Period | Primary Contributing Factors | Geographic Variability |
|---|---|---|---|---|
| 1990 - 2020 [1] | +0.79 ± 0.28 mm/year | +397.2 ± 63.1 mm (≈6%) [1] | Greener landscapes (higher LAI) contributing ~40-66%; Climate change ~19% [1] | Increase over ~70% of land (e.g., Africa, India, China, Europe); Decreases in water-limited regions (e.g., parts of S. America, Australia) [1] |
| 1981 - 2012 [1] | +0.72 ± 0.23 mm/year | - | Not specified in source | - |
| 1980 - 2021 [1] | +0.61 - 0.79 mm yr⁻² | - | CO₂-induced stomatal closure (-38% effect); Land-use changes (-3% effect) [1] | - |
| Evapotranspiration (ET) 1982-2011 [1] | +0.66 ± 0.38 mm year⁻² | - | Not specified in source | - |
| Evapotranspiration (ET) 2001-2020 [1] | +1.19 ± 0.31 mm year⁻² | - | Not specified in source | - |
These trends highlight the dynamic response of plant water use to environmental drivers like atmospheric CO₂. In closed systems, controlling these drivers allows for the manipulation of transpiration rates to optimize water recycling efficiency.
Key Environmental Drivers and Stomatal Regulation
Plant transpiration is controlled by a complex interplay of environmental variables and plant physiological responses, primarily mediated by stomata.
Primary Environmental Drivers
The influence of environmental factors on canopy transpiration (Ec) can vary across the growing season and by species. Research on conifer plantations in semiarid regions found the following percentage contributions to Ec [2]:
Table 2: Contributions of Key Environmental Factors to Canopy Transpiration (Ec)
| Environmental Factor | Contribution to Ec (Early/Late Season) | Contribution to Ec (Middle Season) |
|---|---|---|
| Soil Water Content (SWC) | High (20.4% - 48.8%) [2] | Lower (as other factors become more influential) |
| Vapor Pressure Deficit (VPD) | Significant stomatal inhibition by VPD [2] | Contributions increase with soil water availability [2] |
| Total Solar Radiation (Rs) | - | High (22.7% - 35.8%) [2] |
Stomatal Traits and Transpiration Efficiency
Stomata, which comprise only about 3% of a leaf's area, regulate 98% of its CO₂ uptake and water loss, making their traits critical for transpiration efficiency (TE)—the net dry matter accumulated per unit of water transpired [3].
- Stomatal Size and Density: These traits are generally inversely related. Smaller stomata can react faster to environmental changes, while density affects the sheer number of water loss pathways [3].
- Stomatal Patterning: Clustered stomata can restrict CO₂ diffusion and reduce photosynthesis, which is why a "one-cell-spacing" rule is typically maintained [3].
- Guard Cell Anatomy: Kidney-shaped guard cells (common in many plants) and dumbbell-shaped guard cells (found in grasses) differ in their response speeds due to size and the involvement of subsidiary cells [3].
- Stomatal Response Speed: The speed at which stomata open and close in response to stimuli like light, VPD, and CO₂ is a key trait. Photosynthetic rate adjusts in seconds, while stomatal conductance can take minutes to hours, leading to inefficiencies where water is lost without CO₂ uptake, or CO₂ uptake is limited while stomata are still opening [3].
The following diagram illustrates the logical relationships between environmental factors, plant traits, and the transpiration process.
Experimental Protocols for Transpiration Analysis
This section provides detailed methodologies for measuring transpiration at different scales, from individual leaves to whole plants and forest stands, all applicable to closed-system research.
Protocol: Canopy Transpiration Analysis via Sap Flow in a Common Garden
Application Note: This protocol is ideal for comparing water use efficiency (WUE) across different plant genotypes or species within a controlled environment, a key task for selecting optimal cultivars for closed systems [4].
Background: Sap flow monitoring using Thermal Dissipation Probe (TDP) technology is a reliable method for calculating whole-plant and canopy-level water consumption over extended periods, providing insights into the soil-plant-atmosphere continuum (SPAC) [4].
Materials:
- Thermal Dissipation Probes (TDP)
- Data logger with multi-channel capacity
- Growth cone drill or increment borer
- Micro-meteorological station (to monitor Rs, VPD, Ta, soil moisture)
- Plant material with different genetic provenances or species
Procedure:
- Site and Plant Selection: Establish a common garden with consistent climatic, slope, soil, and altitude conditions. Select healthy, representative individuals from each genotype or species group [4].
- Sapwood Area (Aₛ) Determination:
- Select 20 trees with a range of diameters at breast height (DBH).
- Use a growth cone drill to extract a sapwood core sample from the DBH during the growing season.
- In the lab, measure the sapwood radius and calculate the total sapwood area [4].
- Sap Flow Sensor Installation:
- Install paired TDP sensors (each consisting of a heated and unheated probe) into the sapwood at DBH, following the standard methodology [4].
- Ensure probes are properly insulated and shielded from external elements.
- Connect sensors to a data logger programmed to record measurements at 30-minute intervals.
- Environmental Monitoring: Simultaneously record soil moisture (REW), solar radiation (Rs), vapor pressure deficit (VPD), and air temperature (Ta) at the site [4].
- Data Collection and Calculation:
- Data Analysis:
- Calculate mean daily Ec for each provenance/species.
- Use statistical tests (e.g., ANOVA) to determine if differences in Ec between groups are significant.
- Employ models like Boosted Regression Trees (BRT) to quantify the relative contributions of SWC, Rs, VPD, and Ta to E_c, especially under different soil moisture regimes (e.g., REW < 0.4 vs. REW ≥ 0.4) [4] [2].
Protocol: Leaf-Level Gas Exchange Measurements
Application Note: This protocol is used for high-resolution, instantaneous measurement of transpiration rate, stomatal conductance (gₛ), and photosynthetic rate, allowing for direct calculation of instantaneous Water Use Efficiency (WUE) [1].
Materials:
- Portable Photosynthesis System with capacity to measure transpiration, stomatal conductance, and photosynthesis simultaneously.
- Mature, healthy leaves from the plant of interest.
Procedure:
- System Calibration: Calibrate the gas exchange system according to the manufacturer's instructions, focusing on CO₂ and H₂O infrared gas analyzers (IRGAs) and flow meters.
- Leaf Selection and Placement: Select a sun-exposed, fully expanded leaf. Carefully seal the leaf within the instrument's cuvette, ensuring no damage to the leaf or leaks in the seal.
- Environmental Control: Set the cuvette's environmental conditions to match the ambient environment or a desired set point (e.g., light intensity, CO₂ concentration, temperature, humidity) using the instrument's control modules [1].
- Data Recording: Allow the system to stabilize until gas exchange readings are steady. Record the transpiration rate, stomatal conductance (gₛ), and net photosynthetic rate (A).
- Calculation: Calculate instantaneous WUE as A / Transpiration Rate.
- Experimental Manipulation: The system can be used to conduct response curves, such as:
- Light Response Curves: Measure gₛ and transpiration at varying light levels.
- VPD Response Curves: Measure gₛ and transpiration at varying vapor pressure deficits.
The workflow for a comprehensive transpiration study, from leaf to canopy, is summarized below.
The Scientist's Toolkit: Research Reagent Solutions
This table lists key materials and instruments essential for conducting transpiration research in closed-system environments.
Table 3: Essential Research Tools for Plant Transpiration Studies
| Tool / Material | Function & Application Note |
|---|---|
| Portable Photosynthesis System (e.g., CI-340) | Measures leaf-level transpiration, stomatal conductance (gₛ), and photosynthesis simultaneously in real-time. Critical for obtaining instantaneous Water Use Efficiency (WUE) and generating environmental response curves [1]. |
| Thermal Dissipation Probes (TDP) | Monitors stem sap flow to calculate whole-plant and canopy transpiration (E_c) over long periods. Ideal for non-destructive, continuous monitoring in common garden experiments and closed-system stands [4]. |
| Plant Canopy Imager (e.g., CI-110) | Quantifies Leaf Area Index (LAI), a key structural parameter that is a major driver of total canopy transpiration. Essential for scaling from leaf to canopy [1]. |
| Micro-Meteorological Station | Monitors key environmental drivers: Solar Radiation (Rs), Vapor Pressure Deficit (VPD), Air Temperature (Ta), and Soil Water Content (SWC). Data is used to model and attribute causes of variation in transpiration rates [4] [2]. |
| Growth Cone Drill / Increment Borer | Determines sapwood area by extracting a core sample, which is necessary for converting sap flow velocity to total plant water use in volume/time [4]. |
| Unified Modeling Framework | A theoretical framework reconciling empirical and complex mechanistic models of transpiration. Allows researchers to select the most efficient model complexity for their specific closed-system environment and plant type [5]. |
Implications for Closed-System Water Recycling
The physiological effects of CO₂ on transpiration introduce a significant dynamic that must be managed in closed systems. While theory suggests that stomatal closure under elevated CO₂ should reduce transpiration and conserve water, the resulting changes in precipitation patterns within atmospherically coupled systems are highly uncertain and can be a dominant factor in the net water balance [6]. Therefore, managing the plant-atmosphere interface is paramount. Research must focus on selecting genotypes with optimal stomatal traits (e.g., rapid response times, appropriate density) and on modeling the full path of water from transpiration to condensation and re-use, ensuring the stability and efficiency of the closed-loop water cycle for advanced research applications.
Stomatal optimization models represent a paradigm shift in plant physiology, moving from empirical descriptions to theoretical predictions of how plants regulate their stomata to achieve an optimal balance between carbon gain for photosynthesis and the associated water loss from transpiration. In the context of closed-system research, where water is a precious, recycled resource, understanding and applying these models is critical for predicting and managing plant water use efficiently. The fundamental trade-off is straightforward: open stomata wide to absorb more carbon dioxide (CO₂) for growth, and lose more water; close stomata to conserve water, and limit growth. Optimization theory posits that plants have evolved to maximize their fitness by strategically managing this trade-off.
Two primary theoretical frameworks dominate current research. The first is the Cowan-Farquhar framework, which hypothesizes that plants regulate stomata to maximize cumulative carbon gain (A) for a given amount of water loss (E) over a defined period. Mathematically, this is expressed as maximizing A - λE, where the Lagrangian multiplier (λ) represents the marginal carbon cost of water. A key challenge with this model is predicting how λ varies with environment and plant traits [7]. The second framework is the hydraulic-risk optimization model, which proposes that plants regulate stomata to maximize instantaneous carbon gain (A) minus the risk of hydraulic damage (Θ), i.e., maximizing A - Θ. The risk function (Θ) is often quantified based on hydraulic processes like declining leaf water potential and embolism formation, directly coupling stomatal behavior with the plant's vascular system [7]. A recent synthesis of global experimental data confirms that stomatal conductance (gₛ) is significantly reduced by environmental factors like elevated CO₂, warming, and decreased precipitation, all of which are critical considerations for controlled environments [8].
stomatal Optimization in Closed-System Water Recycling
In closed systems, the transpirational water loss from plants is not wasted but is a key component of the water cycle that can be captured, purified, and reused. This makes the accuracy of transpiration predictions paramount. A global study analyzing trends from 1982 to 2021 found that plant transpiration has increased significantly, driven largely by CO₂ fertilization leading to greener landscapes (higher Leaf Area Index, LAI). Crucially, this same increase in CO₂ also causes stomatal closure, which offsets about 38% of the potential transpiration increase. Land-use changes further modulate this effect [1]. This complex interaction highlights why simple models are insufficient; optimizing water recycling requires models that can simulate these competing physiological processes.
The plant's prioritization strategy under water stress is also being redefined. A 2025 study on trees revealed that stomata close not merely to prevent catastrophic hydraulic failure, but earlier, to protect nocturnal water recharge that is essential for cell growth. When soil is dry, a tree may not even open its stomata in the morning, forsaking photosynthesis to preserve the turgor pressure needed for growth [9]. This "growth before photosynthesis" principle has profound implications for modeling carbon sequestration and water use in closed systems, suggesting that plants may prioritize the efficient use of carbon already assimilated over maximizing new carbon uptake during drought.
Quantitative Global Change Impacts on Stomatal Conductance
The following table synthesizes meta-analysis data on stomatal sensitivity to key global change factors, which can inform predictions for closed-environment conditions [8].
Table 1: Stomatal sensitivity to global change factors. Sensitivity is defined as the percentage change in gₛ per unit change in the factor.
| Global Change Factor | Sensitivity of Stomatal Conductance (gₛ) | Key Interaction Notes |
|---|---|---|
| Elevated CO₂ (eCO₂) | -8.3% per 100 ppm increase | Dominant driver; effect is consistent across biomes. |
| Warming (eT) | -1.5% per 1°C increase | Effect is strongest in boreal forests and temperate grasslands. |
| Decreased Precipitation (dP) | -3.5% per 10% decrease | Aridity index influences response. |
| Increased Precipitation (iP) | +2.1% per 10% increase | Effect is stronger in more arid regions. |
| Nitrogen Deposition (eN) | +0.8% per 1 g m⁻² year⁻¹ increase | Can offset some effects of eCO₂. |
| Ozone Pollution (eO₃) | -2.1% per 10 ppb increase | - |
Furthermore, interactions between these factors are critical. The same meta-analysis found that while the combined effects of two factors (e.g., eCO₂ + eT) are often additive, they can become antagonistic as the effect sizes increase, meaning the combined impact is less than the sum of its parts [8].
Figure 1: Logic of stomatal optimization in closed systems. Environmental inputs drive a plant's internal optimization model, which prioritizes growth or photosynthesis under different conditions, ultimately determining water recycling potential and carbon balance. VPD: Vapor Pressure Deficit.
The Hydraulic-Based Weighted (HBW) Multi-Objective Model
A recent advancement in optimization modeling is the Hydraulic-Based Weighted (HBW) model, which uses multi-objective programming to reformulate the stomatal optimization problem [7]. This model explicitly hypothesizes that plants balance two conflicting objectives: maximizing carbon gain and minimizing water loss, with the relative weight of this balance determined by the canopy hydraulic conductivity. This approach clearly distinguishes the "risk" of stomatal opening from the "weight" given to water conservation, a refinement over earlier models where these elements were mathematically blended.
The core of the HBW model lies in its multi-objective optimization. The two objective functions are:
- Maximize carbon gain (A): The photosynthetic rate, which increases with stomatal conductance (gₛ) but saturates.
- Minimize water loss (E): The transpiration rate, which increases linearly with gₛ.
These objectives are combined into a single function to be maximized:
μA - (1-μ)E, whereμis a weighting coefficient between 0 and 1 that represents the plant's strategic priority. The key innovation is thatμis dynamically set by the plant's hydraulic status, specifically the canopy hydraulic conductivity. When the soil is moist and hydraulic conductivity is high,μfavors carbon gain. As the soil dries and hydraulic conductivity drops,μshifts to favor water conservation, leading to more conservative stomatal behavior [7].
Performance and Experimental Validation
The HBW model has been tested against other leading optimization models (e.g., Sperry et al. and Wang et al.). A key differentiator is its prediction of the "Balancing Point" (BP)—the combination of normalized carbon gain (A/Aₘₐₓ) and water loss (E/E꜀ᵣᵢₜ) at which the plant operates. The HBW model predicts that as soil water potential drops, the BP moves more decisively into a conservative area with lower A/Aₘₐₓ and E/E꜀ᵣᵢₜ. In contrast, other models tend to maintain BPs with higher A/Aₘₐₓ even under dry conditions [7]. Empirical testing with leaf gas exchange data has shown that the HBW model not only captures realistic stomatal responses but also better reproduces the actual distribution of these balancing points observed in nature, particularly under drought stress [7].
Experimental Protocols for Model Parameterization and Validation
Protocol 1: Gas Exchange Measurements for Model Parameterization
Objective: To simultaneously measure leaf-level photosynthetic rate (A), transpiration rate (E), and stomatal conductance (gₛ) under varying environmental conditions to parameterize and validate optimization models.
Materials:
- Portable Photosynthesis System: e.g., CI-340 Handheld Photosynthesis System or equivalent, capable of controlling and measuring CO₂, light, temperature, and humidity within a leaf chamber [1].
- Plant Canopy Imager: e.g., CI-110 or equivalent, for measuring Leaf Area Index (LAI) [1].
- Pressure Chamber: For measuring leaf water potential (Ψₗₑₐ𝒻).
- Plant Material: Genetically stable plants acclimated to the closed-system environment.
Methodology:
- Acclimation: Allow the plant to acclimate to the closed-system growth conditions for a minimum of 4 weeks.
- Environmental Response Curves: Systematically vary one environmental parameter while holding others constant, measuring A, E, and gₛ at each step.
- Light Response Curve: Measure under increasing light intensities (e.g., 0 to 2000 μmol m⁻² s⁻¹ PAR) at constant [CO₂] and temperature.
- CO₂ Response Curve (A-Ci): Measure under increasing internal [CO₂] (Cᵢ) (e.g., 50 to 1500 ppm) at saturating light and constant temperature.
- Vapor Pressure Deficit (VPD) Response: Measure under increasing VPD by modulating chamber humidity at constant light, [CO₂], and temperature.
- Soil Moisture Stress Response: Grow plants under well-watered conditions, then withhold water. Daily, measure pre-dawn and midday leaf water potential (Ψₚ𝒹 and Ψₘ𝒹), followed immediately by gas exchange measurements under standard conditions (e.g., saturating light, ambient [CO₂], 25°C).
- Data Integration: Fit the collected A-Ci data to a biochemical model of photosynthesis (e.g., Farquhar-von Caemmerer-Berry) to derive key parameters like maximum carboxylation rate (V꜀ₘₐₓ) and maximum electron transport rate (Jₘₐₓ). The gₛ response data across all treatments is then used to fit parameters for the chosen optimization model (e.g., the λ parameter in the Cowan-Farquhar model or the risk function Θ in hydraulic models).
Protocol 2: High-Throughput Stomatal Phenotyping Using Generative AI
Objective: To rapidly and accurately characterize stomatal density, size, and aperture across multiple plant species or genotypes with minimal manual annotation.
Materials:
- Microscope: Light microscope with camera (e.g., 40x objective), capable of capturing high-resolution images of leaf impressions [10].
- Imprint Material: Clear nail polish or dental resin.
- Computing Hardware: GPU-enabled workstation for deep learning model training and inference.
- Software: Python with deep learning frameworks (e.g., PyTorch, TensorFlow) and computer vision libraries (OpenCV). Pre-trained models like YOLO11-seg for instance segmentation [10].
Methodology:
- Leaf Impression: Apply a thin layer of clear nail polish to the abaxial (lower) leaf surface. Allow it to dry completely, then carefully peel off the imprint using clear tape or a microscope slide [10].
- Image Acquisition: Capture multiple digital images per leaf impression under consistent lighting conditions.
- Model Training with Synthetic Data:
- Reference Dataset: Obtain a publicly available stomata image dataset with pre-annotated masks (e.g., a chickpea dataset) [10].
- Style Transfer: Use a generative adversarial network (GAN), such as CycleGAN or SpCycleGAN, to "translate" the reference images to match the visual "style" (e.g., color, lighting) of your target species' images without requiring manual labeling [10].
- Segmentation: Train a segmentation model (e.g., YOLO11-seg) on the synthetically generated images and their corresponding original masks to detect and segment individual stomata.
- Trait Extraction: Run the trained model on new experimental images to automatically output stomatal traits: density (number per mm²), size (pore area, length, width), and aperture.
Figure 2: High-throughput phenotyping workflow using generative AI for cross-species stomatal analysis. This pipeline reduces manual annotation by leveraging style transfer from an existing, labeled dataset to a new, unlabeled one [10].
The Scientist's Toolkit: Key Research Reagents and Materials
Table 2: Essential materials and tools for stomatal optimization research in closed systems.
| Item | Function/Description | Application in Closed-System Research |
|---|---|---|
| Portable Photosynthesis System | Instrument for simultaneous, real-time measurement of gas exchange parameters (A, E, gₛ) under controlled environmental conditions [1]. | Primary tool for collecting data to parameterize and validate optimization models. |
| Plant Canopy Imager | Device for measuring Leaf Area Index (LAI), a key determinant of whole-plant transpiration [1]. | Quantifying the contribution of canopy structure to system-level water flux. |
| Pressure Chamber | Instrument for measuring leaf water potential (Ψ), a direct indicator of plant water status. | Provides the hydraulic data critical for models like the HBW and other hydraulic-risk models. |
| Stomatal Imprint Kit | Materials (nail polish, microscope slides, tape) for creating physical impressions of the leaf epidermis [10]. | Enables microscopic analysis of stomatal density, size, and morphology. |
| Deep Learning Segmentation Model | Pre-trained AI model (e.g., YOLO11-seg) for automated detection and segmentation of stomata in microscope images [10]. | High-throughput phenotyping of stomatal traits across multiple genotypes with minimal manual effort. |
| Generative AI Models (e.g., CycleGAN) | AI tools for performing image-to-image translation, generating synthetic training data that matches a target dataset's style [10]. | Dramatically reduces the manual labeling burden when applying stomatal analysis to new plant species. |
| Hygroscopic Porous Polymers (HPPs) | Advanced materials (e.g., hydrogels, aerogels) that absorb atmospheric moisture [11]. | Integrated into closed systems for sorption-based atmospheric water harvesting (SAWH) to recycle transpired water. |
Stomatal optimization models provide a powerful, theory-driven framework for predicting plant water use in the context of closed-system water recycling. The evolution from empirical to optimization models, and most recently to multi-objective frameworks like the Hydraulic-Based Weighted model, offers increasingly accurate simulations of the complex trade-offs plants face. When combined with advanced experimental protocols for gas exchange and high-throughput phenotyping, these models become indispensable tools. They enable researchers to select or engineer ideal plant varieties and manage environmental conditions to achieve the ultimate goal of closed-system agriculture: maximizing productivity while minimizing the loss and maximizing the recycling of every drop of water.
Accurate quantification of plant transpiration is fundamental to advancing research in closed-system water recycling. Transpiration, the process of water movement through a plant and its evaporation from aerial parts, is a critical component of the water cycle. In closed-system research, understanding and measuring this process is essential for managing water resources, mitigating contaminant transfer, and designing sustainable bioregenerative life-support systems [12] [1]. This note details the key metrics, state-of-the-art methodologies, and practical protocols for precise transpiration measurement, providing a framework for researchers in drug development and environmental sciences.
Key Quantitative Metrics in Transpiration Research
Transpiration rate is influenced by a complex interplay of plant physiological traits and environmental drivers. Key quantitative metrics essential for interpretation are summarized in the table below.
Table 1: Key Quantitative Metrics for Transpiration Studies
| Metric | Typical Units | Definition & Significance | Research Context |
|---|---|---|---|
| Transpiration Rate (E) | mmol H₂O m⁻² s⁻¹ | The flux of water vapor from leaf surface per unit time, normalized by leaf area. The primary measured variable. | Fundamental for water balance models and plant phenotyping [13]. |
| Stomatal Conductance (gₛ) | mol H₂O m⁻² s⁻¹ | The measure of stomatal opening, inversely related to diffusional resistance to water vapor. Indicates plant physiological status. | Crucial for understanding plant response to environment and contaminants [13] [12]. |
| Leaf Area Index (LAI) | m² leaf / m² ground | Half the total green leaf area per unit ground surface area. A key determinant of total canopy water loss. | Global transpiration increase is strongly correlated with rising LAI [1]. |
| Vapor Pressure Deficit (VPD) | kPa | The difference between saturated and actual vapor pressure. The primary atmospheric driving force for transpiration. | Must be controlled to isolate its specific effect on E [13]. |
| Water Age | Days | The mean residence time of water from uptake to transpiration. | Reveals water sources and pathways; regulated by root-rock interactions [14]. |
Measurement Methodologies
Selecting an appropriate methodology is critical and depends on the research scale, required precision, and available resources.
Gravimetric Methods
Gravimetric methods measure water loss directly by tracking the mass of a plant or soil over time.
- Whole-Plant Chamber Systems (MoSysT): This method employs a controlled-environment chamber placed on high-precision balances. The system actively controls VPD, temperature, and light, allowing for the isolation of VPD's effect on whole-plant transpiration. Weight loss, recorded at one-minute intervals, is attributed to transpiration when soil evaporation is minimized by covering the soil surface [13].
- Multi-Lysimeter Setup: This approach uses multiple high-precision balances to monitor several plants simultaneously. Plants are grown in containers with sealed soil surfaces to prevent evaporation. The transpiration rate is calculated by differentiating the raw weight data over time [15].
Table 2: Comparison of Primary Transpiration Measurement Methodologies
| Method | Principle | Scale | Key Advantages | Key Limitations |
|---|---|---|---|---|
| Gravimetric (Chamber) | Direct mass loss of potted plant | Whole Plant | Integrative, highly accurate, direct VPD control [13] | Confined to pot size, potential chamber effects |
| Gravimetric (Lysimeter) | Direct mass loss of potted plant | Whole Plant | High-throughput, suitable for phenotyping [15] | Requires careful evaporation control |
| Infrared Gas Analysis (IRGA) | Measures water vapor concentration | Leaf/Whole Plant | Simultaneous measurement of photosynthesis [13] | Costly, can be influenced by leaf boundary layer |
| Canopy Imagery | Measures light interception | Canopy | Indirect estimation of LAI, a key correlate of transpiration [1] | Does not measure transpiration flux directly |
| Stable Isotope Tracing | Tracks isotopic composition of water | Plant-Water System | Can determine source and age of transpired water [14] | Specialized equipment required, indirect measure |
Porometry and Infrared Gas Analysis (IRGA)
Hand-held porometers or IRGAs measure leaf-level transpiration and stomatal conductance by quantifying the humidity increase in a sealed chamber clamped to a leaf. While this method provides detailed physiological data, it may not capture whole-plant heterogeneity arising from differences in leaf age, position, and architecture [13].
Stable Isotope Tracing
This method involves analyzing the stable isotopic composition (e.g., Deuterium, Oxygen-18) of water in plant xylem, soil, and rock fissures. It allows researchers to determine the sources and mean residence time (age) of water utilized by plants, which is critical for understanding water dynamics in complex environments like karst regions [14].
Detailed Experimental Protocols
Protocol: Whole-Plant Transpiration Response to VPD
This protocol, adapted from peer-reviewed methodologies, is designed to quantify the whole-plant transpiration response to VPD in a controlled environment [13] [15].
Title: Gravimetric Assessment of Whole-Plant Transpiration under Controlled VPD Gradients. Objective: To determine the transpiration rate (E) and stomatal conductance (gₛ) of a whole plant across a range of precisely controlled VPD levels. Application: Phenotyping for water-use efficiency, assessing plant response to atmospheric drought in closed-system water recycling.
Materials & Reagents:
- Plant Material: Healthy, well-watered plants (e.g., Helianthus annuus, Hordeum vulgare), grown in pots for 4-7 weeks.
- Gravimetric Chamber System (MoSysT): Featuring controlled-environment chamber, precision balances (accuracy ≥ 0.01 g), air humidification/dehumidification system, LED light source, and data logging system [13].
- Data Loggers: For temperature and relative humidity (e.g., Tinytag TV-4505).
- Materials for Evaporation Control: Fine gravel or plastic sheeting.
Procedure:
- Plant Preparation: Select homogenous plants based on leaf area. Cover the soil surface in the pot with a 2-cm layer of fine gravel or a plastic seal to minimize soil evaporation. Water the plant to capacity and allow to drain.
- System Initialization: Place the plant on a precision balance inside the main chamber. Ensure the chamber's air flow rate is sufficient to exchange the entire chamber volume more than once per minute (e.g., >40 m³ h⁻¹). Activate the data logging for weight, temperature, and humidity at 1-minute intervals.
- Environmental Stabilization: Set the initial target VPD to a low level (e.g., 0.5 kPa). Allow the system to stabilize for at least 45 minutes after target conditions are reached, ensuring the plant has acclimated.
- Data Collection: Record the initial stable weight. Maintain the constant VPD for a period of 45-60 minutes, continuously logging plant mass.
- VPD Gradient: Sequentially increase the target VPD (e.g., to 1.0, 1.5, 2.0, 2.5, and 3.0 kPa). For each step, repeat the stabilization and data collection phases. A complete run typically lasts up to 4 hours to prevent acclimation or soil water deficit.
- Leaf Area Measurement: At the conclusion of the experiment, harvest the plant and measure the total leaf area using a leaf area meter or canopy imager.
- Data Analysis:
- Calculate the transpiration rate (E) for each VPD interval from the slope of the weight loss over time, standardized by the total leaf area.
- Plot E versus VPD to characterize the plant's transpiration response (e.g., linear for anisohydric species, nonlinear for isohydric species).
The workflow for this protocol is outlined below.
Protocol: Plant Uptake of Contaminants via Transpiration Stream
This protocol is critical for assessing the risk of contaminant transfer in water-recycling systems, such as those using reclaimed water for irrigation [12].
Title: Evaluating PPCP/EDC Accumulation in Plants Driven by Transpiration. Objective: To quantify the uptake and translocation of Pharmaceuticals and Personal Care Products (PPCPs) and Endocrine Disrupting Chemicals (EDCs) in plants and correlate it with transpiration rates. Application: Risk assessment for agricultural irrigation with treated wastewater; drug development involving plant-based pharmaceuticals.
Materials & Reagents:
- Plant Material: Fast-growing species (e.g., carrot, lettuce, tomato) grown hydroponically.
- Chemical Standards: A mix of neutral and ionizable PPCP/EDCs (e.g., carbamazepine, diclofenac, caffeine).
- Hydroponic System: With controlled environment growth chambers.
- Analytical Instrumentation: LC-MS/MS for precise quantification of PPCP/EDCs in plant tissues and solution.
Procedure:
- Plant Cultivation: Grow plants hydroponically in a nutrient solution until a specified growth stage.
- Contaminant Exposure & Transpiration Manipulation: Fortify the nutrient solution with a known concentration of the target PPCP/EDCs. Divide plants into two distinct environmental treatments to create different transpiration rates: a "Warm-Dry" environment (higher transpiration) and a "Cool-Humid" environment (lower transpiration).
- Monitoring: Monitor the volume of nutrient solution lost through transpiration throughout the exposure period (e.g., 21 days). Maintain solution concentration.
- Harvest and Analysis: Harvest plants at the end of the incubation. Separate into roots, stems, and leaves. Measure the fresh and dry weight of each part. Analyze the levels of PPCP/EDCs in each plant tissue and the remaining nutrient solution using LC-MS/MS.
- Data Analysis: Calculate the bioconcentration factor (BCF) for each compound. Statistically evaluate the correlation between total transpiration volume and the accumulation of anionic, cationic, and neutral PPCP/EDCs in the shoots.
The Scientist's Toolkit: Essential Research Reagent Solutions
Table 3: Essential Materials and Tools for Transpiration Research
| Tool / Reagent | Function / Application | Example Product / Specification |
|---|---|---|
| Precision Balance | Core of gravimetric methods; measures mass loss from transpiration. | KERN KB 2400-2 N (d=0.01 g) [13]; Phenospex multi-lysimeter [15] |
| Controlled-Environment Chamber | Provides stable, replicable conditions for VPD and light response curves. | Custom MoSysT with humidification/dehumidification [13] |
| Handheld Photosynthesis System | Simultaneously measures leaf-level transpiration, stomatal conductance, and photosynthesis in real-time. | CI-340 Handheld Photosynthesis System [1] |
| Plant Canopy Imager | Measures Leaf Area Index (LAI), a critical covariate for scaling transpiration. | CI-110 Plant Canopy Imager [1] |
| Stable Isotope Analyzer | Determines the source and age of transpired water, tracing hydrological pathways. | Used for Deuterium and Oxygen-18 analysis [14] |
| Hydroponic Nutrient Solution | Provides controlled medium for uptake studies, free from soil complexity. | Hoagland's solution or similar, with defined PPCP/EDC spikes [12] |
Quantifying transpiration requires a careful match between the research question and the methodological approach. Gravimetric systems offer unparalleled accuracy for whole-plant studies under controlled conditions, while IRGAs provide detailed leaf-level physiology. Isotopic methods unlock insights into water sources and pathways. For research focused on water recycling in closed systems, integrating these methods to understand both the volume and the quality of transpired water—particularly in the context of contaminant transport—is paramount. The protocols and tools detailed herein provide a foundation for robust, reproducible research in this critical field.
In closed-system environments, such as those envisioned for advanced life support systems, the recycling of water through biological processes is paramount. Plant transpiration is a critical component of this water cycle, directly influenced by key environmental variables: light, vapor pressure deficit (VPD), and soil moisture. Understanding and managing the interplay of these drivers is essential for optimizing system water use efficiency and ensuring stability. This document provides application notes and detailed experimental protocols to guide researchers in quantifying and analyzing the effects of these environmental drivers on plant transpiration rates, with a specific focus on applications in controlled environments for water recycling research.
Theoretical Framework and Key Relationships
Plant transpiration is a physical and physiological process driven by the evaporation of water from plant surfaces, primarily through stomata. The rate of water movement through the soil-plant-atmosphere continuum (SPAC) is governed by a water potential gradient and is modulated by resistances within the system [16] [17].
The Transpiration Rate Equation: On a short time scale, the transpiration rate (Tr, mg H₂O s⁻¹) can be described as [17]:
Tr = (VPD / Pₐₜₘ) × LA × gₛ𝓌
where:
- VPD is the vapor pressure deficit (kPa)
- Pₐₜₘ is the atmospheric pressure (kPa)
- LA is the leaf area (cm²)
- gₛ𝓌 is the stomatal conductance to water vapor (mg H₂O s⁻¹ cm⁻²)
The Hydraulic Conductance Framework: Over longer periods, the flow of water is proportional to the difference in water potential and the hydraulic conductance of the SPAC [17]:
Kₛₚ = Tr / (ψₛₒᵢₗ - ψₗₑₐ𝒻)
where:
- Kₛₚ is the soil–plant hydraulic conductance (mg s⁻¹ kPa⁻¹)
- ψₛₒᵢₗ is the soil matric potential (kPa)
- ψₗₑₐ𝒻 is the leaf water potential (kPa)
Stomatal closure can be triggered by both metabolic mechanisms (e.g., abscisic acid (ABA) signaling) and passive hydraulic mechanisms when limitations in Kₛₚ cause a non-linear drop in ψₗₑₐ𝒻 [17]. The environmental drivers—light, VPD, and soil moisture—influence transpiration by affecting the driving forces and resistances described in these equations.
The following tables synthesize key quantitative relationships from recent research on how environmental drivers affect transpiration and related plant physiological parameters.
Table 1: Impact of Light Intensity and VPD on Tomato Seedling Physiology (Adapted from [16])
| Parameter | High VPD (2.22 kPa) & Low Light (300 μmol m⁻² s⁻¹) | High VPD (2.22 kPa) & High Light (600 μmol m⁻² s⁻¹) | Low VPD (0.95 kPa) & Low Light (300 μmol m⁻² s⁻¹) | Low VPD (0.95 kPa) & High Light (600 μmol m⁻² s⁻¹) |
|---|---|---|---|---|
| Water Potential Gradient (ΔΨleaf-air, MPa) | ~95 MPa | ~115 MPa | ~40 MPa | ~55 MPa |
| Stomatal Conductance (Gs, mol H₂O m⁻² s⁻¹) | Lowest | Intermediate | Intermediate | Highest |
| Stomatal Density (number mm⁻²) | Lower | Higher | Lower | Higher |
| Stomatal Size (μm²) | Larger | Smaller | Larger | Smaller |
| Leaf Vein Density (mm mm⁻²) | Lower | Higher | Lower | Higher |
| Net Photosynthetic Rate (Pn, μmol CO₂ m⁻² s⁻¹) | Lowest | Intermediate | Intermediate | Highest |
| Root Morphology | Less developed | More developed | Less developed | More developed |
Table 2: Influence of Soil Texture on Transpiration Response to VPD in C4 Cereals (Adapted from [18])
| Characteristic | Sandy Loam Soil | Clay Loam Soil |
|---|---|---|
| Soil Hydraulic Conductivity | Higher | Lower |
| Initial slope of TR vs. VPD (slope₁) | Steeper | Shallower |
| VPD at onset of transpiration restriction (VPDᴮᴾ) | Lower | Higher |
| Maximum Canopy Conductance | Higher | Lower |
Table 3: Diurnal Carbon Export from Tomato Source Leaf Under Different Light Qualities (Adapted from [19])
| Light Quality | Percentage of Total Daily Carbon Export Occurring During the Light Period |
|---|---|
| All Tested Wavelengths (White, Red, Blue, Orange, Green) | 65% - 83% |
| Correlation between Photosynthesis and Export (r) | 0.90 - 0.96 |
Signaling and Regulatory Pathways
The regulation of transpiration in response to environmental drivers involves a complex interplay of hydraulic and chemical signaling pathways that coordinate the plant's response to maintain water homeostasis. The diagram below synthesizes these interactions, particularly under high VPD and soil drying conditions.
Diagram Title: Transpiration Regulation Under Environmental Stress
Experimental Protocols
Protocol: Quantifying Transpiration Response to VPD and Light Intensity
This protocol is adapted from studies on tomato and durum wheat to characterize plant water use under simultaneous light and VPD stress [16] [20].
5.1.1. Research Reagent Solutions & Essential Materials
| Item | Function/Application in Protocol |
|---|---|
| Controlled Environment Growth Chambers | Precisely regulate temperature, humidity, light intensity, and photoperiod. |
| Potometer or Precision Balance | To measure water loss (transpiration rate) from the plant or growing container. |
| Portable Gas Exchange System | To simultaneously measure leaf-level transpiration rate (Tr), stomatal conductance (gₛ), and net photosynthetic rate (Pn). |
| Psychrometer or Pressure Chamber | To determine leaf water potential (ψₗₑₐ𝒻). |
| Soil Moisture Sensors | To monitor volumetric water content in the growing medium. |
| Data Loggers | To continuously record environmental variables (air temperature, relative humidity) for VPD calculation. |
| Aquaporin Expression Analysis Kits | (e.g., qPCR reagents for SlPIPs and SlTIPs genes) to investigate molecular regulation of plant hydraulics [16]. |
| Non-Structural Carbohydrate (NSC) Analysis Supplies | (e.g., solvents, enzymes for spectrophotometry) to quantify soluble sugars and starch involved in osmoregulation [16]. |
5.1.2. Step-by-Step Methodology
Plant Material and Growth Conditions:
- Select a model species relevant to closed-system research (e.g., tomato, durum wheat).
- Germinate seeds and grow seedlings under standardized, non-stressful conditions until a target developmental stage is reached (e.g., 4-5 leaf stage for tomatoes).
- Use a well-characterized, uniform growing substrate (e.g., peat-perlite mixture) and maintain consistent irrigation and nutrient supply.
Experimental Treatments and Design:
- Implement a factorial design with at least two levels of VPD (e.g., Low: ~0.95 kPa and High: ~2.22 kPa) and two levels of light intensity (e.g., Low: 300 μmol m⁻² s⁻¹ and High: 600 μmol m⁻² s⁻¹) [16].
- Maintain strict temperature control (e.g., 25/18°C day/night) to isolate the effect of VPD from temperature.
- Ensure adequate replication (a minimum of n=5 plants per treatment combination is recommended).
Duration and Acclimation:
- Expose plants to treatment conditions for a prolonged period (e.g., 12-15 days) to capture both physiological and anatomical adaptations [16].
Data Collection:
- Continuous Transpiration: Weigh pots daily at the same time using a precision balance to calculate daily water use. For higher temporal resolution, use automated weighing scales or potometers.
- Diurnal Gas Exchange: Measure Tr, gₛ, and Pn using a portable gas exchange system at multiple time points throughout the light period.
- Leaf Water Potential: Measure ψₗₑₐ𝒻 pre-dawn (to approximate soil water potential) and at midday (peak stress) using a psychrometer or pressure chamber.
- Plant Hydraulic Conductance: Calculate Kₛₚ using simultaneous measurements of Tr, ψₛₒᵢₗ (from soil samples or pre-dawn ψₗₑₐ𝒻), and midday ψₗₑₐ𝒻 [17].
- Anatomical and Molecular Sampling: At the end of the experiment, harvest plant tissues for analysis of stomatal density/size, leaf vein density, xylem anatomy, aquaporin gene expression (e.g., via qPCR), and NSC content.
Data Analysis:
- Plot transpiration rate against VPD for each treatment to identify the breakpoint (VPDᴮᴾ) where stomatal restriction begins. Models can be linear or segmented [20] [18].
- Perform Analysis of Variance (ANOVA) to test the main effects of VPD, light intensity, and their interaction on all measured physiological and anatomical traits.
- Use correlation analysis to explore relationships between traits (e.g., between Kₛₚ and gₛ, or between NSC content and ψₗₑₐ𝒻).
Protocol: Determining Transpiration Response to Soil Drying
This protocol focuses on the plant's response to diminishing water supply, a critical stressor in closed-loop systems [17].
5.2.1. Step-by-Step Methodology
Soil Preparation and Characterization:
- Use soils of contrasting texture (e.g., sandy loam vs. clay loam) to investigate the role of soil hydraulic properties [18].
- Characterize the soil-water retention curve for each substrate.
Plant Establishment and Water Regime:
- Grow plants in containers filled with the characterized soil.
- Well-watered conditions are maintained until the treatment initiation.
Imposing Soil Drying:
- For the drying treatment, cease irrigation entirely.
- For the control group, maintain soil moisture near field capacity through daily weighing and watering.
Monitoring and Measurements:
- Monitor soil water content daily using soil moisture sensors or by pot weighing.
- Daily transpiration is calculated from the water loss between weighings. The transpiration rate is often normalized to the rate under well-watered conditions (fraction of transpirable soil water, FTSW, is a common x-axis).
- Measure ψₗₑₐ𝒻 daily (pre-dawn and midday) and gₛ at midday.
- The experiment continues until the transpiration rate of the drying treatment falls below a set threshold (e.g., 10% of the well-watered control).
Data Analysis:
- Model the normalized transpiration rate as a function of FTSW or soil water potential. The model is often a two-segment linear regression, identifying the FTSW threshold at which transpiration begins to decline.
- Compare the FTSW threshold and the slope of decline between different soil types or plant genotypes.
The Scientist's Toolkit: Research Reagent Solutions
The following table expands on key reagents and materials essential for conducting advanced transpiration research, particularly for molecular and physiological analyses.
Table 4: Essential Research Reagents and Materials for Transpiration Studies
| Category | Item | Specific Function/Application |
|---|---|---|
| Molecular Biology | qPCR Reagents & Primers for AQP genes (e.g., PIP1, PIP2, TIP1.1), DREB transcription factors, and housekeeping genes. | Quantifies expression levels of key genes regulating water transport and drought stress response [16] [20]. |
| ELISA or HPLC Kits for Phytohormones (e.g., Abscisic Acid - ABA). | Measures ABA concentration in xylem sap or leaf tissue, a primary chemical signal in stomatal closure during water stress [17]. | |
| Physiology & Biochemistry | Supplies for Non-Structural Carbohydrate (NSC) Analysis (e.g., enzymes for sucrose/glucose/fructose assay, reagents for starch digestion and glucose measurement). | Quantifies soluble sugars and starch, which play a role in osmoregulation and maintaining turgor pressure under water stress [16]. |
| Staining Solutions (e.g., nail polish & toluidine blue for stomatal peels; safranin & fast green for vascular tissue). | Enables visualization and quantification of stomatal density/size and leaf vein density under a microscope [16]. | |
| Hydraulics & Environment | Pressure Chamber & Scholander Bomb Supplies (e.g., compressed gas, sealing rings). | Direct measurement of leaf (ψₗₑₐ𝒻) and stem xylem water potential. |
| Soil Hydraulic Property Kits (e.g., pressure plates, tensiometers, HYPROP system). | Characterizes the soil moisture release curve and hydraulic conductivity function for the growing substrate [17] [18]. |
Application in Closed-System Water Recycling
Integrating an understanding of these environmental drivers is critical for designing and managing closed ecological life support systems (CELSS) [21]. The primary goal in such systems is to optimize the plant component for its dual function of food production and water recycling.
Optimizing the Light Environment: Light is the primary energy source but also a major driver of transpiration. While maximizing food production may require high light intensities, conditions that maximize transpiration and water recycling can be different [21]. The use of specific light spectra (e.g., orange and green LEDs) should be explored to fine-tune the balance between carbon fixation (photosynthesis) and water vapor output (transpiration) without compromising plant health [19] [22].
Managing VPD for Water Use Efficiency: In a closed atmosphere, maintaining a moderate VPD is crucial. Excessively high VPD can cause runaway transpiration, leading to rapid water loss and plant water stress, while very low VPD can condense water on surfaces, potentially promoting pathogen growth and reducing the transpiration driving force. Strategies should aim to maintain VPD within an optimal range (e.g., 0.3 to 1.5 kPa for many crops) to ensure efficient water vapor production for condensation and recycling, while conserving plant water status [16].
Soil Moisture and Irrigation Control: The substrate's hydraulic properties must be matched to the plant's hydraulic traits and the system's irrigation capabilities. Understanding the transpiration response to soil drying allows for the design of deficit irrigation strategies that conserve water without unduly penalizing yield, a key consideration for system-level water budgeting [17] [18]. Real-time feedback using soil moisture sensors can be integrated with VPD and light data to automate irrigation, ensuring the plant is used as a highly efficient, responsive biological water pump.
In closed ecological systems, the management of water cycles is fundamentally intertwined with plant-mediated carbon assimilation. The inherent trade-off between carbon gain and water loss represents a central paradigm in plant physiology, as stomata simultaneously regulate both CO₂ uptake for photosynthesis and water vapor loss through transpiration [23] [24]. Understanding the theoretical frameworks governing these trade-offs is essential for optimizing water recycling through plant transpiration in closed systems, where resources are limited and must be carefully managed. Recent research has revealed that plants exhibit remarkable plasticity in hydraulic properties across seasons and environments, adjusting their water use strategies in response to atmospheric conditions, soil moisture availability, and internal hormonal signaling [25] [23]. This application note synthesizes current theoretical frameworks and provides detailed experimental protocols for investigating plant hydraulic efficiency, with particular relevance to researchers developing closed-loop life support systems and sustainable bioregenerative technologies.
Theoretical Frameworks for Water-Carbon Trade-Offs
Carbon Optimization Theory
The carbon optimization theory, pioneered by Cowan and Farquhar, posits that stomata operate to maximize carbon gain while minimizing water loss over the leaf's lifespan [23] [24]. This framework suggests plants exhibit evolutionary adaptations to their native habitats, with species from arid environments typically demonstrating higher integrated metabolic strategy (IMS) values—a ratio between carbon isotope composition (δ13C) and oxygen isotope composition above source water (Δ18O) in leaf cellulose [24]. In closed systems, this optimization becomes critical for maintaining both atmospheric regeneration through CO₂ uptake and water recycling via transpiration.
Hydraulic Limitation Framework
Contrasting with optimization models, the hydraulic limitation framework emphasizes how stomatal regulation prevents excessive water tension that could lead to xylem cavitation and hydraulic failure [23] [25]. This perspective highlights the role of whole-plant hydraulic conductance and vulnerability to embolism, with plants maintaining water potential above thresholds that would cause irreversible conductivity loss. In closed ecological systems like Biosphere 2, maintaining hydraulic integrity is essential for long-term plant survival and continuous system functioning [26].
Integrated Metabolic Strategy (IMS)
The Integrated Metabolic Strategy framework introduces a multivariate approach to quantifying carbon-water tradeoffs through isotopic composition analysis [24]. IMS serves as a measurable indicator of a plant's balance between carbon assimilation and water loss over the leaf lifespan, with larger values indicating higher metabolic efficiency and less pronounced tradeoffs. This framework has proven particularly valuable for comparing water-use strategies across closely related species and environmental gradients.
Table 1: Key Theoretical Frameworks for Understanding Plant Water-Carbon Trade-Offs
| Framework | Core Principle | Key Predictors/Measures | Relevance to Closed Systems |
|---|---|---|---|
| Carbon Optimization Theory | Stomata maximize carbon gain per unit water loss | Stomatal conductance (gs), photosynthetic rate (A), intrinsic water-use efficiency (iWUE) | Optimizes resource use efficiency in limited environments |
| Hydraulic Limitation Framework | Stomatal regulation maintains hydraulic integrity | Xylem water potential at 50% loss of conductivity (Ψ₅₀), hydraulic safety margin, whole-plant hydraulic conductance | Prefers system failure due to hydraulic dysfunction |
| Integrated Metabolic Strategy (IMS) | Multivariate trait integration reflects evolutionary trade-offs | δ13C, Δ18O, and their ratio (IMS) | Provides integrated measure of long-term metabolic efficiency |
Quantitative Dynamics of Plant Hydraulic Properties
Seasonal Plasticity in Hydraulic Parameters
Recent research has demonstrated that plant hydraulic properties exhibit significant temporal variability rather than remaining static. A novel pumping-test analogue method, which uses sap-flow and stem water-potential data, has enabled near-continuous monitoring of whole-plant hydraulic properties [25]. Studies on Allocasuarina verticillata have revealed seasonal plasticity in maximum hydraulic conductance, effective capacitance, and Ψ₅₀ (water potential at which 50% loss of hydraulic conductivity occurs) [25]. This plasticity represents an important adaptive mechanism that must be accounted for in long-term closed system management.
Canopy Position and Leaf Age Effects
The position and age of leaves within a plant canopy significantly influence their hydraulic behavior and contribution to water-carbon trade-offs. Research on tomato plants demonstrates that in well-hydrated conditions, upper canopy leaves exhibit substantially higher stomatal conductance (0.727 ± 0.154 mol m⁻² s⁻¹) and assimilation rates (23.4 ± 3.9 µmol m⁻² s⁻¹) compared to medium-height leaves (gs: 0.159 ± 0.060 mol m⁻² s⁻¹; A: 15.9 ± 3.8 µmol m⁻² s⁻¹) [23]. Under increasing vapor pressure deficit (VPD), these positional effects are initially pronounced, but leaf age effects become dominant under high VPD conditions (2.6 kPa) [23]. In closed systems with controlled vertical environments, these stratification patterns must be considered in system design.
Provenance Variation in Water Use Strategies
Studies on Chinese fir (Cunninghamia lanceolata) provenances demonstrate that genetic factors significantly influence transpiration rates and water use responses to environmental conditions [4]. In common garden experiments, provenances from different regions exhibited significantly different mean daily canopy transpiration rates (Ec), with values ranging from 1.31 ± 0.99 g·d⁻¹ for Guangxi provenances to 1.62 ± 1.43 g·d⁻¹ for Anhui provenances [4]. These provenance-specific responses to soil moisture and atmospheric conditions highlight the importance of genetic selection for optimizing water recycling in closed systems.
Table 2: Quantitative Parameters of Plant Hydraulic Efficiency from Experimental Studies
| Parameter | Species/System | Values/Responses | Experimental Conditions |
|---|---|---|---|
| Stomatal Conductance (gs) | Tomato canopy | Upper: 0.727 ± 0.154 mol m⁻² s⁻¹Medium: 0.159 ± 0.060 mol m⁻² s⁻¹ | Hydrated soil (> -50 kPa), VPD: 1.8 kPa [23] |
| Photosynthetic Rate (A) | Tomato canopy | Upper: 23.4 ± 3.9 µmol m⁻² s⁻¹Medium: 15.9 ± 3.8 µmol m⁻² s⁻¹ | Hydrated soil (> -50 kPa), VPD: 1.8 kPa [23] |
| Canopy Transpiration (Ec) | Chinese fir provenances | Guangxi: 1.31 ± 0.99 g·d⁻¹Anhui: 1.62 ± 1.43 g·d⁻¹Zhejiang: 1.48 ± 1.13 g·d⁻¹ | Common garden, Sept 2020-Sept 2022 [4] |
| Foliar ABA Levels | Tomato under VPD | Upper leaves: 85.36 ± 34 ng g⁻¹ FWMedium leaves: 217.56 ± 85 ng g⁻¹ FW | High VPD (2.6 kPa) conditions [23] |
Experimental Protocols for Assessing Plant Hydraulic Efficiency
Protocol: Whole-Plant Hydraulic Properties Using Pumping-Test Analogue
Purpose: To derive time-variant whole-plant hydraulic properties through non-destructive monitoring [25].
Materials: Sap flow sensors (e.g., thermal dissipation probes), stem psychrometers or pressure chamber for water potential measurements, data logger, meteorological station.
Procedure:
- Install sap flow sensors on multiple representative stems according to manufacturer specifications
- Install stem water potential sensors or take periodic stem water potential measurements using pressure chamber
- Continuous monitoring: Record sap flow and stem water potential at 10-30 minute intervals for at least 7 days to capture diurnal variations
- Data processing: Calculate transpiration flux density (EC) from sap flow measurements normalized by sapwood area
- Parameter estimation: Apply resistance-capacitance (RC) model to derive:
- Maximum hydraulic conductance (Kmax)
- Effective capacitance (C)
- Ψ₅₀ through inverse modeling
- Seasonal tracking: Repeat measurements across multiple seasons to quantify plasticity
Applications in Closed Systems: This method provides critical parameters for modeling water transport in closed ecological systems, enabling prediction of plant water needs and transpiration outputs for life support systems [25] [26].
Protocol: Canopy-Level Gas Exchange and ABA Dynamics
Purpose: To characterize position- and age-dependent variations in stomatal behavior and hormonal regulation [23].
Materials: Portable gas exchange system, leaf porometer, equipment for ABA extraction and quantification (HPLC-ESI-MS/MS), soil water potential sensors.
Procedure:
- Stratified sampling: Select leaves from upper, middle, and lower canopy positions
- Gas exchange measurements: Measure stomatal conductance (gs), photosynthetic rate (A), and transpiration rate (E) under ambient conditions
- ABA quantification: Collect leaf discs from measured leaves, immediately flash-freeze in liquid N₂
- Extract ABA using methanol/water solvent system
- Quantify using HPLC-ESI-MS/MS with multiple reaction monitoring
- Environmental manipulation: Conduct measurements under different VPD conditions (1.8-2.6 kPa) and soil water availability
- Data analysis: Correlate ABA levels with stomatal responses across positions and environmental conditions
Applications in Closed Systems: Understanding ABA dynamics helps predict plant responses to humidity fluctuations in closed environments, informing system management to maintain optimal stomatal regulation [23].
Protocol: Integrated Metabolic Strategy (IMS) Assessment
Purpose: To quantify long-term carbon-water tradeoffs through stable isotope analysis [24].
Materials: Leaf samples, isotope ratio mass spectrometer, elemental analyzer, cryogenic distillation system for water extraction.
Procedure:
- Sample collection: Harvest mature sun-exposed leaves from multiple individuals
- Cellulose extraction: Isolate leaf cellulose using standard extraction procedures
- Isotopic analysis:
- Analyze δ13C in leaf cellulose to integrate intrinsic water-use efficiency
- Extract leaf water and analyze δ18O to reflect transpiration and stomatal conductance
- Analyze δ18O in cellulose to provide time-integrated signal
- IMS calculation: Compute IMS as the ratio between δ13C and Δ18O (isotopic composition above source water)
- Ecological interpretation: Higher IMS values indicate higher metabolic efficiency with less pronounced tradeoffs
Applications in Closed Systems: IMS provides an integrated measure of plant performance under controlled conditions, useful for screening species and genotypes for closed-system applications [24].
Visualization: Water-Carbon Trade-Off Pathways and Experimental Framework
Diagram 1: Theoretical frameworks for plant water-carbon trade-offs showing the pathway from environmental drivers to system outcomes in closed ecological systems.
Diagram 2: Experimental protocol for assessing plant hydraulic efficiency using the pumping-test analogue method, showing sequential steps from sensor installation to seasonal tracking.
The Scientist's Toolkit: Essential Research Reagents and Equipment
Table 3: Essential Research Tools for Investigating Plant Water-Carbon Trade-Offs
| Tool/Reagent | Application | Specific Function | Example Use in Protocols |
|---|---|---|---|
| Sap Flow Sensors (Thermal Dissipation Probes) | Continuous monitoring of plant water use | Measures sap velocity as indicator of transpiration rate | Pumping-test analogue for deriving whole-plant hydraulic properties [25] [4] |
| Portable Gas Exchange System | Leaf-level photosynthetic and transpiration measurements | Simultaneously measures CO₂ uptake and H₂O loss under field conditions | Canopy-level assessment of position-dependent stomatal behavior [23] |
| Pressure Chamber | Plant water status assessment | Measures leaf/stem water potential indicating hydraulic tension | Validation of stem water potential in pumping-test analogue [25] |
| HPLC-ESI-MS/MS System | Phytohormone quantification | Precise measurement of ABA concentrations in plant tissues | Analysis of foliar ABA dynamics in relation to stomatal responses [23] |
| Isotope Ratio Mass Spectrometer | Stable isotope analysis | Determines δ13C and δ18O composition in plant tissues | Integrated Metabolic Strategy assessment [24] |
| Soil Water Potential Sensors (e.g., Terros 21) | Soil moisture status monitoring | Measures soil water potential as driver of plant water availability | Correlation of soil moisture with plant hydraulic responses [23] |
Application to Closed System Water Recycling
The theoretical frameworks and experimental approaches outlined above have direct relevance to managing water recycling through plant transpiration in closed systems. In systems like Biosphere 2, NASA's life support systems, and the Laboratory Biosphere, plant transpiration represents a critical pathway for water purification and redistribution [26]. Understanding species-specific water use efficiencies, hydraulic safety margins, and responses to environmental variables enables selection of optimal plant species for closed systems. The integration of condensate recovery with plant transpiration dynamics creates a sustainable water cycle where plant communities serve as living water purification systems [26].
Research has shown that closed ecological systems can achieve nearly complete water closure when plant transpiration is effectively managed and condensate is recovered [26]. In the Biosphere 2 system, for instance, water was predominantly recycled through evapotranspiration pathways with mechanical assistance to condense and redistribute moisture [26]. The theoretical frameworks described herein provide predictive power for optimizing these systems by selecting plant species with appropriate water-carbon trade-off strategies for specific closed system environments.
The study of water-carbon trade-offs through the theoretical frameworks of carbon optimization, hydraulic limitation, and Integrated Metabolic Strategy provides a robust foundation for understanding and manipulating plant hydraulic efficiency. The experimental protocols outlined enable researchers to quantify key parameters relevant to closed system water recycling, while the visualization frameworks aid in conceptualizing complex interactions. As closed ecological systems advance in sophistication, the integration of these principles will be essential for developing sustainable, self-regulating life support systems that effectively harness plant transpiration as a water recycling mechanism. Future research should focus on interspecific variation in these trade-offs and their plasticity under the unique environmental conditions encountered in closed systems.
Engineering Closed-Loop Systems: From Model Organisms to Real-World Implementation
Selecting appropriate model plant species is a critical first step in research aimed at enhancing closed-loop water recycling systems via plant-based transpiration. In such systems, plants function as living filters and pumps, and their transpiration efficiency (TE)—the biomass produced per unit of water transpired—directly impacts the system's water use efficacy and operational stability [27]. Furthermore, a plant's inherent resilience, or its capacity to maintain function under perturbation, ensures the sustained performance of the entire bioregenerative system [28]. This document provides detailed application notes and protocols for selecting model plant species based on key traits for high TE and resilience, providing a framework for researchers in water recycling and closed-system life support.
Quantitative Traits for Species Selection
The selection of model species should be guided by a suite of quantitative traits. The data in the tables below serve as a benchmark for comparing potential candidate species.
Table 1: Comparative Transpiration Efficiency (TE) and Key Traits in Major C4 Cereals [29]
| Species | Sample Size (Genotypes) | Relative TE | Soil Type Influence on TE | Key Response to Sink Manipulation |
|---|---|---|---|---|
| Maize (Zea mays) | 10 | Highest | Large variation; higher TE in high-clay soil | Drastic decrease in TE under high VPD after cob removal |
| Sorghum (Sorghum bicolor) | 16 | Intermediate | Information Not Specific | Information Not Specific |
| Pearl Millet (Pennisetum glaucum) | 10 | Lower | No significant variation across soil types | No significant effect on TE from panicle removal |
Table 2: Functional Traits Linked to Ecosystem Resilience and Performance [28] [30]
| Trait Category | Specific Trait | Association with High Resilience / TE | Notes on Function |
|---|---|---|---|
| Above-Ground Morphology | Late-season growth | Positively correlated with biomass production after flood disturbance [30] | Avoids seasonal stressors; phenological escape. |
| Short stature | Positively correlated with post-flood growth [30] | May be linked to resource allocation patterns. | |
| Small leaf area | Positively correlated with post-flood growth [30] | Reduces water loss and potential for damage. | |
| Below-Ground Morphology | High root length density (shallow roots) | Positively correlated with post-flood growth and resource acquisition [30] | Enhances access to water and nutrients in upper soil layers. |
| Dense roots | Positively correlated with post-flood growth [30] | Improves soil resource acquisition following resource pulses. |
Experimental Protocols for Phenotyping
Protocol: Whole-Plant Transpiration Response to Vapor Pressure Deficit (VPD)
This protocol assesses a key determinant of TE—the restriction of transpiration under high VPD conditions [29].
1. Plant Material and Growth:
- Genotypes: Select a minimum of 10 homogeneous plants per genotype to account for intraspecific variation [29].
- Containers: Use 10 L containers to allow for sufficient root development.
- Growth Medium: A peat-based compost is suitable. Ensure bulk density is calculated (e.g., ~0.227 g cm⁻³) for accurate soil water content determination [15].
- Conditions: Grow plants in a greenhouse for 5-7 weeks prior to experimentation under well-watered conditions.
2. Experimental Setup:
- Gravimetric System: Employ a multi-lysimeter setup with high-precision balances (1 g accuracy or better) [15].
- Data Collection: Program balances to record pot weight every 60 seconds. Transpiration rate is calculated by differentiating the raw weight data over time.
- Evaporation Control: Cover the soil surface with a plastic sheet to ensure water loss is exclusively through plant transpiration.
- Environmental Monitoring: Record data every 5 minutes for:
- Solar Radiation: Using a sensor (e.g., Skye instruments).
- Temperature and Relative Humidity: Using data loggers (e.g., Trotec) distributed within the growth area. Calculate VPD from these readings.
3. Execution and Measurements:
- Pre-Test: Select the six most homogenous plants per genotype based on leaf area.
- Leaf Area Determination: Perform weekly top-view imaging. Model leaf area over time using a power-law function for non-destructive estimation [15].
- Plant Weight: Estimate daily plant weight from projected leaf area using genotype-specific correlations (R² ≥ 0.94) [15].
- VPD Ladder: Expose plants to a naturally occurring or controlled "ladder" of increasing VPD conditions, typically throughout the day.
- Data Analysis: Plot transpiration rate against VPD. Genotypes exhibiting a restriction in transpiration rate as VPD increases beyond a threshold (e.g., ~2 kPa) are classified as "water-savers" with high TE potential [27].
Protocol: In-situ Transpiration Monitoring via Optical Dendrometry
This non-invasive technique allows for continuous monitoring of transpiration dynamics under field or controlled conditions [31].
1. Plant Material and Sensor Installation:
- Species: This protocol has been validated on herbaceous species like wheat (Triticum aestivum) and daisy (Tanecetum cinerariifolium).
- Sensor Attachment: Install optical dendrometers on the leaf petiole or stem to continuously monitor changes in tissue diameter (a proxy for stem water potential, Ψstem).
2. System Calibration and Validation:
- Calibration: Establish a highly linear correlation (R² > 0.95) between optically measured foliar width and Ψstem measured destructively with a Scholander pressure chamber on a separate set of plants [31].
- Gravimetric Cross-Validation: Simultaneously measure whole-plant transpiration (Ec) gravimetrically for validation.
3. Data Interpretation:
- Constant Hydraulic Conductance: Research indicates that root-to-stem hydraulic conductance (Krs) remains relatively constant throughout the day under well-watered conditions, validating the use of Ψstem as a transpiration proxy [31].
- Negligible Capacitance: In the studied herbaceous species, capacitance effects were found to be negligible, meaning changes in Ec and Ψstem are closely coupled without significant time lags [31].
- Continuous Monitoring: The derived correlation allows for continuous, in-situ estimation of Ec from optical dendrometer readings alone under non-water-stressed conditions.
Trait Relationships and Experimental Workflow
The following diagram illustrates the logical relationship between key plant traits, their functions, and the resulting system-level properties of Transpiration Efficiency and Resilience. This framework guides the experimental selection process.
The Scientist's Toolkit: Essential Research Reagents and Materials
Table 3: Key Reagents and Equipment for Transpiration and Resilience Research
| Item | Function / Application | Example / Specification |
|---|---|---|
| High-Precision Balances | Core of gravimetric transpiration measurement. Records weight loss (water loss) at fine intervals. | Phenospex multi-lysimeter setup (1 g accuracy) [15]; Kern balances (0.01 g accuracy) [15]. |
| Handheld Photosynthesis System | Simultaneous, real-time measurement of transpiration rate, stomatal conductance, and photosynthetic CO₂ assimilation at the leaf level. | CI-340 Handheld Photosynthesis System (CID Bio-Science Inc.) [27] [1]. |
| Optical Dendrometers | Non-invasive, continuous monitoring of stem/leaf water potential (Ψstem) as a proxy for whole-plant transpiration dynamics. | Validated for herbaceous crops like wheat and daisy [31]. |
| Environmental Sensors | Critical for calculating VPD, the primary driver of transpiration. | Sensors for PAR light, air temperature, and relative humidity (e.g., Skye instruments, Trotec data loggers) [15]. |
| Plant Canopy Imager | For non-destructive estimation of Leaf Area Index (LAI), a key parameter for normalizing whole-plant water use. | CI-110 Plant Canopy Imager (CID Bio-Science Inc.) [1]. |
| Scholander Pressure Chamber | The gold-standard method for measuring leaf or stem water potential. Used for calibrating optical dendrometers [31]. | Standard bench-top or portable model. |
| Growth Containers | Must be of sufficient volume to avoid root restriction and allow normal plant-water relations. | 2L to 10L pots, depending on species and growth duration [15] [31]. |
Within the context of closed-system water recycling research, the integration of specially designed plant beds with water reservoirs presents a promising bio-technological solution for water regeneration. This approach leverages the natural process of plant transpiration to produce high-quality water, a concept validated by early NASA studies for life support systems, which found plant transpiration water could meet hygiene water standards [32]. The core of this design is a Hydrological Loop, a recirculating system where water is physically and biogeochemically processed through its interactions with vegetation, thereby linking the biological process of transpiration with the physical storage and regulation functions of a reservoir. This protocol details the application of this integrated system, providing the methodologies necessary for researchers to construct, monitor, and optimize such a loop for water recycling applications.
The design and monitoring of the hydrological loop require tracking specific biological, hydrological, and water quality parameters. The following tables summarize the key quantitative benchmarks and formulas essential for system assessment.
Table 1: Plant Transpiration Water Quality & System Performance Metrics
| Parameter | Target Value / Typical Range | Significance / Source |
|---|---|---|
| Total Organic Carbon (TOC) in Transpirate | 0.3 - 6.0 ppm | Meets hygiene water standards; indicates purity of plant-derived water [32]. |
| Submerged Aquatic Vegetation (SAV) Coverage | Variable (e.g., >50% for high nutrient processing) | Key biotic driver; higher coverage enhances nutrient removal and system stability [33]. |
| Nitrate-Nitrogen (NO₃-N) Reduction | Significant decrease in outflow vs. inflow | Indicator of active nutrient processing by plant beds and associated microbiota [33]. |
| Contrast Ratio for Diagram Visuals | ≥ 4.5:1 (normal text), ≥ 3:1 (large graphics) | Ensures accessibility and readability of all system schematics and data visualizations [34]. |
Table 2: Key Hydrological Balance Formulas for Loop Management
| Formula Name | Equation | Variables and Application |
|---|---|---|
| Water Balance | P – Q – G – ΔS – E = 0 |
Calculates the hydrological equilibrium of the system. P=Precipitation, Q=Stream Discharge, G=Groundwater Discharge, ΔS=Change in Storage, E=Evapotranspiration [35]. |
| Circularity Ratio | (4 × π × A) / P² |
Assesses drainage basin shape. A=Basin Area, P=Basin Perimeter. A higher ratio (closer to 1) indicates a more circular shape [35]. |
| Elongation Ratio | (1 / L) × √( (4 / π) × A ) |
Assesses drainage basin elongation. A=Basin Area, L=Maximum Basin Length. A lower ratio indicates a more elongated shape [35]. |
Experimental Protocols
Protocol for Assessing Transpiration Water Quality
This protocol is designed to quantify the quality of water produced via plant transpiration for closed-loop recycling.
1. Objective: To collect and analyze the chemical composition of water transpired by plants in a controlled hydroponic environment.
2. Research Reagent Solutions & Essential Materials:
- Nutrient Solution: A standard Hoagland's or similar hydroponic solution to support plant growth.
- Sterilized Growth Chambers: Enclosures (e.g., aeroponic or deep-water culture systems) to house plants and isolate transpirate.
- Condensation Collection System: A sterile, cooled surface or condensing coil connected to a collection vessel.
- Total Organic Carbon (TOC) Analyzer: Instrument for measuring organic contaminant levels in water samples.
- Ion Chromatography (IC) System: For analyzing ionic contaminants (e.g., nitrate, phosphate).
- Plant Species: Selection of robust, high-transpiration-rate species (e.g., Hydrilla verticillata for aquatic systems, Wolffia for floating systems, or higher plants like Triticum aestivum).
3. Methodology: 1. System Setup: Establish a hydroponic plant bed within a sealed growth chamber. The root zone should be exposed to the nutrient solution, while the shoot zone is isolated. 2. Transpirate Collection: Maintain a temperature and humidity gradient within the chamber to promote condensation of plant transpiration on a sterilized, cooled surface. Direct the condensed water into a sterile collection vessel. Ensure the collection system is impervious to external contamination. 3. Water Quality Analysis: - TOC Analysis: Filter the collected transpirate and analyze it using the TOC analyzer according to manufacturer protocols. Compare results against target thresholds (e.g., 0.3-6.0 ppm) [32]. - Nutrient Analysis: Use IC to measure concentrations of key nutrients like NO₃-N and PO₄-P to assess the plant bed's nutrient stripping efficiency. 4. Data Interpretation: Consistent low TOC and nutrient ion levels in the transpirate, compared to the root zone solution, confirm the effectiveness of the plant bed as a biological water purification component.
Protocol for Monitoring Hydrological Drivers and Vegetation Dynamics
This protocol outlines the procedure for evaluating how water flow regimes impact plant bed health and function.
1. Objective: To quantify the relationship between hydrological inflow and the spatial coverage and nutrient processing capacity of submerged aquatic vegetation (SAV).
2. Research Reagent Solutions & Essential Materials:
- Flow Meters: Installed at all system inlets and the reservoir outlet to continuously monitor discharge (
Q). - Water Level Sensors: To track changes in reservoir storage (
ΔS). - Water Sampling Equipment: Automatic samplers or manual kits for collecting integrated water samples from inflows and outflows.
- GIS Software & Aerial Imagery/Sonar: For mapping and calculating the spatial coverage of SAV.
- Nutrient Analysis Kits: Spectrophotometers or test kits for analyzing NO₃-N and other nutrients.
3. Methodology:
1. Hydrological Monitoring: Install and calibrate flow meters and water level sensors. Record data for P (if applicable), Q (inflow and outflow), and ΔS (change in reservoir storage) at a daily or weekly frequency to solve the water balance equation [35].
2. Vegetation Surveying: Conduct periodic (e.g., annual or seasonal) surveys of the plant bed. For submerged beds, use sonar or underwater videography. For floating beds, use aerial drones. Process the imagery in GIS software to calculate the percentage of the reservoir area covered by SAV [33].
3. Nutrient Flux Calculation: Collect water samples simultaneously from the main inflow(s) and the reservoir outflow. Analyze for NO₃-N concentration. Calculate the mass balance of nutrients to determine the reservoir's net nutrient retention or release.
4. Statistical Analysis: Correlate annual or seasonal inflow data with SAV coverage and nutrient retention efficiency. As demonstrated in prior research, lower inflows often allow for greater SAV coverage, which in turn leads to more significant nutrient reduction in the outflow [33].
System Visualization
Logical Workflow of the Integrated Hydrological Loop
The following diagram illustrates the core components and continuous flow of water and nutrients within the system.
Title: Hydrological Loop Logic
Experimental Workflow for System Validation
This diagram outlines the sequential protocol for validating the water processing efficiency of the plant bed component.
Title: Transpirate Quality Assay
The Scientist's Toolkit: Research Reagent Solutions
This section catalogs the critical materials and reagents required for establishing and maintaining the integrated hydrological loop.
Table 3: Essential Research Reagents and Materials
| Item | Function / Explanation |
|---|---|
| Hydroponic Nutrient Solution | A balanced, soluble fertilizer mix (e.g., Hoagland's solution) essential for providing macro and micronutrients to sustain plant health in the water-recycling plant beds. |
| Water Quality Analysis Kits | Kits for measuring Total Organic Carbon (TOC), Nitrate-Nitrogen (NO₃-N), Phosphate (PO₄-P), and other relevant parameters. Critical for monitoring the input water and the quality of the purified transpirate [32] [33]. |
| Flow Meters & Data Loggers | Instruments installed at system inlets and outlets to continuously monitor hydrological discharge (Q), a primary driver of plant bed coverage and function [35] [33]. |
| GIS & Spatial Analysis Software | Software tools used to process aerial or sonar imagery for quantifying the spatial coverage of Submerged Aquatic Vegetation (SAV), a key metric for system performance [33]. |
| Selected Plant Species | Robust, non-clogging, high-transpiration-rate species. Hydrilla verticillata has been studied for nutrient uptake [33], while other species like lettuce or dwarf wheat may be used in controlled environments [32]. |
Plant transpiration is a critical process in developing closed-loop water recycling systems for advanced research and pharmaceutical applications. Monitoring this process in real-time provides the data essential for modeling and optimizing water use efficiency. Traditional methods for measuring plant water status, such as manual measurements of relative water content or water potential, are low-throughput and destructive, making them unsuitable for continuous, system-level monitoring [36]. The integration of high-resolution, wearable sensor technology represents a paradigm shift, enabling non-invasive, continuous tracking of physiological parameters related to transpiration and growth directly on plants [37]. This document outlines application notes and protocols for deploying these advanced sensors within the specific context of closed-system water recycling research.
Sensor Technologies for Real-Time Physiological Monitoring
High-Throughput Wearable Plant Sensors (PlantRing System)
The PlantRing system is an innovative, nano-flexible sensing system designed for high-throughput agricultural and research applications [37]. Its core functionality is based on a strain sensor made from bio-sourced carbonized silk georgette (CSG), which translates mechanical deformations from plant organ expansion and contraction into quantifiable changes in electrical resistance.
- Principle of Operation: The sensor measures diurnal stem diameter variation (SDV), a well-established proxy for plant water status. Stem diameter decreases during periods of high transpiration (water loss) and increases during water uptake and growth [37]. By monitoring these micro-variations, the system provides a sensitive, real-time indicator of hydraulic dynamics.
- Key Performance Specifications:
- Exceptional Sensitivity: Detection limit as low as 0.03% strain.
- High Stretchability: Can withstand tensile strain up to 100%.
- Remarkable Durability: Proven for season-long use under harsh environmental conditions.
- High-Throughput Capability: A single gateway can support up to 300 simultaneously connected sensor units [37].
- Data Acquisition and Transmission: Each sensor unit includes a data logger with a microprocessor and an analog-to-digital converter (ADC). Data is transmitted wirelessly to a gateway via 2.4 GHz radio-frequency and subsequently to a cloud server using 4G/5G networks, allowing for remote, real-time data access and management [37].
Established Methods for Plant Water Status Measurement
While advanced sensors provide continuous data, it is often necessary to validate their readings against established, direct measurement techniques. The following table summarizes these key methods.
Table 1: Established Techniques for Measuring Plant Water Status
| Technique | Measured Parameter | Principle | Primary Application |
|---|---|---|---|
| Pressure Equilibration (Pressure Bomb) [36] | Leaf Water Potential | Applies gas pressure to a sealed leaf until xylem sap is forced back to the cut surface; the balancing pressure equals the leaf's water potential. | Field-based measurement of plant water stress. |
| Thermocouple Psychrometry [36] | Water Potential | Measures the equilibrium relative humidity within a chamber containing a plant sample to determine its water activity. | Highly accurate lab and field measurements; considered a benchmark. |
| Relative Water Content (RWC) [36] | Tissue Water Content | Calculates current water content as a percentage of the fully turgid water content: RWC = [(Fresh Weight - Dry Weight) / (Turgid Weight - Dry Weight)] * 100. |
Standardized lab measurement of hydration status. |
Experimental Protocols for Sensor Deployment and Data Validation
Protocol A: Deployment and Calibration of Wearable Strain Sensors
Objective: To correctly install and calibrate PlantRing (or equivalent) sensors for continuous monitoring of stem diameter variation.
Materials:
- PlantRing sensor unit(s) (selected model based on organ size: 6 cm for stems, 12 cm or 30 cm for fruits).
- Support structures (e.g., stakes, trellises).
- Automated cable ties.
- Calibration jig (or ruler) for known displacement.
- Computer/smartphone with access to cloud data platform.
Procedure:
- Pre-deployment Calibration:
- Consistently stretch the sensor using a calibration jig to create a known strain-to-AD (Analog-to-Digital) signal response curve.
- Fit this calibration data to a linear function for subsequent conversion of sensor readings to physical units [37].
- Sensor Attachment:
- For stem monitoring, select a representative, uniform section of the stem.
- Use the sensor's integrated U-shaped handles and flexible clip to wrap it around the plant organ.
- Secure the sensor loosely using automated cable ties to the plant organ and a nearby support structure to minimize strain on the plant and sensor from wind or plant growth [37].
- Ensure the sensor is snug but does not compress the stem.
- System Activation and Data Verification:
- Power on the sensor unit and data logger.
- Verify successful connection to the gateway and cloud server via the companion software.
- Confirm that initial data streams are within expected ranges based on the calibration.
Protocol B: Validating Sensor Data with Direct Water Potential Measurements
Objective: To correlate continuous SDV data from sensors with direct, point-in-time measurements of plant water potential.
Materials:
- Pressure chamber instrument.
- Sharp razor blade or pruning shears.
- Plastic bags and humidified containers for sample transport.
- Plant(s) instrumented with wearable sensors.
Procedure:
- Synchronized Sampling:
- While the sensor is continuously logging data, select a time point for direct measurement (e.g., predawn for baseline water potential, midday for minimum water potential).
- Sample Collection:
- Rapidly excise a single leaf or short leafy shoot from the plant, near the sensor location.
- Immediately place the excised sample in a plastic bag to prevent evaporative water loss.
- Seal the bag and transport it to the pressure chamber (for in-field chambers, proceed directly to measurement) [36].
- Pressure Chamber Measurement:
- Seal the sample in the chamber with the cut end protruding.
- Increase the gas pressure in the chamber slowly and steadily.
- Record the pressure (in MPa) the moment xylem sap appears at the cut surface. This is the leaf water potential [36].
- Data Correlation:
- Note the exact timestamp of the pressure chamber measurement.
- Extract the sensor-derived SDV value at that precise timestamp.
- Repeat this process across multiple plants, days, and stress conditions to build a robust model between SDV and water potential.
The following workflow diagram illustrates the integrated process of deploying sensors and validating their output:
The Scientist's Toolkit: Essential Research Reagents and Materials
For researchers establishing a platform for real-time transpiration monitoring, the following tools and materials are critical.
Table 2: Essential Research Reagents and Materials for Transpiration Monitoring
| Item | Function/Description | Key Characteristics |
|---|---|---|
| Wearable Strain Sensor (e.g., PlantRing) [37] | Monitors plant growth and water status via organ circumference dynamics. | Carbonized silk georgette sensing material; high stretchability (up to 100% strain); low detection limit (0.03%); durable, season-long use. |
| Pressure Chamber [36] | Provides direct, benchmark measurements of leaf water potential for sensor validation. | Portable for field use; measures balancing pressure required to force xylem sap from a cut leaf petiole. |
| Thermocouple Psychrometer [36] | Offers a highly accurate method for measuring water potential, often used in lab settings. | Measures vapor pressure in a sealed chamber containing a plant sample; requires precise temperature management. |
| Data Logger & Gateway [37] | Acquires, processes, and transmits sensor data from multiple units to a cloud server. | Wireless (2.4 GHz/4G/5G); supports high-throughput connectivity; enables remote data access. |
| Cloud Data Platform [37] | Stores, manages, and visualizes real-time and historical sensor data. | Accessible via computer and smartphone; provides tools for remote control and data analysis. |
Data Presentation and Analysis in Closed-System Research
Structuring Data for Analysis
Effective data analysis begins with properly structured data. For sensor-derived and validation data, a "tidy" data format is recommended, where each row represents a single observation at a specific time, and each column represents a variable [38].
- Granularity: Each row should be a timestamped record from a single sensor or measurement. A unique identifier (UID) for each sensor unit is a best practice [38].
- Fields/Columns: Essential fields include Timestamp, SensorUID, PlantID, StrainReading, ConvertedStemDiameter, Temperature (for compensation), and ValidationWater_Potential (where applicable) [37] [38].
- Data Types: Ensure correct data types are assigned (e.g., continuous for stem diameter and water potential, discrete for Plant_ID) to facilitate correct aggregation and visualization [38].
Quantitative Data from Sensor Applications
The application of advanced sensors has yielded key quantitative insights into plant physiology, relevant for modeling water fluxes in closed systems.
Table 3: Key Quantitative Findings from Advanced Sensor Deployment
| Application / Finding | Quantitative Result | Research Implication |
|---|---|---|
| Sensor Performance: Detection Limit [37] | 0.03% – 0.17% strain (depending on model). | Capable of detecting minute, physiologically relevant changes in plant organ size. |
| Sensor Performance: Stretchability [37] | Up to 100% tensile strain. | Allows for monitoring of substantial growth and swelling over time without sensor failure. |
| Irrigation Management: Water Conservation [37] | Simultaneous water savings and improvement of tomato fruit quality. | Demonstrates potential for feedback-controlled irrigation to optimize resource use and output. |
| Transpiration Scaling: Maximum Stand Level [39] | ~1.5 x 10⁶ to 7.5 x 10⁶ liters per hectare per year. | Provides an upper-bound estimate for scaling transpirational water loss in dense plantings. |
The deployment of wearable sensors for real-time transpiration tracking moves plant water status monitoring from periodic, destructive sampling to a continuous, automated, and high-throughput paradigm. The protocols outlined here—for sensor deployment, calibration, and validation against direct measurements—provide a robust framework for researchers. The data generated is critical for parameterizing and validating physiologically based computer models of transpiration. In the context of a closed-system water recycling thesis, this integrated approach enables precise quantification of water uptake, transpiration, and the overall water cycle, forming a solid foundation for intelligent system control and optimization aimed at sustainable water reuse.
Plant transpiration, the process by which water moves from soil through plant roots, xylem, and stomata into the atmosphere, serves as a critical component in nature's hydrological cycle [1]. In closed-system water recycling, this physiological process presents a promising mechanism for contaminant mitigation, particularly in controlled environments such as greenhouses and advanced agricultural facilities. Research indicates that global plant transpiration has increased by approximately 6% between 1990 and 2020, representing an increase of 397.2 ± 63.1 mm, driven largely by global greening trends and higher Leaf Area Index (LAI) [1]. This enhanced transpiration activity, accounting for 60% of soil moisture loss in terrestrial evapotranspiration, provides an expanded platform for developing water treatment technologies that harness plant-based processes for contaminant removal [1].
The transpiration stream functions as a natural filtration system, with plants acting as living pumps that can selectively uptake, transform, and sequester various contaminants while returning purified water vapor to the atmosphere. In enclosed agricultural systems, where humidity levels frequently reach 90% [40], this process creates opportunities for innovative water recycling approaches that integrate modern material science with plant physiology. The framework for understanding plant water use has recently been unified through pioneering work that reconciles decades of differing modeling approaches, providing researchers with improved tools for predicting plant behavior under various stress conditions [5]. This theoretical advancement enables more precise application of transpiration-based mitigation strategies across different environmental conditions.
Quantitative Data on Transpiration and Contaminant Mitigation
Global Transpiration Trends and Drivers
Table 1: Documented Changes in Global Plant Transpiration (1980-2020)
| Time Period | Transpiration Increase | Primary Contributing Factors | Regional Variations |
|---|---|---|---|
| 1980-2021 | 0.61–0.79 mm yr⁻² [1] | Greener landscapes (66.2% attribution to LAI) [1] | Increase across Africa, India, China, Europe, North America; Decreases in water-limited regions [1] |
| 1982-2011 | Evapotranspiration increase of 0.66 ± 0.38 mm year⁻² [1] | Climate change (19% attribution), CO₂ fertilization [1] | Widespread across humid and semi-humid regions [1] |
| 1990-2020 | 0.79 ± 0.28 mm/year (total ~6% increase) [1] | Higher Leaf Area Index, increased atmospheric CO₂ [1] | Observed over 70% of global terrestrial surface [1] |
Table 2: Factors Influencing Transpiration Rates and Contaminant Processing Potential
| Factor | Impact on Transpiration | Implications for Contaminant Mitigation |
|---|---|---|
| Leaf Area Index (LAI) | 40-66.2% explanation for transpiration increase [1] | Greater leaf surface area enhances potential for contaminant processing |
| Atmospheric CO₂ | 38% increase in stomatal closure at higher concentrations [1] | Alters uptake rates of water-soluble contaminants |
| Temperature Increases | Extended growing seasons, especially in temperate regions [1] | Longer annual operation period for transpiration-based systems |
| Land Use Changes | 3% decrease in transpiration due to forest conversion [1] | Highlights importance of maintaining vegetation in treatment systems |
Experimental Protocols for Transpiration-Based Contaminant Mitigation
Protocol 1: Closed-System Transpiration Capture and Condensate Analysis
Objective: To quantify the efficiency of contaminant removal through plant transpiration processes in a controlled closed system.
Materials:
- Plant Materials: Mature specimens with high transpiration rates (e.g., willow, poplar, or sunflower species)
- Growth Chambers: Environmentally controlled enclosures with temperature, humidity, and light regulation
- Contaminant Solution: Prepared with specific contaminants of interest (pharmaceuticals, heavy metals, or industrial chemicals)
- Condensation Collection System: Sterile condensation surfaces with temperature control
- Analytical Instruments: LC-MS/MS, ICP-MS, or GC-MS for contaminant detection
Methodology:
- Establish baseline transpiration rates by growing plants in contaminant-free conditions while monitoring water uptake and vapor release.
- Introduce contaminant solutions at known concentrations to the root zone, maintaining precise environmental conditions (25°C, 60-80% RH, suitable PAR).
- Collect condensed transpiration vapor from chamber surfaces using sterile collection apparatus at 4-hour intervals.
- Analyze condensate samples for target contaminants using appropriate analytical methods.
- Compare contaminant profiles and concentrations between root zone solutions and condensed vapor to determine removal efficiency.
- Monitor plant health indicators (chlorophyll content, growth rates, visual symptoms) throughout exposure period.
Quality Control:
- Include triplicate systems for each experimental condition
- Maintain sterile control chambers without plants to account for abiotic evaporation
- Regular calibration of all monitoring equipment
- Spike recovery tests for analytical methods
Protocol 2: Hybrid Biological-Physical System for Water Recovery
Objective: To evaluate the synergistic effects of combining plant transpiration with sorption-based atmosphere water harvesting (SAWH) for enhanced water recovery and contaminant removal.
Materials:
- Hygroscopic Porous Polymers (HPPs): Super Moisture-Absorbent Gels (SMAG), Polymer-MOF (PC-MOF), or CaCl₂-impregnated alginate [40]
- Modified Greenhouse Structure: With integrated SAWH panels on roof surfaces
- Monitoring Equipment: Humidity sensors, temperature loggers, flow meters
- Water Quality Testing Kits: For rapid assessment of key contaminants
Methodology:
- Configure greenhouse system with separate zones for plant-based transpiration and SAWH technology.
- Establish crops with known high transpiration rates in growth beds under controlled irrigation with contaminated water.
- Operate SAWH system in coordinated cycle with natural transpiration patterns:
- Nocturnal phase: Open system for moisture adsorption from humid greenhouse air
- Daytime phase: Closed desorption using solar energy to release captured moisture
- Collect water from both direct transpiration condensation and SAWH output separately.
- Analyze contaminant levels in both water streams compared to input irrigation water.
- Monitor system parameters including water production rate, energy consumption, and humidity regulation.
Performance Metrics:
- Water harvesting coefficient (target: ≥0.70) [40]
- Specific energy consumption per unit mass of water production
- Contaminant removal efficiency for target compounds
- Humidity reduction achieved within the greenhouse environment
Visualization of Transpiration-Based Contaminant Mitigation Systems
Workflow Diagram: Hybrid Transpiration-Sorption Water Recycling System
Diagram 1: Integrated workflow combining plant transpiration with sorption-based atmospheric water harvesting for contaminant mitigation in closed-loop systems. HPP: Hygroscopic Porous Polymers.
Pathway Diagram: Contaminant Fate in Plant Transpiration Systems
Diagram 2: Contaminant pathways within plant systems, highlighting transformation processes that enable transpiration-based mitigation.
The Scientist's Toolkit: Research Reagent Solutions
Table 3: Essential Materials for Transpiration-Based Contaminant Mitigation Research
| Category | Specific Materials/Reagents | Research Function | Application Notes |
|---|---|---|---|
| Plant Materials | High-transpiration species (Populus, Salix, Helianthus) | Primary biological components for transpiration systems | Select species based on transpiration rate, contaminant tolerance, and growth characteristics [1] |
| Hygroscopic Porous Polymers | Super Moisture-Absorbent Gels (SMAG), Polymer-MOF, CaCl₂-impregnated alginate | Atmospheric moisture capture in hybrid systems | SMAG adsorbs 6.7 g g⁻¹ at 90% RH; consider stability and regeneration capacity [40] |
| Monitoring Equipment | CI-340 Handheld Photosynthesis System, CI-110 Plant Canopy Imager | Real-time measurement of transpiration, stomatal conductance, LAI | Enables precise correlation between plant physiology and contaminant mitigation efficiency [1] |
| Water Quality Assessment | LC-MS/MS, ICP-MS, GC-MS systems | Contaminant quantification in input, output, and plant tissues | Essential for mass balance calculations and process efficiency determination |
| Growth System Components | Controlled environment chambers, hydroponic systems, humidity regulators | Maintain optimized conditions for transpiration processes | Critical for standardized experimentation and system reproducibility |
Advanced Implementation Frameworks
Technology Integration for Enhanced Performance
The integration of plant-based transpiration systems with advanced materials represents the cutting edge of biological-physical hybrid systems for water remediation. Sorption-based atmospheric water harvesting (SAWH) technologies demonstrate particular promise when coupled with plant transpiration in closed systems. These materials, including advanced hygroscopic porous polymers (HPPs), can capture moisture from the humid greenhouse environment that results from plant transpiration [40]. With adsorption capacities reaching 2.5-6.7 g g⁻¹ under 90% relative humidity conditions, these materials provide a complementary moisture capture pathway that enhances overall water recovery while reducing humidity-related plant stress [40].
Implementation frameworks must account for the coordinated cycling of adsorption and desorption phases. Passive SAWH systems can be strategically positioned on greenhouse roofs, where they adsorb moisture during night hours and release it through solar-driven desorption during daylight hours [40]. This coordinated operation aligns with natural transpiration rhythms while maximizing water recovery. In one documented system using Cu-complex materials as adsorbents, water production rates reached 2.24 g g⁻¹ h⁻¹ under natural sunlight [40]. Such performance metrics demonstrate the viability of integrated approaches for contaminant mitigation and water recovery.
System Optimization Considerations
Successful implementation of transpiration-based contaminant mitigation requires careful attention to several operational parameters. The Leaf Area Index (LAI) emerges as a critical factor, accounting for 40-66.2% of observed transpiration variation [1]. Maintaining optimal LAI through strategic plant selection and cultivation practices directly enhances system capacity for water processing and contaminant mitigation.
Environmental parameters must be precisely controlled to maintain efficient transpiration while minimizing plant stress. Research indicates that plants respond differently to various drought conditions, with empirical models often overestimating transpiration during periods of atmospheric drought (dry air) despite adequate soil moisture [5]. Advanced modeling approaches that unify empirical and mechanistic frameworks provide superior prediction of plant water use under stress conditions, enabling more reliable system design [5].
Contaminant-specific considerations include concentration thresholds, transformation pathways, and potential phytotoxic effects. System design must incorporate appropriate pretreatment when necessary and careful monitoring of contaminant fate, including potential volatilization, transformation products, and biomass sequestration. The selection of plant species should reflect not only transpiration capacity but also tolerance to target contaminants and efficiency in their transformation or sequestration.
Application Notes: Harnessing Plant Transpiration for Remediation
Transpiration, the process of water movement through a plant and its evaporation from aerial parts, primarily through stomata, presents a powerful, solar-powered mechanism for environmental remediation. In closed-system water recycling research, this natural process can be leveraged to extract, concentrate, and volatilize contaminants from soil and water, facilitating their breakdown or recovery. The efficiency of this system is governed by the plant's inherent transpiration rate, which is influenced by environmental factors such as light, humidity, and air movement [41] [42].
A key application is the phytoremediation of agricultural and industrial wastewater. Plants cultivated in contaminated water or soil uptake the water along with dissolved pollutants through their root systems. The water is then transpired as relatively pure water vapor back into the atmosphere, while the contaminants are metabolized, sequestered in plant tissues, or concentrated in the remaining liquid for further treatment [29]. Research on major C4 cereals like maize, sorghum, and pearl millet has shown that transpiration efficiency (TE)—shoot biomass produced per unit water transpired—varies significantly between species and is affected by soil type and source–sink balance within the plant [29]. This underscores the importance of selecting appropriate plant species for remediation projects based on their TE and environmental adaptability.
Quantitative Data on Transpiration and Plant Efficiency
The following tables summarize key quantitative data relevant to designing and analyzing transpiration-driven remediation systems.
Table 1: Comparative Transpiration Efficiency (TE) of C4 Cereals
| Species | Number of Genotypes Tested | Relative TE | Key Influencing Factors | Notes |
|---|---|---|---|---|
| Maize (Zea mays) | 10 | Highest | Soil type, source–sink balance | TE showed large variations across soil types; cob removal drastically decreased TE [29]. |
| Sorghum (Sorghum bicolor) | 16 | Intermediate | Vapor Pressure Deficit (VPD) | Considered a hardy crop, adapted to water-limited conditions [29]. |
| Pearl Millet (Pennisetum glaucum) | 10 | Lower | Vapor Pressure Deficit (VPD) | Showed no variation in TE across different soil types [29]. |
Table 2: Environmental Impact on Transpiration Rate
| Environmental Factor | Effect on Transpiration Rate | Implication for Remediation Systems |
|---|---|---|
| Continuous Light | Increases | Accelerates water extraction and contaminant processing [41]. |
| Air Movement (Fan) | Increases | Enhances the vapor pressure gradient, pulling more water through the plant [41]. |
| High Humidity | Decreases | Reduces the driving force for water vapor escape, slowing the remediation process [41]. |
| High Vapor Pressure Deficit (VPD) | Varies | Genotypes that restrict transpiration under high VPD can maintain higher TE [29]. |
| Soil Type | Impacts TE | High-clay soils generally resulted in higher TE than sandy soils under high VPD, but the effect was species-dependent [29]. |
Experimental Protocols
Protocol 1: Gravimetric Analysis of Transpiration Rate in Remediation Context
This protocol provides a methodology for measuring the transpiration rate of plants in a controlled remediation setup, which is fundamental for estimating system efficiency [41].
I. Materials and Setup
- Plant Preparation: Select healthy, well-watered plants with developed root systems. Bedding plants like begonias with thick, fleshy leaves are suitable [41].
- System Assembly:
- Plant the specimen in a container (e.g., a 250 mL beaker) with the contaminated medium or water.
- Water the plant thoroughly to ensure soil saturation.
- To isolate water loss through transpiration from soil evaporation, seal the soil surface by wrapping the container tightly with a plastic bag around the plant's stem. Use tape for a secure, vapor-tight seal. Only the leaves should be exposed [41].
- Initial Mass: Measure and record the initial mass of the entire assembled unit (beaker, soil, plastic, and plant).
II. Experimental Procedure
- Apply Treatment: Expose the plant to the chosen environmental variable (e.g., continuous light, fan, high-humidity bag) [41].
- Control Setup: Maintain a control plant under normal, untreated conditions for baseline comparison [41].
- Incubation: Let the plants sit for a predetermined period (e.g., 24 hours).
- Final Mass: After the incubation period, mass the entire unit again.
III. Data Analysis
- Water Loss Calculation: The mass difference between the initial and final measurements represents the water lost through transpiration.
- Rate Calculation: Calculate the transpiration rate as mass of water lost per unit time (e.g., grams per hour).
- Comparative Analysis: Compare the transpiration rates of treated plants against the control to determine the effect of the environmental variable.
Protocol 2: In-situ Visualization of Leaf Transpiration
This simple protocol visually demonstrates the occurrence of transpiration, useful for system validation and educational purposes [42].
- Leaf Selection: Identify a large, healthy leaf on a well-watered plant.
- Bagging: Gently place a clear plastic bag over the leaf and securely fasten the opening around the stem with a twist tie or string, ensuring a snug but non-damaging fit [42].
- Observation: Place the plant in its intended environment (e.g., sunlight). Over a few hours, water droplets will form on the inside of the bag as transpired water vapor condenses [42].
- Data Recording: Record the time until the first droplet appears and the relative abundance of droplets over time.
System Workflow and Pathway Visualizations
Diagram: Transpiration-Driven Remediation Workflow
The following diagram outlines the logical workflow for implementing a transpiration-driven remediation system, from initial setup to final analysis.
Title: Phytoremediation System Workflow
Diagram: Water and Solute Pathway in Plant
This diagram illustrates the physiological pathway of water and contaminants from the soil through the plant and into the atmosphere.
Title: Plant Vascular Transport Pathway
The Scientist's Toolkit: Essential Research Reagents and Materials
Table 3: Key Research Reagent Solutions and Materials
| Item | Function in Transpiration Research |
|---|---|
| Potometer | Traditional instrument used to measure the rate of water uptake by a plant, which is directly related to transpiration. Can be difficult to seal effectively [41]. |
| Healthy Test Plants (e.g., Begonia, Bedding Plants) | Plants with robust, fleshy leaves are ideal for gravimetric experiments due to their significant transpiration rates and physical durability [41]. |
| Plastic Sealing Bags | Used to create a vapor-tight seal around the plant pot to prevent soil water evaporation, isolating water loss to transpiration. Also used in simple condensation experiments [41] [42]. |
| High-Precision Balance | Essential for the gravimetric method, allowing for the accurate measurement of small mass changes corresponding to water loss over time [41]. |
| Environmental Chambers | Enable precise control of environmental variables such as light intensity, temperature, humidity, and air flow, which are critical for studying their impact on transpiration rates [41] [29]. |
| Data Logger with Sensors | For continuous monitoring and recording of environmental conditions (e.g., Vapor Pressure Deficit - VPD) during experiments [29]. |
Maximizing Efficiency and Overcoming System Limitations
Managing Humidity and Vapor Pressure Deficit (VPD) for Optimal Transpiration
In closed-system research, such as phytoremediation and controlled environment agriculture, the management of atmospheric humidity, quantified as the Vapor Pressure Deficit (VPD), is a critical determinant of plant water transport and overall system efficiency. VPD represents the difference between the amount of moisture the air can hold when saturated and the actual amount of moisture present. It is the primary driving force for transpiration, the passive movement of water through the plant from roots to leaves, where it evaporates into the atmosphere [43] [13]. In a closed-loop water recycling context, understanding and controlling VPD is paramount for optimizing plant health, regulating water flow, and ensuring the efficient recycling of water resources.
Global increases in VPD, a phenomenon known as "atmospheric drying," are a recognized consequence of climate change and have been consistently linked to reductions in plant productivity across ecosystems and agro-systems [44] [45]. This trend underscores the importance of VPD management for future research and application. This application note provides researchers and scientists with a foundational understanding of VPD's physiological role, protocols for its measurement and control, and a toolkit for implementing these principles in closed-system research.
Physiological Framework: How VPD Governs Plant Water Transport
Water movement in plants, from soil to atmosphere, is a passive process driven by gradients in free energy. The soil-plant-atmosphere continuum (SPAC) describes this pathway, where VPD creates the evaporative demand at the leaf-air boundary, pulling water through the plant [43]. The relationship between VPD and transpiration is governed by Darcy's law and its hydraulic corollary, which predict that increased VPD leads to greater transpirational pull.
However, plant responses to VPD are not purely physical; they involve complex, systemic physiological adjustments. The table below summarizes the key physiological responses to elevated VPD observed across a meta-analysis of 112 plant species [44].
Table 1: Systemic Physiological Effects of Elevated Vapor Pressure Deficit (VPD)
| Physiological Category | Observed Effect | Impact on Plant Function |
|---|---|---|
| Stomatal Regulation | Decreased stomatal conductance | Immediate reduction in CO2 uptake and transpiration; photosynthetic limitation [44] |
| Leaf Anatomy & Morphology | Changes in stomatal density, leaf venation, and internal anatomy | Acclimation to reduce water loss or mitigate hydraulic risk [44] |
| Plant Growth & Architecture | Altered shoot architecture, root growth, and growth rates | May decrease evaporative surface or reallocate resources [44] |
| Reproductive Development | Negative effects on reproductive organ growth | Yield penalties in crops independent of soil moisture [44] |
| Biochemical Composition | Changes in nutrient and hormonal status | Systemic signaling and adjustment of metabolic processes [44] |
A critical concept is the distinction between short-term and long-term responses. While stomata close rapidly in response to a sudden VPD increase, long-term exposure (days to years) leads to acclimation in anatomy and biochemistry, which are often overlooked in modeling frameworks [44]. Furthermore, species differ significantly in their strategy. Isohydric species exhibit a strong stomatal response to maintain leaf water potential as VPD increases, showing a non-linear transpiration response. In contrast, anisohydric species display a more linear relationship between transpiration and VPD, with stomata being less responsive to air humidity [13].
The following diagram illustrates the cascade of plant physiological responses triggered by high VPD conditions.
Quantitative Data on VPD Impacts and Plant Responses
The effects of VPD on plant physiology and water use are quantifiable. Research has established clear relationships between VPD levels and key metrics like transpiration rate, water use efficiency, and yield. The following table compiles critical quantitative findings from recent studies.
Table 2: Quantitative Effects of VPD Manipulation on Plant Physiology and Productivity
| Parameter | Experimental Context | Effect of Low VPD vs. High VPD | Citation |
|---|---|---|---|
| Cumulative Transpiration | Greenhouse tomato, summer production | Reduced by 19.9% per plant | [43] |
| Irrigation Water Use Efficiency (Biomass) | Greenhouse tomato | Increased by 36.8% | [43] |
| Irrigation Water Use Efficiency (Fruit Yield) | Greenhouse tomato | Increased by 39.1% | [43] |
| Fruit Yield | Greenhouse tomato | Increased by 22.7% per plant | [43] |
| Whole-Plant Biomass | Greenhouse tomato | Increased by 27.3% | [43] |
| Maximum Stand Transpiration Capacity | Tree stands, phytoremediation | Range: 1.5x10⁶ to 7.5x10⁶ L/Ha/year | [39] |
| Transpiration Response Type | Cotton genotypes, glasshouse study | Five out of ten genotypes showed a non-linear TRLim response, conserving water at high VPD (>3 kPa) | [46] |
These data highlight two key insights for closed-system design:
- Active VPD reduction can significantly conserve water and improve the productivity of water use.
- Genotypic selection is crucial, as plants with a limiting transpiration (TRLim) trait naturally conserve water under high VPD conditions, a potential advantage for drought-prone or water-sensitive closed environments [46].
Experimental Protocols for VPD Measurement and Plant Phenotyping
Protocol 4.1: Gravimetric Measurement of Whole-Plant Transpiration Response to VPD
This protocol, adapted from a chamber-based system, allows for the precise phenotyping of whole-plant transpiration (E) responses to VPD in a controlled setting [13].
Objective: To unequivocally assess the steady-state transpiration response of a plant to a range of VPDs, while controlling for other environmental variables.
Materials:
- MoSysT or similar custom-built system consisting of:
- Main monitoring chamber and an upstream air pre-mixing chamber.
- Dry air source (e.g., silica-based dehumidifier).
- Humid air source (e.g., ultrasonic nebulizers in a water tank).
- Programmable control software to regulate air stream mix based on sensor feedback.
- High-precision balances (e.g., KERN KB 2400-2 N, d=0.01g) for pot weighing.
- Combined humidity and temperature sensor (e.g., Tinytag TV-4505).
- LED lamps for controlled PPFD.
- Computer fans for homogeneous air mixing.
- Test plants with soil surface covered with a gravel layer to minimize soil evaporation.
Procedure:
- Plant Preparation: Grow plants uniformly. Before measurement, ensure plants are well-watered to avoid soil water deficit confounding the results.
- System Calibration: Calibrate all sensors. Program the control software with target VPD levels (e.g., from 0.5 kPa to 3.5 kPa).
- Baseline Measurement: Place the plant pot on a balance inside the main chamber. Allow the plant to acclimate to the initial chamber conditions (e.g., VPD of 1.0 kPa, light intensity of 600-900 μmol m⁻² s⁻¹ at the canopy) for 30 minutes.
- Gravimetric Transpiration Measurement:
- Initiate continuous weight logging of the balance at 1-minute intervals.
- Set the system to the first target VPD. Stable VPD values are typically attained within 5 minutes and can be maintained for 45 minutes [13].
- Record the weight loss over a stable 30-45 minute period. Weight loss (g) is converted to water volume and standardized to a transpiration rate (e.g., mmol m⁻² s⁻¹) based on the plant's leaf area.
- Sequentially increase the VPD to the next target level, allowing stabilization and measurement at each step.
- A complete run across a VPD range can take up to 4 hours, which is short enough to prevent acclimation responses or significant soil water depletion [13].
- Data Analysis: Plot transpiration rate against VPD. Fit a curve to the data. The presence of a breakpoint where the slope decreases indicates a TRLim response, as seen in certain cotton genotypes [46].
Protocol 4.2: Assessing Water Productivity in a Controlled VPD Environment
This protocol outlines a greenhouse-based experiment to evaluate the integrated effects of VPD on plant water status, growth, and ultimate water productivity [43].
Objective: To quantify the effects of two contrasting VPD regimes on plant water relations, gas exchange, growth, and irrigation water use efficiency.
Materials:
- Two adjacent greenhouse compartments allowing for environmental control.
- Fogging system or high-pressure humidifier for the low-VPD treatment.
- Environmental sensor suite (monitoring air temperature, relative humidity, PAR).
- Porometer or infrared gas analyzer (IRGA).
- Pressure chamber for measuring leaf water potential (Ψleaf).
- Standard equipment for plant growth analysis (e.g., calipers, leaf area meter, analytical balance).
Procedure:
- Experimental Design: Establish a completely randomized design or randomized complete block design within two greenhouse compartments: a High-VPD compartment (no active humidification) and a Low-VPD compartment (with active humidification to maintain VPD ~1.6 kPa during midday).
- Plant Material & Growth: Transplant uniform seedlings (e.g., tomato) into both compartments. Maintain identical soil moisture levels in both treatments using a controlled irrigation regime.
- Microenvironment Monitoring: Continuously log air temperature and relative humidity in both compartments to calculate and document the actual VPD conditions throughout the experiment.
- Plant Water Status Measurements:
- Predawn Ψleaf: Measure before sunrise as a proxy for soil water potential.
- Midday Ψleaf: Measure at solar noon to assess plant water stress.
- Leaf Gas Exchange: Use a porometer or IRGA to measure stomatal conductance (gₛ) and leaf photosynthesis rate at midday on several dates.
- Plant Growth and Yield Analysis: At regular intervals, measure morphological parameters (leaf area, stem diameter). At harvest, separate plants into roots, stems, leaves, and fruits for dry biomass determination. Record total fruit yield.
- Water Use and Efficiency Calculation:
- Cumulative Transpiration: Estimate from irrigation water applied minus drainage, or via direct gravimetric methods.
- Irrigation Water Use Efficiency (WUEᵢ): Calculate as both WUEplant-I (Total above-ground biomass / Irrigation water) and WUEyield-I (Fruit yield / Irrigation water) [43].
The workflow for implementing these protocols is summarized in the diagram below.
The Scientist's Toolkit: Key Research Reagent Solutions
For researchers establishing experiments on VPD and transpiration, the following tools and reagents are essential.
Table 3: Essential Research Tools for VPD and Transpiration Studies
| Tool / Reagent | Function / Application | Specific Examples / Notes |
|---|---|---|
| Controlled-Environment Chamber | Provides stable, reproducible conditions for isolating VPD effects. | Custom systems like MoSysT [13] or commercial plant growth chambers. |
| High-Precision Balance | Gravimetric measurement of whole-plant transpiration. | KERN KB 2400-2 N (d=0.01g) [13]. Critical for integrative water loss data. |
| Humidity & Temperature Sensor | Monitoring and calculating VPD in real-time. | Tinytag TV-4505 data logger [13]. Essential for validating treatment conditions. |
| Infrared Gas Analyzer (IRGA) | Measuring leaf-level gas exchange (stomatal conductance, photosynthesis). | Portable systems from Li-Cor Biosciences. Provides mechanistic physiological data. |
| Sap Flow Sensors | Measuring transpiration in larger plants or trees in situ. | Granier-style thermal dissipation probes [39]. For non-destructive, continuous monitoring. |
| Pressure Chamber | Determining leaf water potential (Ψ), a key indicator of plant water status. | Standard tool for quantifying water stress levels in response to VPD [43]. |
| Genotyped Plant Lines | Investigating genetic variation in transpiration response to VPD. | Cotton genotypes with known TRLim trait (e.g., Sicot 41) [46]. |
Application and Management Strategies for Closed-Loop Systems
Integrating VPD management into the design and operation of closed-loop systems, such as advanced greenhouses or bioregenerative life support systems, is essential for optimizing water recycling.
Strategic Implications:
- System Design: Incorporate humidification technologies (e.g., high-pressure fogging systems) alongside dehumidification systems to actively regulate VPD. This creates a flexible environment that can maintain low VPD for water conservation and high productivity, or higher VPD for other research goals [43].
- Water Mass Balance: Recognize that water input includes both irrigation and fogging water. Research shows that while low VPD reduces plant transpiration, the fogging system itself consumes water. Net water saving is positive at high planting densities, where the transpiration savings are distributed across many plants, but can be negative at low densities [43]. This trade-off must be modeled for each specific system.
- Plant Selection: Exploit natural genetic variation in VPD response. Breeding or selecting for cultivars with the TRLim trait can provide a passive, energy-free method to reduce water consumption and mitigate water stress during peak evaporative demand, making closed systems more resilient [46].
Management Recommendations:
- For high-value biomass or fruit production in greenhouses, maintaining a low VPD (e.g., ~1.6 kPa during midday) can significantly enhance irrigation water productivity [43].
- In phytoremediation applications, where the goal is maximum water extraction from soil or groundwater, select tree species with high stand-level transpiration capacity (up to 7.5 million liters per hectare per year) and manage VPD to avoid excessive stomatal closure that would limit the remediation process [39].
- Continuously monitor VPD as an integral part of the environmental control system, as it provides direct information about the transpirational driving force, enabling more precise irrigation and humidity control decisions than relative humidity alone [43].
In closed-system research involving plant cultivation, such as in hydroponics or controlled environmental agriculture, the efficient recycling of water through plant transpiration is a key objective. However, this goal is frequently compromised by a triad of interrelated failures: root zone anoxia, pathogen proliferation, and nutrient lockout. These issues form a vicious cycle; anoxic conditions stress plant roots and promote pathogenic infections, which in turn damage the root systems, further impairing nutrient and water uptake and exacerbating the effects of nutrient lockout. Understanding and mitigating these failures is critical for maintaining system stability and achieving research reproducibility, particularly in sensitive fields like drug development where consistent plant material is paramount. This document provides detailed application notes and experimental protocols to identify, analyze, and resolve these common failures.
Root Zone Anoxia
Background and Quantitative Impact
Root zone anoxia, or oxygen deficiency in the root environment, is a primary stressor in closed systems, especially under waterlogged conditions or in systems with poor oxygenation. It occurs when the rate of oxygen consumption by roots and microorganisms exceeds the rate of oxygen diffusion into the root zone. In the context of water recycling, transpiration-driven water movement does not directly alleviate this hypoxia and can sometimes be reduced as a consequence of it.
The physiological impacts are severe: hypoxia inhibits root respiration, leading to a critical shortage of energy (ATP) [47]. This energy deficit restricts active nutrient uptake, resulting in nutrient deficiencies even when nutrients are present in the solution [47]. Prolonged anoxia leads to cytoplasmic acidification and ultimately, root cell death [47].
Recent research demonstrates the efficacy of root-zone oxygen supplementation in mitigating these effects. The table below summarizes quantitative data from a study on tomatoes under waterlogging stress, a condition that induces severe anoxia [47] [48].
Table 1: Quantitative Effects of Root-zone Oxygen Supply on Waterlogged Tomato Plants
| Parameter Investigated | Treatment | Result (Micro-Tom) | Result (Omanda-3) |
|---|---|---|---|
| Root Dry Weight | 25-50 mL air/plant | >73.0% increase | 164.1% - 182.1% increase |
| Fruit Yield | 25-50 mL air/plant | 86.2% increase | 24.3% increase |
| Leaf Net Photosynthetic Rate | Root-zone oxygen | Substantial Increase | Substantial Increase |
| Antioxidant Enzyme Activity | Root-zone oxygen | Substantial Increase (CAT, POD) | Substantial Increase (CAT, POD) |
Experimental Protocol: Evaluating Root-Zone Oxygenation
Objective: To assess the effectiveness of a root-zone oxygen supply system in mitigating anoxia stress in a closed hydroponic setup.
Materials:
- Plant materials (e.g., Micro-Tom tomato, a model cultivar for controlled experiments [47])
- Hydroponic system (e.g., Deep Water Culture, DWC)
- Air pumps, air stones, and tubing
- Dissolved oxygen (DO) meter
- Waterproof temperature probe
- Root imaging chamber (optional, for root morphology)
- Equipment for measuring photosynthetic rate (e.g., infrared gas analyzer)
- Supplies for antioxidant enzyme assays (e.g., for Catalase (CAT) and Peroxidase (POD))
Methodology:
- System Setup: Establish a hydroponic system (e.g., DWC) with two treatment groups: a control with standard aeration and an experimental group with enhanced root-zone oxygen supply. The enhanced group could utilize a water-air coupled irrigation system or a higher-capacity air pump [47].
- Plant Culture: Germinate and grow plants until a specified developmental stage (e.g., 4-5 true leaves). Acclimatize plants to the hydroponic system.
- Stress Induction & Treatment: For studies simulating a failure, induce mild hypoxia by reducing aeration in the control group while maintaining enhanced aeration in the treatment group. Monitor and record DO and solution temperature daily. Maintain all other growth conditions (light, nutrients, pH) identically between groups.
- Data Collection:
- Physiological Data: Periodically measure leaf net photosynthetic rate, transpiration rate, and stomatal conductance.
- Root Morphology: At the end of the experiment, scan root systems and use image analysis software to determine root surface area, total root length, and fork number [47] [48].
- Biomass and Yield: Measure fresh and dry weight of roots and shoots. Record yield parameters (e.g., fruit number and weight).
- Biochemical Analysis: Assay antioxidant enzyme activities (e.g., CAT and POD) from leaf or root tissue samples.
Visualization of Anoxia Impact and Mitigation
The following diagram outlines the cause-and-effect pathway of root zone anoxia and the mitigating role of oxygen supplementation.
Diagram Title: Anoxia Pathway & Oxygen Mitigation
Pathogens and Disease
Background and Link to System Failures
Pathogens, particularly those causing root rot, are a major consequence and cause of system instability. Anoxic and stressed root tissues are more susceptible to infection by pathogens like Pythium and Fusarium [49]. In closed, recirculating systems, a single infection point can rapidly spread throughout the entire system, jeopardizing all plants [49]. Furthermore, pathogen infestation can damage root structures, directly contributing to the symptoms of nutrient lockout.
Common signs of pathogen disease include wilting and drooping plants, yellowing and discoloration of leaves, stunted growth, and roots that turn brown and mushy with a distinct foul odor [49] [50]. It is critical to distinguish these symptoms from those of pure nutrient lockout.
Experimental Protocol: Pathogen Monitoring and Control
Objective: To monitor for pathogen presence in a closed hydroponic system and evaluate the efficacy of a sterilization protocol.
Materials:
- Nutrient solution samples
- Sterile swabs
- Petri dishes with general and selective media (e.g., for Pythium)
- Incubator
- UV sterilizer unit or chemical sterilants (e.g., hydrogen peroxide)
- Microscope
- PCR equipment (for molecular identification, optional)
Methodology:
- Routine Monitoring:
- Solution Sampling: Aseptically collect weekly samples from the nutrient reservoir. Serially dilute samples and plate on appropriate culture media. Incubate and count colony-forming units (CFUs).
- Root Inspection: Regularly visually inspect a subset of roots for discoloration (browning) and sliminess. Gently rinse roots and use a microscope to check for microbial structures.
- Pathogen Identification: For dominant or suspicious colonies, perform Gram staining and microscopic examination. For definitive identification, use molecular techniques like PCR sequencing.
- Intervention Protocol:
- Upon detection of a pathogen above a threshold CFU or confirmation of a root rot species, initiate a sterilization protocol.
- Option 1: UV Sterilization. Pass the nutrient solution through a UV sterilizer unit before it returns to the reservoir [49].
- Option 2: Chemical Treatment. Introduce a sterilizing agent like hydrogen peroxide at a calibrated, plant-safe concentration into the reservoir.
- Physical Intervention: For affected plants, gently rinse the roots with clean, pH-balanced water to remove decomposing material and slime [49].
- Efficacy Assessment: Continue monitoring CFU counts for several days after intervention to confirm a reduction in pathogen load. Record plant health metrics to assess recovery.
Nutrient Lockout
Background and Causes
Nutrient lockout occurs when essential nutrients are present in the growth solution but are chemically or physiologically unavailable for plant uptake. The most common cause is an improper pH balance in the root zone [50]. When the pH drifts outside the optimal range (typically 5.5-6.5 for many crops), nutrients form insoluble precipitates, becoming "invisible" to the plant roots. This leads to deficiency symptoms (e.g., yellowing) even when electrical conductivity (EC) measurements indicate sufficient nutrients are present [50].
Other causes include:
- Antagonistic Interactions: Excess of one nutrient can inhibit the uptake of another (e.g., high potassium levels can inhibit calcium uptake).
- Root Damage: Impaired root function due to anoxia or pathogen attack directly prevents nutrient absorption.
Experimental Protocol: Diagnosing and Correcting Nutrient Lockout
Objective: To systematically diagnose nutrient lockout and restore nutrient availability.
Materials:
- pH meter (calibrated regularly)
- EC (Electrical Conductivity) meter
- pH adjustment solutions (pH Up, pH Down)
- Source of clean water (e.g., reverse osmosis (RO) water)
Methodology:
- Diagnosis:
- Measure pH and EC Daily: This is the first and most critical step when plants show deficiency symptoms [50].
- Visual Symptom Check: Compare leaf symptoms (e.g., chlorosis pattern, necrosis) to nutrient deficiency charts. Remember that lockout can mimic true deficiencies.
- Correction Protocol:
- If pH is Imbalanced: Adjust the pH of the nutrient solution gradually using pH Up or pH Down solutions. Make small adjustments, allow the solution to circulate, and re-measure before making further changes. Target the optimal range for your specific crop [50].
- If EC is Too High: This indicates an over-concentration of salts, which can also cause lockout and toxicity. Dilute the reservoir with clean, pH-balanced water to lower the EC to the target range [50].
- System Flush: In severe cases, the best course of action is to completely drain the system, flush the root zone with a mild, pH-corrected solution, and replace with a fresh, properly mixed nutrient solution.
- Verification: Monitor plant health and new growth over the following days for signs of recovery. Continue to track pH and EC closely.
Table 2: Troubleshooting Guide for Common Hydroponic Failures
| Symptom | Potential Cause | Diagnostic Action | Corrective Action |
|---|---|---|---|
| Wilting, brown/mushy roots, foul smell | Pathogen/Root Rot [49] | Inspect roots; check for slime; microbial culture. | Increase aeration; lower solution temp; use UV/sterilants; remove severely affected plants [49] [50]. |
| Yellowing leaves, stunted growth (EC normal) | Nutrient Lockout (pH drift) [50] | Measure pH immediately. | Adjust pH to crop-specific range (e.g., 5.8-6.3) [50]. |
| Yellowing older leaves | True Nitrogen Deficiency / Lockout | Check EC; check pH. | If EC low, add nutrients. If pH off, correct pH [50]. |
| General plant decline, root die-back | Root Zone Anoxia [47] | Measure dissolved oxygen; inspect for white vs. brown roots. | Increase aeration/oxygenation; avoid high reservoir temperatures. |
| White, slimy coating on roots/system | Algae Overgrowth [50] | Visual inspection. | Light-proof the reservoir and irrigation lines; clean system. |
The Scientist's Toolkit: Research Reagent Solutions
Table 3: Essential Research Reagents and Materials for Closed-System Plant Research
| Item | Function/Application | Example & Notes |
|---|---|---|
| Dissolved Oxygen Meter | Precisely monitor root zone oxygen levels to quantify anoxia risk. | A calibrated probe meter is essential for collecting reliable quantitative data. |
| pH & EC Meter | Fundamental for diagnosing and preventing nutrient lockout. | Use lab-grade meters and adhere to a strict calibration schedule [50]. |
| Water-Air Coupled Irrigation System | Actively mitigates root zone anoxia by delivering oxygen-enriched water. | Can be implemented via venturi injectors or sub-surface drip irrigation [47]. |
| UV Sterilizer | Controls pathogen spread in recirculating nutrient solutions without chemicals. | Effective for reducing microbial load and preventing disease transmission [49]. |
| Catalase & Peroxidase Assay Kits | Quantify antioxidant enzyme activity as a biochemical marker for oxidative stress. | Used to validate the physiological relief of stress (e.g., after oxygen supplementation) [47]. |
| Reverse Osmosis (RO) Water System | Provides a consistent, clean water source with low initial TDS/EC. | Prevents confounding variables from mineral content in source water [50]. |
| Root Scanning & Analysis Software | Quantitatively assess root morphology (length, surface area, forks) as a measure of root health. | Tools like WinRHIZO can quantify treatment effects on root architecture [47] [48]. |
In the context of closed-system research, where water recycling through plant transpiration is paramount, irrigation strategy is a critical determinant of system efficiency and stability. The choice between deep, infrequent watering and light, frequent cycles directly influences plant physiology, root architecture, and the overall water balance within the system. Deep infrequent irrigation promotes the development of deeper, more resilient root systems and can lead to significant water savings [51]. In contrast, light frequent irrigation maintains consistent topsoil moisture but risks higher total water loss and shallower root zones [51]. Understanding and optimizing these strategies is essential for maximizing water reuse and plant productivity in controlled environments.
Comparative Analysis of Irrigation Strategies
The table below summarizes the core characteristics, physiological impacts, and outcomes of the two primary irrigation strategies, synthesizing key findings from turfgrass, agricultural, and ecological studies.
Table 1: Core comparison between deep, infrequent and light, frequent irrigation strategies.
| Aspect | Deep & Infrequent Irrigation | Light & Frequent Irrigation |
|---|---|---|
| Definition | Applying water until the soil is wet to a depth of 10 inches or more, then allowing the soil to partially dry before the next cycle [51]. | Maintaining consistent moisture in the top 1-3 inches of soil with daily or near-daily watering [51]. |
| Root System Impact | Promotes longer roots, a greater number of roots, and a larger root surface area, enhancing drought tolerance [51]. | Can limit root system development to shallow depths, making plants more susceptible to water stress [51]. |
| Thatch & Organic Matter | Leads to less thatch and organic matter accumulation [51]. | Can result in more thatch and organic matter buildup [51]. |
| Plant Water Status | Mimics natural wet-dry cycles, encouraging deeper root foraging. Trees may close stomata earlier during drought to protect water transport systems and prioritize growth over photosynthesis [9]. | Maintains readily available water in the topsoil, potentially keeping stomata open for longer under non-water-stressed conditions. |
| Total Water Use | More efficient, using less than half the water compared to light/frequent watering in some studies [51]. | Less efficient, can use more than twice the amount of water [51]. |
| System Considerations | More suitable for deep, well-draining soils. In closed systems, larger, less frequent water inputs may simplify recycling logistics. | May be necessary for shallow soils or containers. Requires precise control to avoid overwatering and high transpirative losses. |
Quantitative Data from Key Studies
Empirical data from various studies provides a numerical basis for evaluating these irrigation strategies. The following tables consolidate quantitative findings on water use, plant response, and system performance.
Table 2: Summary of water use and plant response from a turfgrass study [51].
| Parameter | Deep & Infrequent | Light & Frequent |
|---|---|---|
| Seasonal Water Applied | Baseline (X) | > 2X |
| Root Length & Surface Area | Higher | Lower |
| Thatch Accumulation | Lower | Higher |
| High-Temperature Stress Tolerance | Enhanced | Reduced |
Table 3: Performance of optimized irrigation scheduling in a groundnut field experiment [52].
| Parameter | Optimized Scheme | Automated Irrigation System |
|---|---|---|
| Seasonal Irrigation Water | 128% of baseline | 100% of baseline |
| Yield | 151% of baseline | 100% of baseline |
| Net Income | 218% of baseline | 100% of baseline |
Table 4: Impact of micro-sprinkler irrigation on a winter wheat-summer maize rotation system [53].
| Irrigation Treatment | Annual Yield (kg/ha) | Annual Water Use Efficiency (kg/m³) | Net Groundwater Consumption (mm) |
|---|---|---|---|
| Reduced Irrigation (R) | 13,256 | 2.58 | -25.5 (Low rainfall year) |
| Moderate Irrigation (M) | 16,129 | 2.36 | 95.4 (Low rainfall year) |
| Full Irrigation (F) | 16,695 | 1.99 | 215.7 (Low rainfall year) |
Experimental Protocols for Closed-System Research
To investigate irrigation strategies in a closed-system transpiration context, the following detailed protocols can be adopted and adapted.
Protocol 1: Comparative Physiology and Water Recycling Efficiency
Objective: To determine how deep versus frequent irrigation affects plant transpiration rates, stomatal regulation, root architecture, and the efficiency of a closed-loop water recovery system.
Materials:
- Plant Material: Uniform plant specimens (e.g., a model crop like groundnut or a fast-growing tree species).
- Growth Chambers/Enclosed Phytotrons: Precisely control light, temperature, humidity, and CO₂.
- Soil Moisture Sensors: Profile probes (e.g., TDR or FDR sensors) installed at multiple depths (e.g., 5cm, 15cm, 30cm, 50cm).
- Weighing Lysimeters: To measure real-time evapotranspiration by tracking the mass of the soil-plant system.
- Portable Photosynthesis System (e.g., CI-340): To measure leaf-level transpiration, stomatal conductance, and photosynthetic rate [1].
- Plant Canopy Imager (e.g., CI-110): To non-destructively track Leaf Area Index (LAI) [1].
- Water Condensation and Collection System: To capture and measure transpired water from the closed chamber atmosphere.
- Data Logger: To continuously record sensor data.
Methodology:
- System Setup: Plant specimens in large, sealed containers within the phytotron. Connect the condensation system to create a closed hydrologic loop. Install sensors and connect to the data logger.
- Treatment Application:
- Group A (Deep & Infrequent): Irrigate when the average soil moisture at the 30cm depth drops to 50% of field capacity. Apply water until the profile is wet to a depth equivalent to the bottom of the container (simulating the 10+ inch target).
- Group B (Light & Frequent): Irrigate daily to maintain the top 10cm of soil at or near field capacity.
- Both groups receive the same total volume of water per week during the establishment phase. The volume is calculated based on potential evapotranspiration.
- Data Collection:
- Continuous: Soil moisture at all depths, lysimeter weight (for ET), and condensed water volume.
- Daily/Weekly: Use the portable photosynthesis system to measure stomatal conductance and transpiration on a fixed set of leaves from each treatment at peak light hours.
- Weekly: Measure LAI using the canopy imager.
- At Harvest: Destructively sample plants to measure root length density distribution, total root surface area, and shoot/root biomass.
- Data Analysis:
- Calculate Water Use Efficiency (WUE) as biomass produced per unit of water transpired.
- Analyze the relationship between LAI, stomatal conductance, and daily transpiration patterns.
- Correlate root architecture data with the dynamics of soil moisture depletion.
- Calculate the efficiency of the water recycling loop as (Condensed Water / Total Irrigation Input).
Protocol 2: Modeling and Optimization of Irrigation Scheduling
Objective: To utilize a numerical simulation model for optimizing irrigation depth and timing to maximize net income or water use efficiency within a closed-system framework.
Materials:
- Process-Based Model: A soil-plant-atmosphere model (e.g., WASH_2D, AquaCrop, or WHCNS) capable of simulating 2D water movement, root uptake, and crop growth [52] [53].
- Weather Station/Forecast Data: Real-time or forecasted data for solar radiation, temperature, humidity, and wind speed.
- Computer Workstation: For running simulations.
Methodology:
- Model Parameterization & Calibration:
- Input soil hydraulic properties (e.g., water retention curve, hydraulic conductivity) for the growth medium.
- Calibrate the model's crop growth parameters (e.g., transpiration efficiency, basal crop coefficient, root growth pattern) using data from a preliminary experiment or literature values [52].
- Validate the model by comparing simulated soil moisture and LAI with observed data from a separate experiment.
- Optimization Scheme:
- The core of the protocol is an optimization function that runs at the beginning of each irrigation interval. The function calculates the irrigation depth (
W) that maximizes net income (In) for that interval [52]:In = (Pc * ε * τi * ki) - (Pw * W) - CotWhere:Pc= Crop price ($/kg dry matter)ε= Transpiration efficiency (kg DM/kg H₂O)τi= Predicted cumulative transpiration during the interval (kg H₂O)ki= Income correction factor for early growth stagesPw= Price of water ($/kg)W= Irrigation depth (mm)Cot= Other fixed costs ($)
- The variable
τiis predicted by the WASH_2D model, which is run with short-term weather forecasts and the proposed irrigation depthWas inputs.
- The core of the protocol is an optimization function that runs at the beginning of each irrigation interval. The function calculates the irrigation depth (
- Implementation:
- For each irrigation decision point, the model tests a range of possible
Wvalues. - The value of
Wthat yields the highestInis selected as the optimal irrigation depth for the coming interval. - In a closed-system context,
Pwcan be adjusted to reflect the real cost and energy input of recycling water, thereby incentivizing strategies that align system efficiency with economic return.
- For each irrigation decision point, the model tests a range of possible
Signaling and Workflow Diagrams
Plant Water Regulation Logic
Title: Plant Water Balance & Stomatal Regulation
Irrigation Optimization Workflow
Title: Real-Time Irrigation Optimization Protocol
The Scientist's Toolkit: Essential Reagents and Materials
Table 5: Key research reagents and materials for irrigation and transpiration studies.
| Item | Function/Application |
|---|---|
| Portable Photosynthesis System (e.g., CI-340) | Measures transpiration, stomatal conductance, and photosynthesis rates simultaneously on single leaves in real-time under controlled chamber conditions [1]. |
| Plant Canopy Imager (e.g., CI-110) | Measures Leaf Area Index (LAI), a critical parameter for estimating plant-level transpiration and validating growth models [1]. |
| Soil Moisture Profile Sensors (TDR/FDR) | Precisely monitors volumetric water content at multiple soil depths to track water movement and root uptake patterns. |
| Weighing Lysimeter | Provides direct, high-resolution measurement of total evapotranspiration from a plant-soil column by continuous weighing. |
| Process-Based Simulation Model (e.g., WASH_2D, WHCNS) | Numerically simulates water, solute, and heat movement in the soil-plant-atmosphere system to predict outcomes of different irrigation scenarios and optimize scheduling [52] [53]. |
| Data Logger | Essential for the continuous, time-stamped recording of data from all electronic sensors (soil moisture, lysimeter, climate). |
| Climate-Controlled Growth Chamber | Provides a stable and reproducible environment for studying plant physiological responses by controlling light, temperature, humidity, and CO₂. |
Genetic and Environmental Levers for Enhancing Transpiration Efficiency (TE)
In the context of closed-loop life support systems, such as those planned for long-duration space missions, the efficient recycling of water through biological processes is paramount [54]. Within these Bioregenerative Life Support Systems (BLSS), plants are tasked with producing food, generating oxygen, capturing carbon dioxide, and purifying water through transpiration [54]. Transpiration Efficiency (TE)—defined as the biomass produced per unit of water transpired—is a critical determinant of overall system water use efficiency and sustainability [29]. Enhancing TE is thus essential for minimizing water loss and optimizing resource cycling in closed environments. This document outlines the key genetic and environmental factors influencing TE and provides detailed protocols for its improvement, specifically tailored for research scientists and BLSS developers.
Quantitative Levers of Transpiration Efficiency
The following factors have been quantitatively demonstrated to influence TE. The data are synthesized into tables for clear comparison and application.
Table 1: Genetic and Species-Specific Levers for TE
| Lever | Effect on TE | Key Findings & Magnitude | Relevant Species / Context |
|---|---|---|---|
| Stomatal Regulation under High VPD | Increases | Genotypes that restrict transpiration under high VPD (>2 kPa) can achieve higher TE. This is a heritable trait [29]. | Maize, Sorghum, Pearl Millet [29]. |
| Species Selection | Variable | Maize showed higher TE than pearl millet and sorghum under high VPD conditions. TE is not constant across C4 species [29]. | Maize, Sorghum, Pearl Millet [29]. |
| Aquaporin Activity | Increases | The gene Phvul.001G108800 (an aquaporin SIP2-1 related gene) showed water channel activity, influencing plant water transport [55]. |
Common Bean (Phaseolus vulgaris) [55]. |
| Transcription Factors | Increases | Genome-wide association studies (GWAS) identified transcription factors (e.g., UPBEAT1, C2H2-type ZN finger protein) that control transpiration responses to drying soil [55]. |
Common Bean, validated in Arabidopsis thaliana [55]. |
| Source-Sink Balance | Increases | Removal of cobs (sinks) in maize drastically decreased TE under high VPD, demonstrating that strong sink strength regulates photosynthesis and transpiration coupling [29]. | Maize [29]. |
Table 2: Environmental and Management Levers for TE
| Lever | Effect on TE | Key Findings & Magnitude | Relevant Species / Context |
|---|---|---|---|
| Atmospheric CO₂ Enrichment | Increases | Elevated CO₂ induces stomatal closure (a 38% increase in closure per [1]), directly reducing transpiration and improving TE. However, it also promotes greening, which can offset TE gains by increasing total leaf area [1]. | Global analysis of vegetation [1]. |
| Soil Type | Variable | TE is generally higher in high-clay soils than in sandy soils under high VPD, but the effect is species-dependent. Maize TE varied significantly with soil type, while pearl millet did not [29]. | Maize, Pearl Millet [29]. |
| Vapor Pressure Deficit (VPD) | Decreases | High VPD is the primary environmental driver of transpiration. The relationship is linear in some species, while others exhibit a breakpoint where transpiration is restricted, conserving water and improving TE [29]. | Universal, but species-specific responses exist [29]. |
| Leaf Area Index (LAI) Management | Decreases* | While essential for growth, uncontrolled LAI increase from CO₂ fertilization can raise total canopy transpiration, counteracting TE improvements from stomatal closure. Managing LAI is crucial for water balance [1]. | Global forests, grasslands, croplands [1]. |
Experimental Protocols for TE Phenotyping
The accurate measurement of TE and its component traits is fundamental for identifying superior genotypes and optimal growth conditions for BLSS.
Protocol 1: Whole-Plant Transpiration Efficiency (WPTE) Assay
Application: Phenotyping for genetic studies or evaluating environmental effects on TE in controlled environments. Principle: Directly measures the total water transpired and the shoot biomass produced over a defined period [29].
- Plant Material & Growth: Germinate and grow plants in individual, sealed pots. For genetic studies, use a randomized complete block design with sufficient replicates.
- Watering & Saturation: Saturate the growth medium with water and seal the pot surface (e.g., with plastic film and aluminum foil) to prevent soil evaporation. Record the pot's initial weight.
- Transpiration Measurement: Weigh the pots daily at the same time. The daily weight loss is the daily transpiration. Continue until a predetermined soil moisture deficit is reached or for a set period (e.g., 14-21 days).
- Biomass Harvest: At the end of the experiment, harvest the shoot tissue. Dry the biomass in an oven at 70°C to constant weight (typically 48-72 hours) and record the dry weight.
- Calculation: Calculate WPTE as the ratio of total shoot dry biomass (g) to total water transpired (kg or L) over the measurement period.
Protocol 2: Sap Flow Monitoring for Canopy Transpiration (Ec)
Application: Continuous, non-destructive monitoring of transpiration in larger plants or trees within a BLSS module. Principle: Uses thermal dissipation probe (TDP) sensors inserted into the sapwood to measure sap flow velocity, which is converted to canopy transpiration [4].
- Sensor Installation: Select healthy, representative stems. Install paired TDP sensors (e.g., using the Granier-type system) into the sapwood according to manufacturer guidelines. Insulate the sensors from ambient temperature fluctuations.
- Data Logging: Connect sensors to a data logger. Record the temperature difference between the heated and reference probe continuously (e.g., every 30 seconds, logging 15-minute averages).
- Sapwood Area Assessment: Determine the sapwood area of the measured trees, either destructively at the end of the experiment or using core samples [4].
- Environmental Monitoring: Simultaneously record key environmental drivers: Photosynthetically Active Radiation (PAR/Rs), Air Temperature (Ta), Relative Humidity (to calculate VPD), and Soil Water Content (SWC) [4].
- Data Processing: Convert the raw temperature signal to sap flow density using the empirical Granier equation. Scale up to whole-plant or canopy transpiration (Ec) using sapwood area.
Protocol 3: High-Throughput Stomatal Conductance and Photosynthesis Measurement
Application: Rapid screening of leaf-level physiological responses to VPD or other stresses. Principle: Uses a portable gas exchange system to simultaneously measure transpiration rate, stomatal conductance, and photosynthetic rate in real-time [1].
- System Calibration: Calibrate the handheld photosynthesis system (e.g., CI-340 Handheld Photosynthesis System) for CO₂ and water vapor sensors according to the manufacturer's manual [1].
- Leaf Selection: Select young, fully expanded, sun-exposed leaves of similar physiological age.
- Environmental Control: Set the chamber's environmental parameters to match ambient growth conditions or a specific test protocol (e.g., a VPD ramp).
- Measurement: Clamp the leaf chamber onto a selected leaf. Allow readings to stabilize (typically 2-3 minutes), then log the data for transpiration, stomatal conductance, and photosynthesis.
- Analysis: Calculate instantaneous TE (or Water Use Efficiency) as the ratio of photosynthetic rate (A) to transpiration rate (E). Analyze the response of stomatal conductance to increasing VPD to identify genotypes with transpiration restriction traits.
Signaling Pathways and Workflow Visualization
Diagram 1: TE Regulation Pathways
Title: Genetic and Environmental Regulation of Transpiration Efficiency
Diagram 2: TE Phenotyping Workflow
Title: High-Throughput TE Phenotyping Pipeline
The Scientist's Toolkit: Research Reagent Solutions
This table catalogs essential materials and tools for implementing the protocols and studying TE.
Table 3: Key Research Reagents and Tools for TE Research
| Item | Function / Application | Example / Specification |
|---|---|---|
| Portable Photosynthesis System | Simultaneous, real-time measurement of transpiration, stomatal conductance, and photosynthetic rate at the leaf level [1]. | CI-340 Handheld Photosynthesis System [1]. |
| Thermal Dissipation Probes (TDP) | Continuous, non-destructive monitoring of sap flow to calculate whole-plant or canopy transpiration (Ec) [4]. | Granier-type sap flow sensors. |
| Plant Canopy Imager | Non-destructive measurement of Leaf Area Index (LAI), a critical factor influencing total transpiration [1]. | CI-110 Plant Canopy Imager [1]. |
| Controlled Environment Growth Chambers | Precisely manipulate and maintain environmental variables (VPD, CO₂, light, temperature) for TE phenotyping experiments. | Walk-in rooms or cabinet-style chambers with CO₂ and humidity control. |
| Precision Balances | Daily weighing of pots for the Whole-Plant Transpiration Efficiency (WPTE) assay. | Capacity >5 kg, resolution 0.1 g. |
| Data Loggers | Record continuous data from sap flow sensors and environmental monitors. | Multi-channel loggers with appropriate sampling intervals. |
| GWAS Panel / Diverse Germplasm | Genetic mapping populations to identify genomic regions and candidate genes associated with high TE [55]. | Diverse panel of inbred lines (e.g., 185 super sweet corn lines [56] or Mesoamerican common bean germplasm [55]). |
Energy and Resource Trade-Offs in Maintaining Closed-System Climates
Application Notes
Quantitative Analysis of Energy Trade-Offs in Water Recycling
In closed-system research, managing the energy footprint of water recycling is paramount. The energy required for water treatment represents a significant operational cost and a key trade-off against freshwater consumption. The quantitative data in Table 1 illustrates this balance, demonstrating that strategic technology selection can reduce energy use by 15-30% while achieving high-quality water suitable for sustaining plant transpiration studies [57]. Systems designed for on-site water reuse inherently consume less energy than centralized treatment and long-distance transport, directly reducing the carbon footprint of maintained climates [58]. Advanced systems now achieve up to 30% lower energy consumption than conventional treatments, a critical efficiency gain in energy-sensitive closed environments [58].
Table 1: Energy and Performance Metrics of Water Recycling Technologies
| Technology | Typical Energy Consumption | Key Performance Indicators (KPIs) | Applicability to Closed-System Plant Research |
|---|---|---|---|
| Electrocoagulation | Moderate (Power consumption significant for high-volume applications [59]) | Removes suspended solids, oils, heavy metals; reduces chemical handling [59] | Versatile pretreatment for complex nutrient solutions; compact footprint ideal for modular systems. |
| Biological Treatment | Low to Moderate (Enhanced processes can reduce consumption by 30% [58]) | 94-95% COD removal, 85-87% TOC removal [58] | Mimics natural purification; can be integrated with plant root zones (rhizosphere) in some system designs. |
| Reverse Osmosis (RO) | High (Requires careful pretreatment and concentrate management [59]) | Highest level of dissolved contaminant removal [59] [58] | Produces high-purity water for precise nutrient solution formulation; concentrate stream must be managed. |
| Ultrafiltration (UF)/ Nanofiltration (NF) | Moderate | UF removes viruses; NF removes divalent ions and organic matter [58] | Excellent polishing step before RO or for specific nutrient/ion control in the system's water loop. |
Resource Recovery and System Mass Balance
Modern water recycling transcends mere purification, focusing on the recovery of valuable resources to create a more closed-loop mass balance. The process of nutrient recovery extracts phosphorus and nitrogen from wastewater, transforming them into eco-friendly fertilizers [58]. This not only prevents nutrient pollution but also reduces dependency on external synthetic fertilizers, closing a critical resource loop in a plant-based closed system. Each year, approximately 4.3 million tons of phosphorus are lost globally due to a lack of recovery systems, highlighting the significance of this integration [58]. Using nutrient-rich recycled water for irrigation can boost agricultural yields, providing a dual benefit of water and nutrient delivery [58].
Table 2: Resource Trade-Offs and Synergies in Closed-System Water Management
| Resource | Trade-Off / Input | Synergy / Recovered Output | Net System Impact |
|---|---|---|---|
| Water | Energy for treatment and pumping [57] [59] | Reduced freshwater extraction; Reliable supply during external shortages [59] [58] | Conservation of external water resources; Increased operational resilience. |
| Nutrients (N, P, K) | Chemical inputs for conventional fertilization [58] | Recovery from wastewater for use as fertilizer [58] | Reduced external fertilizer dependency; Improved sustainability and lower chemical load. |
| Energy | Consumption by aeration, pumping, and advanced treatment [57] | On-site generation via biogas from anaerobic digestion (not directly from transpiration) [57] | Potential for net energy reduction; High efficiency systems (e.g., 30% less energy) improve viability [58]. |
| Waste Streams | Management of brines (from RO) and sludge [59] | Zero Liquid Discharge (ZLD) capability; Conversion of waste to resources [59] [58] | Minimized environmental discharge; Maximized resource utilization within the system. |
Experimental Protocols
Protocol: Evaluating Phytoremediation Efficacy in a Closed-Loop Hydroponic Module
2.1.1 Objective To quantify the rate of water transpiration and nutrient uptake by selected plant species in a closed-system environment, and to measure the associated energy cost of maintaining the system's climate and water quality.
2.1.2 Materials ("The Scientist's Toolkit")
Table 3: Essential Research Reagents and Materials
| Item | Function / Explanation |
|---|---|
| Hydroponic Growth Chamber | A controlled-environment chamber to regulate temperature, humidity, and light cycles, simulating the closed system. |
| Selected Plant Species (e.g., Lemna minor, Eichhornia crassipes) | Fast-growing species known for high transpiration rates and nutrient uptake capabilities from water. |
| Synthetic Wastewater Simulant | A standardized solution containing known concentrations of nitrates, phosphates, and organic carbon to simulate a nutrient-loaded water stream. |
| Data Logging Sensors (pH, EC, DO, Light) | To continuously monitor water quality parameters (pH, Electrical Conductivity, Dissolved Oxygen) and light intensity, providing data for system balance analysis. |
| Precision Weighing Scales (for plant biomass) | To measure plant growth and biomass accumulation over the experiment duration. |
| Water Quality Test Kits (for N, P, COD) | To periodically measure the concentration of key nutrients and contaminants in the water, quantifying removal rates. |
| Energy Meter | A plug-in meter to measure the total electricity consumption of the chamber's lights, pumps, and climate control systems. |
2.1.3 Methodology
- System Setup: Assemble the hydroponic chamber and fill it with the synthetic wastewater simulant. Calibrate all sensors and install the energy meter at the power source for the entire chamber.
- Plant Introduction & Acclimation: Introduce a pre-weighed biomass of the selected plant species into the system. Allow a 48-hour acclimation period under standard growth conditions.
- Baseline Monitoring: Record initial water quality parameters (N, P, COD, pH, EC) and total system mass (water + plants + hardware). Note the starting reading on the energy meter.
- Experimental Run: Initiate the closed-loop phase. For the duration of the experiment (e.g., 14-21 days), the only input is light energy and the only output is the work done by the climate control system.
- Data Collection:
- Daily: Manually record energy meter readings. Log sensor data for pH, EC, and temperature.
- Every 48-72 Hours: Sample the water for off-line analysis of N, P, and COD concentrations. Top up the water reservoir with a precise mass of distilled water to compensate for evapotranspiration losses, recording the mass added to calculate transpiration rate.
- Termination and Analysis: At the end of the experimental period, record the final energy meter reading. Harvest the plants, dry them, and record the final dry biomass. Analyze the final water quality.
- Calculations:
- Nutrient Removal Efficiency: Calculate the percentage reduction in N and P concentrations from initial to final.
- Water Transpiration Rate: Calculate the total mass of water added during the experiment to maintain level; normalize by plant dry biomass and time.
- System Energy Efficiency: Calculate total energy consumed (kWh) and normalize it against the mass of water transpired (kWh/L) and/or mass of nutrients removed (kWh/g N/P).
Protocol: Energy Audit and Benchmarking for a Pilot-Scale Closed System
2.2.1 Objective To establish a baseline energy consumption profile for a research-scale closed climate system and identify high-energy components for potential optimization.
2.2.2 Methodology
- Define System Boundary: Clearly outline which components are included in the audit (e.g., water pumps, air pumps, HVAC, lighting, control computers, sensors).
- Sub-Metering: Install individual energy meters on high-draw components, especially water circulation pumps and climate control (HVAC) units, as these are often the largest consumers [57].
- Benchmarking: Input the collected energy use data into a tool like the ENERGY STAR Portfolio Manager to benchmark the system's performance against similar research facilities or established baselines [57].
- Load Profiling: Create a time-series profile of energy use over a typical operational cycle (e.g., 24-hour light/dark period) to identify peak demand periods and correlate them with specific processes (e.g., lights-on, peak watering cycles).
- Identify Opportunities: Use the audit results to model the energy and cost savings of potential interventions, such as installing variable frequency drives (VFDs) on pumps, switching to more energy-efficient lighting (e.g., LED), or optimizing aeration control in biological treatment units [57].
Mandatory Visualizations
System Energy and Water Flow
Experimental Workflow for Protocol 2.1
Benchmarking Performance: Quantitative Analysis and System Efficacy
In the research on water recycling through plant transpiration in closed systems, robust and quantifiable metrics are paramount for assessing system efficiency and output quality. These Key Performance Indicators (KPIs) provide the foundational data required to validate hypotheses, optimize processes, and ensure the reliability of the system's recycled water. This document outlines the definitive KPIs, detailed experimental protocols, and visualization tools essential for advancing research in this field, framing them within the specific context of managing water resources in controlled environments like greenhouses or bioregenerative life support systems [11].
KPI Definitions and Quantitative Benchmarks
Core KPI Definitions
Water Recycling Rate: This KPI measures the percentage of water that is successfully recycled and reused within the closed system. It is a direct indicator of the system's operational efficiency and resource closure [60] [61]. The standard formula is:
(Total Recycled Water [L] / Total Wastewater Produced [L]) * 100[60] [61]Water Purity: This KPI is not a single metric but a suite of measurements that quantify the quality of the recycled water. Key parameters ensure the water is fit for its intended reuse, particularly for plant irrigation, and pose no chemical or biological risk [62] [63]. Critical metrics include pH levels, turbidity (cloudiness), and the concentration of specific contaminants such as heavy metals or nitrates [63].
Performance Benchmarks and Data Presentation
Interpretation of the Water Recycling Rate should be guided by established performance tiers. For the Water Purity KPIs, targets must be aligned with the specific requirements of the plant species in the system and relevant water quality standards [63].
Table 1: Benchmarking and Interpretation of the Water Recycling Rate KPI
| Performance Tier | Recycling Rate | Interpretation |
|---|---|---|
| Exemplary | > 50% | Indicates strong, robust recycling practices and high operational efficiency [60] [61]. |
| Acceptable | 30% - 50% | Moderate performance with clear room for improvement in process or technology [60] [61]. |
| Critical | < 30% | Weak performance; signifies system inefficiencies and requires immediate remedial action [60] [61]. |
Table 2: Key Water Purity Parameters and Target Thresholds
| Parameter | Standard Unit of Measurement | Target Threshold / Compliance Goal |
|---|---|---|
| pH | pH scale | To be determined based on plant requirements; typically within a specific range (e.g., 5.5-6.5) for optimal nutrient uptake. |
| Turbidity | Nephelometric Turbidity Units (NTU) | < 1 NTU [62] |
| Dissolved Heavy Metals (e.g., Lead) | micrograms per liter (µg/L) | Below detectable limits or as per regulatory safe drinking water standards [63]. |
| Nitrate Concentration | milligrams per liter (mg/L) | Below levels that cause phytotoxicity or align with agricultural water reuse guidelines. |
Experimental Protocols for KPI Measurement
Protocol A: Measuring System-Level Water Recycling Rate
Objective: To accurately determine the Water Recycling Rate of the closed plant-transpiration system over a defined period.
Materials: Total system water collection reservoir, flow meters (optional, for automated systems), graduated cylinders, data logging sheet.
Methodology:
- Define Measurement Period: Select a consistent timeframe for measurement (e.g., 24 hours, one week).
- Measure Total Wastewater Produced: Collect and meter all water entering the waste stream, which includes water not absorbed by plants, leachate from growth beds, and condensate from dehumidifiers before treatment.
- Measure Total Recycled Water: Quantify the total volume of water that has been treated and is deemed suitable for reintroduction to the plants.
- Calculation: Apply the standard formula at the end of the measurement period.
Water Recycling Rate (%) = (Total Recycled Water [L] / Total Wastewater Produced [L]) * 100
Protocol B: Monitoring Water Purity Parameters
Objective: To regularly assess the chemical and physical quality of the recycled water.
Materials: Water sampling bottles (sterile for microbial tests), portable pH meter, turbidimeter, access to ICP-MS (Inductively Coupled Plasma Mass Spectrometry) or equivalent for heavy metal analysis, ion chromatography system or test kits for nitrate analysis.
Methodology:
- Sampling: Collect water samples from key points: post-treatment, at the point of delivery to plants. Ensure samples are representative and preserved as needed for specific analyses.
- pH Measurement: Calibrate the pH meter with standard buffers. Immerse the electrode in the sample and record the stable reading [62].
- Turbidity Measurement: Follow the manufacturer's instructions for the turbidimeter. Ensure the sample cell is clean and free of scratches [62].
- Chemical Contaminant Analysis: Send samples to an accredited laboratory for precise quantification of heavy metals and nitrates, following standardized methods (e.g., EPA methods).
Protocol C: Quantifying Plant Transpiration Rate
Objective: To measure the volume of water transpired by plants, which is a key internal process affecting humidity and the potential for water recovery.
Materials: Precision scale (for potometric method), data logger, environmental sensor for Relative Humidity (RH) and Temperature, gas exchange system (e.g., CI-340 Handheld Photosynthesis System) [1].
Methodology (Potometric Method):
- Plant Setup: Seal a plant pot to prevent soil evaporation, allowing only transpirational water loss.
- Continuous Weighing: Place the setup on a precision scale and log mass at regular intervals.
- Calculation: The mass loss over time is equivalent to the transpiration rate (
Transpiration Rate = ΔMass / ΔTime).
Methodology (Gas Exchange Method):
- Direct Measurement: Use a portable photosynthesis system, which can simultaneously measure transpiration, stomatal conductance, and photosynthetic rate in real-time by analyzing water vapor flux from a leaf enclosed in a chamber [1].
System Workflow and KPI Integration
The following diagram illustrates the logical workflow of a closed-loop water system driven by plant transpiration, highlighting the critical control points where KPIs are measured.
Diagram 1: Closed-loop water system workflow and KPI measurement points.
The Scientist's Toolkit: Research Reagent Solutions
Table 3: Essential Materials and Reagents for Closed-System Water Recycling Research
| Item | Function / Application |
|---|---|
| Hygroscopic Porous Polymers (HPPs) e.g., SMAG, PC-MOF [11] | Advanced sorbent materials for sorption-based atmospheric water harvesting (SAWH) from the humid air of the closed system, enhancing the total water recovery rate [11]. |
| Portable Photosynthesis System (e.g., CI-340) [1] | Precisely measures key plant physiological data in real-time, including leaf transpiration rate and stomatal conductance, directly in the growth environment [1]. |
| Leaf Area Index (LAI) Meter (e.g., CI-110 Plant Canopy Imager) [1] | Quantifies plant canopy density and structure. LAI is a critical variable as it is positively correlated with total plant transpiration [1]. |
| Real-time Water Quality Sensors | IoT-enabled sensors for continuous, in-line monitoring of purity parameters like pH, turbidity, and dissolved oxygen, enabling proactive system management [62] [63]. |
| Advanced Filtration Membranes | Technologies like reverse osmosis (RO) and nanofiltration are used in the water purification process to remove dissolved salts, pathogens, and organic contaminants to achieve high purity standards [60] [63]. |
This application note provides a comparative framework and detailed experimental protocols for evaluating sod-based and conventional crop rotation systems, with a specific focus on water conservation dynamics. The principles of these agricultural systems are of particular relevance to broader research on water recycling via plant transpiration in controlled environments. Sod-based rotations, which integrate perennial grasses into crop sequences, enhance soil hydraulic properties and promote a more efficient water cycle, offering valuable insights for managing closed-system hydrology [64].
Comparative Quantitative Analysis of System Performance
The following tables synthesize key quantitative findings from field studies, comparing water conservation, soil health, and crop productivity between sod-based and conventional systems.
Table 1: Water Balance and Conservation Metrics
| Performance Metric | Conventional System | Sod-Based Rotation System | Measurement Context |
|---|---|---|---|
| Deep Percolation (Water Loss) | ~31% of total water input [64] | Not explicitly quantified; implied reduction [64] | Percentage of total water input in sandy karst soils [64] |
| Soil Water Retention (Field Capacity) | Baseline | 32% increase [64] | Measured in top soil layers [64] |
| Cumulative Evapotranspiration (ETc) - Peanuts | ~354 mm (average) [64] | ~354 mm (average) [64] | Seasonal water use [64] |
| Crop Water Productivity (WPC-ETc) - Peanuts | 1.5 kg m⁻³ [64] | 1.1 kg m⁻³ [64] | Yield per unit of water consumed (ETc) [64] |
| Crop Water Productivity (WPC-ETc) - Maize | 2.6 kg m⁻³ [64] | 2.6 kg m⁻³ [64] | Yield per unit of water consumed (ETc) [64] |
| Reduction in Drought Days | ~60 days [64] | ~11 days [64] | Coarse-textured sandy soil with 30 cm rooting depth [64] |
Table 2: Soil Health and System Productivity Indicators
| Performance Indicator | Conventional System | Sod-Based Rotation System | Measurement Context |
|---|---|---|---|
| Soil Organic Carbon (SOC) | Baseline | 31% increase [64] | In top 15 cm of soil [64] |
| Soil Aggregate Stability | Baseline | 101% increase [64] | Indicator of improved soil structure [64] |
| Infiltration Rate | Baseline | Significantly higher [64] | Following bahiagrass rotation [64] |
| Peanut Yield (Dry Years) | Baseline | 13% higher [64] | Compared to conventional rotations [64] |
| Water-Use Efficiency (WUE) - Peanuts | Baseline | 15% (irrigated) to 19% (non-irrigated) increase [64] | Following bahiagrass rotation [64] |
System Workflows and Functional Relationships
The following diagrams illustrate the structural and functional differences between the two systems, highlighting key mechanisms influencing water conservation.
Sod-Based Rotation System Workflow
Conventional System Water Pathway
Experimental Protocols for System Evaluation
Protocol: Field-Scale Water Balance and Soil Health Monitoring
Objective: To quantitatively compare the soil water dynamics, water use efficiency, and associated soil health parameters between sod-based and conventional cropping systems in a field setting.
Background: This protocol is designed to capture the key differences driven by root architecture and soil organic matter, which are critical for understanding plant-driven water recycling. The methodology is adapted from long-term field studies [64].
Materials:
- See "The Scientist's Toolkit" (Section 5) for essential reagent solutions and equipment.
Procedure:
- Site Selection and Plot Design:
- Establish replicated field plots (e.g., >1 ha each) for both the sod-based rotation (e.g., 2 years of bahiagrass followed by 2 years of row crops) and the conventional rotation (e.g., continuous maize-peanut).
- Ensure all plots have uniform soil type, slope, and prior management history.
Instrument Installation for Water Flux:
- Install a network of soil moisture sensors (e.g., time-domain reflectometry (TDR) or capacitance sensors) at multiple depths (e.g., 10, 20, 30, 50 cm) within the root zone of each plot.
- Data Logging: Program sensors to record volumetric water content at 15-30 minute intervals.
Data Collection and Calculation of Water Balance Components:
- Evapotranspiration (ET): Calculate daily ET using the soil water balance method, where ET = I + P - D - R - ΔS. Measure:
- I: Irrigation input (using flow meters).
- P: Precipitation (using on-site rain gauges).
- ΔS: Change in soil water storage (derived from soil moisture sensor data).
- D: Deep percolation (estimated using drainage lysimeters or soil moisture model).
- R: Surface runoff (measured with runoff collection systems).
- Crop Water Productivity (WPC-ETc): At harvest, determine the yield of marketable crop biomass (e.g., grain, peanuts). Calculate WPC-ETc as Yield (kg ha⁻¹) / Seasonal ETc (m³ ha⁻¹).
- Evapotranspiration (ET): Calculate daily ET using the soil water balance method, where ET = I + P - D - R - ΔS. Measure:
Soil Health Parameter Assessment:
- Sampling: Collect soil cores (0-15 cm and 15-30 cm depths) from each plot at the initiation of the study and annually thereafter.
- Analysis:
- Soil Organic Carbon (SOC): Analyze via dry combustion.
- Soil Aggregate Stability: Determine using wet-sieving methodology.
- Field Capacity: Measure as water content at -33 kPa matric potential using pressure plates.
Data Analysis:
- Perform analysis of variance (ANOVA) to test for significant differences in seasonal ET, deep percolation, WPC-ETc, SOC, and aggregate stability between the two systems.
- Conduct regression analysis to explore relationships between SOC, soil water retention, and deep percolation.
Protocol: Controlled Environment Study of Transpiration Efficiency
Objective: To isolate and measure the transpiration efficiency of plants grown in soils with contrasting health profiles, mimicking the conditions of sod-based and conventional systems.
Background: This mesocosm-scale protocol allows for precise control over water inputs and measurement of outputs, directly linking soil health to plant-mediated water vapor recycling [64] [65].
Materials:
- Growth chambers or greenhouse bays with environmental control.
- Large, sealed pots or lysimeters.
- Soil from long-term sod-based and conventional fields, or artificially amended soils to create contrast in SOC and structure.
- Precision scales (for pot weighing).
- Portable gas exchange system (e.g., Li-Cor LI-6800).
Procedure:
- Soil and Plant Establishment:
- Fill lysimeters with soil from a sod-based history and a conventional history.
- Plant a standardized crop (e.g., maize) with multiple replicates per soil type.
- Grow plants until a designated growth stage (e.g., V6).
Transpiration Measurement Cycle:
- Bring the soil water content in all pots to field capacity.
- Seal the pots to prevent soil evaporation, ensuring that water loss occurs only via plant transpiration.
- Weigh the pots daily on precision scales to calculate daily transpiration rate.
- Continue until the plants deplete the available soil water and show signs of stress.
Physiological Measurements:
- Use a portable gas exchange system to periodically measure leaf-level transpiration rate (E) and net photosynthetic rate (A) on recently matured leaves.
- Calculate instantaneous transpiration efficiency as A/E.
Destructive Harvest:
- At the end of the experiment, measure total plant biomass.
- Calculate whole-plant water use efficiency (biomass produced per unit of water transpired).
Data Analysis:
- Compare the cumulative water transpired, the duration until water stress onset, and the whole-plant water use efficiency between the two soil treatments using t-tests.
- Analyze the relationship between leaf-level A/E and soil health parameters.
The Scientist's Toolkit: Research Reagent Solutions
Table 3: Essential Reagents and Materials for Water Conservation Research
| Item | Function/Application | Specific Example / Notes |
|---|---|---|
| Soil Moisture Sensors | Continuous monitoring of volumetric water content at various soil depths. | Time-Domain Reflectometry (TDR) or Capacitance (FDR) probes. Critical for calculating ET and soil water storage. |
| Lysimeters | Direct measurement of deep percolation (drainage) and actual evapotranspiration. | Weighing lysimeters are the gold standard; suction lysimeters can be used for water sampling. |
| Portable Gas Exchange System | Precise measurement of leaf-level transpiration (E) and photosynthetic (A) rates. | Li-Cor LI-6800. Used for calculating instantaneous transpiration efficiency (A/E). |
| Pressure Plate Apparatus | Determination of soil water retention characteristics (e.g., field capacity, wilting point). | Standard method for applying specific soil water potentials to samples. |
| Soil Aggregate Stability Kit | Quantitative assessment of soil structure via wet-sieving. | Key indicator of soil physical health influenced by sod-based rotations. |
| Elemental Analyzer | Quantitative measurement of Soil Organic Carbon (SOC) and Total Nitrogen. | Uses dry combustion; essential for tracking changes in soil health. |
| Flow Meters | Precise measurement of irrigation water inputs in field studies. | Installed at the source of each plot's irrigation system. |
The escalating global water crisis, driven by population growth, urbanization, and climate change, has intensified the need for innovative water recycling strategies [59] [58]. Among these, plant-based water recycling systems leverage natural physiological processes to treat and reclaim water, presenting a promising, eco-friendly technological solution. This application note details the scientific principles and experimental protocols for validating the removal of organic contaminants in systems centered on plant transpiration. In such closed systems, plants function not merely as passive absorbers but as dynamic, solar-powered pumps that drive the uptake, translocation, and degradation of pollutants from water streams [66] [40].
The core mechanism hinges on the transpiration stream, where water is passively drawn through the plant from roots to leaves, creating a mass flow that carries dissolved contaminants [67]. Recent groundbreaking research has quantified this process on a global scale, revealing that the transit time of water through plants is remarkably fast, with a global annual median of approximately 8.1 days—orders of magnitude quicker than in other parts of the water cycle [66]. This rapid transit underscores vegetation's critical and dynamic role in the terrestrial water cycle. The fate of contaminants within the plant is then determined by a combination of physical, chemical, and biological processes, including sorption, phytotransformation (phytodegradation), and rhizodegradation [68] [67]. Phytotransformation, specifically, involves the breakdown of organic contaminants sequestered by plants through metabolic processes or enzymes produced by the plant, with the resulting simpler compounds being integrated into plant tissue [68]. The efficiency of these processes is influenced by multiple factors, such as the physicochemical properties of the contaminants, plant species, transpiration rate, and environmental conditions like temperature and humidity [69] [68].
This document provides a structured framework for researchers to quantitatively assess these mechanisms. It consolidates current data, standardizes experimental methodologies, and outlines key reagent solutions, aiming to advance the development of robust, plant-based water remediation technologies.
Critical Data Synthesis
The following tables synthesize key quantitative data essential for designing and interpreting experiments on contaminant removal via plant transpiration.
Table 1: Plant-Mediated Removal Efficiency for Selected Volatile Organic Compounds (VOCs)
| Volatile Organic Compound (VOC) | Tested Plant Species | Removal Efficiency Context | Reported Removal |
|---|---|---|---|
| Benzene | Multiple common houseplants (e.g., Chlorophytum comosum, Dracaena fragrans) | Efficiency per leaf area in a sealed chamber study [67] | Varied significantly by species |
| Toluene | Multiple common houseplants (e.g., Chlorophytum comosum, Dracaena fragrans) | Efficiency per leaf area in a sealed chamber study [67] | Varied significantly by species |
| Ethylbenzene | Multiple common houseplants (e.g., Chlorophytum comosum, Dracaena fragrans) | Efficiency per leaf area in a sealed chamber study [67] | Varied significantly by species |
| Xylenes (o-, p-) | Multiple common houseplants (e.g., Chlorophytum comosum, Dracaena fragrans) | Efficiency per leaf area in a sealed chamber study [67] | Varied significantly by species |
| Trichloroethylene (TCE) | Hybrid Poplar Trees | Field demonstration for groundwater remediation [68] | >90% removal observed in a created wetland system |
| TNT, RDX | Elodea, Bullrush, Canary Grass | Field demonstration at an army ammunition plant [68] | >90% removal |
Table 2: Water Transit Times and Contaminant Partitioning in Plants
| Parameter | Value / Range | Context and Conditions |
|---|---|---|
| Global Median Water Transit Time in Vegetation | 8.1 days | From global satellite data analysis; varies by biome [66] |
| Fastest Water Transit Time (Croplands) | 5 days (less than 1 day at peak season) | From global satellite data analysis [66] |
| Slowest Water Transit Time (Evergreen Needleleaf Forests) | 18 days | From global satellite data analysis [66] |
| Leaf Bioconcentration Factor (BCF) | Positively correlated with transpiration | For neutral, cationic, and anionic PPCP/EDCs in tomato, lettuce, carrot [69] |
| Root Bioconcentration Factor (BCF) | Positively correlated with transpiration | For neutral PPCP/EDCs only; anionic PPCP/EDCs showed higher root accumulation [69] |
Experimental Protocols
Protocol 1: Hydroponic Screening for Contaminant Uptake and Translocation
This protocol is designed for the initial high-throughput screening of plant species and their efficacy in removing specific organic contaminants from water under controlled hydroponic conditions.
- Primary Objective: To quantify the uptake and translocation of target organic contaminants by different plant species and determine their bioconcentration factors (BCFs).
- Materials Required:
- Plant Material: Uniform seedlings of test species (e.g., hybrid poplar, lettuce, tomato, carrot) [69] [68].
- Chemicals: Analytical standards of target contaminants (e.g., pharmaceuticals, VOCs) and deuterated surrogates for recovery correction [69] [67].
- Growth System: Controlled environment growth chambers, hydroponic containers, aerators, and nutrient solution [69].
- Analysis: Solid Phase Microextraction (SPME) fibers, Gas Chromatography-Mass Spectrometry (GC-MS) system [67].
- Step-by-Step Procedure:
- Acclimation: Pre-grow plants in a contaminant-free hydroponic nutrient solution until a established root system develops.
- Dosing: Transfer plants to a treatment solution spiked with a known mixture of target contaminants. Include control containers without plants to monitor abiotic loss.
- Environmental Control: Maintain growth chambers at defined conditions (e.g., Warm-Dry: 27°C/50% RH vs. Cool-Humid: 17°C/80% RH) to manipulate transpiration rates [69].
- Transpiration Monitoring: Record the mass of the entire hydroponic system daily to calculate water loss via transpiration.
- Sampling:
- Water: Collect water samples at defined intervals (e.g., T~0~, 24h, 72h, 1 week).
- Plant Tissue: At experiment termination, carefully separate roots from shoots. Rinse, weigh, and freeze-dry tissues for analysis.
- Sample Analysis:
- Water Samples: Use SPME fibers to extract volatile organics followed by GC-MS analysis [67]. For less volatile compounds, employ liquid-liquid extraction.
- Plant Tissues: Homogenize lyophilized tissues and extract contaminants using accelerated solvent extraction or sonication with organic solvents. Clean up extracts and analyze via LC-MS/MS or GC-MS.
- Data Calculation:
- Removal Percentage:
%(Removal) = (1 - C~t~/C~0~) * 100, where C~0~ and C~t~ are concentrations in plant-free controls at time zero and t. - Bioconcentration Factor (BCF):
BCF = C~plant~ / C~water~, where C~plant~ is the contaminant concentration in plant tissue (dry weight) and C~water~ is the average concentration in the solution during the exposure period.
- Removal Percentage:
Protocol 2: Sealed Chamber Assay for VOC Removal
This protocol is optimized for testing the removal kinetics of Volatile Organic Compounds (VOCs) from air by plants in a sealed environment, simulating indoor air remediation.
- Primary Objective: To determine the removal rate and efficiency of specific VOCs per unit leaf area for different plant species.
- Materials Required:
- Apparatus: Sealed glass or Teflon chambers of known volume.
- Plant Material: Potted plants of similar size and leaf area (e.g., Chlorophytum comosum, Dracaena fragrans) [67].
- Chemical Injection: Precision syringe for introducing VOC standards into the chamber.
- Air Sampling: SPME fibers for manual sampling or an automated air sampler coupled to a GC-MS.
- Step-by-Step Procedure:
- Preparation: Place a test plant with sealed soil surface (e.g., with aluminum foil) inside the chamber and seal it. For low-light conditions, wrap the chamber in opaque material [67].
- Dosing: Inject a known mass of a single VOC or a mixture into the chamber to achieve a target initial concentration.
- Incubation & Sampling: Let the chamber sit and periodically sample the headspace air using SPME fibers, which are then directly analyzed by GC-MS.
- Controls: Run identical chambers without plants (abiotic control) and with inert artificial plants to account for adsorption to surfaces and chamber walls.
- Data Analysis:
- Plot the natural logarithm of VOC concentration against time. The slope of the linear regression is the removal rate constant (k).
- Calculate the removal efficiency per leaf area:
Efficiency = (k~with plant~ - k~abiotic~) / Leaf Area.
Visualization of Pathways and Workflows
The following diagrams, generated using Graphviz DOT language, illustrate the core concepts and experimental workflows described in this document.
Contaminant Fate in Plant Systems
Diagram Title: Contaminant Fate in Plant Systems
VOC Chamber Assay Workflow
Diagram Title: VOC Chamber Assay Workflow
The Scientist's Toolkit: Research Reagent Solutions
Table 3: Essential Reagents and Materials for Plant-Based Contaminant Removal Research
| Item Name | Function / Application | Specific Examples / Notes |
|---|---|---|
| Analytical Standards & Surrogates | Quantifying specific contaminants via mass spectrometry; correcting for analyte loss during sample preparation. | Deuterated or ^13^C-labeled analogs of target compounds (e.g., Carbamazepine-d~10~, Diazepam-d~5~) are essential as internal standards [69]. |
| SPME Fibers | Solvent-free extraction and concentration of volatile organic compounds (VOCs) from air or water samples. | Used in sealed chamber assays for headspace sampling; compatible with GC-MS analysis [67]. |
| Hydroponic Nutrient Solutions | Supporting plant growth in soilless experimental systems, ensuring contaminant uptake is not confounded by soil adsorption. | Hoagland's solution or similar, maintaining essential macro and micronutrients for plant health. |
| Hybrid Poplar (Populus spp.) Cuttings | A model plant species for phytoremediation research due to fast growth, high transpiration rate, and documented efficacy. | Frequently used in field demonstrations for contaminants like TCE, BTEX, and atrazine [68]. |
| Common Indoor Houseplants | Screening for VOC removal efficiency and indoor air phytoremediation potential. | Species include Chlorophytum comosum (Spider Plant), Dracaena fragrans, and Crassula argentea (Jade Plant) [67]. |
| Hygroscopic Porous Polymers (HPPs) | Researching atmospheric water harvesting integrated with plant systems in closed environments like greenhouses. | Materials such as Super Moisture-Absorbent Gels (SMAG) or Metal-Organic Frameworks (MOFs) [40]. |
Within the context of closed-system research, the dynamic interplay between soil health and plant vitality is paramount for maintaining long-term stability. These systems, which focus on water recycling through plant transpiration, require meticulous assessment of the biological, chemical, and physical properties of soil, coupled with precise monitoring of plant physiological responses. The foundation of a resilient system lies in a healthy soil microbiome, which drives nutrient cycling and suppresses disease, thereby supporting sustained plant transpiration and growth with minimal external inputs [70] [71]. This document provides detailed application notes and standardized protocols for researchers to quantitatively track these interdependent parameters over time, ensuring the viability of closed agricultural ecosystems.
Application Notes: Core Principles and Quantitative Benchmarks
The Role of Soil Health in System Stability
Healthy soil is not merely a substrate but a living ecosystem that forms the foundation of a stable closed system. Its biological components are particularly crucial for nutrient cycling, disease suppression, and the maintenance of soil structure, which directly impacts water retention and availability to plants [70] [71]. In a closed system, where nutrients and water are recycled, fostering a robust and diverse soil microbiome is essential for long-term functionality. Key principles include:
- Minimizing Disturbance: Reducing tillage preserves microbial habitats and soil organic matter, which are critical for water retention and carbon sequestration [72] [73].
- Maintaining Living Roots: The presence of living roots through perennial crops or cover crops provides a continuous carbon source for soil microbes, sustaining their populations and activities [72] [73].
- Diversifying Inputs: Crop rotation and diverse cover crop mixes enhance microbial diversity, which in turn strengthens ecosystem resilience and nutrient cycling capacity [74] [72].
Monitoring Plant Vitality and Transpiration Dynamics
Plant transpiration is the central engine of water recycling in a closed system. Monitoring plant water use provides critical insights into system-level water fluxes and early indicators of plant stress. Transpiration is regulated by both atmospheric demand (vapor pressure deficit) and soil water supply, with stomatal closure being triggered by limitations in soil–plant hydraulic conductance during drying cycles [17]. Non-invasive techniques, such as optical dendrometry, allow for continuous, high-resolution tracking of plant water status and transpiration dynamics under non-limiting water conditions, providing valuable data for irrigation management and model parameterization [31].
Table 1: Key Soil Health Indicators for Long-Term Monitoring
| Indicator | Measurement Method | Significance in Closed Systems | Target/Desired Trend |
|---|---|---|---|
| Soil Organic Matter (SOM) | Loss-on-ignition [71] | Long-term carbon storage; enhances water retention [70] | >2%; increasing over time |
| Potentially Mineralizable Nitrogen (PMN) | Aerobic incubation [71] | Quantifies bioavailable N pool; can offset fertilizer needs [71] | >50 mg/kg; stable or increasing |
| Soil Respiration | CO₂ burst measurement [71] | Proxy for microbial activity and nutrient cycling rate [71] | >1.0 mg CO₂-C/g soil/day |
| Microbial Biomass Carbon | Chloroform fumigation-extraction [71] | Proxy for the abundance of active microbes [71] | Varies by soil type; increasing |
| Beta-Glucosidase Enzyme Activity | Fluorometric or colorimetric assay [71] | Indicates rate of carbon cycling and potential nutrient availability [71] | >100 μg PNP/g soil/h |
Table 2: Key Plant Vitality and Hydraulic Parameters
| Parameter | Measurement Method | Significance in Closed Systems | Target/Desired Trend |
|---|---|---|---|
| Transpiration Rate (Tr) | Gravimetric; Sap flow; Optical dendrometry [31] [17] | Direct measure of plant water use; driver of water recycling | Matches system evapotranspiration demand |
| Stomatal Conductance (gsw) | Porometer [17] | Indicates stomatal aperture and gas exchange efficiency | High under non-limiting water conditions [17] |
| Leaf Water Potential (ψleaf) | Scholander pressure chamber [31] | Integrated measure of plant water status | Maintains high (less negative) under ample water |
| Soil-Plant Hydraulic Conductance (Ksp) | Calculated from Tr, ψleaf, and ψsoil [17] | Indicates efficiency of water transport from soil to leaves | High and constant under moist soil [31] |
Experimental Protocols
Protocol 1: Assessing Biological Soil Health
Objective: To comprehensively evaluate the biological status of the soil microbiome and its functional capacity within a closed ecosystem.
Materials:
- Soil corer (2.5 cm diameter)
- Sterile sample bags and containers
- Cooler with ice packs
- -80°C freezer (for molecular analysis)
- Equipment for soil respiration system (e.g., IRGA)
- Reagents for PMN and enzyme activity assays [71]
Procedure:
- Sample Collection: Collect rhizosphere soil samples (soil closely adhering to roots) from a minimum of 5 random locations per experimental unit. For time-series studies, sample at consistent phenological stages (e.g., seedling, flowering, maturity). Combine sub-samples into a single composite sample. Place samples immediately on ice [74].
- Sample Processing: Sieve soil through a 2-mm mesh. Split into three aliquots: one for immediate analysis of fresh mass parameters (e.g., PMN), one for air-drying for chemical analysis, and one stored at -80°C for molecular biological analysis [71] [74].
- DNA Extraction and Sequencing: Extract genomic DNA from 0.25 g of soil using a commercial kit (e.g., FastDNA Spin Kit for Soil). Amplify the 16S rRNA gene (for bacteria) and ITS region (for fungi) and perform high-throughput sequencing (e.g., Illumina NovaSeq). Analyze data using QIIME2 to determine microbial abundance and diversity [74].
- Functional Assays:
- Soil Respiration: Incubate a 50 g soil sample at field capacity and 25°C. Measure evolved CO₂ over 24 hours using an infrared gas analyzer (IRGA). Report as mg CO₂-C per kg soil per day [71].
- Potentially Mineralizable Nitrogen (PMN): Conduct a 7-day anaerobic incubation at 40°C. Extract and analyze inorganic N (NH₄⁺-N and NO₃⁻-N) before and after incubation. PMN is the difference between the final and initial inorganic N concentrations [71].
- Beta-Glucosidase Activity: Measure using a colorimetric assay with p-nitrophenyl β-D-glucopyranoside as substrate. Incubate soil with substrate, then measure the release of p-nitrophenol spectrophotometrically [71].
Protocol 2: Monitoring Plant Transpiration and Hydraulics
Objective: To continuously monitor plant transpiration dynamics and diagnose hydraulic limitations in real-time.
Materials:
- Optical dendrometers (e.g., for leaf optical dendrometry) [31]
- Sap flow sensors (for larger plants)
- Scholander pressure chamber
- Porometer
- Data loggers
- Precision balance (for gravimetric measurement in pot studies) [31]
Procedure:
- Sensor Installation:
- Optical Dendrometry: Attach sensors to mature, sun-exposed leaves to continuously monitor leaf thickness or foliar width. Calibrate the relationship between the optical signal and leaf water potential (Ψleaf) using a pressure chamber on a subset of covered, non-transpiring leaves [31].
- Sap Flow: Install heat-ratio or thermal dissipation probes according to manufacturer instructions, ensuring good contact with the sapwood.
- Continuous Data Collection: Log data from all sensors (dendrometers, sap flow, microclimate stations for VPD) at 5-15 minute intervals.
- Discrete Physiological Measurements:
- Leaf Water Potential (Ψleaf): Periodically (e.g., pre-dawn and midday) collect covered leaf samples and measure Ψleaf using the Scholander pressure chamber [31].
- Stomatal Conductance (gsw): Measure on multiple leaves using a porometer concurrently with environmental data collection.
- Data Integration and Analysis:
- Calculate transpiration rate (Tr) from sap flow or gravimetrically. For optical dendrometry, derive Tr from the calibrated relationship and the rate of change of the optical signal, accounting for any observed time lags [31].
- Calculate whole-plant or soil-plant hydraulic conductance (Ksp) using the formula: Ksp = Tr / (Ψsoil - Ψleaf), where Ψsoil is the soil matric potential [17].
- Analyze the relationship between Tr and VPD to identify the breakpoint where stomatal regulation begins [17].
The Scientist's Toolkit: Research Reagent Solutions
Table 3: Essential Reagents and Materials for Soil-Plant System Research
| Item | Function/Application | Example Product/Kit |
|---|---|---|
| DNA Extraction Kit for Soil | Isolation of high-quality microbial genomic DNA for sequencing. | FastDNA Spin Kit for Soil [74] |
| 16S rRNA & ITS Primers | Amplification of bacterial and fungal genomic regions for metagenomic analysis. | 799F/1193R (16S); ITS1F/ITS2R (ITS) [74] |
| p-Nitrophenyl Substrate | Colorimetric assay for hydrolytic enzyme activities (e.g., Beta-Glucosidase). | p-nitrophenyl β-D-glucopyranoside [71] |
| Microbial Biostimulants | Soil amendments to introduce or stimulate specific beneficial microbial functions. | Bacillus consortia; algal amendments [74] [75] |
| Carbon-Rich Amendments | Provide a food source for native soil microbes to boost overall activity. | Molasses-based products (e.g., BIOZ Diamond) [72] |
| Hydraulic Conductance Tracers | Non-invasive dyes or isotopic labels for visualizing and quantifying water flow. | Deuterated water (²H₂O) |
| Optical Dendrometer | Non-invasive sensor for continuous monitoring of leaf/stem water status. | Commercially available leaf optical dendrometer [31] |
Visualization of System Relationships
Application Note: Market Context and Scaling Imperative
The transition of water recycling technologies from controlled laboratories to pilot-scale operational environments is occurring within a context of significant market growth and escalating water scarcity. The global closed-loop water recycling system market is projected to grow from $17.77 billion in 2024 to $38.77 billion by 2032, demonstrating a compound annual growth rate (CAGR) of 10.24% [76]. This expansion is fundamentally driven by a predicted 40% gap between global freshwater demand and supply by 2030 [77]. This application note details the protocols and scalability pathway for a specific technology: water recycling through plant-based transpiration in closed systems.
Table 1: Key Market and Scaling Drivers for Closed-Loop Water Systems
| Parameter | Laboratory Scale Context | Pilot/Industrial Scale Context | Data Source |
|---|---|---|---|
| System Cost | Low-cost materials (beakers, plastic bags, simple potometers) [41] [78] | High initial investment; major barrier for SMEs [79] [76] | Market Analysis Reports [79] [76] |
| Water Volume Processed | Milliliters to liters per day [41] [80] | 100,001+ liters per day for large-scale systems; data centers use up to 5 million gallons/day [76] [77] | Industry Reports [76] [77] |
| Primary End-Use Sectors | Fundamental research, education [41] [80] | Industrial (48% market share), Agriculture (25%), Mining (20%) [79] | Market Segmentation Data [79] |
| Key Scaling Technologies | Simple potometers, mass measurement [41] [78] | Advanced membrane filtration, AI-driven process optimization, IoT sensors [79] [76] | Technical & Market Literature [79] [76] |
Experimental Protocols for Laboratory-Scale Transpiration Analysis
Protocol: Gravimetric Method for Transpiration Rate Measurement
This protocol describes a simple, scalable method for measuring plant transpiration, adaptable from classroom to initial pilot environments [41].
Research Reagent Solutions & Essential Materials: Table 2: Key Materials for Gravimetric Transpiration Experiments
| Item | Function/Application |
|---|---|
| Small Bedding Plants (e.g., Begonia) | Model plant with thick, fleshy leaves suitable for experimentation [41]. |
| 250 mL Beakers | Container for plant root zone and water reservoir [41]. |
| Plastic Sandwich Bags & Tape | Creates a vapor barrier to prevent soil evaporation, isolating leaf transpiration [41]. |
| Analytical Balance | Measures mass loss (water transpired) with high precision [41]. |
| Environmental Chambers | Applies testable variables (light, wind, humidity) in a controlled manner [41]. |
Methodology:
- Plant Preparation: Place individual plants in small beakers and water thoroughly [41].
- Isolation of Transpiration: Seal the beaker top with a plastic sandwich bag, wrapped tightly around the plant stem and secured with tape. This ensures the only water loss pathway is through the plant's leaves [41].
- Initial Mass Measurement: Measure and record the initial mass of the entire setup (plant, beaker, water, bag) using an analytical balance [41].
- Application of Variables: Expose plants to test conditions for 24 hours. Standard variables include:
- Continuous Light: To stimulate photosynthesis and transpiration.
- Air Flow (Fan): To increase the vapor pressure gradient.
- High Humidity: Enclosure in a humidified bag to decrease the transpiration rate.
- Control: Maintained under normal, ambient conditions [41].
- Final Mass Measurement: After 24 hours, measure and record the final mass of each setup [41].
- Data Analysis: Calculate water loss: Initial Mass - Final Mass. Compare treatment results to the control to determine the effect of environmental factors on the transpiration rate [41].
Protocol: Potometer-Based Methods for Water Uptake Measurement
Potometers are traditional laboratory instruments used to measure the rate of water uptake by a plant shoot, which is assumed to be equivalent to the transpiration rate [78].
Methodology (Ganong's Potometer):
- Apparatus Setup: Fill the potometer completely with water, ensuring no air bubbles are present [78].
- Plant Stem Preparation: Underwater, cut a fresh, leafy twig and insert it through the rubber cork of the vertical tube. The underwater cutting prevents air from entering the xylem vessels [78].
- Sealing: Ensure all connections are airtight using sealing compounds [78].
- Air Bubble Introduction: Introduce a single air bubble into the horizontal graduated tube [78].
- Measurement: As the plant transpires, it draws water, moving the air bubble along the tube. Record the initial position of the bubble and its position after a set time (e.g., 1-2 hours) [78].
- Calculation: The distance traveled by the bubble is proportional to the volume of water transpired. The rate is expressed as volume per unit time per unit leaf area (e.g., mL/min/cm²) [78].
Advanced Laboratory Technique: Isotopic Analysis of Transpiration
Heavy water fractionation provides a sophisticated method for studying transpiration dynamics and their relationship to broader water cycles, relevant for validating system performance in closed-loop research [81].
Core Principle: During transpiration, water molecules containing heavier isotopes of oxygen (¹⁸O) and hydrogen (²H) are less likely to evaporate due to lower vapor pressure and diffusivity. This causes leaf water to become enriched with heavy isotopes relative to source water [81]. Application: The enrichment (Δe) can be modeled using the Craig-Gordon equation and is influenced by relative humidity and transpiration rate. Analysis of δ¹⁸O in plant organic matter can thus serve as a historical record of transpiration efficiency and stomatal conductance [81]. This technique is critical for tracing the path and efficiency of water recycling in a closed system over time.
Diagram 1: Isotopic analysis workflow for transpiration.
Scaling Pathway: From Laboratory to Pilot and Industrial Systems
The scalability of plant-based transpiration for water recycling faces significant challenges and requires integration with engineered systems. The following diagram and table outline the critical path and considerations for scaling.
Diagram 2: Scaling pathway for transpiration-based systems.
Table 3: Scalability Analysis Matrix for Transpiration-Based Water Recycling
| System Characteristic | Laboratory Scale | Pilot Scale | Industrial Scale |
|---|---|---|---|
| System Configuration | Single plant in beaker; simple potometer [41] [78] | Modular plant beds with recirculating hydrology; integration with basic filtration | Large-scale bioreactors or greenhouses fully integrated with advanced water treatment plants [77] |
| Primary Measurement | Gravimetric water loss; bubble movement in capillary [41] [78] | Continuous flow rate monitoring; IoT-based sensor arrays for mass, humidity, light [76] | Enterprise-level smart water management; real-time analytics for water quality and volume [76] |
| Data Output | Transpiration rate (mL/min/cm²) under controlled variables [41] | System efficiency metrics; plant health and treatment performance over time | Lifecycle cost analysis; return on investment; regulatory compliance reporting [79] [76] |
| Key Scaling Challenges | Isolating transpiration from evaporation; plant-to-plant variability [41] | Maintaining sterile root zones; preventing pathogen growth; scaling plant biomass | Massive water and nutrient delivery; harvesting biomass; high capital expenditure (CAPEX) [79] [76] |
| Integration with Engineered Systems | Not applicable | Pre-treatment of input water; post-treatment of condensed transpired water | Full integration with centralized or decentralized wastewater treatment and recycling infrastructure [82] [77] |
Scaling plant-based transpiration from laboratory models to operational environments requires addressing significant challenges in system integration, monitoring, and economic viability. The transition involves moving from simple gravimetric and potometer-based measurements to sophisticated, IoT-enabled monitoring systems that can operate at the scale of thousands of liters per day [76]. Successful implementation, as seen in adjacent sectors like data center cooling, demonstrates the feasibility of closed-loop water recycling, though these currently rely on engineered rather than biological systems [82] [77]. Future research must focus on optimizing plant selections for high transpiration rates, engineering scalable growth systems, and seamlessly integrating these biological components with advanced filtration technologies like reverse osmosis and membrane bioreactors to create robust, hybrid closed-loop systems for sustainable water recycling.
Conclusion
The integration of plant transpiration into closed-system water recycling presents a robust, biologically driven solution for sustainable water management. The foundational science confirms that transpiration is not merely a passive process but an optimizable function, governed by stomatal behavior and environmental feedbacks. Methodological advancements enable the precise engineering of these systems, while targeted troubleshooting ensures their stability and efficiency. Validation through comparative analysis demonstrates a clear potential for significant water recovery and purification, with parallel benefits for contaminant management. For biomedical and clinical research, these systems offer a model for developing highly controlled, bio-regenerative environments. Future directions should focus on the selection and genetic engineering of ideal plant species, the integration of smart IoT controls for fully autonomous operation, and the exploration of these systems for managing specific pharmaceutical or organic waste streams in research facilities, ultimately closing the loop on water use in the most resource-sensitive settings.
References
- 1. What Are the Causes Behind Global Plant Transpiration ... [https://cid-inc.com/blog/what-are-the-causes-behind-global-plant-transpiration-trends/]
- 2. Effects of environmental variables on canopy transpiration ... [https://www.sciencedirect.com/science/article/pii/S219756202500051X]
- 3. How Do Stomatal Traits and Transpiration Efficiency Impact ... [https://cid-inc.com/blog/how-do-stomatal-traits-and-transpiration-efficiency-impact-crop-yield/]
- 4. Provenance differences and factors influencing ... [https://www.frontiersin.org/journals/plant-science/articles/10.3389/fpls.2025.1515534/full]
- 5. ASC scientists have unified disparate transpiration theories ... [https://asc.illinois.edu/uncategorized/asc-scientists-unified-disparate-transpiration-theories-into-one-framework/]
- 6. Projected runoff declines from plant physiological effects ... [https://www.nature.com/articles/s44221-024-00361-z]
- 7. A stomatal optimization model adopting a conservative ... [https://www.sciencedirect.com/science/article/abs/pii/S0022169422015013]
- 8. Stomatal responses of terrestrial plants to global change [https://www.nature.com/articles/s41467-023-37934-7]
- 9. Growth before photosynthesis: How trees regulate their ... [https://www.sciencedaily.com/releases/2025/05/250513112306.htm]
- 10. A stomata imaging and segmentation pipeline incorporating ... [https://pmc.ncbi.nlm.nih.gov/articles/PMC12613397/]
- 11. Next-generation water-saving strategies for greenhouses ... [https://pmc.ncbi.nlm.nih.gov/articles/PMC11873180/]
- 12. Effect of transpiration on plant accumulation and ... [https://www.sciencedirect.com/science/article/abs/pii/S0269749115000032]
- 13. Chamber‐based system for measuring whole‐plant ... [https://pmc.ncbi.nlm.nih.gov/articles/PMC10168032/]
- 14. Regulation of transpiration water age by plant root-rock ... [https://egusphere.copernicus.org/preprints/2025/egusphere-2025-4366/]
- 15. Experiment 2: Whole-plant transpiration response at dawn [https://bio-protocol.org/exchange/minidetail?id=10068408&type=30]
- 16. The role of light intensity in water transport and ... [https://www.sciencedirect.com/science/article/abs/pii/S0098847224003010]
- 17. Transpiration response to soil drying versus increasing ... [https://pmc.ncbi.nlm.nih.gov/articles/PMC10474596/]
- 18. The transpiration rate sensitivity to increasing evaporative ... [https://www.sciencedirect.com/science/article/pii/S2667064X24001593]
- 19. Effects of Light Quality and Intensity on Diurnal Patterns and ... [https://pmc.ncbi.nlm.nih.gov/articles/PMC5994434/]
- 20. The Plant-Transpiration Response to Vapor Pressure Deficit ... [https://pmc.ncbi.nlm.nih.gov/articles/PMC6341309/]
- 21. Plants for water recycling, oxygen regeneration and food ... [https://pubmed.ncbi.nlm.nih.gov/11537696/]
- 22. Does Light Spectrum Alter Plant Transpiration Rates? [https://www.cannabissciencetech.com/view/does-light-spectrum-alter-plant-transpiration-rates]
- 23. Frontiers | Constant hydraulic supply and ABA dynamics facilitate the... [https://www.frontiersin.org/journals/plant-science/articles/10.3389/fpls.2023.1140938/full]
- 24. (PDF) Integrated metabolic strategy: A framework for predicting the... [https://www.academia.edu/39394938/Integrated_metabolic_strategy_A_framework_for_predicting_the_evolution_of_carbon_water_tradeoffs_within_plant_clades]
- 25. Revealing seasonal plasticity of whole-plant hydraulic ... - HESS [https://hess.copernicus.org/articles/29/3975/2025/]
- 26. The water cycle in closed ecological systems: Perspectives ... [https://www.sciencedirect.com/science/article/abs/pii/S0273117709003871]
- 27. How Improving Transpiration Efficiency in Crops Boosts Yield [https://cid-inc.com/blog/how-improving-transpiration-efficiency-in-crops-boosts-yield/]
- 28. Plant functional assemblages as indicators of the resilience ... [https://www.sciencedirect.com/science/article/pii/S1470160X16305556]
- 29. Transpiration efficiency: insights from comparisons of C4 ... [https://pmc.ncbi.nlm.nih.gov/articles/PMC8272567/]
- 30. Plant species richness and functional traits ... - PubMed Central [https://pmc.ncbi.nlm.nih.gov/articles/PMC4843697/]
- 31. A new technique for monitoring plant transpiration under ... [https://www.sciencedirect.com/science/article/abs/pii/S0168192323000229]
- 32. Quality assessment of plant transpiration water [https://ntrs.nasa.gov/citations/19900062246]
- 33. Rivers to reservoirs : hydrological drivers control reservoir function... [https://link.springer.com/article/10.1007/s10750-018-3532-0]
- 34. Understanding WCAG 2 Contrast and Color Requirements [https://webaim.org/articles/contrast/]
- 35. Data Analysis for Hydrology [https://www.field-studies-council.org/resources/16-18-geography/water-and-carbon/hydrology/data-analysis/]
- 36. Methods for Measuring Water Status and Reducing ... [https://auf.isa-arbor.com/content/13/2/56]
- 37. PlantRing: A high-throughput wearable sensor system for ... [https://pmc.ncbi.nlm.nih.gov/articles/PMC12143137/]
- 38. Structure Data for Analysis [https://help.tableau.com/current/pro/desktop/en-us/data_structure_for_analysis.htm]
- 39. Measuring and Modeling Tree Stand Level Transpiration [https://research.fs.usda.gov/treesearch/6221]
- 40. Next-generation water-saving strategies for greenhouses ... [https://www.nature.com/articles/s41467-025-57388-3]
- 41. Transpiration Made Simple! [https://www.amybrownscience.com/2012/04/transpiration-made-simple.html]
- 42. Easy Transpiration Experiment for Kids [https://littlebinsforlittlehands.com/easy-transpiration-experiment-for-kids/]
- 43. Vapour pressure deficit control in relation to water transport ... [https://www.nature.com/articles/srep43461]
- 44. Systemic effects of rising atmospheric vapor pressure ... [https://pmc.ncbi.nlm.nih.gov/articles/PMC8251766/]
- 45. 华南植物园揭示全球陆表大气实际水汽压增速减缓的现象和原因 [http://www.gzb.cas.cn/kyj/202401/t20240120_6959849.html]
- 46. Understanding and Exploiting Transpiration Response to ... [https://pmc.ncbi.nlm.nih.gov/articles/PMC9127727/]
- 47. Root-zone oxygen supply mitigates waterlogging stress in ... [https://www.sciencedirect.com/science/article/abs/pii/S0981942825002724]
- 48. Root-zone oxygen supply mitigates waterlogging stress in ... [https://pubmed.ncbi.nlm.nih.gov/40088584/]
- 49. Pathogens and Disease [https://www.agrowtronics.com/6-common-problems-in-hydroponics-and-how-to-fix-them/pathogens-and-disease/]
- 50. 10 Common Hydroponic Problems (and How To Fix Them ... [https://nosoilsolutions.com/common-issues-hydroponic-gardeners-face/]
- 51. Is It Better To Irrigate Light And Frequent Or Deep ... [https://www.usga.org/course-care/water-resource-center/our-experts-explain--water/is-it-better-to-irrigate-light-and-frequent-or-deep-and-infreque.html]
- 52. Optimization of irrigation scheduling using crop–water ... [https://www.frontiersin.org/journals/agronomy/articles/10.3389/fagro.2024.1376231/full]
- 53. Optimizing irrigation strategies for sustainable crop ... [https://www.sciencedirect.com/science/article/abs/pii/S0301479723022570]
- 54. Recycling nutrients from organic waste for growing higher ... [https://www.sciencedirect.com/science/article/pii/S2214552423000639]
- 55. Whole plant transpiration responses of common bean ... [https://www.sciencedirect.com/science/article/pii/S0981942825002876]
- 56. Unraveling the genetic mechanisms of waterlogging stress ... [https://bmcplantbiol.biomedcentral.com/articles/10.1186/s12870-025-07510-w]
- 57. Energy Efficiency for Water Utilities | US EPA [https://www.epa.gov/sustainable-water-infrastructure/energy-efficiency-water-utilities]
- 58. Water Recycling in 2025: Hidden Facts & Future Insights [https://susbio.in/water-recycling-in-2025/]
- 59. Water Reuse: What Plant Water Management Should ... [https://genesiswatertech.com/blog-post/water-reuse-what-plant-managers-should-know-in-2025/]
- 60. Water Recycling Rate [https://kpidepot.com/kpi/water-recycling-rate]
- 61. Urban Water Recycling Rate [https://kpidepot.com/kpi/urban-water-recycling-rate]
- 62. What KPIs and Analytics Are Used on a Water Treatment ... [https://www.inetsoft.com/info/water-treatment-plant-dashboard/]
- 63. Water Quality Improvement Efforts [https://kpidepot.com/kpi/water-quality-improvement-efforts]
- 64. Comparative analysis of soil and water dynamics in ... [https://www.frontiersin.org/journals/agronomy/articles/10.3389/fagro.2025.1552425/full]
- 65. Soilless Agricultural Systems: Opportunities, Challenges ... [https://www.mdpi.com/2311-7524/11/6/568]
- 66. Rapid return of water from ground to atmosphere through ... [https://www.sciencedaily.com/releases/2025/01/250109183329.htm]
- 67. Investigation of simultaneous volatile organic compound ... [https://pmc.ncbi.nlm.nih.gov/articles/PMC10483372/]
- 68. Phytotransformation [https://www.hawaii.edu/abrp/Technologies/phytran.html]
- 69. Effect of Transpiration on Plant Accumulation and ... [https://pmc.ncbi.nlm.nih.gov/articles/PMC4337387/]
- 70. Caring for the Soil : The Foundation of Healthy Growth - Unimother Plant [https://unimother.de/blogs/mindset/caring-for-the-soil-the-foundation-of-healthy-plant-growth]
- 71. Biological Soil | Ohioline Health [https://ohioline.osu.edu/factsheet/anr-0205]
- 72. : Practical Strategies for Soil - Health Agricultural Success Long Term [https://icl-growingsolutions.com/en-us/agriculture/knowledge-hub/soil-health-practical-strategies-for-long-term-agricultural-success/]
- 73. How to Improve Long - Term on Your Farm Soil Health [https://www.farmbrite.com/post/how-to-improve-long-term-soil-health-on-your-farm]
- 74. Long-term garlic‒maize rotation maintains the stable garlic ... [https://pmc.ncbi.nlm.nih.gov/articles/PMC11562493/]
- 75. Measuring the water savings from innovative soil health ... [https://azwaterinnovation.asu.edu/measuring-water-savings-innovative-soil-health-solutions-arizona-farms]
- 76. Water Recycle and Reuse Market Size & Forecast Report ... [https://www.snsinsider.com/reports/water-recycle-and-reuse-market-5719]
- 77. Water Conservation And Reuse For Data Centers [https://www.wateronline.com/doc/water-conservation-and-reuse-for-data-centers-0001]
- 78. Experiments on Transpiration in Plants | Botany [https://www.biologydiscussion.com/experiments/transpiration-in-plants/experiments-on-transpiration-in-plants-botany/57387]
- 79. Closed-Loop Water Recycling System Charting Growth ... [https://www.archivemarketresearch.com/reports/closed-loop-water-recycling-system-432128]
- 80. Just Breathe Green: Measuring Transpiration Rates - Activity [https://www.teachengineering.org/activities/view/usf_stormwater_lesson02_activity1]
- 81. Heavy Water Fractionation during Transpiration - PMC [https://pmc.ncbi.nlm.nih.gov/articles/PMC1761995/]
- 82. National Water Reuse Action Plan: Quarterly Update [https://www.epa.gov/waterreuse/national-water-reuse-action-plan-quarterly-update]