Non-Enzymatic H2O2 Sensors for Plant Science: A Comprehensive Guide to Design, Application, and Future Directions
This article provides a comprehensive resource for researchers and scientists on the design and application of non-enzymatic electrochemical sensors for detecting hydrogen peroxide (H2O2) in plant systems.
Non-Enzymatic H2O2 Sensors for Plant Science: A Comprehensive Guide to Design, Application, and Future Directions
Abstract
This article provides a comprehensive resource for researchers and scientists on the design and application of non-enzymatic electrochemical sensors for detecting hydrogen peroxide (H2O2) in plant systems. It covers the foundational role of H2O2 as a key signaling molecule in plant stress responses and development. The content explores the latest advancements in nanomaterial-based sensor designs, including metal oxides, noble metals, and carbon nanocomposites, detailing their operational mechanisms and fabrication. A practical guide to sensor optimization, troubleshooting common pitfalls, and validating performance in complex plant matrices is included. Finally, the article synthesizes these insights to discuss the current challenges and future potential of these sensors in advancing our understanding of plant physiology and improving agricultural biotechnology.
Understanding H2O2 in Plant Biology and the Case for Non-Enzymatic Sensing
Hydrogen peroxide (H₂O₂) is a crucial reactive oxygen species (ROS) that exhibits a dual function in plant physiology, acting as both a vital signaling molecule and a damaging oxidative agent. This duality depends primarily on its concentration, temporal patterns, and subcellular localization within plant tissues [1] [2]. At physiological concentrations, H₂O₂ regulates essential processes including growth, development, stress acclimation, and programmed cell death [3]. However, when accumulation exceeds cellular antioxidant capacity, H₂O₂ causes oxidative damage to proteins, lipids, and DNA, ultimately impairing cellular functions [1].
Understanding this delicate balance requires precise measurement techniques. Non-enzymatic electrochemical sensors represent a promising technological advancement for real-time, quantitative H₂O₂ detection in plant systems [4]. Unlike enzyme-based sensors, these platforms offer enhanced stability, cost-effectiveness, and operational flexibility, making them particularly suitable for prolonged experiments in complex plant environments [4] [5]. This application note explores the dual role of H₂O₂ in plants and provides detailed protocols for investigating its functions using advanced sensing technologies.
The Dual Nature of Hydrogen Peroxide in Plant Biology
H₂O₂ as an Essential Signaling Messenger
Hydrogen peroxide functions as a key signaling molecule in various physiological processes due to its relative stability, ability to diffuse through aquaporins, and capacity to oxidize specific target proteins [1] [6]. Normal aerobic metabolism in cellular compartments such as chloroplasts, mitochondria, and peroxisomes continually produces H₂O₂ through processes including photosynthetic and respiratory electron transport chains [1] [3].
Key signaling functions include:
- Growth and Development: H₂O₂ mediates seed germination, root system architecture, cell cycle progression, and flowering [3]. In maize coleoptiles, H₂O₂ participates in auxin-mediated elongation growth, influencing both cell wall loosening and stiffening processes [7].
- Stress Acclimation and Priming: Pre-exposure to low H₂O₂ concentrations primes plants against subsequent abiotic stresses, including salinity, drought, chilling, and heavy metal toxicity [1] [6]. This priming effect enhances the capacity of the antioxidant system, leading to improved stress tolerance [6].
- Systemic Signaling: H₂O₂ propagates long-distance signals, alerting systemic tissues to mount coordinated defense responses against environmental challenges [6].
The signaling capacity of H₂O₂ depends on its spatial and temporal dynamics, which are tightly regulated by the plant's antioxidant system and integrated with other signaling pathways involving calcium, nitric oxide, and phytohormones [1] [3].
H₂O₂ as an Agent of Oxidative Stress
When environmental stressors such as high light, heavy metals, or extreme temperatures disrupt cellular homeostasis, H₂O₂ can accumulate to toxic levels [1] [8]. This excessive accumulation overwhelms the antioxidant defense system, leading to oxidative stress.
Detrimental effects include:
- Biomolecule Damage: Elevated H₂O₂ oxidizes proteins, lipids, and nucleic acids, causing enzyme inactivation, membrane damage through lipid peroxidation, and DNA strand breaks [1] [7].
- Cellular Function Impairment: Oxidative damage significantly impacts vital metabolic processes, particularly photosynthesis. In Egeria densa, combined high light and iron stress reduced chlorophyll content, photosystem II efficiency (Fv/Fm), and shoot growth rate [8].
- Programmed Cell Death: At critically high levels, H₂O₂ can trigger programmed cell death pathways, a process that, while sometimes beneficial for overall plant survival, leads to localized tissue damage [3].
Table 1: Physiological Effects of H₂O₂ in Plants Under Different Conditions
| Physiological Process | H₂O₂ Role | Observed Effect | Plant Species | Reference |
|---|---|---|---|---|
| Seed Germination | Signaling | Increased protein carbonylation and MAPK expression | Pisum sativum | [3] |
| Coleoptile Elongation | Inhibitory | Restriction of auxin and fusicoccin-induced growth | Zea mays | [7] |
| Abiotic Stress Priming | Protective | Induced tolerance to salt, chilling, and heavy metals | Various crops | [1] [6] |
| Photosynthetic Function | Destructive | Reduced chlorophyll content and PSII efficiency | Egeria densa | [8] |
Quantitative H₂O₂ Dynamics in Plant Stress Responses
Understanding H₂O₂ fluctuations under varying environmental conditions is crucial for deciphering its signaling versus toxic roles. Research on submerged macrophyte Egeria densa revealed distinct H₂O₂ variation patterns in response to light intensity and iron concentration [8].
Table 2: H₂O₂ Accumulation in Egeria densa Under Different Light and Iron Conditions
| PAR Intensity (μmol m⁻² s⁻¹) | Fe Concentration (mg L⁻¹) | H₂O₂ Level | Chlorophyll Content | Growth Rate | Antioxidant Response |
|---|---|---|---|---|---|
| 30 (Low) | 0.5 | Low | Maintained | Normal | Balanced |
| 100 (Moderate) | 3-5 | Gradual Increase | Slight Reduction | Slightly Reduced | Increased CAT/APX |
| 200 (High) | 7-10 | Sharp Peak then Decline | Significant Reduction | Strongly Inhibited | Declining CAT/APX |
| 200 (High) | 10 | Low | Severely Reduced | Ceased | Antioxidant system suppressed |
Diurnal monitoring revealed that H₂O₂ concentrations follow PAR intensity, with peak levels occurring in the afternoon despite similar morning light levels. This suggests a lag in antioxidant activity (CAT and APX), providing a dynamic window for H₂O₂ signaling [8].
The concentration threshold governing H₂O₂'s dual role is exceptionally context-dependent. In priming experiments, effective H₂O₂ concentrations ranged from 0.05 μM to 200 mM, varying with application method, plant species, and developmental stage [6]. For instance, tomato seedling roots treated with 1 mM H₂O₂ for one hour gained chilling tolerance, while Vigna radiata seedlings required 200 mM spraying for protection [6].
H₂O₂ Signaling Pathways and Molecular Interactions
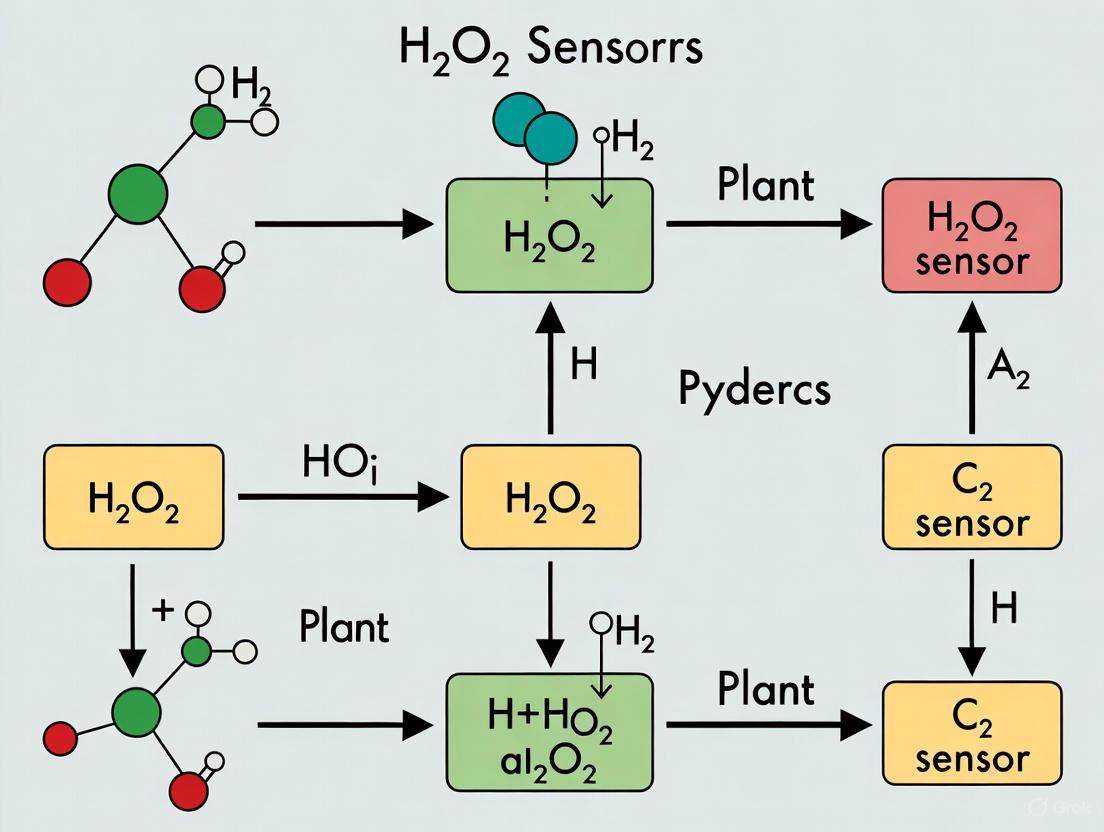
Hydrogen peroxide does not function in isolation but is integrated into complex signaling networks involving other molecules, hormones, and proteins. The following diagram illustrates key H₂O₂ signaling pathways in plant stress responses and development:
Pathway Components and Interactions:
- H₂O₂ Production and Sensing: Stressors activate ROS production in various organelles. Apoplastic H₂O2 can activate the HPCA1 receptor, triggering calcium influx [6].
- Calcium and Kinase Signaling: Calcium spikes amplify ROS production through NADPH oxidases, creating a positive feedback loop. H₂O2 directly mediates oxidative signaling through activation of mitogen-activated protein kinase (MAPK) cascades [1] [6].
- Antioxidant Activation: The enzymatic antioxidant system including catalase (CAT), ascorbate peroxidase (APX), and peroxidase (POD) is activated to regulate H₂O₂ levels [1] [8].
- Transcriptional Reprogramming: Redox-sensitive transcription factors and phosphatase inhibition lead to changes in gene expression patterns, ultimately determining physiological outcomes ranging from acclimation to programmed cell death [1].
Crosstalk with phytohormones such as abscisic acid (ABA), jasmonic acid (JA), and salicylic acid (SA) further fine-tunes these responses, creating a sophisticated signaling network that integrates multiple environmental and developmental cues [1] [3].
Experimental Protocols for H₂O₂ Research in Plants
Protocol: Measuring H₂O₂-Mediated Growth Responses in Maize Coleoptiles
Background: This protocol assesses the effect of exogenous H₂O₂ on auxin-induced elongation growth, a key process governed by the "acid growth" theory [7].
Materials:
- Maize coleoptile segments (7 cm length)
- Hydrogen peroxide solutions (25 mM and 50 mM)
- Indole-3-acetic acid (IAA, 10 μM)
- Fusicoccin (FC, 1 μM)
- Incubation medium (control)
- Precision growth measurement apparatus
- pH meter and membrane potential measurement system
- Malondialdehyde (MDA) and catalase activity assay kits
Procedure:
- Plant Material Preparation: Pre-incubate maize coleoptile segments for 1 hour in control medium with or without H₂O₂ (25 mM and 50 mM).
- Growth Induction: Transfer segments to media containing IAA (10 μM) or FC (1 μM). Maintain control segments in untreated medium.
- Growth Measurement: Record elongation kinetics every 3 minutes over 6 hours using precision measurement apparatus.
- pH Monitoring: Simultaneously measure apoplast pH changes in the incubation medium.
- Membrane Potential Assessment: Record changes in cell membrane potential using appropriate electrodes.
- Oxidative Stress Assessment: Quantify lipid peroxidation by measuring MDA content and determine catalase activity as an antioxidant response indicator.
- Data Analysis: Compare growth rates, pH acidification patterns, and oxidative stress markers between treatments.
Applications: This protocol is ideal for investigating crosstalk between H₂O₂ and plant hormone signaling pathways, particularly in the context of growth regulation under stress conditions.
Protocol: Non-Enzymatic Electrochemical Sensing of H₂O₂ in Plant Tissues
Background: This protocol details the use of rhodium-modified glassy carbon electrode (Rh/GCE) for sensitive H₂O₂ detection in complex plant samples [9].
Materials:
- Glassy carbon electrode (GCE, 3 mm diameter)
- Rhodium chloride (RhCl₃·nH₂O)
- Phosphate buffer saline (PBS, 0.1 M, pH 7.0)
- Electrochemical workstation with standard three-electrode system
- Plant tissue homogenates
- H₂O₂ standard solutions (5-1000 μM)
Procedure:
- Electrode Modification: Clean and polish GCE surface to mirror finish. Electrochemically deposit Rh nanoparticles from RhCl₃ solution using cyclic voltammetry or constant potential deposition.
- Sensor Characterization: Validate modified electrode (Rh/GCE) performance in standard H₂O₂ solutions using amperometry at -0.1 V (vs. Ag/AgCl).
- Calibration: Generate standard curve by measuring current response to H₂O₂ standards (5-1000 μM).
- Sample Preparation: Homogenize plant tissue in PBS buffer (pH 7.0) and centrifuge to remove debris. Keep samples on ice to prevent H₂O₂ degradation.
- H₂O₂ Measurement: Transfer supernatant to electrochemical cell and record amperometric response at -0.1 V.
- Quantification: Calculate H₂O₂ concentration in samples using the standard curve.
- Validation: Verify method accuracy with standard addition techniques.
Applications: This sensing approach enables real-time monitoring of H₂O₂ fluctuations in plant tissues under various stress conditions, providing insights into redox signaling dynamics.
The Scientist's Toolkit: Essential Reagents and Materials
Table 3: Key Research Reagents for H₂O₂ Studies in Plant Systems
| Category/Reagent | Function/Application | Examples/Specifications | Reference |
|---|---|---|---|
| Chemical Priming Agents | Induce cross-stress tolerance | H₂O₂ (0.05 μM - 200 mM depending on application) | [6] |
| Electrochemical Sensors | H₂O₂ detection and quantification | Rh-modified GCE; CeO₂-phm/cMWCNTs/SPCE | [9] [5] |
| Antioxidant Assay Kits | Measure ROS-scavenging capacity | Catalase, APX, GPX, GR activity assays | [1] [8] |
| Oxidative Stress Markers | Assess oxidative damage | Lipid peroxidation (MDA), protein carbonylation kits | [7] [8] |
| Signal Transduction Modulators | Investigate signaling pathways | NADPH oxidase inhibitors, Ca²⁺ channel blockers, MAPK inhibitors | [1] [6] |
| Growth Regulators | Study H₂O₂-hormone crosstalk | Auxin (IAA), Fusicoccin (FC) | [7] |
Advanced Sensing Technologies for H₂O₂ Monitoring
Non-enzymatic electrochemical sensors represent a significant advancement in H₂O₂ detection technology for plant research. These sensors address limitations of traditional enzymatic platforms, including high cost, poor stability, and environmental sensitivity [4]. Recent developments include:
Porous Ceria Hollow Microspheres (CeO₂-phm): This nanomaterial features a high specific surface area (168.6 m²/g) and uniform pore distribution, creating numerous active catalytic sites for H₂O₂ detection [5]. When incorporated into screen-printed carbon electrodes (CeO₂-phm/cMWCNTs/SPCE), it demonstrates exceptional sensitivity (2070.9 μA·mM⁻¹·cm⁻²) and a low detection limit (0.017 μM) [5].
Rhodium-Modified Glassy Carbon Electrodes (Rh/GCE): This sensor platform operates at a low applied potential (-0.1 V), minimizing interference from other electroactive species in complex plant samples [9]. It offers a wide linear range (5-1000 μM), excellent reproducibility (RSD = 3.2%), and successful application in real sample matrices [9].
The following diagram illustrates the integration of sensing technologies with plant H₂O₂ research applications:
These sensing technologies enable researchers to capture dynamic H₂O₂ fluctuations with high temporal and spatial resolution, providing unprecedented insights into redox signaling networks in plants.
Why Move Beyond Enzymatic Sensors? Limitations of Stability, Cost, and Complex Immobilization
In plant physiology research, the accurate detection of hydrogen peroxide (H₂O₂) is paramount. As a key reactive oxygen species (ROS), H₂O₂ acts as a central signaling molecule in plant growth, development, and stress response pathways. However, its dynamic fluctuations and often low concentrations in complex plant matrices demand highly reliable, sensitive, and stable sensing platforms. While enzymatic sensors have been widely used, their inherent limitations present significant obstacles for advanced plant science applications, particularly for long-term or in-field studies. This application note details the core limitations of enzymatic H₂O₂ sensors and provides validated protocols for transitioning to more robust non-enzymatic alternatives, specifically tailored for a research program focused on non-enzymatic H₂O₂ sensor design for plant applications.
Critical Limitations of Enzymatic H₂O₂ Sensors
Enzymatic biosensors, typically based on enzymes like horseradish peroxidase (HRP), rely on the intrinsic specificity of a biological receptor. Despite their historical prevalence, they suffer from several fundamental drawbacks that limit their application in rigorous research environments.
Operational and Storage Instability
The biological nature of enzymes makes them intrinsically fragile. Their catalytic activity is highly dependent on the surrounding environment, and they are prone to denaturation under suboptimal conditions.
- Denaturation by Environmental Stressors: Enzymes can lose their tertiary and secondary structures—and thus their function—when exposed to external stressors such as extreme pH, high temperatures, organic solvents, or high salinity [10]. This is a critical concern in plant research, where sap pH or soil conditions can vary.
- Temporal Degradation: The activity of immobilized enzymes decreases over time, even under ideal storage conditions, leading to a short shelf-life and requiring frequent sensor recalibration [11].
High Cost and Complex Production
The economic and logistical burden of enzymatic sensors is non-trivial.
- Expensive Enzyme Purification: The processes involved in enzyme extraction, purification, and preparation are time-consuming and expensive, contributing significantly to the final cost of the biosensor [11].
- Costly Support Materials: Ideal solid supports for stable enzyme immobilization (e.g., certain Agaroses) are often expensive, further driving up costs [10].
Challenges in Enzyme Immobilization
The process of attaching an enzyme to a transducer surface is a critical yet challenging step that directly impacts sensor performance.
- Leakage and Weak Binding: Simple adsorption techniques, which rely on weak forces (van der Waals, ionic bonds, hydrogen bonds), are prone to enzyme leakage from the support, especially under shifting pH or ionic strength [10].
- Complex and Damaging Covalent Binding: While covalent bonding creates a more stable complex, it is a more complex process. It requires multi-step surface activation with linkers like glutaraldehyde and carries a high risk of enzyme denaturation during chemical modification. Crucially, if the functional groups involved in the covalent bond formation are part of the enzyme's active site, activity can be lost entirely [10].
- Diffusion Limitations: The immobilization matrix itself can create a physical barrier, slowing the diffusion of the H₂O₂ substrate to the enzymatic active site and reducing the sensor's response time and efficiency [12].
Table 1: Quantitative Comparison of Enzymatic vs. Non-Enzymatic H₂O₂ Sensor Characteristics
| Characteristic | Enzymatic Sensors | Non-Enzymatic Sensors |
|---|---|---|
| Stability | Low; susceptible to denaturation by temperature, pH, and solvents [11] [10] | High; maintains activity under harsh conditions [4] |
| Lifetime | Short (days to weeks) [11] | Long (months to years) [4] |
| Cost | High (expensive enzymes and pure supports) [11] [10] | Low (abundant nanomaterials) [4] [9] |
| Immobilization | Complex; risk of leakage or active site damage [10] | Simpler; one-step electrodeposition or drop-casting possible [9] |
| Sensitivity | High, but degrades over time | High and stable [4] [9] |
| Shelf Life | Limited | Excellent |
Protocol: Fabrication of a Rhodium Nanoparticle-Based Non-Enzymatic H₂O₂ Sensor
This protocol outlines the construction of a highly selective and stable electrochemical sensor for H₂O₂ detection, based on a rhodium-modified glassy carbon electrode (Rh/GCE), adapted from a recent study [9]. Its low working potential makes it suitable for complex matrices like plant extracts.
Research Reagent Solutions
Table 2: Essential Reagents and Materials for Sensor Fabrication
| Item | Function/Description | Specifications/Notes |
|---|---|---|
| Glassy Carbon Electrode (GCE) | Working electrode base | 3 mm diameter, polishable surface |
| Rhodium(III) Chloride Hydrate (RhCl₃·nH₂O) | Precursor for Rh nanoparticle electrodeposition | Analytical grade |
| Hydrochloric Acid (HCl) | Electrolyte for electrodeposition bath | For preparing 0.1 M RhCl₃ in 0.1 M HCl |
| Phosphate Buffered Saline (PBS) | Electrolyte for H₂O₂ sensing | 0.1 M, pH 7.0 |
| Hydrogen Peroxide (H₂O₂) | Target analyte | Prepare fresh standard solutions daily |
| Potassium Ferricyanide (K₃[Fe(CN)₆]) | Redox probe for electrode characterization | 5 mM in 0.1 M KCl |
Step-by-Step Experimental Procedure
Part A: Electrodeposition of Rhodium Nanoparticles on GCE
- Electrode Pretreatment: Polish the bare GCE sequentially with 1.0, 0.3, and 0.05 µm alumina slurry on a microcloth. Rinse thoroughly with double-distilled water between each polishing step and after the final polish.
- Electrochemical Cleaning: Place the polished GCE in a standard three-electrode cell containing 0.5 M H₂SO₄. Perform cyclic voltammetry (CV) between -0.2 V and +1.0 V (vs. Ag/AgCl) until a stable voltammogram is obtained, indicating a clean surface.
- Preparation of Deposition Bath: Prepare a solution of 0.1 M RhCl₃ in 0.1 M HCl.
- Nanoparticle Electrodeposition: Transfer the deposition bath to the electrochemical cell. Immerse the clean GCE. Using amperometry (i-t curve), apply a constant potential of -0.1 V (vs. Ag/AgCl) for a duration of 120 seconds under gentle stirring. A dark coating on the GCE surface indicates the successful formation of a Rh nanoparticle layer (Rh/GCE).
- Sensor Rinsing and Storage: Rinse the modified Rh/GCE gently with double-distilled water and allow it to air dry at room temperature. Store in a clean, dry environment when not in use.
Part B: Electrochemical Detection of H₂O₂
- Setup: Use the prepared Rh/GCE as the working electrode, along with a Pt wire counter electrode and an Ag/AgCl (3 M KCl) reference electrode in an electrochemical cell containing 10-15 mL of 0.1 M PBS (pH 7.0).
- Amperometric Measurement: Under constant stirring, apply a working potential of -0.1 V (vs. Ag/AgCl). Allow the background current to stabilize.
- Standard Additions: Sequentially add known, small volumes of a standard H₂O₂ stock solution to the PBS buffer. The final concentration of each addition should span the desired calibration range (e.g., 5 to 1000 µM).
- Data Recording: Record the steady-state current response after each addition. The reduction current will increase with each H₂O₂ addition.
- Calibration: Plot the recorded current (I) against the corresponding H₂O₂ concentration (C). The sensor typically exhibits a linear response, allowing for the determination of an unknown H₂O₂ concentration in a plant sample from its current response.
Application Note: Validating Sensor Performance in Plant Research
For plant researchers, validating sensor performance in a relevant matrix is crucial before deployment in complex biological experiments.
Interference Study
Plant tissues contain various electroactive compounds (e.g., ascorbic acid, dopamine, salts) that can potentially interfere with H₂O₂ measurement.
- Procedure: Perform amperometric measurements at -0.1 V (vs. Ag/AgCl) in PBS. After baseline stabilization, sequentially add potential interfering species (e.g., 100 µM ascorbic acid, 100 µM dopamine, 1 mM KCl, etc.) at concentrations expected in plant samples, followed by an addition of H₂O₂. The Rh/GCE sensor, due to its low working potential, shows high selectivity as most interferents do not undergo reduction at this potential [9].
Recovery Test in Plant Extract
This test assesses the accuracy of the sensor in a real plant matrix.
- Procedure:
- Prepare a crude extract from a model plant (e.g., Arabidopsis thaliana) by homogenizing tissue in PBS (pH 7.0) and centrifuging to remove debris.
- Split the extract into several aliquots.
- Spike these aliquots with known, varying concentrations of H₂O₂ standard.
- Measure the H₂O₂ concentration in each spiked sample using the calibrated Rh/GCE sensor and the standard addition method.
- Calculate the recovery percentage:
Recovery (%) = (Measured Concentration / Spiked Concentration) × 100%. A recovery rate close to 100% indicates high accuracy and minimal matrix effect. The reported Rh/GCE sensor achieved satisfactory recovery rates in complex cosmetic matrices, a promising indicator for plant applications [9].
The transition from enzymatic to non-enzymatic sensors represents a paradigm shift in H₂O₂ detection for plant research. The limitations of enzymatic sensors—namely, their instability, high cost, and complex immobilization requirements—are fundamentally addressed by nanomaterials-based platforms. The provided protocol for the Rh/GCE sensor exemplifies a path toward achieving highly stable, sensitive, and cost-effective H₂O₂ monitoring. Adopting these robust non-enzymatic designs is crucial for obtaining reliable, long-term data on H₂O₂ dynamics, thereby advancing our understanding of redox signaling in plant systems.
Hydrogen peroxide (H2O2) represents a crucial metabolite in aerobic organisms, playing dual roles in physiological processes and pathological effects [4]. As a prominent reactive oxygen species (ROS), H2O2 is generated through the incomplete reduction of molecular oxygen during cellular metabolism, possessing moderate reactivity and a relatively extended half-life that renders it the most stable molecule among ROS [4]. In plant systems, H2O2 functions as a key signaling molecule regulating processes such as growth, development, and stress responses, making its accurate detection essential for understanding plant physiology.
Electrochemical sensing platforms present distinct advantages for H2O2 monitoring in plant research, including operational simplicity, high sensitivity, cost-effectiveness, and easy miniaturization for in-field applications [4]. Unlike enzymatic sensors that suffer from structural instability, high cost, and environmental sensitivity, non-enzymatic electrodes offer enhanced stability, reproducibility, and tunable surface properties [4] [13]. The fundamental principles governing these sensors revolve around the direct electrochemical reduction or oxidation of H2O2 at catalytically active electrode surfaces, where electrode materials function to lower the activation energy of these reactions, thereby enhancing reaction kinetics and detection sensitivity [4].
Core Reaction Principles
Electrochemical Reduction of H2O2
The cathodic detection of H2O2 occurs through its electroreduction at the electrode surface. In acidic media, this process follows a two-electron, two-proton pathway:
H₂O₂ + 2e⁻ + 2H⁺ → 2H₂O [9]
Under alkaline conditions, the reduction mechanism proceeds as:
O₂ + H₂O + 2e⁻ → HO₂⁻ + OH⁻ [14]
The reduction pathway offers significant advantages for analytical applications, particularly when operated at working potentials around and below 0.0 V (vs. Ag/AgCl). This potential range from -0.2 V to 0.0 V is optimal for electroanalytical measurements because it minimizes or completely eliminates interference from electrochemically active compounds commonly present in complex sample matrices [9]. Furthermore, within this window, effective electroreduction of H₂O₂ occurs without interference from molecular oxygen (O₂), which only begins to reduce around -0.4 V [9].
Electrochemical Oxidation of H₂O₂
The anodic detection of H₂O₂ involves its direct oxidation at the electrode surface, following the reaction:
H₂O₂ → O₂ + 2H⁺ + 2e⁻ [9]
While this approach can be highly effective, it presents challenges for sensing in complex matrices like plant extracts, where electroactive species such as ascorbic acid, uric acid, and various phenolic compounds may undergo co-oxidation at similar potentials, leading to interference and false positive signals [9]. The oxidation pathway typically requires careful electrode design and material selection to achieve sufficient selectivity for practical applications.
Advanced Sensing Materials and Performance
The development of advanced nanomaterials has significantly enhanced the performance characteristics of non-enzymatic H₂O₂ sensors, enabling their application in complex plant research contexts.
Catalytic Material Classes
Carbon-based Materials: Carbon black, graphene nanoplatelets, and carboxylated multi-walled carbon nanotubes (cMWCNTs) provide high surface area, excellent electron transport properties, and intrinsic catalytic activity for H₂O₂ detection [15] [13]. Their surfaces can be functionalized to enhance selectivity and sensitivity.
Metal and Metal Oxide Catalysts: Rhodium nanoparticles demonstrate exceptional catalytic performance for H₂O₂ reduction, operating at low applied potentials (-0.1 V vs. Ag/AgCl) with high selectivity [9]. Ceria (CeO₂) hollow microspheres leverage excellent redox reversibility (Ce³⁺/Ce⁴⁺) and strong ROS scavenging ability for sensitive H₂O₂ detection [5]. Transition metal oxides like Fe₂O₃ and CuFe₂O₄, particularly when combined with conductive supports, offer strong catalytic behavior toward oxidation reactions [13].
Single-Atom Catalysts (SACs): Recent advances include single-atom Ni catalysts embedded in hierarchical carbon nanosheet arrays, which exhibit exceptional selectivity for the 2e⁻ oxygen reduction pathway to H₂O₂ with Faradaic efficiencies exceeding 90% [14]. These materials maximize atom utilization efficiency and provide uniform active sites.
Quantitative Performance Comparison
Table 1: Performance metrics of selected non-enzymatic H₂O₂ sensors
| Electrode Material | Linear Range (μM) | Detection Limit (μM) | Sensitivity | Applied Potential | Reference |
|---|---|---|---|---|---|
| CeO₂-phm/cMWCNTs/SPCE | 0.5 - 450 | 0.017 | 2070.9 μA·mM⁻¹·cm⁻² | -0.3 V (vs. Ag/AgCl) | [5] |
| Rh/GCE | 5 - 1000 | 1.2 | 172.24 μA·mM⁻¹·cm⁻² | -0.1 V (vs. Ag/AgCl) | [9] |
| Ni-SAC | N/A | N/A | N/A | Alkaline conditions | [14] |
| Fe₂O₃/CuFe₂O₄/GNPs | 5 - 13000 (glucose) | 0.049 (glucose) | 62.4 μA·mM⁻¹·cm⁻² (glucose) | -0.8 - 1.0 V (vs. Ag/AgCl) | [13] |
Table 2: Advantages and limitations of different electrode materials
| Material Class | Advantages | Limitations | Suitable Plant Applications |
|---|---|---|---|
| Carbon-based | Cost-effective, high stability, tunable surface chemistry | Moderate catalytic activity | Long-term in-situ monitoring, field deployment |
| Metal Oxides | Strong catalytic activity, biocompatibility, redox versatility | Variable electrical conductivity | Stress response studies, apoplastic fluid analysis |
| Noble Metals | High sensitivity, excellent conductivity, low operating potential | Higher cost, limited abundance | High-resolution spatial mapping, subcellular detection |
| Single-Atom Catalysts | Exceptional selectivity, maximal atom efficiency | Complex synthesis | Fundamental signaling studies, low-concentration detection |
Experimental Protocols
Protocol 1: Fabrication of Porous Ceria Hollow Microsphere (CeO₂-phm) Sensor
Principle: Solvothermal synthesis of CeO₂-phm with high specific surface area (168.6 m²/g) and uniform pore size (3.4 nm) for enhanced catalytic sites and electrolyte penetration [5].
Materials and Reagents:
- Cerium nitrate hexahydrate (Ce(NO₃)₃·6H₂O)
- Ethylene glycol (C₂H₆O₂)
- Glacial acetic acid (CH₃COOH)
- Carboxylated multi-walled carbon nanotubes (cMWCNTs)
- Screen-printed carbon electrodes (SPCE)
- Phosphate buffered saline (PBS, pH 7.0)
- Ethanol and deionized water
Procedure:
- Synthesis of CeO₂-phm: Dissolve 2.0 g cerium nitrate hexahydrate in 80 mL ethylene glycol under ultrasonic agitation until completely dissolved.
- Add 4 mL deionized water and 4 mL glacial acetic acid to the solution with vigorous stirring for 30 minutes to form a homogeneous precursor.
- Transfer the solution to a Teflon-lined stainless-steel autoclave and maintain at 180°C for 6 hours under static conditions.
- After natural cooling to ambient temperature, isolate the yellow precipitate by centrifugation.
- Wash the collected solid repeatedly with deionized water and ethanol to remove impurities.
- Dry the purified material at 80°C overnight to obtain the final CeO₂-phm powder.
- Electrode Modification: Prepare a homogeneous ink by dispersing CeO₂-phm and cMWCNTs in appropriate solvent.
- Drop-cast the suspension onto pre-cleaned SPCE and allow to dry under ambient conditions.
- The CeO₂-phm/cMWCNTs/SPCE sensor is ready for electrochemical characterization and H₂O₂ detection.
Validation: Characterize the material using FE-SEM, TEM, XRD, and BET analysis to confirm hollow microsphere structure, crystalline phase, and surface area [5].
Protocol 2: Electrodeposition of Rhodium Nanoparticle-Modified Electrode
Principle: Quick, one-step electrodeposition of Rh nanoparticles on glassy carbon electrode for highly selective H₂O₂ detection at low applied potential [9].
Materials and Reagents:
- RhCl₃·nH₂O
- Glassy carbon electrode (GCE, 3 mm diameter)
- Phosphate buffered saline (PBS, 0.1 M, pH 7.0)
- HCl
- H₂O₂ (30% stock solution)
- Platinum wire counter electrode
- Ag/AgCl (3 M KCl) reference electrode
Procedure:
- Electrode Pretreatment: Polish the GCE with alumina slurry (0.05 μm) on a microcloth to create a mirror finish.
- Rinse thoroughly with deionized water and subject to ultrasonic cleaning in ethanol and water for 1 minute each.
- Electrodeposition Solution: Prepare solution containing 0.5-5 mM RhCl₃ in 0.1 M HCl.
- Electrodeposition: Using a standard three-electrode system (GCE as working electrode, Pt wire counter electrode, Ag/AgCl reference), perform electrodeposition by cycling the potential between -0.5 V and +0.5 V at a scan rate of 50 mV/s for 10-20 cycles.
- Alternatively, use constant potential deposition at -0.2 V to -0.4 V for 30-120 seconds.
- Post-treatment: Rinse the modified electrode (Rh/GCE) thoroughly with deionized water to remove loosely adsorbed species.
- The Rh/GCE is now ready for H₂O₂ sensing applications.
Optimization Notes: The morphology and catalytic performance can be tuned by varying deposition parameters including concentration, potential, cycling number, and scan rate [9].
Protocol 3: Sensor Calibration and Real Sample Analysis
Principle: Amperometric calibration for quantitative H₂O₂ detection and application to plant tissue extracts.
Materials and Reagents:
- Prepared working electrode (CeO₂-phm/cMWCNTs/SPCE or Rh/GCE)
- H₂O₂ standard solutions (freshly prepared in appropriate buffer)
- Phosphate buffered saline (PBS, 0.1 M, pH 7.0) or other suitable electrolyte
- Plant tissue samples
Procedure:
- Electrochemical Setup: Configure standard three-electrode system with modified working electrode, Ag/AgCl reference electrode, and Pt counter electrode.
- Amperometric Detection: Apply optimal detection potential (-0.1 V to -0.3 V for reduction, +0.4 V to +0.7 V for oxidation) in stirred PBS solution.
- Allow the background current to stabilize before standard additions.
- Calibration: Make successive additions of H₂O₂ standard solution with continuous current recording.
- Plot steady-state current versus H₂O₂ concentration to generate calibration curve.
- Real Sample Analysis: For plant tissue analysis, homogenize tissue in appropriate buffer (e.g., potassium phosphate buffer, pH 6.5).
- Centrifuge the homogenate at 12,000 × g for 15 minutes at 4°C.
- Filter the supernatant through 0.45 μm membrane filter.
- Dilute the sample if necessary and analyze using standard addition method to account for matrix effects.
- Selectivity Validation: Test potential interfering compounds (ascorbic acid, glutathione, catecholamines, sugars) to confirm sensor selectivity.
The Scientist's Toolkit: Essential Research Reagents and Materials
Table 3: Essential research reagents and materials for non-enzymatic H₂O₂ sensor development
| Reagent/Material | Function/Application | Examples/Notes |
|---|---|---|
| Carbon Materials | Electrode substrate, catalytic activity, conductivity enhancement | Graphene nanoplatelets, carboxylated MWCNTs, carbon black (BP2000) [15] [13] |
| Metal Precursors | Source for catalytic nanoparticles and single-atom sites | RhCl₃, Ce(NO₃)₃·6H₂O, FeCl₃, CuCl₂·2H₂O [5] [9] |
| Electrode Supports | Platform for sensor fabrication | Glassy carbon electrode (GCE), screen-printed carbon electrode (SPCE) [5] [9] |
| Buffer Systems | Electrolyte for electrochemical measurements, pH control | Phosphate buffered saline (PBS, pH 7.0), HEPES buffer [9] |
| H₂O₂ Standards | Sensor calibration, performance validation | Freshly prepared from 30% stock, concentration verified by spectrophotometry [9] |
| Interference Compounds | Selectivity assessment | Ascorbic acid, uric acid, dopamine, glucose, glutathione [13] [9] |
Application in Plant Research
The implementation of non-enzymatic H₂O₂ sensors in plant research enables real-time monitoring of oxidative stress events, signaling dynamics, and defense responses. These sensors can be adapted for various applications including:
- Apoplastic H₂O₂ Monitoring: Detection of extracellular H₂O₂ production during pathogen challenge or abiotic stress
- Subcellular Resolution Studies: Miniaturized sensors for compartment-specific H₂O₂ dynamics
- Field-Deployable Systems: Robust sensors for in-situ monitoring of plant stress in agricultural settings
- High-Throughput Phenotyping: Multiplexed systems for screening plant varieties for stress tolerance
The exceptional sensitivity and selectivity of modern non-enzymatic sensors, particularly those operating at low reduction potentials, allows for accurate H₂O₂ quantification in complex plant matrices with minimal sample preparation [5] [9]. This capability provides significant advantages over traditional colorimetric or fluorometric methods that may suffer from interference or require extensive sample processing.
Non-enzymatic electrochemical sensors represent powerful tools for H₂O₂ detection in plant research, combining fundamental electrochemical principles with advanced materials science. The core reactions of H₂O₂ reduction and oxidation at engineered electrode surfaces provide the foundation for sensitive, selective, and robust sensing platforms. Continued development in this field focuses on enhancing sensitivity further, improving selectivity in increasingly complex matrices, enabling spatial and temporal resolution for dynamic plant signaling studies, and facilitating field deployment through miniaturization and integration with portable electronics. The convergence of fundamental electrochemistry with innovative nanomaterial design promises to unlock new capabilities for understanding H₂O₂'s diverse roles in plant physiology and stress responses.
Hydrogen peroxide (H₂O₂) represents a crucial reactive oxygen species in plant systems, functioning as a pivotal signaling molecule in physiological processes such as cell differentiation, proliferation, and apoptosis, while also contributing to oxidative stress responses at elevated concentrations [4]. The quantitative assessment of H₂O₂ dynamics in plant tissues presents significant analytical challenges due to its spatial and temporal heterogeneity, complex matrix effects, and intrinsic instability [4] [16]. Non-enzymatic electrochemical sensors have emerged as powerful tools for addressing these challenges, offering operational simplicity, high sensitivity, cost-effectiveness, and facile miniaturization for in planta measurements [4] [17]. This Application Note establishes the essential performance metrics—sensitivity, selectivity, limit of detection, and stability—for evaluating non-enzymatic H₂O₂ sensors within the specific context of plant studies, providing validated protocols for their systematic assessment.
Key Performance Metrics for Plant H₂O₂ Sensors
Quantitative Performance Benchmarks from Recent Literature
Table 1: Performance metrics of advanced non-enzymatic H₂O₂ electrochemical sensors relevant to plant studies.
| Sensor Architecture | Sensitivity (μA mM⁻¹ cm⁻²) | Limit of Detection (μM) | Linear Range (μM) | Stability/Repeatability | Ref. |
|---|---|---|---|---|---|
| Ag-CeO₂/Ag₂O/GCE | 2,728 | 6.34 | 0.01 - 500 | >95% (4 weeks) | [17] |
| CeO₂-phm/cMWCNTs/SPCE | 2,161.6 | 0.017 | 0.5 - 450 | RSD = 2.1% (n=5) | [5] |
| PtNP/Poly(Brilliant Green)/SPCE | 178.9 (H₂O₂) 17.4 (OHPs) | 0.29 (H₂O₂) 1.2 (CumOOH) | 1-5000 (H₂O₂) 5-1500 (CumOOH) | RSD = 3.8% (n=10) | [18] |
Defining and Contextualizing Core Metrics for Plant Applications
Sensitivity quantifies the electrochemical current response per unit concentration of H₂O₂, normalized to the electrode surface area. For plant applications where H₂O₂ fluxes can be subtle, high sensitivity enables detection of physiologically relevant concentration changes. The exceptional sensitivity demonstrated by cerium oxide-based sensors (Table 1) stems from their high surface area and abundant oxygen vacancies that facilitate H₂O₂ redox reactions [17] [5].
Selectivity refers to a sensor's ability to respond exclusively to H₂O₂ amidst competing electroactive species in plant matrices (e.g., ascorbate, glutathione, phenolic compounds, organic hydroperoxides). Nanomaterial engineering strategies include using metal oxides with specific catalytic properties [17] and employing selective potentials that distinguish H₂O₂ from organic hydroperoxides [18].
Limit of Detection (LOD) defines the lowest H₂O₂ concentration statistically distinguishable from background noise, typically calculated as 3σ/slope (where σ is the standard deviation of the blank signal). The sub-micromolar LODs achieved by advanced sensors (Table 1) are critical for monitoring baseline H₂O₂ fluctuations in plant signaling [5].
Stability encompasses both operational stability (consistent performance during continuous measurement) and storage stability (retained functionality over time). This is paramount for extended plant experiments where sensor recalibration may be impractical. The robust stability of metal oxide-based sensors derives from their inorganic nature, resisting denaturation and fouling that plague enzymatic biosensors [4] [17].
Experimental Protocols for Metric Validation
Sensor Fabrication and Characterization Protocol
Table 2: Essential research reagents and materials for sensor fabrication and validation.
| Category/Item | Function/Application | Example Specifications |
|---|---|---|
| Electrode Materials | ||
| Screen-printed carbon electrodes (SPCEs) | Disposable, customizable sensor substrates | 3-electrode system, carbon working electrode |
| Glassy carbon electrodes (GCE) | Polished surface for modified electrode fabrication | 3 mm diameter, mirror finish |
| Nanomaterials Synthesis | ||
| Cerium nitrate hexahydrate | Cerium source for CeO₂ synthesis | ≥99.9% purity, precursor for solvothermal synthesis |
| Silver nitrate | Silver doping agent for nanocomposites | ≥99.9%, enables enhanced electron transfer |
| Carboxylated MWCNTs | Conductive backbone for composite sensors | OD: 10-20 nm, length: 10-30 μm, -COOH functionalized |
| Electrochemical Characterization | ||
| Phosphate buffered saline (PBS) | Electrolyte for electrochemical measurements | 0.1 M, pH 7.0-7.4, provides physiological ionic strength |
| Hydrogen peroxide solution | Primary analyte for sensor calibration | 30% w/w, diluted fresh daily for standard curves |
| Interferent solutions | Selectivity assessment | Ascorbic acid, uric acid, dopamine, glucose (0.1-1 mM each) |
Procedure:
Sensor Fabrication:
- Synthesize porous ceria hollow microspheres (CeO₂-phm) via solvothermal method: Dissolve 2.0 g Ce(NO₃)₃·6H₂O in 80 mL ethylene glycol, add 4 mL deionized water and 4 mL glacial acetic acid, then heat at 180°C for 6 h in Teflon-lined autoclave [5].
- Prepare sensor ink: Disperse 2 mg CeO₂-phm and 1 mg carboxylated multi-walled carbon nanotubes (cMWCNTs) in 1 mL ethanol/water (1:1) mixture with 30 min ultrasonication.
- Drop-cast 5 μL ink onto pre-cleaned SPCE/GCE surface and dry under ambient conditions.
Structural Characterization:
- Perform field-emission scanning electron microscopy (FE-SEM) to verify porous morphology and uniform coating.
- Conduct X-ray diffraction (XRD) to confirm crystalline structure and phase purity.
- Analyze surface composition via X-ray photoelectron spectroscopy (XPS), specifically monitoring Ce³⁺/Ce⁴⁺ ratio.
Electrochemical Characterization:
- Record cyclic voltammograms in 0.1 M PBS (pH 7.4) from -0.8 V to +0.8 V (vs. Ag/AgCl) at 50 mV/s scan rate, both with and without H₂O₂ additions.
- Perform amperometric i-t measurements at optimal detection potential (typically -0.2 V to +0.6 V depending on material) with successive H₂O₂ additions under continuous stirring.
Figure 1: Sensor fabrication and validation workflow.
Comprehensive Performance Validation Protocol
Sensitivity and LOD Determination:
- Prepare H₂O₂ standard solutions (0.01 μM to 1 mM) in 0.1 M PBS (pH 7.4) fresh daily.
- Record amperometric response at optimal detection potential with successive standard additions.
- Plot steady-state current versus H₂O₂ concentration and perform linear regression.
- Calculate sensitivity from slope of linear region normalized to geometric electrode area.
- Determine LOD as 3×SDblank/slope, where SDblank is standard deviation of buffer response.
Selectivity Assessment:
- Measure amperometric response to 10 μM H₂O₂ (physiological signaling concentration).
- Sequentially add potential interferents at 5-10× higher concentrations than expected in plant samples:
- 100 μM ascorbic acid
- 100 μM glucose
- 50 μM uric acid
- 50 μM dopamine
- 50 μM glutathione
- Calculate interference as % signal change relative to H₂O₂ response. <5% interference is generally acceptable.
Stability Evaluation:
- Operational Stability: Measure amperometric response to fixed H₂O₂ concentration (e.g., 50 μM) every 30 minutes over 8 hours of continuous operation.
- Storage Stability: Measure initial response, then store sensors in dry, dark conditions at 4°C. Re-test response to same H₂O₂ concentration at 3, 7, 14, and 28 days.
- Repeatability: Test 5 independently fabricated sensors with identical composition on same H₂O₂ concentration; calculate relative standard deviation (RSD).
Application to Plant Systems: Special Considerations
Adaptation for Complex Plant Matrices
Plant tissues present unique challenges including high concentrations of endogenous antioxidants, cell wall components, secondary metabolites, and varying pH microenvironments. Sensor validation must therefore include tests with actual plant extracts or in planta measurements [16] [19]. The genetically encoded fluorescent sensor HyPer7 has been successfully employed for intracellular H₂O₂ measurements in plant cells, demonstrating the feasibility of real-time, subcellular monitoring despite not being electrochemical [19]. For electrochemical sensors, incorporating protective membranes (Nafion) or surface modifiers can mitigate fouling from plant phenolics and proteins.
Figure 2: H₂O₂ measurement logic in plant stress studies.
In Planta Validation Using Fluorescent Sensors
While this Application Note focuses on electrochemical sensors, validation against established fluorescent methods provides crucial corroboration:
- Express genetically encoded H₂O₂ sensors (e.g., HyPer7) in target plant tissues [19].
- Apply identical stimuli to plant material while performing parallel measurements with electrochemical and fluorescent sensors.
- Correlate temporal dynamics and relative magnitude of H₂O₂ changes detected by both methods.
- Account for differences in spatial resolution and response kinetics between methodologie.
The rigorous quantification of sensitivity, selectivity, limit of detection, and stability establishes the foundation for reliable H₂O₂ measurement in plant systems using non-enzymatic electrochemical sensors. The exceptional performance of advanced nanomaterials like porous ceria hollow microspheres and silver-doped cerium oxide nanocomposites demonstrates significant progress toward meeting the demanding requirements of plant research [17] [5]. Future developments should focus on increasing sensor robustness against plant-specific interferents, achieving subcellular spatial resolution through miniaturization, and validating sensor performance across diverse plant species and tissues. Standardized implementation of the protocols outlined herein will enable meaningful cross-comparison of sensor performance and more accurate quantification of H₂O₂ dynamics in plant stress signaling, development, and redox biology.
Designing and Fabricating Robust Non-Enzymatic H2O2 Sensors for Plant Applications
Hydrogen peroxide (H₂O₂) is a crucial reactive oxygen species in plant physiology, playing pivotal roles in signaling, defense responses, and abiotic stress adaptation. Accurate, real-time detection of H₂O₂ is therefore essential for advancing plant science research. Non-enzymatic electrochemical sensors have emerged as powerful tools for this purpose, offering superior stability, cost-effectiveness, and design flexibility compared to their enzyme-based counterparts. The performance of these sensors is fundamentally governed by the selected sensing nanomaterial. This application note provides a detailed comparison of three prominent nanomaterial categories—metal oxides, noble metals, and carbon allotropes—for the development of non-enzymatic H₂O₂ sensors tailored for plant research applications.
Performance Comparison of Nanomaterials
The table below summarizes the key electrochemical performance metrics of various nanomaterials used in non-enzymatic H₂O₂ sensing, providing a basis for material selection.
Table 1: Performance Metrics of Selected Nanomaterials for H₂O₂ Sensing
| Material Category | Specific Material | Sensitivity (µA mM⁻¹ cm⁻²) | Linear Range (µM) | Detection Limit (µM) | Key Advantages |
|---|---|---|---|---|---|
| Metal Oxides | Porous CeO₂ Hollow Microspheres [5] | 2161.6 | 0.5 - 450 | 0.017 | Ultra-high sensitivity, wide linear range, excellent stability |
| NiO Octahedrons/3D Graphene [20] | 117.26 | 10 - 33,580 | 5.3 | Very wide linear range, good selectivity | |
| CeO₂ (Plasma-printed) [21] | ~1.03* | Not Specified | Not Specified | Binder-free, flexible, wearable sensor platform | |
| CeO₂-MnO₂/CNF Composite [22] | Not Specified | Not Specified | Not Specified | Multifunctional (energy storage & sensing), synergistic effects | |
| Noble Metals | Rhodium Nanoparticles/GCE [9] | 172.24 | 5 - 1000 | 1.2 | High selectivity at low potential, excellent for complex matrices |
| Carbon Allotropes | N-rich Graphitic Carbon (PAN-based) [23] | 2.54* | Not Specified | 0.609 | Cost-effective, metal-free, high nitrogen content for catalysis |
Note: Sensitivity values marked with an asterisk () are reported in µA/µM/cm² or µA cm⁻² mM⁻¹ and are presented as in the original source.*
Detailed Experimental Protocols
Protocol 1: Synthesis of Porous CeO₂ Hollow Microspheres (CeO₂-phm) for High-Sensitivity Sensing
This protocol outlines the solvothermal synthesis of highly sensitive CeO₂-phm, adapted from a recent study [5].
Principle: A one-pot solvothermal method using cerium nitrate and ethylene glycol results in porous hollow microspheres with a high surface area, enhancing catalytic sites and mass transport for superior H₂O₂ detection.
Materials:
- Cerium Precursor: Cerium(III) nitrate hexahydrate (Ce(NO₃)₃·6H₂O)
- Solvent and Reducing Agent: Ethylene Glycol (C₂H₆O₂)
- Additives: Glacial Acetic Acid (CH₃COOH)
- Washing Solvents: Deionized Water, Ethanol
Procedure:
- Precursor Preparation: Dissolve 2.0 g of Ce(NO₃)₃·6H₂O in 80 mL of ethylene glycol under ultrasonic agitation until fully dissolved.
- Mixture Formulation: Add 4 mL of deionized water and 4 mL of glacial acetic acid to the solution. Stir vigorously for 30 minutes to achieve a homogeneous mixture.
- Solvothermal Reaction: Transfer the solution into a 100 mL Teflon-lined stainless-steel autoclave. Seal and maintain at 180°C for 6 hours in a laboratory oven.
- Product Recovery: After natural cooling to room temperature, collect the yellow precipitate by centrifugation.
- Purification: Wash the precipitate repeatedly with deionized water and ethanol to remove ions and organic residues.
- Drying: Dry the purified product in an oven at 80°C overnight to obtain the final CeO₂-phm powder.
Characterization: The resulting material should be characterized by FE-SEM and TEM to confirm the hollow spherical morphology, XRD for crystalline phase, and BET analysis for surface area and pore size distribution (expected surface area >150 m²/g) [5].
Protocol 2: Preparation of a Flexible Sensor via Plasma-Assisted Printing of CeO₂
This protocol describes a novel printing technique for fabricating flexible H₂O₂ sensors, ideal for non-invasive plant monitoring [21].
Principle: An atmospheric plasma jet aerosolizes and activates nanoparticle suspensions, enabling direct, binder-free deposition of metal oxides onto flexible substrates at low temperatures.
Materials:
- Nanoparticles: Cerium Oxide (CeO₂) Nanoparticles
- Substrate: Commercial Carbon-based Screen-Printed Electrodes (SPEs)
- Suspension Medium: Deionized Water
Procedure:
- Ink Preparation: Prepare an aqueous suspension of CeO₂ nanoparticles at a concentration of 10 mg/mL.
- Substrate Preparation: Clean the working electrode area of the SPEs.
- Plasma Printing Setup: Use a plasma stream composed of 95% Argon and 5% Hydrogen.
- Deposition: Directly deposit the CeO₂ suspension onto the working electrode at a print speed of 30 mm/min. A plasma voltage of 24 kV is recommended for optimal CeO₂ sensing performance.
- Processing: Maintain constant other parameters (plasma frequency: 30 kHz, mist level: 45%, printhead-substrate distance: 1 mm). A single print pass is sufficient.
Characterization: Electrochemical performance should be validated via Cyclic Voltammetry (CV) and amperometric H₂O₂ detection. Sensor flexibility can be tested under bending conditions.
Protocol 3: Electrochemical Characterization and H₂O₂ Sensing
This standard protocol is used to evaluate the performance of the fabricated sensor [20] [9].
Principle: The sensor's catalytic activity towards H₂O₂ reduction is measured amperometrically at a fixed potential, providing data on sensitivity, linear range, and detection limit.
Materials:
- Electrolyte: Phosphate Buffered Saline (PBS, 0.1 M, pH 7.4)
- Analyte: Hydrogen Peroxide (H₂O₂) standard solutions of varying concentrations
- Equipment: Potentiostat with a standard three-electrode system (fabricated sensor as Working Electrode, Ag/AgCl as Reference Electrode, Pt wire as Counter Electrode)
Procedure:
- Sensor Preparation: Immerse the modified working electrode in a stirred PBS solution (0.1 M, pH 7.4).
- Applied Potential: Apply a constant optimal reduction potential (e.g., -0.1 V vs. Ag/AgCl for Rh/GCE [9]).
- Baseline Stabilization: Allow the background current to stabilize.
- Standard Additions: Sequentially add aliquots of H₂O₂ stock solution to the cell to achieve desired concentrations, recording the current response after each addition.
- Data Analysis: Plot the steady-state current against H₂O₂ concentration. The slope of the linear fit gives the sensitivity. The limit of detection (LOD) is typically calculated as 3σ/S, where σ is the standard deviation of the blank signal and S is the sensitivity.
The Scientist's Toolkit: Essential Research Reagents and Materials
Table 2: Key Reagent Solutions for H₂O₂ Sensor Fabrication and Testing
| Reagent/Material | Function/Application | Key Notes |
|---|---|---|
| Cerium Nitrate Hexahydrate | Cerium source for synthesis of CeO₂ nanostructures [5]. | High-purity grade recommended for reproducible morphology. |
| Ethylene Glycol | Solvent and mild reducing agent in solvothermal synthesis [5]. | Serves dual purpose in forming porous hollow structures. |
| Polyacrylonitrile (PAN) | Precursor for nitrogen-rich graphitic carbon fibers [23]. | Imparts inherent nitrogen doping for enhanced electrocatalysis. |
| Rhodium Chloride (RhCl₃) | Precursor for electrodeposition of Rh nanoparticle catalysts [9]. | Provides high selectivity at low operating potentials. |
| Carboxylated MWCNTs | Conductive scaffold in composite electrodes [5]. | Enhances electron transfer; carboxyl groups aid material adhesion. |
| Screen-Printed Electrodes (SPEs) | Disposable, customizable platform for sensor fabrication [21] [5]. | Ideal for flexible and point-of-care device development. |
| Phosphate Buffered Saline (PBS) | Standard electrolyte for electrochemical testing (pH 7.4). | Mimics physiological conditions; crucial for baseline performance. |
Workflow and Schematic Diagrams
CeO₂-phm Sensor Fabrication and Testing Workflow
Non-Enzymatic H₂O₂ Sensing Mechanism on a Metal Oxide Surface
Hydrogen peroxide (H2O2) is a crucial reactive oxygen species (ROS) that plays dual roles in plant physiology, functioning as a key signaling molecule in normal processes such as defense responses and cell differentiation, while also inducing oxidative stress and cellular damage at elevated concentrations [4] [24]. The accurate monitoring of H2O2 in plant systems is therefore essential for understanding stress responses, immune activation, and developmental programming. Non-enzymatic electrochemical sensors have emerged as powerful tools for this purpose, overcoming the limitations of enzymatic sensors which include poor reproducibility, environmental instability, and high cost [25] [26]. The integration of advanced nanocomposites has been pivotal in enhancing sensor performance by leveraging synergistic effects between constituent materials, resulting in improved sensitivity, selectivity, and stability for plant science applications [4] [24].
Nanocomposite Materials for H2O2 Sensing
Material Classes and Synergistic Mechanisms
Advanced nanocomposites for H2O2 sensing typically combine multiple functional materials to create synergistic effects that surpass the capabilities of individual components. These composites can be categorized into several classes based on their constituent materials and operational mechanisms.
Table 1: Classes of Nanocomposites for H2O2 Sensing
| Material Class | Component Materials | Synergistic Effects | Key Sensing Parameters |
|---|---|---|---|
| Carbon-Metal Polymer Composites | Reduced Graphene Oxide-Polyaniline-Platinum Nanoparticles (rGO-PANI-PtNP) | Enhanced conductivity, increased active surface area, improved catalytic activity [25] | Expanded linear range, higher sensitivity, lower detection limit [25] |
| Metal Oxide Hybrids | Cu2O, Co3O4, NiO, CeO2 | Multiple oxidation states, enhanced electron transfer, structural stability [4] [26] | High sensitivity, excellent selectivity, good reproducibility [4] |
| Precious Metal Nanostructures | Au, Pt, Ag nanoparticles | Excellent conductivity, high electrocatalytic activity, surface plasmon resonance [26] [27] | Exceptional sensitivity, strong specificity, fast response [26] |
| Carbon-Metal Oxide Systems | CNT-metal oxide, Graphene-metal oxide | Large surface area, high conductivity, synergistic catalytic effects [4] [24] | Wide linear range, low detection limit, strong anti-interference ability [4] |
Representative Nanocomposite Performance
The performance of nanocomposite-based sensors has been extensively characterized through electrochemical analysis, revealing significant enhancements in key operational parameters compared to conventional electrodes.
Table 2: Performance Metrics of Representative Nanocomposites
| Nanocomposite | Linear Range | Sensitivity | Detection Limit | Stability | Reference |
|---|---|---|---|---|---|
| rGO-PANI-PtNP/GCE | Expanded range | Higher sensitivity | Lower detection limit | Outstanding reproducibility | [25] |
| Metal Oxide Nanostructures | Varies with material | Enhanced through nanostructuring | Sub-micromolar to nanomolar | Good to excellent | [4] |
| Gold Nanocomposites | Dependent on support material | Excellent with proper design | Low nanomolar range | Enhanced durability | [26] |
| Transition Metal Carbides | Wide operational range | High | Very low | Excellent chemical and thermal stability | [24] |
Experimental Protocols
Synthesis of rGO-PANI-PtNP Nanocomposite
Protocol 1: Fabrication of rGO-PANI-PtNP Modified Electrode
- Objective: To synthesize and characterize a water-soluble and stable rGO-PANI-PtNP nanocomposite for H2O2 sensing in plant extracts.
- Materials: Graphene oxide (GO), aniline monomer, chloroplatinic acid (H2PtCl6), phosphate buffer (pH 7.4), glassy carbon electrode (GCE), standard electrochemical cells.
- Procedure:
- GO-PANI Composite Synthesis: Utilize graphene oxide as a dopant for the synthesis of polyaniline (PANI) via in-situ chemical polymerization. This results in a water-soluble and stable GO-PANI composite [25].
- Electrochemical Reduction: Subject the GO-PANI composite to cyclic voltammetry (CV) to generate reduced GO-PANI (rGO-PANI), significantly enhancing the conductivity of the material [25].
- PtNP Electrodeposition: Electrodeposit platinum nanoparticles (PtNPs) onto the surface of the rGO-PANI-modified glassy carbon electrode using potential cycling or constant potential methods in a solution containing H2PtCl6 [25].
- Characterization: Perform transmission electron microscopy (TEM) and scanning electron microscopy (SEM) to confirm the formation of a three-dimensional structure with PtNPs (approximately 30 nm in diameter) decorated on the rGO-PANI surface [25].
- Electrochemical Activation: Activate the modified electrode by cycling in blank phosphate buffer until a stable CV is obtained.
Electrochemical Detection of H2O2
Protocol 2: Amperometric Detection of H2O2 in Plant Samples
- Objective: To quantitatively detect H2O2 in plant tissue extracts using the rGO-PANI-PtNP modified electrode.
- Materials: rGO-PANI-PtNP/GCE, plant tissue extracts, phosphate buffer (pH 7.4), H2O2 standards, electrochemical workstation with three-electrode system.
- Procedure:
- Electrode Setup: Configure a standard three-electrode system with rGO-PANI-PtNP/GCE as working electrode, Ag/AgCl as reference electrode, and platinum wire as counter electrode.
- Buffer Preparation: Prepare degassed 0.1 M phosphate buffer (pH 7.4) as the supporting electrolyte.
- Amperometric Measurement: Apply a constant detection potential (typically -0.2 V to 0 V vs. Ag/AgCl for H2O2 reduction) under continuous stirring.
- Calibration: Record the steady-state current response following successive additions of standard H2O2 solutions to establish a calibration curve.
- Sample Analysis: Add known volumes of diluted, filtered plant extract to the electrochemical cell and record the current response. Calculate H2O2 concentration using the calibration curve.
- Interference Test: Evaluate selectivity by testing the sensor response against common interferents in plant samples (e.g., ascorbic acid, uric acid, glucose) [25].
Characterization of Sensor Performance
Protocol 3: Comprehensive Electrochemical Characterization
- Objective: To evaluate the electrochemical properties and sensing performance of the nanocomposite-modified electrode.
- Materials: Nanocomposite-modified electrode, potassium ferricyanide, H2O2 standards, phosphate buffer solutions of varying pH.
- Procedure:
- Cyclic Voltammetry (CV): Record CV curves in 10 mM [Fe(CN)6]3- at scan rates ranging from 20-90 mV/s to investigate electron transfer kinetics and calculate the electroactive area using the Randles-Sevcik equation [25].
- Electrochemical Impedance Spectroscopy (EIS): Perform EIS in the same solution to determine charge transfer resistance (Rct) and confirm enhanced conductivity of the nanocomposite.
- CV in H2O2: Obtain CV curves in phosphate buffer with varying concentrations of H2O2 to observe electrocatalytic behavior and identify optimal working potential [25].
- Stability Assessment: Test the long-term stability by measuring the sensor response to a fixed H2O2 concentration over a period of days or weeks. Evaluate reproducibility across multiple independently prepared electrodes.
- pH Optimization: Study the effect of pH on sensor response to determine the optimal pH for H2O2 detection in plant samples.
The Scientist's Toolkit
Table 3: Essential Research Reagent Solutions for Nanocomposite H2O2 Sensor Development
| Reagent/Material | Function/Application | Notes & Considerations |
|---|---|---|
| Graphene Oxide (GO) | Precursor for conductive support; provides large surface area and functional groups for composite formation [25]. | Enhances water solubility and stability of composites; serves as mechanical support. |
| Polyaniline (PANI) | Conducting polymer matrix; improves biocompatibility and provides anchoring sites for nanoparticles [25]. | Limited conductivity at neutral pH; requires composite formation for enhanced performance. |
| Chloroplatinic Acid (H2PtCl6) | Precursor for platinum nanoparticle synthesis via electrodeposition [25]. | Catalyzes H2O2 reduction; decreases overvoltage for H2O2 detection. |
| Gold Nanoparticles | Alternative catalytic material for sensor fabrication; tunable optical and electrical properties [26] [27]. | Can be functionalized with various biomolecules; excellent conductivity and catalytic activity. |
| Metal Salt Precursors | Sources for metal oxide formation (e.g., Cu, Ni, Co salts) [4] [26]. | Enable formation of various nanostructures with multiple oxidation states for redox catalysis. |
| Phosphate Buffer Salts | Electrolyte for electrochemical measurements; maintains physiological pH conditions. | Critical for maintaining enzyme-like activity in non-enzymatic sensors; compatible with biological samples. |
Schematic Diagrams of Sensor Design and Operation
Diagram 1: Sensor fabrication workflow showing the stepwise development of the rGO-PANI-PtNP nanocomposite electrode.
Diagram 2: H2O2 role in plant biology and detection, illustrating the dual roles of H2O2 as a signaling molecule and stress indicator, and its detection by the nanocomposite sensor.
Application in Plant Research
The implementation of advanced nanocomposite sensors for H2O2 detection in plant research enables real-time monitoring of oxidative stress events during environmental challenges such as drought, pathogen attack, heavy metal exposure, and extreme temperatures [24]. These sensors facilitate the quantification of H2O2 fluctuations in various plant compartments including apoplastic fluid, leaf tissues, and root exudates. The exceptional sensitivity and selectivity of nanocomposite-based sensors allow for precise measurement of H2O2 dynamics without interference from other compounds commonly present in plant matrices, providing valuable insights into the spatial and temporal patterns of ROS signaling in plant defense mechanisms and acclimation responses [4] [24]. Furthermore, the stability and reproducibility of these sensors support long-term monitoring studies essential for understanding the role of H2O2 in plant growth, development, and adaptation to changing environmental conditions.
The in-situ monitoring of hydrogen peroxide (H2O2) in plants is crucial for understanding plant stress responses and defense mechanisms. Non-enzymatic electrochemical sensors offer significant advantages for this application, including improved stability, reduced cost, and simpler fabrication compared to their enzymatic counterparts. This protocol details three key fabrication methods—electrodeposition, hydrothermal synthesis, and drop-casting—for constructing non-enzymatic H2O2 sensors specifically designed for plant research applications. By providing standardized procedures and performance comparisons, this document serves as an essential resource for researchers developing robust sensing platforms for agricultural and plant science investigations.
Research Reagent Solutions
Table 1: Essential research reagents for non-enzymatic H2O2 sensor fabrication.
| Reagent | Function/Application | Example Specifications |
|---|---|---|
| Graphene Oxide (GO) | Conductive substrate; provides high surface area and electron transfer capability [28] [29] | Dispersion in water (e.g., 1.27 wt%) [29] |
| Silver Nitrate (AgNO₃) | Precursor for silver nanoparticle (AgNP) synthesis; provides electrocatalytic activity [30] [29] | ≥99% purity; 0.5 M solution [29] |
| Metal Nitrates | Precursors for metal oxide synthesis (e.g., CuO, NiO) [30] | Cu(NO₃)₂, Ni(NO₃)₂; ≥99% purity [30] |
| Chloroform | Solvent for dissolving polymeric sensing films [31] | Analytical grade [31] |
| Phosphate Buffered Saline (PBS) | Electrolyte for electrochemical testing and sensor operation [28] [29] | 10 mM concentration, pH 7.4 [28] |
| Sodium Citrate | Reducing and stabilizing agent in nanoparticle synthesis [29] | ≥99% purity [29] |
| Synperonic F 108 | Non-ionic surfactant template for nanoporous material synthesis [30] | Average Mn ~14,600 [30] |
Sensor Fabrication Methods and Protocols
Electrodeposition of Nanocomposites
Electrodeposition enables the controlled formation of conductive nanocomposites directly onto electrode surfaces. The following protocol describes the formation of a silver nanoparticle/reduced graphene oxide (AgNPs/rGO) nanocomposite on a glassy carbon electrode (GCE) for the non-enzymatic detection of H2O2 [29].
Step-by-Step Protocol:
- Electrode Pretreatment: Polish a bare glassy carbon electrode (GCE, 3 mm diameter) sequentially with 1.0, 0.3, and 0.05 µm alumina slurry on a polishing cloth. Rinse thoroughly with deionized water, then sonicate in ethanol and deionized water for several minutes each. Allow the electrode to dry at room temperature [29].
- Nanocomposite Solution Preparation: Synthesize AgNPs/GO composite solution via a hydrothermal method [29].
- Mix 100 µL of 5 mM AgNO₃ with 300 µL of 12.7 mg/mL GO solution.
- Dilute the mixture with 2.6 mL ultrapure water and ultrasonicate for 30 minutes.
- Add this mixture to 17 mL of ultrapure water heated to 60°C under magnetic stirring.
- Add 14.8 mg of sodium citrate to the solution and continue stirring magnetically at 60°C for 2 hours. The color change indicates the formation of AgNPs/GO composites.
- Electrodeposition Process:
- Place the pretreated GCE into 5 mL of the AgNPs/GO composite solution within an electrochemical cell.
- Using a standard three-electrode system (GCE as working electrode, Ag/AgCl as reference, Pt wire as counter), apply a constant potential of -1.3 V for 600 seconds (10 minutes) [29].
- During this process, the GO is reduced to rGO, and the AgNPs/rGO nanocomposite is deposited onto the GCE surface, resulting in the AgNPs/rGO/GCE sensor.
Hydrothermal Synthesis of Trimetallic Composites
Hydrothermal synthesis is effective for creating crystalline metal oxide composites with high electrocatalytic activity. This protocol outlines the synthesis of a trimetallic CuO/Ag/NiO composite for use in non-enzymatic glucose sensing, illustrating a methodology applicable to H2O2 sensor design [30].
Step-by-Step Protocol:
- Gel Preparation: In a 100 mL beaker, dissolve 2 g of Cu(NO₃)₂ in 1.5 g of ultrapure water. Add this solution to 6 g of an aqueous suspension of Synperonic F 108 (15 wt%) [30].
- Addition of Metal Precursors: Introduce 2 g of AgNO₃ (dissolved in 1.5 g water) and 2 g of Ni(NO₃)₂ (dissolved in 1.5 g water) to the mixture [30].
- Stirring and Aging: Stir the combined mixture for 30 minutes until a homogeneous gel is formed. Age the resulting dark blue colored paste at ambient temperature for 120 hours (5 days) [30].
- Calcination: Transfer the aged gel to a furnace and calcine at 500°C for 5 hours with a controlled heating and cooling rate of 4.17 °C/min. This step removes the surfactant template and forms the final crystalline trimetallic oxide structure [30].
- Electrode Modification: Disperse 5 mg of the calcined CuO/Ag/NiO powder in 10 mL of ethanol via ultrasonication. Deposit 10 µL of this dispersion onto a pre-cleaned GCE and allow the solvent to evaporate at room temperature to create the modified sensor [30].
Automated Drop-Casting for Film Uniformity
Drop-casting is a simple method for film deposition, but its manual application lacks reproducibility. Automated drop-casting significantly improves film uniformity, which is critical for sensor performance and reliability [31].
Step-by-Step Protocol:
- Polymer Solution Preparation: Dissolve the sensing polymer material (e.g., Poly (methyl methacrylate) - PMMA) in chloroform at a concentration of 1 mg/mL. Stir the solution for 5 minutes to ensure complete dissolution [31].
- Substrate Preparation: Clean the substrate (e.g., gold electrode, QCM electrode) using an ultraviolet-ozone (UV/Ozone) chamber for 1 minute immediately before film deposition to remove organic contaminants [31].
- Automated System Setup: Implement an automated system by modifying a micropipette for motor-controlled operation. Optimize the system to deliver highly precise 2 µL droplets [31].
- Film Deposition: Program the automated system to deposit the polymer solution droplets directly onto the target electrode area.
- Solvent Evaporation: Allow the solvent to evaporate under controlled ambient conditions, forming a uniform polymeric sensing film. For high-viscosity polymers, multiple deposition cycles can be performed to achieve the desired film thickness [31].
Performance Comparison of Fabricated Sensors
Table 2: Quantitative performance data of non-enzymatic sensors for H2O2 and related analytes.
| Sensor Material | Fabrication Method | Analyte | Linear Range | Sensitivity | Detection Limit | Reference |
|---|---|---|---|---|---|---|
| AgNPs/rGO | Electrodeposition [29] | H₂O₂ | 5 μM – 620 μM | 49 μA mM⁻¹ cm⁻² | 3.19 μM | [29] |
| CuO/Ag/NiO | Hydrothermal & Drop-casting [30] | Glucose | 0.001 mM – 5.50 mM | 2895.3 μA mM⁻¹ cm⁻² | 0.1 μM | [30] |
| HRP/Cs-rGO Biohydrogel | Drop-casting (Manual) [28] | H₂O₂ | 0.1 μM – 4500 μM | N/R | 0.06 μM | [28] |
| COOH-GR–COOH-MWNT–AuNPs | Drop-casting (Manual) [32] | Glucose | 5 mM – 80 mM | N/R | N/P | [32] |
Abbreviations: N/R - Not Reported; N/P - Not Provided in the cited source.
Experimental Workflow and Signaling Context
The following diagram illustrates the integrated workflow for fabricating non-enzymatic sensors and their application in plant H2O2 monitoring.
The accurate detection of hydrogen peroxide (H₂O₂) is paramount in plant research, as it serves as a key signaling molecule in plant development and stress responses. Non-enzymatic electrochemical sensors present significant advantages for these measurements, including enhanced stability, longer operational lifespans, and reduced susceptibility to environmental conditions compared to their enzyme-based counterparts. This document provides detailed application notes and experimental protocols for the use of these sensors across three critical plant applications: sap analysis, tissue homogenates, and in-vivo monitoring, framed within a broader research context on sensor design.
Non-enzymatic H₂O₂ sensors leverage nanostructured materials to achieve high sensitivity, selectivity, and stability. The table below summarizes the performance characteristics of several advanced sensor designs relevant to plant research.
Table 1: Performance Metrics of Selected Non-enzymatic H₂O₂ Sensors
| Sensor Material & Architecture | Detection Limit | Linear Range | Sensitivity | Response Time | Key Advantages |
|---|---|---|---|---|---|
| PtNPs@Polyazure A [33] | 24.9 nM | Not specified | Not specified | < 2 seconds | Excellent stability (>12 h operation), ideal for real-time tracking in cell culture media |
| 3D Silver Rose-Flower Microstructures [34] | 0.4 µM | Not specified | 2.4 mA mM⁻¹ cm⁻² | Not specified | Outstanding long-term stability and high selectivity due to unique 3D morphology |
| Reduced Graphene Oxide (rGO) Overview [35] | Varies with functionalization | Varies with functionalization | Varies with functionalization | Not specified | High catalytic activity, mass scalability, and cost-effectiveness |
Application Notes and Protocols
Plant Sap Analysis
3.1.1 Application Context Plant sap analysis provides a "real-time snapshot" of nutrient availability within the plant's vascular system (xylem and phloem), offering the ability to detect nutritional imbalances weeks before visual symptoms appear [36] [37]. H₂O₂ sensors can be integrated into this framework to monitor oxidative stress levels correlated with nutrient deficiencies or abiotic stresses.
3.1.2 Key Reagent Solutions
Table 2: Essential Reagents for Plant Sap Analysis and H₂O₂ Sensing
| Reagent/Material | Function/Description |
|---|---|
| Linear Pressure Sap Extractor | Extracts sap from leaves without mastication, heat, or solvents, preserving analyte integrity [37]. |
| Chitosan Solution (0.5%) | A biopolymer matrix used to disperse and stabilize nanostructured sensor materials, preventing aggregation [34]. |
| Dicarboxylic Acids (e.g., Succinic Acid) | Acts as a structure-directing and capping agent in the synthesis of morphologically controlled silver nanostructures for sensing [34]. |
| Standard Nutrient Solutions | Used for calibrating sensor response against known concentrations of H₂O₂ in a matrix similar to plant sap. |
3.1.3 Workflow Diagram
Diagram 1: Sap analysis and sensing workflow.
Tissue Homogenates
3.2.1 Application Context The analysis of tissue homogenates involves grinding plant tissue into a uniform slurry, providing a cumulative overview of metabolites and nutrients. Non-enzymatic sensors are well-suited for detecting H₂O₂ in these complex matrices due to their robustness.
3.2.2 Experimental Protocol: Sensor Fabrication and Testing
Synthesis of Silver Rose-Flower Microstructures [34]:
- In an ice-water bath, mix 1 mL of 1 M AgNO₃ with 50 μL of 0.25 M succinic acid in 10 mL deionized water. Stir for 10 minutes.
- Rapidly add 1 mL of 1 M ascorbic acid (reducing agent) under vigorous stirring.
- Continue stirring for 15 minutes until the solution turns dark grey and precipitates form.
- Collect the precipitate, wash with deionized water, and dry under vacuum.
Electrode Preparation [34]:
- Disperse 5 mg of the synthesized silver microstructure powder in 3 mL of 0.5% chitosan solution.
- Sonicate the mixture for 15 minutes to achieve a homogeneous suspension.
- Mechanically polish a glassy carbon electrode (GCE) with alumina powder and rinse thoroughly.
- Drop-cast 10 μL of the suspension onto the clean GCE surface and allow it to dry at room temperature.
Measurement in Homogenate Matrix:
- Prepare plant tissue homogenates in a suitable buffer (e.g., phosphate buffer, pH 7.0) using a cold mortar and pestle or mechanical homogenizer.
- Calibrate the Ag-rose-flower modified GCE in a standard three-electrode cell using known additions of H₂O₂.
- Introduce the tissue homogenate sample into the electrochemical cell.
- Perform amperometric detection at a constant potential optimal for H₂O₂ oxidation (e.g., -0.25 V vs. SCE for Ag structures) while stirring.
In-Vivo Monitoring
3.3.1 Application Context In-vivo monitoring allows for the real-time tracking of H₂O₂ fluctuations within the living plant's apoplast or specific cell compartments, crucial for understanding signaling dynamics during stress conditions [33] [38].
3.3.2 Experimental Protocol: Real-Time Tracking in Living Cells
Sensor Fabrication (PtNPs@Polyazure A) [33]:
- Activate a screen-printed carbon electrode (SPCE) electrochemically according to standard protocols.
- Electropolymerize a conductive film of polyazure A-dodecyl sulfate onto the activated SPCE surface.
- Electrodeposit platinum nanoparticles (PtNPs) onto the polymer-modified surface.
In-Vivo Measurement Setup:
- Cell Culture: Use a suspension of living plant cells (e.g., grapevine cells) in their culture medium under aerobic conditions.
- Sensor Calibration: Calibrate the modified SPCE directly in the cell culture medium to establish a baseline and ensure accuracy in the operative environment.
- Elicitor Application: Introduce abiotic or biotic elicitors to induce oxidative stress. Example elicitors include:
- Methyl jasmonate
- L-methionine
- Clopyralid (herbicide)
- Botrytis cinerea (fungus) [33]
- Data Acquisition: Use amperometry to continuously monitor the H₂O₂ secretion from the cells for extended periods (up to 12 hours or more).
3.3.3 Workflow Diagram
Diagram 2: In-vivo monitoring of H₂O₂ in plant cells.
Critical Design Considerations for Plant Applications
When tailoring non-enzymatic H₂O₂ sensor design for plant systems, several factors must be prioritized:
- Selectivity: The sensor must be inert to interference from other electroactive species commonly found in plant matrices, such as ascorbic acid, urea, and glucose [34]. The use of specific nanostructures and polymer films is critical to mitigate this.
- Stability and Longevity: Measurements, particularly in-vivo, may require continuous operation over many hours. Sensors demonstrating excellent long-term stability, such as the PtNPs@polyazure A sensor (>12 hours) and the Ag rose-flower microstructures, are essential for reliable data collection [33] [34].
- Sensitivity in Complex Media: The sensor must maintain a low detection limit in the actual sample matrix (e.g., cell culture medium, sap, homogenate). Calibrating the sensor within the target medium, as demonstrated in [33], is a crucial step for accurate quantification.
- Spatial and Temporal Resolution: For in-vivo applications, microelectrodes used in techniques like Fast-Scan Cyclic Voltammetry (FSCV) provide high temporal resolution to track rapid H₂O₂ transients, which is vital for understanding signaling dynamics [38].
Optimizing Sensor Performance and Overcoming Challenges in Complex Plant Matrices
The accurate detection of hydrogen peroxide (H₂O₂) is crucial in plant science research, where it functions as a key signaling molecule in stress responses and adaptive pathways [39]. Non-enzymatic electrochemical sensors are invaluable tools for such investigations, offering stability and cost-effectiveness compared to their enzyme-based counterparts [4] [40]. However, a significant challenge in achieving high-fidelity measurements in complex plant matrices is the presence of endogenous electroactive interferents, primarily ascorbic acid (AA), uric acid (UA), and sugars such as glucose [41] [42]. These compounds can oxidize at potentials similar to H₂O₂, generating confounding signals that compromise sensor accuracy and reliability [42] [43].
This application note provides a structured framework for researchers developing non-enzymatic H₂O₂ sensors for plant applications, focusing on strategies to mitigate interference from AA, UA, and sugars. We present quantitative interference data, detailed experimental protocols for sensor validation, and a toolkit of materials to facilitate the design of selective and robust sensing platforms.
The Interference Challenge: Quantitative Profiles of Common Interferents
Understanding the specific impact of individual interferents is the first step in developing effective mitigation strategies. The following table summarizes documented interference effects on various sensor types.
Table 1: Documented Interference Effects of Ascorbic Acid, Uric Acid, and Sugars
| Interferent | Sensor Type / System | Observed Interference Effect | Reference |
|---|---|---|---|
| Ascorbic Acid (AA) | Abbott Libre 2 CGM | Positive bias of up to +48% | [42] |
| Urine Biochemistry Analyte Measurement | Interfered with chloride, calcium, and magnesium determinations | [41] | |
| Uric Acid (UA) | Dexcom G6 CGM | Positive bias of up to +33% | [42] |
| Urine Biochemistry Analyte Measurement | Affected by elevated glucose levels | [41] | |
| Glucose | Urine Biochemistry Analyte Measurement | Affected total protein, calcium, magnesium, creatinine, urea, and uric acid determinations | [41] |
| Abbott Libre 2 CGM | Positive bias of >+100% (for structurally similar sugars: galactose, mannose, xylose) | [42] | |
| Acetaminophen | Dexcom G6 CGM | Positive bias of >+100% | [42] |
Strategic Approaches for Interference Mitigation
Advanced Nanomaterial Engineering
The core strategy for combating interference lies in the careful design of the electrode material's composition and morphology to enhance selectivity.
- Prussian Blue-based Composites: The development of a sensor using δ-FeOOH and Prussian blue anchored on carbon felt demonstrated excellent selectivity for H₂O₂ in the presence of AA, UA, and dopamine [40]. The synergy between these materials provides a selective electrocatalytic surface that minimizes the response from common interferents.
- Porous Ceria Hollow Microspheres: Synthesizing CeO₂ with a porous hollow structure creates a high surface area and abundant active sites. A biosensor utilizing this material exhibited high sensitivity towards H₂O₂ and possessed excellent anti-interference performance against AA, glucose, UA, and citric acid [5].
- Core-Shell Nanorods: The morphology and oxidation state of precious metals can be optimized. "Hairy" Au@Pt nanorods demonstrated superior H₂O₂ sensing performance, including a wider linear range and lower detection limit, compared to "smooth" variants. This enhanced performance is linked to a higher concentration of catalytically active Pt(0) [44].
Physical Separation via Selective Membranes
A traditional yet effective method involves applying a permselective membrane, such as Nafion, onto the electrode surface. These membranes are typically negatively charged, which electrostatically repels anionic interferents like AA and UA, while allowing the neutral H₂O₂ molecule to diffuse through to the electrode surface [43]. This approach can be readily integrated with advanced nanomaterials for a dual-layered defense.
Data Processing through Deconvolution Algorithms
For sensors where complete chemical exclusion is challenging, computational methods offer an alternative. It is possible to differentiate analytes based on their distinct oxidation potentials. By using techniques like differential pulse voltammetry, the overlapping signals from AA, UA, and H₂O₂ can be resolved. Subsequent deconvolution algorithms can then isolate the current signal originating specifically from H₂O₂ [45].
The following diagram illustrates the multi-faceted strategic approach to interference mitigation, from material design to data output.
Experimental Protocols
Protocol: Dynamic Interference Testing for Sensor Validation
This protocol, adapted from a study on continuous glucose monitors, provides a robust method for evaluating sensor selectivity against a panel of potential interferents under dynamic conditions [42].
1. Sensor Preparation:
- Prepare the sensor according to its standard fabrication procedure (e.g., modify a glassy carbon electrode with the nanomaterial of choice).
- Condition the sensor in a relevant buffer (e.g., 0.1 M phosphate-buffered saline, PBS, pH 7.0-7.4) via cyclic voltammetry until a stable baseline is achieved.
2. Experimental Setup:
- Use a flow-through system with a temperature-controlled chamber maintained at a stable temperature (e.g., 25°C or 37°C).
- Continuously perfuse the sensor with a baseline solution containing a fixed, physiologically relevant concentration of H₂O₂ (e.g., 100-200 µM) in PBS.
3. Dynamic Interference Exposure:
- After obtaining a stable sensor baseline for at least 30 minutes, introduce the test interferent (e.g., AA, UA, glucose) dissolved in the H₂O₂/PBS solution via a second pump.
- Dynamically ramp the concentration of the interferent from 0% to 100% of its maximum target concentration over 60 minutes.
- Hold the interferent at its maximum concentration for 30 minutes.
- Ramp the concentration back down to 0% over 60 minutes, followed by a final 30-minute washout period with the baseline H₂O₂/PBS solution.
- Record the sensor's current/output continuously throughout the experiment.
4. Data Analysis:
- Calculate the mean bias from the H₂O₂ baseline (BOB) at each interferent concentration.
- A bias of ≥ ±10% is typically considered a clinically or analytically significant interference [42].
Protocol: Fabrication of a Prussian Blue/δ-FeOOH Carbon Felt Sensor
This protocol details the synthesis of a highly selective non-enzymatic H₂O₂ sensor as reported in the literature [40].
1. Synthesis of δ-FeOOH:
- Prepare a 0.1 M FeCl₃ solution.
- Adjust the pH to ~1.8 using a dilute HCl solution.
- Heat the solution at 80°C for 3 days.
- Collect the resulting yellow precipitate of δ-FeOOH by centrifugation, wash thoroughly with deionized water, and dry.
2. Electrode Modification:
- Prepare a stable suspension of δ-FeOOH in a weak acid.
- Immerse a carbon felt (CF) electrode (2.5 cm²) into the δ-FeOOH suspension to allow for adsorption.
- Transfer the δ-FeOOH/CF electrode to an electrochemical cell containing 2.5 mM K₃[Fe(CN)₆] and 2.5 mM FeCl₃ in a 0.1 M KCl solution (pH 1.8).
- Using cyclic voltammetry (CV), cycle the potential between -0.2 V and +0.8 V (vs. Ag/AgCl) for 15-20 cycles to electrochemically synthesize and deposit Prussian blue (PB) from the solution onto the δ-FeOOH/CF, resulting in the final CF/PB-FeOOH electrode.
3. Sensor Characterization and Use:
- Characterize the modified electrode using CV and electrochemical impedance spectroscopy in a standard redox probe solution.
- For H₂O₂ detection, use amperometry at a applied potential of -0.2 V (vs. Ag/AgCl) in a neutral pH (7.0) PBS solution.
- Evaluate selectivity by adding successive aliquots of AA, UA, and dopamine and observing the minimal change in the amperometric signal compared to that of H₂O₂.
The Scientist's Toolkit: Essential Research Reagents
The following table lists key materials used in the development and validation of interference-resistant H₂O₂ sensors, as cited in the referenced research.
Table 2: Key Reagents for Sensor Development and Interference Testing
| Reagent/Material | Function in Research | Example Application |
|---|---|---|
| Prussian Blue (PB) | Artificial peroxidase enzyme; catalyzes H₂O₂ reduction. | Used in composites (e.g., with δ-FeOOH) to create a selective catalytic surface for H₂O₂ detection [40]. |
| δ-FeOOH (iron oxyhydroxide) | Nanostructured support material; stabilizes Prussian blue and enhances synergy. | Serves as a scaffold for PB formation, improving the stability and performance of the sensing electrode [40]. |
| Porous Ceria Hollow Microspheres (CeO₂-phm) | Nanozyme with high surface area; catalyzes H₂O₂ redox reaction. | Provides abundant active sites for H₂O₂ reduction, enabling high sensitivity and anti-interference performance [5]. |
| Carboxylated Multi-Walled Carbon Nanotubes (cMWCNTs) | Conductive scaffold; enhances electron transfer and disperses nanomaterials. | Used with CeO₂-phm on screen-printed electrodes to create a flexible, high-performance sensor [5]. |
| Nafion | Cation-exchange polymer membrane; provides charge-based selectivity. | Coated on electrode surfaces to repel anionic interferents like ascorbate and urate [43]. |
| Ascorbic Acid (AA) | Primary anionic interferent; used for selectivity testing. | Spiked into solutions during validation protocols to quantify positive signal bias [41] [42]. |
| Uric Acid (UA) | Primary anionic interferent; used for selectivity testing. | Spiked into solutions to assess the sensor's ability to resolve mixed signals [42] [45]. |
| D-Glucose | Neutral molecule interferent; used for selectivity testing. | Used to challenge sensors, particularly those used in biological or plant-based applications [41]. |
The pursuit of reliable non-enzymatic H₂O₂ sensing in plant research necessitates a deliberate and multi-pronged strategy against chemical interference. As outlined in this application note, there is no single solution; rather, selectivity is achieved through intelligent nanomaterial design (e.g., using Prussian blue/δ-FeOOH or porous ceria), the strategic use of permselective barriers (e.g., Nafion), and advanced signal processing techniques. The experimental protocols and reagent toolkit provided herein offer a practical foundation for researchers to validate existing sensors and develop next-generation platforms. By systematically implementing these strategies, scientists can enhance the data quality of their plant stress signaling studies, leading to more accurate models and a deeper understanding of plant physiology.
The accurate detection of hydrogen peroxide (H₂O₂) is crucial in plant physiology research, where it functions as a key signaling molecule in stress responses and redox signaling pathways [5] [46]. Non-enzymatic electrochemical sensors offer significant advantages for these measurements, including enhanced stability, reproducibility, and suitability for long-term monitoring without the inherent limitations of biological components [13] [5]. The performance of these sensors is profoundly influenced by three key operational parameters: the applied potential, the pH of the electrolyte, and the electrolyte composition itself. This Application Note provides detailed protocols for the systematic optimization of these parameters, framed within the context of developing reliable H₂O₂ sensors for plant research applications. The methodologies are designed to enable researchers to tailor sensor systems for specific experimental needs, particularly for measuring oxidative stress in plant tissues.
The Scientist's Toolkit: Essential Materials and Reagents
The following table catalogs the essential reagents and materials commonly required for the development and optimization of non-enzymatic H₂O₂ sensors.
Table 1: Key Research Reagent Solutions for H₂O₂ Sensor Development
| Reagent/Material | Function/Application | Representative Examples |
|---|---|---|
| Metal Catalysts | Serve as the electrocatalytic material for H₂O₂ oxidation or reduction. | Rhodium nanoparticles [9], Cerium Dioxide (CeO₂) nanozymes [5], Gold Nanowires [47], Fe₂O₃/CuFe₂O₄ nanocomposites [13] |
| Carbon Nanomaterials | Enhance electrode conductivity, surface area, and electron transfer kinetics. | Graphene Nanoplatelets (GNPs) [13], Carboxylated Multi-Walled Carbon Nanotubes (cMWCNTs) [5] |
| Electrode Substrates | Provide the conductive base platform for sensor fabrication. | Glassy Carbon Electrode (GCE) [9], Screen-Printed Carbon Electrodes (SPCE) [5] |
| Buffer Systems | Control and maintain the pH of the electrolyte during measurement. | Phosphate Buffered Saline (PBS) [9] [48], Sodium Hydroxide (NaOH) solution [13] |
| Chemical Reagents | Used for synthesis, electrode modification, and interference testing. | Horseradish Peroxidase (HRP) [49], 3-aminopropyltriethoxysilane (APTES) for immobilization [49], Ascorbic Acid, Uric Acid, Dopamine (for selectivity tests) [13] [5] |
Experimental Protocols for Parameter Optimization
Protocol: Optimizing the Applied Potential
Objective: To determine the optimal applied potential for the non-enzymatic reduction of H₂O₂ that maximizes the signal-to-noise ratio by minimizing interference from other electroactive species.
Materials:
- Potentiostat and three-electrode system
- Rhodium-modified Glassy Carbon Electrode (Rh/GCE) or other sensor of choice [9]
- 0.1 M Phosphate Buffered Saline (PBS), pH 7.0
- H₂O₂ stock solution (e.g., 30% v/v, prepare fresh dilutions)
- Dissolved oxygen for comparison [9]
Procedure:
- Electrode Preparation: Fabricate the modified electrode (e.g., Rh/GCE via electrodeposition) as per established methods [9].
- System Setup: Place the working, reference (Ag/AgCl), and counter (Platinum) electrodes in an electrochemical cell containing 10 mL of 0.1 M PBS (pH 7.0).
- Amperometric Testing: Using the amperometric i-t curve technique, apply a constant stirring to the solution. Test a sequence of potentials, typically between 0.0 V and -0.2 V (vs. Ag/AgCl) [9].
- Analyte Addition: At a stable baseline, successively add aliquots of H₂O₂ stock solution to achieve known concentration increments in the µM to mM range.
- Data Analysis: For each tested potential, record the steady-state current response after each addition. Plot the current vs. H₂O₂ concentration. The optimal potential is identified as the one that yields the highest sensitivity (slope of the calibration curve) and a stable, low background current, typically around -0.1 V where oxygen reduction interference is minimized [9].
Protocol: Investigating the Effect of Electrolyte pH
Objective: To characterize the influence of electrolyte pH on the electrocatalytic activity and stability of the sensor for H₂O₂ detection.
Materials:
- Potentiostat and three-electrode system
- Fabricated sensor (e.g., CeO₂-phm/cMWCNTs/SPCE) [5]
- H₂O₂ stock solution
- A series of 0.1 M PBS buffers covering a physiologically relevant pH range (e.g., pH 5.5 to 9.0) [48] [5].
Procedure:
- Baseline Measurement: Immerse the sensor in the electrochemical cell with the first buffer solution (e.g., pH 5.5). Use Cyclic Voltammetry (CV) to scan the potential window of interest, for example from -0.8 V to 0.2 V, at a scan rate of 50 mV/s, in the absence of H₂O₂ [13] [48].
- Analyte Response: Add a fixed, known concentration of H₂O₂ to the cell and run the CV scan again.
- Signal Recording: Note the peak current and peak potential corresponding to H₂O₂ oxidation/reduction.
- pH Variation: Rinse the electrode thoroughly with deionized water. Repeat steps 1-3 for each buffer solution in the pH series.
- Analysis: Plot the H₂O₂ oxidation/reduction peak current and potential as a function of pH. The optimal pH is identified as the value that provides the highest peak current (greatest sensitivity) and stable electrochemical response, often found at neutral pH (7.0-7.4) for many metal oxide-based sensors [48] [5].
Protocol: Assessing Electrolyte Composition and Interference
Objective: To evaluate the selectivity of the sensor against common interfering species and the impact of different supporting electrolytes.
Materials:
- Potentiostat and three-electrode system
- Optimized sensor from previous protocols
- 0.1 M PBS, pH 7.0, and 0.5 M NaOH solution [13]
- Stock solutions of potential interferents: Ascorbic Acid (AA), Uric Acid (UA), Glucose (Glu), Dopamine, Citric Acid (CA), NaCl [13] [5].
Procedure:
- Amperometric Setup: Set up the amperometric i-t curve at the optimized potential (e.g., -0.1 V) in 0.1 M PBS, pH 7.0, under constant stirring.
- H₂O₂ Response: Add a known concentration of H₂O₂ (e.g., 50 µM) and record the current response.
- Interference Test: Sequentially add various interfering species at concentrations typically 5-10 times higher than that of H₂O₂ (e.g., 0.5 mM) [13] [5]. Record the current change after each addition.
- Electrolyte Comparison: Rinse the system and repeat the amperometric measurement of H₂O₂ in a different electrolyte, such as 0.5 M NaOH [13].
- Data Analysis: Calculate the current response ratio for H₂O₂ versus each interferent. A reliable sensor should show a response to H₂O₂ that is significantly greater (e.g., >5x) than the response to any interferent at the same concentration [13] [5]. Compare the sensitivity and baseline stability in different electrolytes.
Data Presentation and Comparative Analysis
Table 2: Performance Metrics of Selected Non-Enzymatic H₂O₂ Sensors under Different Conditions
| Sensor Architecture | Optimal Applied Potential (V vs. Ag/AgCl) | Optimal pH / Electrolyte | Linear Range (µM) | Sensitivity (µA mM⁻¹ cm⁻²) | Key Advantage |
|---|---|---|---|---|---|
| Rh/GCE [9] | -0.1 V | Neutral (PBS) | 5 – 1000 | 172.24 ± 1.95 | High selectivity at low potential |
| CeO₂-phm/cMWCNTs/SPCE [5] | -0.2 V* | Neutral (PBS) | 0.5 – 450 | 2070.9 / 2161.6 | Ultra-high sensitivity & wide range |
| Fe₂O₃/CuFe₂O₄/GNPs [13] | Not Specified | Strongly Alkaline (0.5 M NaOH) | 5 – 13000 | 62.4 | Very wide linear range |
| PEDOT:BTB/PEDOT:PSS OECT [50] | -0.6 V* | 0.1x PBS | 1 x 10⁻⁶ – 100 | Not Specified | Ultra-low detection limit (pM) |
*Potential estimated from provided context regarding operation and performance.
Experimental Workflow and Logical Relationships
The following diagram illustrates the sequential and iterative process of optimizing key parameters for a non-enzymatic H₂O₂ sensor.
The development of robust and reliable non-enzymatic hydrogen peroxide (H₂O₂) sensors is of paramount importance for advancing research in plant science, where H₂O₂ serves as a key signaling molecule in stress responses and immune signaling pathways. However, the widespread adoption of these electrochemical sensors is hindered by two persistent challenges: electrode fouling and nanomaterial aggregation. Electrode fouling, the nonspecific adsorption of biomolecules (e.g., proteins, lipids) onto the sensor surface, significantly degrades sensor performance by reducing sensitivity, increasing background noise, and impairing long-term stability [51]. Similarly, the aggregation of nanostructured electrocatalysts, a common issue in nanomaterial-based sensor design, leads to a loss of active surface area and catalytic activity, thereby compromising sensor reproducibility and signal strength [20] [52]. This Application Note provides a structured framework of validated strategies and detailed protocols to mitigate these issues, specifically tailored for researchers developing non-enzymatic H₂O₂ sensors for plant science applications.
Strategies and Comparative Performance
Numerous strategies have been developed to combat fouling and aggregation. The choice of strategy often involves a trade-off between the level of protection, the impact on electron transfer kinetics, and the complexity of fabrication. The table below summarizes the characteristics and reported performance of several key approaches.
Table 1: Performance of Selected Antifouling Layers for Electrochemical Sensors
| Antifouling Strategy | Reported Performance | Key Advantages | Limitations / Stability |
|---|---|---|---|
| Sol-Gel Silicate Layer [51] | Preserved electrode signal after 6 weeks in cell culture medium. | High long-term stability, porous structure. | Signal halved within first 3 hours. |
| Poly-L-lactic acid (PLLA) [51] | Sustained catalyst performance during prolonged incubation. | Effective short-term protection. | Complete signal deterioration after 72 hours. |
| Flexible Trihexylthiol Anchor [53] | Retained 75% of original signal after 50 days in buffer. | Enhanced SAM stability without sacrificing electron transfer. | Requires gold electrode substrates. |
| Chitosan-rGO Biohydrogel [28] | High sensitivity (14.7 μA/μM) for H₂O₂ in plants; LOD: 0.06 μM. | Biocompatible, hydrophilic, suitable for in situ plant sensing. | --- |
| Diamond Nanoparticles (DNPs) [54] | Wide linear range (0.025–606.65 μM) for drug detection; LOD: 0.023 μM. | High stability, low-cost, narrow size distribution resists aggregation. | Inherently insulating in bulk form. |
The performance of non-enzymatic H₂O₂ sensors also heavily depends on the choice of electrocatalyst and its integration with support structures to prevent aggregation. The following table summarizes the performance of various nanomaterial-based sensors.
Table 2: Performance of Non-enzymatic H₂O₂ Sensors Based on Nanocomposites
| Sensor Material | Linear Range | Detection Limit | Sensitivity | Stability & Reproducibility |
|---|---|---|---|---|
| 3DGH/NiO Octahedrons [20] | 10 μM – 33.58 mM | 5.3 μM | 117.26 μA mM⁻¹ cm⁻² | Good selectivity, reproducibility, and long-term stability. |
| MWCNT/Pt Nanohybrids [52] | 0.01 – 2.0 mM | 0.3 μM | 205.80 μA mM⁻¹ cm⁻² | Excellent reusability, long-term stability, negligible interference. |
| MnO₂/SWCNT-Nafion [55] | 5.0×10⁻⁶ – 3.0×10⁻³ M | --- | --- | --- |
Experimental Protocols
Protocol 1: Applying a Sol-Gel Silicate Antifouling Layer
This protocol is adapted from a study that identified sol-gel silicate as a layer capable of protecting an electrode for up to 6 weeks in a complex medium [51].
Materials:
- Precursor solution (e.g., Tetraethyl orthosilicate (TEOS) or similar).
- Solvent (e.g., Ethanol).
- Acid or base catalyst.
- Phosphate Buffer Saline (PBS, 0.1 M, pH 7.4).
- Syringaldazine solution (0.5 mg/mL in ethanol) for catalyst immobilization [51].
- Carbon working electrode (e.g., glassy carbon, pencil lead).
Procedure:
- Electrode Preparation: Polish the carbon working electrode sequentially on sandpaper, copy paper, and an alumina slurry. Clean via sonication in ethanol and DI water, then dry.
- Sol-Gel Preparation: Under stirring, mix the silicate precursor (e.g., TEOS) with ethanol, DI water, and a catalytic amount of HCl to initiate hydrolysis. The typical molar ratio is 1:4:4 (TEOS:EtOH:H₂O). Stir the mixture for 1-2 hours at room temperature to form a clear sol.
- Layer Deposition: Deposit a thin layer of the sol onto the clean electrode surface via drop-casting or spin-coating.
- Drop-casting: Apply 5-10 μL of the sol directly onto the electrode surface and allow it to gel under ambient conditions for 30 minutes.
- Spin-coating: Spin the electrode at 2000-3000 rpm for 30 seconds after applying the sol.
- Aging and Drying: Allow the coated electrode to age for 24 hours at room temperature in a sealed container to complete the gelation and form a solid, porous silicate layer.
- Catalyst Immobilization (Optional): For sensors with an adsorbed catalyst, immerse the modified electrode in a 0.5 mg/mL solution of syringaldazine in ethanol for 60 seconds and dry under ambient conditions [51].
- Validation: Electrochemically validate the modified electrode in a standard redox probe solution (e.g., 10 mM K₃Fe(CN)₆ in PBS) using Cyclic Voltammetry (CV) to confirm successful modification and electron transfer properties.
Protocol 2: Fabricating a 3D Graphene Hydrogel/NiO Octahedron Nanocomposite
This protocol details the synthesis of a nanostructured composite that leverages 3D conductive supports to prevent nanoparticle aggregation, ensuring high sensitivity and stability for H₂O₂ detection [20].
Materials:
- Graphene Oxide (GO), synthesized via modified Hummers method.
- Nickel(II) nitrate hexahydrate (Ni(NO₃)₂·6H₂O).
- Mesoporous silica template (SBA-15).
- Ethanol (EtOH), Sodium hydroxide (NaOH).
- Teflon-lined autoclave.
Procedure:
- Synthesis of NiO Octahedrons: a. Dissolve 10 mg of SBA-15 silica and 10 mg of Ni(NO₃)₂·6H₂O in 100 mL of anhydrous ethanol. b. Stir the mixture for 24 hours at room temperature. c. Dry the resulting powder at 80°C for 48 hours. d. Calcinate the dry product in a muffle furnace at 550°C for 3 hours (heating rate: 2°C/min). e. To remove the silica template, treat the final product twice with 2 M NaOH at 60°C. f. Wash thoroughly with ethanol and DI water, and dry in a vacuum oven at 70°C for 12 hours [20].
- Self-Assembly of 3DGH/NiO Nanocomposite: a. Disperse 48 mg of GO and 12 mg of the as-synthesized NiO octahedrons in 32 mL of DI water. b. Sonicate the mixture using a bath sonicator for 2 hours, followed by probe sonication for 1.5 hours to achieve a homogeneous dispersion. c. Transfer the dispersion to a 45 mL Teflon-lined autoclave and hydrothermally treat it at 180°C for 12 hours. d. After natural cooling to room temperature, collect the resulting 3D graphene hydrogel/NiO nanocomposite. e. Wash the product multiple times with DI water and freeze-dry to obtain the final aerogel [20].
- Electrode Fabrication: a. Prepare an ink by dispersing the 3DGH/NiO nanocomposite in a mixture of water and ethanol (e.g., 1 mg/mL) with a few drops of Nafion as a binder. b. Deposit a calculated volume of the ink (e.g., 5-10 μL) onto a polished glassy carbon electrode (GCE) and allow it to dry at room temperature.
Protocol 3: In-situ H₂O₂ Sensing in Plant Leaves using a Biohydrogel-enabled Microneedle
This protocol describes a specialized method for direct, in-situ detection of H₂O₂ in plant tissue, utilizing a biocompatible hydrogel coating to mitigate fouling in a complex biological environment [28].
Materials:
- Microneedle array.
- Chitosan (Cs), Graphite powder for Graphene Oxide (GO) synthesis.
- Horseradish Peroxidase (HRP) enzyme.
- Glutaraldehyde (GA).
- Hydrofluoric acid (HF), Gold etchant.
- Sputtering system for gold coating.
Procedure:
- Microneedle Fabrication & Gold Coating: a. Fabricate a silicon microneedle array using standard microfabrication techniques (photolithography and deep reactive-ion etching). b. Clean the microneedle array with HF, followed by DI water and drying. c. Deposit a thin gold layer onto the microneedle surface using a sputtering system to create the conductive working electrode [28].
- Synthesis of HRP/Cs-rGO Biohydrogel: a. Synthesize reduced Graphene Oxide (rGO) from graphite powder using a modified Hummers method. b. Prepare a 0.5% Cs solution in aqueous acetic acid and a 0.5 mg/mL aqueous dispersion of rGO. Stir each separately for 12 hours. c. Ultrasonicate the rGO dispersion for 2 hours. Mix 500 μL of the rGO solution with 1 mL of the Cs solution and stir for 12 hours to form the Cs-rGO hydrogel via electrostatic interactions. d. To immobilize the HRP enzyme, add 50 μL of 1% glutaraldehyde solution to 500 μL of the Cs-rGO hydrogel and mix. Then, add 250 μL of HRP solution (1 mg/mL) to the mixture and incubate at 4°C for 12 hours to form the HRP/Cs-rGO biohydrogel [28].
- Sensor Functionalization: a. Drop-cast the prepared HRP/Cs-rGO biohydrogel onto the gold-coated microneedle array. b. Allow the biohydrogel to form a stable film on the microneedle surface, which will serve as the sensing interface.
- In-situ Plant Measurement: a. Gently attach the functionalized microneedle sensor to a plant leaf, ensuring the microneedles penetrate the epidermis. b. Connect the sensor to a portable potentiostat. c. Use chronoamperometry at a suitable applied potential (e.g., -0.4 V vs. Ag/AgCl) to measure the H₂O₂-induced catalytic current. The measurement can be completed within approximately 1 minute [28].
The Scientist's Toolkit: Essential Research Reagent Solutions
Table 3: Key Reagents for Sensor Fabrication and Their Functions
| Reagent / Material | Function / Application in Sensor Development |
|---|---|
| Chitosan (Cs) [28] | Natural biopolymer forming a biocompatible, hydrophilic hydrogel matrix; prevents nanomaterial aggregation. |
| Reduced Graphene Oxide (rGO) [28] | Provides high electrical conductivity and large surface area; enhances electron transfer in composite materials. |
| Sol-Gel Silicate Precursors [51] | Forms a porous, mechanically stable inorganic antifouling layer on the electrode surface. |
| Nafion Perfluorinated Resin [55] | Ion-exchange polymer used as a binder in electrode inks and for its charge-selective properties. |
| Trihexylthiol Anchors [53] | Forms stable self-assembled monolayers (SAMs) on gold, improving probe immobilization and electrode stability. |
| Diamond Nanoparticles (DNPs) [54] | Carbon nanomaterial offering high stability, biocompatibility, and a well-defined structure that resists aggregation. |
Strategic Workflow and Decision Pathway
The following diagram summarizes the strategic decision-making process for selecting the appropriate stabilization strategy based on the primary challenge and application context.
Achieving Low Detection Limits and Wide Linear Ranges for Physiological H2O2 Concentrations
Hydrogen peroxide (H₂O₂) plays a dual role in plant physiology, acting as a key signaling molecule in pathways like root symbiosis and stress response at physiological levels, while causing oxidative damage and disrupting cellular function at elevated concentrations [4] [56]. Accurate detection of H₂O₂ is therefore crucial for understanding plant health and function. Non-enzymatic electrochemical sensors have emerged as powerful tools for this purpose, offering advantages over enzyme-based sensors, including superior stability, lower cost, and reduced susceptibility to environmental inactivation [4] [9]. This application note details the materials and methodologies for fabricating and applying advanced non-enzymatic sensors to achieve highly sensitive and wide-range detection of H₂O₂ in plant research.
Performance Comparison of Recent Non-Enzymatic H₂O₂ Sensors
The table below summarizes the performance characteristics of several state-of-the-art sensing materials, providing a benchmark for sensor selection based on the specific needs of a plant physiology study.
Table 1: Performance Metrics of Recent Non-Enzymatic H₂O₂ Sensing Materials
| Sensing Material | Modification/Platform | Linear Range (μM) | Detection Limit (μM) | Sensitivity (μA mM⁻¹ cm⁻²) | Key Advantages |
|---|---|---|---|---|---|
| Porous Ceria Hollow Microspheres (CeO₂-phm) [5] | cMWCNTs/SPCE | 0.5 – 450 | 0.017 | 2070.9 / 2161.6 | Ultra-low detection limit, very high sensitivity, excellent stability |
| Rhodium Nanoparticles [9] | Glassy Carbon Electrode (GCE) | 5 – 1000 | 1.2 | 172.24 | High selectivity at low potential (-0.1 V), good reproducibility (RSD=3.2%) |
| NiO Octahedron/3D Graphene Hydrogel [20] | GCE | 10 – 33,580 | 5.3 | 117.26 | Very wide linear range, good selectivity and stability |
| Laser-Induced Graphene with Pt NPs [57] | Flexible Polyimide Substrate | 2 – 200 | Not Specified | Not Specified | Flexible, wearable, suitable for plant implantation |
| RGO/Au/Fe₃O₄/Ag Nanocomposite [58] | GCE | 2 – 12,000 | 1.43 | Not Specified | Wide linear range, rapid response (2s) |
Detailed Experimental Protocols
Protocol A: Fabrication of a Flexible LIG/Pt Sensor for Plant Implantation
This protocol is adapted from a patent describing a wearable sensor for in-situ H₂O₂ monitoring in plants [57].
Workflow Diagram: Fabrication of Flexible Plant Sensor
Materials:
- Substrate: Polyimide (PI) film (e.g., 80 μm thickness)
- Laser System: CO₂ laser engraving/microfabrication system
- Mask Material: Polyimide tape (50 μm thickness)
- Electrode Material: Ag/AgCl paste or ink
- Sensing Layer Precursor: Potassium tetrachloroplatinate (II) (K₂PtCl₄)
- Supporting Electrolyte: Sodium sulfate (Na₂SO₄)
- Protection Layer: Nafion solution (0.1% - 1.0%)
Step-by-Step Procedure:
- Substrate Preparation: Clean a PI film ultrasonically in ethanol and deionized water for 10 minutes each. Dry with a stream of nitrogen gas and fix it onto a thermally conductive copper plate.
- Laser-Induced Graphene (LIG) Patterning: Use design software (e.g., CorelDraw) to draw a three-electrode system (working, counter, reference). Transfer the design to the laser system. Critical Parameters: Set laser power to 8%, scan rate to 14%, and pixel density to 750 PPI. Focus the laser and induce the graphene pattern on the PI surface. After processing, rinse the LIG electrodes with deionized water to remove debris and air-dry.
- Mask Application: Adhere a PI tape to a separate cleaned PI film. Use the laser system to cut a mask pattern that exposes only the electrode areas and their conductive connections. Peel off and apply this mask onto the LIG electrode.
- Reference Electrode Fabrication: Apply Ag/AgCl paste onto the exposed reference electrode area. Cure in an oven at 60°C for 30 minutes.
- Platinum Nan particle Electrodeposition: Prepare an electrochemical deposition solution containing 1-10 mM K₂PtCl₄ in 0.1-0.5 M Na₂SO₄. Using the integrated LIG three-electrode system, perform electrodeposition via cyclic voltammetry. Critical Parameters: Potential range: -0.4 V to +0.5 V (vs. Ag/AgCl); Scan rate: 50-100 mV/s; Cycles: 5-15 scans.
- Nafion Coating: Pipette 0.2-1.0 μL of 0.1-1.0% Nafion solution onto the working electrode surface. Allow it to dry at room temperature to form a stable, charge-selective protective layer.
Protocol B: Electrochemical Characterization and H₂O₂ Sensing
This general protocol can be applied for testing and validating sensor performance using standard laboratory potentiostats [9] [20] [5].
Workflow Diagram: Sensor Testing and Data Analysis
Materials:
- Buffer: Phosphate Buffered Saline (PBS, 0.1 M, pH 7.0 - 7.4)
- Analyte: Hydrogen Peroxide (H₂O₂, 30% w/w), used to prepare serial dilutions in PBS.
- Equipment: Electrochemical workstation or potentiostat with standard three-electrode configuration.
Step-by-Step Procedure:
- Electrochemical Setup: Connect the fabricated sensor as the working electrode in the potentiostat cell. Use a Pt wire or the integrated LIG counter electrode and an Ag/AgCl reference electrode (or the integrated one). Place the cell containing 10-15 mL of PBS on a magnetic stirrer.
- Cyclic Voltammetry (CV) for Characterization: Record CV curves in PBS with and without H₂O₂ to observe the electrocatalytic redox peaks. Typical Parameters: Potential window: -0.8 V to +0.8 V (can be adjusted); Scan rate: 50 mV/s.
- Amperometric (i-t) Detection for Calibration: Apply a constant optimal detection potential. This is typically between -0.2 V and 0.0 V (vs. Ag/AgCl) for the reduction of H₂O₂ to minimize interference [9]. Under constant stirring, successively add aliquots of H₂O₂ standard solution into PBS to achieve a cumulative increase in concentration. Record the current response over time.
- Data Analysis:
- From the amperometric i-t curve, plot the steady-state current against H₂O₂ concentration to generate a calibration curve.
- Perform linear regression on the linear portion of the curve. The slope of the line provides the sensitivity.
- The Limit of Detection (LOD) is typically calculated as 3σ/S, where σ is the standard deviation of the blank signal (PBS) and S is the sensitivity from the calibration curve.
The Scientist's Toolkit: Essential Research Reagents and Materials
Table 2: Key Reagent Solutions for Non-Enzymatic H₂O₂ Sensor Development
| Item | Function/Application in Research | Example from Context |
|---|---|---|
| Metal Salt Precursors (e.g., RhCl₃, K₂PtCl₄, Ce(NO₃)₃) | Electrochemical deposition or synthesis of catalytic metal/metal oxide nanostructures [9] [57]. | RhCl₃ for Rh nanoparticle electrodeposition [9]. |
| Carbon Nanomaterials (Graphene Oxide, cMWCNTs) | Enhance electrical conductivity and provide high surface area for catalyst support [20] [5]. | cMWCNTs in porous ceria sensor composite [5]. |
| Nafion Solution | Cation-exchange polymer membrane; used as an anti-fouling layer to repel negatively charged interferents (e.g., ascorbate, urate) in biological samples [57]. | Coating on LIG/Pt sensor for plant implantation [57]. |
| Phosphate Buffered Saline (PBS) | Standard physiological pH electrolyte for electrochemical testing and calibration [9] [20]. | Used universally for sensor characterization in cited studies. |
| Polyimide Film | Flexible, thermally stable substrate for fabricating wearable/implantable sensors [57]. | Base material for Laser-Induced Graphene (LIG) electrodes [57]. |
Application in Plant Research: Measuring H₂O₂ Fluxes
Validated sensors can be deployed for advanced plant physiology studies. For instance, the upgraded H₂O₂ microsensor from Xuyue (Beijing) Corp. has been successfully used to measure real-time H₂O₂ flux in plant roots and fungal hyphae, revealing that enhanced H₂O₂ efflux at the plant-fungal interface is crucial for maintaining symbiosis [56]. The diagram below conceptualizes this experimental approach for measuring H₂O₂ dynamics in plant-microbe interactions.
Conceptual Diagram: Measuring H₂O₂ Flux in Plant Symbiosis
Validating Sensor Efficacy and Comparing Material Performance for Real-World Use
Hydrogen peroxide (H₂O₂) plays a dual role in plant systems, acting as a key signaling molecule at low concentrations while becoming cytotoxic at elevated levels. Precise monitoring of H₂O₂ is therefore essential for understanding plant stress responses, signaling pathways, and metabolic processes. Traditional enzymatic biosensors face limitations including high cost, complicated fabrication, and lack of stability, driving research toward advanced non-enzymatic alternatives. Nanomaterial-based platforms have emerged as particularly promising candidates due to their enhanced electrocatalytic properties, tunable morphologies, and exceptional sensitivity. This application note provides a comprehensive benchmarking analysis of recent nanomaterial platforms for H₂O₂ sensing, with specific consideration for plant science applications.
Performance Benchmarking of Nanomaterial Platforms
The quantitative performance metrics of various nanomaterial platforms for H₂O₂ detection are systematically compared in Table 1. These parameters provide critical insights for researchers selecting appropriate materials for specific plant science applications.
Table 1: Performance Metrics of Nanomaterial-Based H₂O₂ Sensors
| Nanomaterial Platform | Detection Limit (μM) | Linear Range (μM) | Sensitivity | Stability/Selectivity | Reference |
|---|---|---|---|---|---|
| CNT/Lithium Ferrite (2% LFO) Nanocomposite | 0.005 | 0.1–500 | Not specified | Excellent stability, wide linear response | [59] |
| 3D Graphene Hydrogel/NiO Octahedrons (25% NiO) | 5.3 | 10–33,580 | 117.26 μA mM⁻¹ cm⁻² | Good selectivity, reproducibility, long-term stability | [20] |
| Graphene Oxide/Gold Nanourchins Hybrid | Nanomolar range | Not specified | Highest among Au nanostructures | Operates at pH 6.5, suitable for biological systems | [60] |
The data reveal distinct advantages across different platforms. The CNT/lithium ferrite nanocomposite achieves an exceptional detection limit of 0.005 μM, making it suitable for detecting trace H₂O₂ concentrations in plant tissues [59]. In contrast, the 3D graphene hydrogel/NiO octahedrons composite offers an remarkably wide linear range extending to 33.58 mM, valuable for monitoring H₂O₂ fluctuations across concentration extremes in plant systems [20]. The graphene oxide/gold nanourchins hybrid demonstrates the importance of nanoparticle morphology, with nanourchins outperforming nanospheres and nanobowls due to their higher surface area and sharp edges containing under-coordinated gold atoms [60].
Experimental Protocols for Nanomaterial-Based H₂O₂ Sensing
Synthesis of CNT/Lithium Ferrite Nanocomposites
The citrate–gel auto-combustion route provides a cost-effective strategy for synthesizing CNT/LFO nanocomposites with controlled doping levels [59].
Materials Required:
- Multi-walled or single-walled carbon nanotubes
- Lithium nitrate (LiNO₃) and iron nitrate (Fe(NO₃)₃·9H₂O) as precursor materials
- Citric acid as fuel and complexing agent
- Deionized water and ethanol for washing
Procedure:
- Functionalize CNTs via acid treatment to introduce surface carboxyl groups.
- Prepare aqueous solutions of lithium and iron nitrates in stoichiometric ratios corresponding to desired LFO doping levels (0.5%, 1%, 2%).
- Add citric acid as a complexing agent in a 1:1 molar ratio to metal ions.
- Mix the solution with functionalized CNTs and stir continuously at 80°C to form a homogeneous gel.
- Increase temperature to 200°C to initiate self-propagating combustion, yielding a precursor powder.
- Anneal the powder at 500°C for 2 hours to crystallize the lithium ferrite phase.
- Characterize using XRD to confirm crystalline structure and FE-SEM to verify uniform dispersion with nanoplate particles averaging ~50 nm.
Fabrication of 3D Graphene Hydrogel/NiO Octahedron Sensors
This protocol leverages hard templating and hydrothermal self-assembly to create hierarchical structures [20].
Materials Required:
- Graphite powder for graphene oxide synthesis
- Mesoporous silica SBA-15 as hard template
- Nickel nitrate hexahydrate (Ni(NO₃)₂·6H₂O)
- Ethanol, sodium hydroxide, and other analytical grade reagents
Procedure: NiO Octahedron Synthesis:
- Dissolve 10 mg silica template in 100 mL ethanol containing 10 mg nickel nitrate hexahydrate.
- Stir for 24 hours at room temperature for complete infiltration.
- Dry at 80°C for 48 hours, then grind thoroughly.
- Repeat the infiltration and drying process for uniform filling.
- Calcinate at 550°C for 3 hours (heating rate: 2°C min⁻¹) to convert to oxide form.
- Remove silica template by treating twice with 2 M NaOH at 60°C.
- Wash repeatedly with ethanol and water, then dry at 70°C under vacuum.
3DGH/NiO Composite Formation:
- Disperse 48 mg graphene oxide in 32 mL deionized water.
- Add 12 mg NiO octahedrons (25% by weight) and disperse via bath sonication (2 hours) followed by probe sonication (1.5 hours).
- Transfer mixture to 45 mL Teflon-lined autoclave and maintain at 180°C for 12 hours.
- After natural cooling, wash the resulting hydrogel repeatedly with deionized water.
- Freeze-dry to preserve the porous structure.
- Characterize using FE-SEM, HR-TEM, XRD, TGA, and Raman spectroscopy.
Electrochemical Characterization Protocol
Standardized electrochemical testing enables direct comparison of sensor performance across different platforms [59] [20].
Equipment Required:
- Potentiostat/Galvanostat with standard three-electrode configuration
- Glassy carbon electrode as working electrode substrate
- Platinum wire counter electrode and Ag/AgCl reference electrode
- Phosphate buffer solution (PBS, 0.1 M, pH 7.4) as supporting electrolyte
Electrode Modification:
- Polish glassy carbon electrode with 0.05 μm alumina slurry.
- Prepare nanomaterial ink by dispersing 5 mg of synthesized nanomaterial in 1 mL of water:ethanol (1:1) mixture with 10 μL Nafion solution.
- Deposit 10 μL of the ink onto the polished electrode surface and dry under infrared lamp.
Cyclic Voltammetry (CV) Measurements:
- Record CV curves in 0.1 M PBS (pH 7.4) without H₂O₂ as baseline.
- Add H₂O₂ aliquots to achieve concentrations from 0.1 μM to 10 mM.
- Scan potential from -0.8 V to +0.8 V at scan rate of 50 mV s⁻¹.
- Identify reduction peak potential typically around -0.2 V to -0.4 V vs. Ag/AgCl.
Amperometric Measurements:
- Apply constant potential of -0.2 V vs. Ag/AgCl with continuous stirring.
- Record current response while making successive H₂O₂ additions.
- Plot calibration curve of current response versus H₂O₂ concentration.
- Calculate sensitivity from slope of linear region, detection limit from 3×signal-to-noise ratio, and linear range from the concentration span maintaining linearity.
Visualization of Sensor Design and Workflow
H₂O₂ Sensing in Plant Science
Sensor Development Workflow
The Scientist's Toolkit: Essential Research Reagents and Materials
Table 2: Essential Research Reagents for Nanomaterial-Based H₂O₂ Sensor Development
| Category | Specific Materials | Function/Application |
|---|---|---|
| Carbon Nanomaterials | Carbon nanotubes (CNTs), Graphene oxide (GO), 3D graphene hydrogel (3DGH) | Electron transfer acceleration, high surface area support, structural framework [59] [20] |
| Metal Oxide Catalysts | Lithium ferrite (LFO), Nickel oxide (NiO) octahedrons | Electrocatalytic H₂O₂ reduction, redox activity enhancement [59] [20] |
| Noble Metal Nanoparticles | Gold nanourchins (AuNUs), gold nanospheres (AuNSs), gold nanobowls (AuNBs) | Catalytic H₂O₂ reduction, morphology-dependent enhancement [60] |
| Synthesis Reagents | Citric acid, nickel nitrate hexahydrate, mesoporous silica SBA-15 | Nanomaterial synthesis, template-assisted morphology control [59] [20] |
| Electrochemical Supplies | Phosphate buffer solution (PBS, 0.1 M, pH 7.4), Nafion solution | Electrolyte medium, binder for electrode modification [20] |
| Characterization Standards | Potassium ferricyanide, dopamine, ascorbic acid, uric acid | Selectivity testing, interference studies [20] |
Application in Plant Science Research
The nanomaterial platforms discussed offer significant potential for advancing plant science research, particularly in the context of non-destructive, real-time monitoring of H₂O₂ fluctuations. Plant phenotyping conventionally relies on labor-intensive methods that limit throughput and temporal resolution [61]. Nanosensors enable non-destructive analysis of living plants, allowing researchers to monitor H₂O₂ dynamics in response to environmental stressors, pathogen attacks, and developmental cues.
The exceptional sensitivity of the CNT/lithium ferrite platform (0.005 μM detection limit) makes it suitable for detecting subtle changes in H₂O₂ concentrations during early stress responses in plants [59]. The wide linear range of the 3D graphene/NiO sensor (up to 33.58 mM) allows monitoring of H₂O₂ across concentration extremes encountered during oxidative burst responses to pathogen challenge [20]. These platforms can be integrated with plant growth systems to provide continuous monitoring without destructive sampling.
For plant biology applications, sensor selectivity is paramount due to the complex chemical environment of plant tissues and apoplastic fluids. The demonstrated selectivity of these nanomaterial platforms against common interferents like ascorbic acid, dopamine, and uric acid makes them particularly valuable for accurate H₂O₂ measurement in plant systems [20]. Furthermore, operation at physiological pH ranges ensures compatibility with plant biological samples.
This benchmarking analysis demonstrates that CNT/lithium ferrite nanocomposites, 3D graphene hydrogel/NiO octahedrons, and graphene oxide/gold nanourchin hybrids represent the current state-of-the-art in non-enzymatic H₂O₂ sensing platforms. Each offers distinct advantages in detection limit, linear range, and sensitivity, allowing researchers to select platforms based on specific application requirements in plant science. The provided experimental protocols enable replication and further development of these sensors, while the visualization frameworks aid in understanding the underlying mechanisms and workflows. As plant science increasingly focuses on understanding signaling networks and stress responses, these advanced nanomaterial platforms will play an essential role in elucidating the spatiotemporal dynamics of H₂O² in plant systems.
Within the development of non-enzymatic hydrogen peroxide (H₂O₂) sensors for plant research, confirming the accuracy of measurements in real plant samples is a critical final step. Plant matrices are chemically complex, containing numerous compounds that can interfere with analytical readings, a phenomenon known as the matrix effect [62]. This application note details established protocols for spiking experiments and recovery tests, which are essential for validating sensor performance and demonstrating that the method provides reliable, accurate quantitative data in biologically relevant conditions [63] [62]. Proper validation ensures that your H₂O₂ sensor readings truly reflect concentrations in plant tissues, such as those from Arabidopsis thaliana or Citrus sinensis, which is fundamental for credible research outcomes [62].
Core Principles of Method Validation
Method validation provides objective evidence that an analytical process is fit for its intended purpose. For H₂O₂ quantification in plant extracts, key validation parameters include [62]:
- Accuracy and Precision: The closeness of agreement between a test result and the accepted reference value (trueness), and the closeness of agreement between independent test results (precision). These are measured through repeatability (intra-day) and reproducibility (inter-day/inter-laboratory) experiments.
- Sensitivity: Defined by the Limit of Detection (LOD), the lowest content that can be detected, and the Limit of Quantification (LOQ), the lowest content that can be quantified with acceptable accuracy and precision.
- Selectivity: The ability of the method to measure the analyte (H₂O₂) accurately in the presence of other components in the plant extract.
- Linearity and Range: The ability of the method to elicit test results that are directly proportional to the concentration of the analyte within a given range.
Experimental Protocols
Sample Preparation: Plant Extraction
The first step is to obtain a representative plant extract with minimal degradation of the target analyte.
- Plant Material Handling: Harvest plant tissue and immediately freeze it in liquid nitrogen. Homogenize the frozen tissue using a GenoGrinder or a mortar and pestle. Weigh an aliquot (e.g., 100 ± 1 mg) into a tube and store at -80°C until extraction [62].
- Extraction Solvent Selection: The choice of solvent is critical. For polar compounds like H₂O₂, polar solvents are typically used. Water is highly polar and cheap but can promote bacterial growth and requires significant heat for concentration. Alcohols like methanol or ethanol are polar, miscible with water, self-preservative at >20% concentration, and require less heat for concentration [64].
- Extraction Procedure: Add a predefined volume of the chosen cold extraction solvent (e.g., methanol with 0.05% formic acid) to the plant material. The solvent-to-solid ratio, extraction temperature, and duration should be optimized and kept consistent [62] [65]. Shake or vortex the mixture vigorously. Centrifuge the sample (e.g., at 13,000 rpm for 10-15 minutes at 4°C) to pellet insoluble debris.
- Extract Collection: Carefully collect the supernatant, which constitutes your plant extract. This matrix will be used for the subsequent spiking experiments [62].
Spiking Experiment and Recovery Test Protocol
This procedure evaluates the accuracy of the method by determining the recovery of known amounts of H₂O₂ added to the plant extract.
- Objective: To quantify the matrix effect and determine the analytical recovery of H₂O₂ from a complex plant sample.
- Principle: A known concentration of the H₂O₂ standard is added ("spiked") into the plant extract. The measured concentration is compared to the expected concentration to calculate the percentage recovery.
Procedure:
- Prepare Samples: For a standard addition calibration, prepare the following set of samples in triplicate [62]:
- Sample A (Native): Analyze a portion of the unspiked plant extract to determine the endogenous level of H₂O₂.
- Sample B (Spiked): To another portion of the plant extract, add a known volume of a H₂O₂ standard solution. The spike should be at a concentration level similar to the native amount (e.g., 1x) and at a higher level (e.g., 2-3x) to evaluate recovery across a range.
- Sample C (Standard in Solvent): Prepare a H₂O₂ standard solution in the pure extraction solvent (not the matrix) at the same concentration as the spike in Sample B. This serves as the reference for 100% recovery.
- Analysis: Analyze all samples (A, B, and C) using your validated non-enzymatic H₂O₂ sensor and the associated analytical method (e.g., LC-MS/MS or amperometric detection) [62].
- Calculation: Calculate the percentage recovery for the spiked sample using the formula:
- Recovery (%) = [ (Measured Concentration in B - Measured Concentration in A) / Concentration Added in B ] × 100
Interpretation: A recovery value close to 100% indicates minimal matrix interference and high method accuracy. Acceptable recovery ranges are typically between 85-115%, depending on the analyte and matrix complexity [62].
Comprehensive Validation Workflow
The diagram below outlines the complete workflow for the validation of an H₂O₂ sensor for plant applications, from sample preparation to the final assessment of method performance.
Data Analysis and Acceptance Criteria
Summarizing Validation Parameters
The quantitative data obtained from validation experiments should be compiled and assessed against predefined acceptance criteria. The table below summarizes the key parameters for a typical H₂O₂ quantification method.
Table 1: Key validation parameters and typical acceptance criteria for H₂O₂ quantification in plant extracts.
| Validation Parameter | Experimental Procedure | Measurement | Typical Acceptance Criteria |
|---|---|---|---|
| Accuracy (Recovery) | Spiking experiment at multiple concentrations | % Recovery | 85–115% [62] |
| Precision (Repeatability) | Replicate analyses (n≥5) of the same sample spiked at the same level on the same day | Relative Standard Deviation (RSD) | RSD < 10–15% [62] |
| Precision (Reproducibility) | Analysis of the same spiked sample over multiple days or by different analysts | Relative Standard Deviation (RSD) | RSD < 15% [62] |
| Linearity | Analysis of standard solutions at a minimum of 5 concentration levels across the expected range | Correlation Coefficient (R²) | R² > 0.990 [62] |
| Sensitivity (LOD/LOQ) | Analysis of blank samples or low-level standards based on signal-to-noise | LOD (S/N ≈ 3) & LOQ (S/N ≈ 10) | LOD/LOQ should be sufficiently low for biological relevance [62] |
Quality Control Measures
To ensure the ongoing reliability of the analytical method, implement the following quality control (QC) procedures during your real-sample analysis:
- Use of Internal Standards: Where possible, use a stable isotope-labeled internal standard (e.g., d⁵-JA for jasmonates) to correct for losses during sample preparation and variations in instrument response [62].
- QC Charts: Create and regularly update control charts for QC samples to monitor long-term method performance and stability.
- Blank Samples: Regularly run procedural blanks (all reagents without plant tissue) to confirm the absence of contamination.
The following diagram illustrates the logical sequence of quality checks that are integrated into the analytical workflow to ensure data integrity.
The Scientist's Toolkit
A successful validation study requires specific, high-quality reagents and materials. The following table lists essential research reagent solutions for these experiments.
Table 2: Essential research reagents and materials for spiking experiments and recovery tests.
| Item | Function / Purpose | Examples / Notes |
|---|---|---|
| H₂O₂ Standard | Primary analyte for spiking; used to create calibration curves. | High-purity, certified reference material. Prepare fresh daily or verify concentration [62]. |
| Deuterated Internal Standard | Corrects for analyte loss and matrix effects; improves data quality. | Not always available for H₂O₂, but used for other phytohormones (e.g., d⁵-JA, d⁶-ABA) [62]. |
| Extraction Solvents | To extract H₂O₂ and other metabolites from the plant matrix. | Methanol, Ethanol, Water, or Acidified mixtures (e.g., with 0.05% formic acid) [64] [62]. |
| Plant Material | Provides the complex biological matrix for real-sample validation. | Arabidopsis thaliana, Citrus sinensis, or other species relevant to the research [62]. |
| Chromatography Column | For separation of H₂O₂ from matrix components (if using LC-MS). | e.g., Luna Phenyl-Hexyl column (150 x 4.6 mm, 5 μm) [62]. |
| Mass Spectrometer / Electrochemical Sensor | The core detection system for quantifying H₂O₂. | LC-MS/MS (e.g., Triple-quadrupole, Iontrap) or a custom non-enzymatic electrochemical sensor [62] [26]. |
The accurate detection of hydrogen peroxide (H₂O₂) in biological systems is paramount, as it plays a dual role as a key signaling molecule in physiological processes and a marker of oxidative stress in pathological conditions [4] [66]. For plant research, where H₂O₂ functions as a central messenger in stress responses and developmental signaling, measuring its concentration with high fidelity is particularly crucial. Non-enzymatic electrochemical sensors have emerged as powerful tools for this purpose, offering advantages such as high sensitivity, operational simplicity, and excellent stability compared to their enzyme-based counterparts [4] [67]. However, the electrochemical signal is only as reliable as the validation framework supporting it.
A primary challenge in biosensor design is ensuring that the quantitative data generated at the electrode surface accurately reflects the complex biological reality. Data obtained from a single technique can be misleading; correlation with established, orthogonal analytical methods is therefore not merely beneficial but essential for confirming biological relevance [68]. This protocol provides a structured methodology for developing non-enzymatic H₂O₂ sensors and rigorously correlating their output with established techniques, with a specific focus on applications in plant research. The core workflow for this validation strategy is outlined in Figure 1.
Figure 1: Workflow for sensor validation and biological correlation
Experimental Design and Sensor Principles
Rationale for Non-Enzymatic Sensing in Plant Biology
Enzyme-based biosensors, while highly specific, suffer from inherent limitations such as high cost, poor stability, and denaturation under non-physiological conditions, which are common in plant research environments [4] [66]. Non-enzymatic sensors circumvent these issues by utilizing nanomaterial-based catalysts that directly facilitate the oxidation or reduction of H₂O₂. These materials, such as the porous ceria hollow microspheres or platinum-nickel hydrogels reported recently, offer remarkable stability, tunable catalytic properties, and resistance to degradation [68] [5]. For long-term or real-time monitoring of H₂O₂ fluxes in plant tissues—a common requirement in phytopathology and stress physiology—these attributes make non-enzymatic platforms the superior choice.
Key Sensing Materials and Reaction Mechanisms
The performance of a non-enzymatic H₂O₂ sensor is fundamentally governed by the electrocatalytic material at its heart. These materials function by lowering the activation energy for the electrochemical reactions of H₂O₂, either via direct oxidation or reduction [9]. The following table summarizes the function of key research reagents used in the construction of state-of-the-art sensors, as featured in this protocol.
Table 1: Research Reagent Solutions for H₂O₂ Sensor Fabrication
| Material/Reagent | Function in Sensor Design | Key Characteristics & Rationale |
|---|---|---|
| Pt-Ni Hydrogels [68] | Dual-function nanozyme with peroxidase-like & electrocatalytic activity. | 3D porous structure provides high surface area; enables both colorimetric & electrochemical detection for cross-validation. |
| Porous Ceria (CeO₂) [5] | Nanozyme for H₂O₂ electroreduction. | Ce³⁺/Ce⁴⁺ redox cycling provides excellent catalytic activity; high surface area and biocompatibility. |
| Rhodium Nanoparticles [9] | Electrocatalyst for H₂O₂ reduction. | High selectivity at low applied potentials (-0.1 V), minimizing interference from oxygen and other electroactive species. |
| Carboxylated MWCNTs [5] | Conductive scaffold and immobilization matrix. | Enhances electron transfer; large surface area for anchoring catalytic nanoparticles; improves electrode stability. |
| Screen-Printed Carbon Electrodes [5] | Disposable, customizable sensor substrate. | Enables portable, low-cost device fabrication; ideal for flexible sensors and in-field plant testing. |
Protocol: Sensor Fabrication, Validation, and Correlation
Part 1: Fabrication of a Porous Ceria-Based Non-Enzymatic Sensor
This protocol details the construction of a highly sensitive sensor based on porous ceria hollow microspheres (CeO₂-phm), which recently demonstrated superior performance for biological detection [5].
Materials:
- Cerium nitrate hexahydrate (Ce(NO₃)₃·6H₂O)
- Ethylene glycol, Glacial acetic acid
- Carboxylated multi-walled carbon nanotubes (cMWCNTs)
- Screen-printed carbon electrodes (SPCEs)
- Phosphate buffered saline (PBS, 0.1 M, pH 7.0)
- Ultrasonic bath, Centrifuge, Teflon-lined autoclave
Procedure:
- Synthesis of CeO₂-phm: Dissolve 2.0 g of cerium nitrate hexahydrate in 80 mL of ethylene glycol using ultrasonic agitation. Add 4 mL of deionized water and 4 mL of glacial acetic acid to the solution and stir vigorously for 30 minutes.
- Transfer the homogeneous precursor solution to a Teflon-lined autoclave and maintain at 180°C for 6 hours.
- After cooling, isolate the yellow precipitate by centrifugation. Wash the product thoroughly with deionized water and ethanol, then dry the purified CeO₂-phm at 80°C overnight.
- Electrode Modification: Prepare a dispersion of 1 mg/mL cMWCNTs in ethanol and sonicate for 30 minutes. Drop-cast 5 µL of this dispersion onto the working electrode area of an SPCE and allow it to dry.
- Prepare a 2 mg/mL suspension of the synthesized CeO₂-phm in ethanol. Drop-cast 5 µL of this suspension onto the cMWCNTs/SPCE and dry at room temperature. The fabricated sensor is designated as CeO₂-phm/cMWCNTs/SPCE.
Part 2: In-Vitro Electrochemical Characterization and Calibration
Materials:
- Potentiostat/Galvanostat
- Ag/AgCl reference electrode and platinum wire counter electrode (if using a three-electrode system)
- H₂O₂ stock solution (e.g., 30%), accurately diluted in PBS
Procedure:
- Connect the fabricated sensor to the potentiostat. In a three-electrode configuration, the modified SPCE serves as the working electrode.
- Place the electrode in a stirred electrochemical cell containing 10 mL of PBS.
- Using amperometry (i-t curve), apply a suitable detection potential (e.g., -0.2 V to 0.0 V vs. Ag/AgCl for H₂O₂ reduction) and allow the background current to stabilize.
- Sequentially add known aliquots of H₂O₂ stock solution into the cell to achieve a desired concentration range (e.g., 0.5 µM to 500 µM). Record the current response after each addition.
- Plot the steady-state current versus H₂O₂ concentration to generate a calibration curve. Calculate key analytical figures of merit: sensitivity, linear range, and limit of detection (LOD). Table 2 provides benchmark values from recent literature for comparison.
Table 2: Benchmark Performance of Recent Non-Enzymatic H₂O₂ Sensors
| Sensor Architecture | Linear Range (µM) | Detection Limit (µM) | Sensitivity | Application Demonstrated |
|---|---|---|---|---|
| CeO₂-phm/cMWCNTs/SPCE [5] | 0.5 - 450 | 0.017 | 2070.9 µA·mM⁻¹·cm⁻² | Real sample (serum) analysis |
| Pt-Ni Hydrogel/SPE [68] | 0.5 - 5000 | 0.15 | Not specified | Detection from HeLa cells |
| Rhodium/GCE [9] | 5 - 1000 | 1.2 | 172.24 μA·mM⁻¹·cm⁻² | Cosmetics (hair dye) |
| PtNPs@GR/GLN/SPCE [67] | 1 - 1200 | 0.037 | Not specified | Human blood serum |
Part 3: Correlation with Orthogonal Techniques in a Plant-Relevant Matrix
This is the critical step for establishing biological relevance. The electrochemical data must be validated against established techniques.
A. Correlation with Colorimetry via Nanozyme Activity
- Principle: Some nanomaterials, like the Pt-Ni hydrogels, possess intrinsic peroxidase-like activity. They can catalyze the oxidation of a chromogenic substrate (e.g., TMB) by H₂O₂, producing a color change measurable by UV-Vis spectrophotometry [68].
- Protocol: a. Spike-and-Recovery in Plant Extract: Prepare a crude extract from the plant tissue of interest (e.g., Arabidopsis leaf homogenate). b. Spike the extract with known, increasing concentrations of H₂O₂. c. Split each sample. Analyze one part with the fabricated electrochemical sensor (Part 2 protocol). d. For the other part, add acetate buffer (pH 4.0), TMB solution, and a catalytic amount of Pt-Ni hydrogel. Incubate for 3-5 minutes and measure the absorbance at 652 nm [68]. e. Plot the H₂O₂ concentration determined electrochemically against the concentration determined colorimetrically. A strong linear correlation (R² > 0.98) validates the accuracy of the electrochemical sensor in a complex plant matrix.
B. Correlation with a Standard Spectrophotometric Method
- Principle: The peroxidase-phenol red assay is a well-established, independent method for H₂O₂ quantification [4].
- Protocol: a. Use the same set of spiked plant extract samples as in (A). b. For the spectrophotometric assay, mix the sample with a solution containing horseradish peroxidase (HRP), phenol red, and dextrose. c. After incubation, measure the absorbance at 610 nm and calculate H₂O₂ concentration from a standard curve. d. Perform a similar correlation analysis as described above.
Data Analysis and Interpretation
The final step involves rigorous statistical and practical analysis of the correlated data to confirm the sensor's validity for biological use.
- Statistical Correlation: Perform linear regression analysis on the dataset from the correlation experiments. The slope of the line should be close to 1, and the intercept close to 0. A high coefficient of determination (R² > 0.95) indicates excellent agreement between methods [68].
- Recovery Studies: Calculate the percentage recovery of the known, spiked H₂O₂ concentration using the formula:
% Recovery = (Measured Concentration / Spiked Concentration) * 100. Recovery values between 95% and 105% are typically considered excellent, confirming minimal matrix interference. - Biological Application and Interpretation: Once validated, apply the sensor to a real plant science question. For example, monitor the burst of H₂O₂ in Arabidopsis leaves after pathogen-associated molecular pattern (PAMP) elicitation. The correlation with orthogonal methods provides high confidence that the observed electrochemical signals are a true report of biological H₂O₂ production, not an artifact. This reliable data can then be confidently used to model signaling pathways or assess oxidative stress levels.
This application note provides a comprehensive framework for moving beyond simple sensor characterization to the demonstration of biological relevance. By integrating the fabrication of advanced nanomaterial-based electrodes with a mandatory protocol for correlation against established colorimetric and spectrophotometric techniques, researchers can generate electrochemical data on H₂O₂ with the high level of confidence required for impactful plant science research.
Hydrogen peroxide (H2O2) represents a key reactive oxygen species (ROS) in plants, functioning as a crucial signaling molecule in numerous physiological and pathological processes [4] [69]. This metabolite, produced through the single-electron reduction of oxygen in organisms, plays a dual role: at low physiological concentrations, it regulates programmed cell death, development, growth, cell cycle, hormone signaling, and biotic and abiotic stress responses [69] [70]. However, when its concentration exceeds the physiological range, H2O2 triggers oxidative stress, leading to lipid peroxidation, DNA damage, cellular demise, and tissue impairment [4]. The recent discovery of specific extracellular and intracellular H2O2 receptors in plants, including the leucine-rich-repeat receptor kinase HPCA1 and the cytosolic thiol peroxidase PRXIIB, has further solidified its role as a legitimate signaling molecule [71]. This application note explores advanced methodologies for monitoring H2O2 dynamics, framed within the context of developing non-enzymatic sensors for plant research applications.
Advanced Methodologies for Monitoring H2O2 In Planta
Noninvasive In Planta Bioimaging with Genetically Encoded Sensors
The development of genetically encoded fluorescent sensors has revolutionized the noninvasive monitoring of H2O2 and redox states in live plants, enabling real-time observation without tissue destruction [72] [71].
Sensor Principle and Workflow: The technique employs two primary sensors based on redox-sensitive green fluorescent protein (roGFP): roGFP2-Orp1 for H2O2 detection and Grx1-roGFP2 for glutathione redox potential [71]. These sensors function ratiometrically; oxidation induces a conformational change that alters the fluorescence excitation spectrum, with the emission spectrum remaining unchanged. The ratio of fluorescence after excitation at 405 nm and 488 nm provides a quantitative measure independent of sensor concentration and laser intensity [71]. Table 1 summarizes the experimental workflow for noninvasive imaging in adult Arabidopsis thaliana plants.
Table 1: Protocol for Noninvasive H2O2 and Redox Bioimaging in Adult Plants
Step Procedure Specification Purpose 1. Plant Preparation Grow transgenic A. thaliana (3-4 weeks) expressing cytosolic roGFP2-Orp1 or Grx1-roGFP2. Soil or hydroponic systems (e.g., Araponics). Provides mature plant material expressing the sensor in the desired compartment. 2. Stress Application Subject plants to abiotic stress (e.g., salt stress). 150 mM NaCl solution. To induce a physiological H2O2 burst and perturb the redox status. 3. Image Acquisition Image live, intact plants using a stereo fluorescence microscope. Low magnification; capture images at both 405 nm and 488 nm excitation. To obtain ratiometric data noninvasively from the entire plant. 4. Data & Analysis Calculate the 405/488 nm fluorescence ratio for each pixel. Generate ratiometric images. Use software like ImageJ or proprietary pipeline. To visualize and quantify spatial and temporal dynamics of H2O2 and redox potential. 5. Validation Treat with 10 mM H2O2 (oxidation control) and 10 mM DTT (reduction control). Applied to leaf discs or whole plants. To define the fully oxidized and reduced states of the sensor for calibration. Case Study: Monitoring Systemic Signaling During Salt Stress: Researchers successfully employed this protocol to image cytosolic H2O2 dynamics in entire adult Arabidopsis plants during salt stress [71]. The noninvasive approach allowed for the visualization of systemic H2O2 waves and changes in glutathione redox potential across different leaves over time, providing organism-level insights that were previously unattainable with destructive biochemical methods or microscopy of small seedlings.
Electrochemical Sensing for Quantitative H2O2 Detection
Electrochemical sensors provide a highly sensitive, quantitative, and cost-effective alternative for H2O2 detection, particularly suitable for applications where high temporal resolution is required [4] [9].
Sensor Design and Principle: Non-enzymatic electrochemical detection of H2O2 relies on the direct oxidation or reduction of H2O2 on the surface of an electrocatalyst, which lowers the activation energy and enhances reaction kinetics [4] [9]. A prominent approach involves modifying electrode surfaces with nanostructured materials to increase sensitivity and selectivity. For instance, recent work has developed a sensor based on a rhodium-modified glassy carbon electrode (Rh/GCE), fabricated via a quick, one-step electrodeposition [9]. This sensor operates at a low applied potential of -0.1 V (vs. Ag/AgCl), minimizing interference from other electroactive species.
Performance Metrics: The analytical performance of several state-of-the-art non-enzymatic electrochemical sensors is summarized in Table 2. These metrics are critical for researchers when selecting a sensor for specific application requirements, such as detection limit in low-concentration cellular studies or wide linear range for industrial samples.
Table 2: Performance Comparison of Recent Non-enzymatic H2O2 Electrochemical Sensors
Sensing Material Electrode Type Linear Range (μM) Detection Limit (μM) Sensitivity (μA mM⁻¹ cm⁻²) Application Demonstrated Reference Porous Ceria Hollow Microspheres (CeO₂-phm) Screen-printed Carbon Electrode (SPCE) 0.5 - 450 0.017 2070.9 / 2161.6 Real sample analysis [5] Polypyrrole-Ag/Cu Nanoparticles Glassy Carbon Electrode (GCE) 0.1 - 1 and 1 - 35,000 0.027 (1st range) / 0.063 (2nd range) 265.06 (1st range) / 445.78 (2nd range) - [73] Rhodium Nanoparticles Glassy Carbon Electrode (GCE) 5 - 1000 1.2 172.24 Cosmetics (hair dye, antiseptic) [9] Case Study: Quality Control in Cosmetics: The Rh/GCE sensor was successfully applied to measure H2O2 concentrations in real cosmetic samples, including hair dye and antiseptic solutions, yielding satisfactory recovery rates [9]. This demonstrates the potential of such non-enzymatic platforms for reliable quantitative detection in complex matrices, an area highly relevant for ensuring compliance with safety regulations (e.g., the EU limit of 12% H2O2 in hair products).
H2O2 Signaling Pathways in Abiotic Stress and Immunity
The following diagram illustrates the central role of H2O2 and its complex crosstalk with other signaling molecules and pathways during plant stress responses.
Diagram 1: H2O2 acts as a central hub in stress signaling networks, integrating information from abiotic and biotic stimuli and coordinating downstream responses through crosstalk with calcium, nitric oxide, and hormone pathways.
The Antioxidant Defense System
Plants maintain a complex antioxidative defense mechanism to scavenge ROS and prevent detrimental effects on biomolecules [69] [74]. This system includes both enzymatic and non-enzymatic components. Key enzymatic players include:
- Superoxide dismutase (SOD): Catalyzes the dismutation of superoxide radicals into O2 and H2O2 [74].
- Catalase (CAT): Converts H2O2 into water and molecular oxygen [70] [74].
- Ascorbate peroxidase (APX): Utilizes ascorbate to scavenge H2O2 to water [70] [74].
- Glutathione peroxidase (GPX): Reduces H2O2 to water using glutathione [74].
The interplay between H2O2 production and these scavenging systems ultimately determines the final signaling output, making the monitoring of both H2O2 and the redox state of antioxidants like glutathione crucial for a complete understanding of plant stress physiology [71].
The Scientist's Toolkit: Essential Research Reagents and Materials
Table 3 catalogs key reagents and materials essential for experimenting with and monitoring H2O2 in plant systems, as derived from the cited protocols and studies.
- Table 3: Research Reagent Solutions for H2O2 Monitoring
Item Function/Application Example/Specification Genetically Encoded Sensors For noninvasive, ratiometric imaging of H2O2 and redox status in live plants. roGFP2-Orp1 (H2O2 sensor); Grx1-roGFP2 (glutathione redox potential) [72] [71]. Electrode Materials Base for constructing electrochemical sensors; provides a conductive surface. Glassy Carbon Electrode (GCE); Screen-Printed Carbon Electrode (SPCE) [9] [5]. Electrocatalyst Nanomaterials Enhance sensitivity and selectivity of non-enzymatic electrochemical sensors. Rhodium nanoparticles; Ag/Cu bimetallic nanoparticles; Porous Ceria Hollow Microspheres (CeO₂-phm) [9] [73] [5]. Chemical Standards Used for calibration curves, validation controls, and experimental treatments. H2O2 stock solution (e.g., 1 M); Dithiothreitol (DTT) stock solution (e.g., 1 M) [71]. Buffer Systems Maintain stable pH during electrochemical measurements and sample processing. Phosphate-Buffered Saline (PBS, 0.1 M, pH 7.0) [9] [5]. Fluorescence Microscope Essential for imaging fluorescent biosensors in plant tissues. Stereo fluorescence microscope for low-mag imaging of whole plants; Confocal microscope for cellular resolution [72] [71]. Potentiostat Instrument for applying potential and measuring current in electrochemical experiments. Used for electrodeposition of catalysts and amperometric detection of H2O2 [9] [73].
Conclusion
The development of non-enzymatic H2O2 sensors represents a significant leap forward for plant science, offering robust, cost-effective tools for deciphering redox biology. This synthesis has highlighted that successful sensor design hinges on the strategic selection and engineering of nanomaterials—from MnO2-carbon nanotube hybrids to porous CeO2 and Rhodium nanoparticles—to achieve the necessary sensitivity, selectivity, and stability required for complex plant matrices. Overcoming challenges like electrochemical interference and electrode fouling is paramount for reliable data. Looking forward, the integration of these sensors with flexible substrates and miniaturized systems paves the way for real-time, in-planta monitoring of H2O2 fluxes. This capability will be crucial for unraveling the spatial-temporal dynamics of ROS signaling in response to climate stressors, ultimately informing the development of primed or engineered crops with enhanced resilience, a critical goal for future food security.
References
- 1. Recent Insights Into the Double Role of Hydrogen Peroxide ... [https://pmc.ncbi.nlm.nih.gov/articles/PMC8831544/]
- 2. Recent insights into the double role of hydrogen peroxide ... [https://www.frontiersin.org/research-topics/3819/recent-insights-into-the-double-role-of-hydrogen-peroxide-in-plants/magazine]
- 3. Hydrogen Peroxide Signaling in Plant Development and ... [https://pmc.ncbi.nlm.nih.gov/articles/PMC4777889/]
- 4. Advances in Non-Enzymatic electrochemical materials for ... [https://www.sciencedirect.com/science/article/abs/pii/S1572665724000365]
- 5. A Flexible Electrochemical Sensor Based on Porous Ceria ... [https://pmc.ncbi.nlm.nih.gov/articles/PMC12563342/]
- 6. Hydrogen peroxide-induced stress acclimation in plants - PMC [https://pmc.ncbi.nlm.nih.gov/articles/PMC11073338/]
- 7. The effect of H2O2 on elongation growth and oxidative ... [https://www.nature.com/articles/s41598-025-96912-9]
- 8. Hydrogen Peroxide Variation Patterns as Abiotic Stress ... [https://www.frontiersin.org/journals/plant-science/articles/10.3389/fpls.2022.855477/full]
- 9. Highly Selective and Stable Electrochemical Sensor for ... [https://www.mdpi.com/2227-9040/13/11/376]
- 10. Review of research progress in immobilization and chemical ... [https://microbialcellfactories.biomedcentral.com/articles/10.1186/s12934-025-02791-0]
- 11. Progress of Advanced Nanomaterials in the Non ... [https://pmc.ncbi.nlm.nih.gov/articles/PMC7690282/]
- 12. Enzyme immobilization advances: a key to unlocking ... [https://pubs.rsc.org/ja-jp/content/articlehtml/2025/gc/d5gc03388h]
- 13. A highly accurate and selective non-enzymatic glucose sensor ... [https://pmc.ncbi.nlm.nih.gov/articles/PMC12570890/]
- 14. Boosting electrochemical oxygen reduction to hydrogen ... [https://pmc.ncbi.nlm.nih.gov/articles/PMC11271547/]
- 15. Electrochemical oxygen reduction to hydrogen peroxide at ... [https://www.nature.com/articles/s41467-022-30337-0]
- 16. Correction to: Noninvasive In Planta Live Measurements of ... [https://link.springer.com/protocol/10.1007/978-1-0716-3826-2_19]
- 17. Sensitive and Selective Electrochemical Detection of ... [https://www.mdpi.com/2079-6374/15/9/617]
- 18. Selective and highly sensitive measurement of H 2 O 2 and ... [https://www.sciencedirect.com/science/article/abs/pii/S0039914024014619]
- 19. Measuring Intracellular H2O2 in Intact Human Cells Using ... [https://en.bio-protocol.org/en/bpdetail?id=4538&type=0]
- 20. Enzymeless electrochemical detection of hydrogen ... [https://www.nature.com/articles/s41598-025-10472-6]
- 21. Direct printing of metal oxide nanostructures for wearable ... [https://www.nature.com/articles/s41598-025-04426-1]
- 22. MnO 2 on carbon nano fiber composite. [https://www.sciencedirect.com/science/article/abs/pii/S0925838822041317]
- 23. Nitrogen-Rich Polyacrylonitrile-Based Graphitic Carbons ... [https://pmc.ncbi.nlm.nih.gov/articles/PMC5676667/]
- 24. Recent progress in nanomaterial-based electrochemical ... [https://www.sciencedirect.com/science/article/abs/pii/S0039914024018290]
- 25. A nanocomposite-based electrochemical sensor for non- ... [https://pmc.ncbi.nlm.nih.gov/articles/PMC5355075/]
- 26. Progress of Advanced Nanomaterials in the Non ... [https://www.mdpi.com/2079-6374/10/11/151]
- 27. Robust Rules for Optimal Colorimetric Sensing Based on Gold ... [https://pmc.ncbi.nlm.nih.gov/articles/PMC10152487/]
- 28. A Biohydrogel-Enabled Microneedle Sensor for In Situ ... [https://pmc.ncbi.nlm.nih.gov/articles/PMC11959595/]
- 29. Hydrogen Peroxide and Dopamine Sensors Based on ... [https://pmc.ncbi.nlm.nih.gov/articles/PMC10818837/]
- 30. Non-enzymatic glucose sensors composed of trimetallic ... [https://www.nature.com/articles/s41598-023-32719-w]
- 31. Automation of the drop-casting deposition method for ... [https://link.springer.com/article/10.1007/s42452-025-06757-0]
- 32. Enzyme-Free Electrochemical Sensors for in situ ... [https://www.frontiersin.org/journals/plant-science/articles/10.3389/fpls.2022.872190/full]
- 33. - Non screen-printed enzymatic based on PtNPs@polyazure... sensor [https://pubmed.ncbi.nlm.nih.gov/32278294/]
- 34. Efficient 3D-Silver Flower-like Microstructures for Non - Enzymatic ... [https://www.nature.com/articles/s41598-017-11965-9?error=cookies_not_supported&code=72842c55-4553-4c99-a7ff-b77b8cd87d3e]
- 35. Review— Non - Enzymatic Hydrogen Peroxide Electrochemical... | CoLab [https://colab.ws/articles/10.1149%2F1945-7111%2Fab644a]
- 36. Plant Sap Analysis [https://advancingecoag.com/plant-sap-analysis/]
- 37. Plant Sap Analysis | Newage Laboratories [https://www.newagelaboratories.com/plant-sap-analysis]
- 38. Quantitation of Hydrogen Peroxide Fluctuations and Their ... [https://pmc.ncbi.nlm.nih.gov/articles/PMC3656754/]
- 39. Decoding early stress signaling waves in living plants ... [https://www.nature.com/articles/s41467-024-47082-1]
- 40. A Novel Non-Enzymatic Efficient H2O2 Sensor Utilizing δ- ... [https://www.mdpi.com/2311-5629/10/3/82]
- 41. Ascorbic acid and glucose can cause significant ... [https://pubmed.ncbi.nlm.nih.gov/39550214/]
- 42. Dynamic Interference Testing—Unexpected Results ... [https://www.mdpi.com/1424-8220/25/7/1985]
- 43. Electrochemical methods for ascorbic acid determination [https://www.sciencedirect.com/science/article/abs/pii/S0013468613025802]
- 44. Various Configurations of Au@Pt Nanostructures on ... [https://pmc.ncbi.nlm.nih.gov/articles/PMC12322878/]
- 45. Improved voltammetric discrimination of acetaminophen ... [https://pubs.rsc.org/en/content/articlehtml/2025/im/d4im00069b]
- 46. Hydrogen Peroxide Measurement Can Be Used to Monitor ... [https://www.mdpi.com/2037-0164/14/3/43]
- 47. Gold nanowires-based sensor for quantification of H 2 O 2 ... [https://www.sciencedirect.com/science/article/pii/S0039914024001516]
- 48. Experimental and In Silico Studies on the Development of ... [https://pmc.ncbi.nlm.nih.gov/articles/PMC12109943/]
- 49. A Spectrometric Method for Hydrogen Peroxide ... [https://pmc.ncbi.nlm.nih.gov/articles/PMC4634519/]
- 50. Ultra‐low LOD H2O2 Sensor Based on Synergistic Nernst ... [https://pmc.ncbi.nlm.nih.gov/articles/PMC12244517/]
- 51. Methods of Protection of Electrochemical Sensors against Biofouling in... [https://pmc.ncbi.nlm.nih.gov/articles/PMC10831843/]
- 52. Non-enzymatic Hydrogen Peroxide Sensors Based on ... [https://pmc.ncbi.nlm.nih.gov/articles/PMC5453378/]
- 53. Improving the Stability and Sensing of Electrochemical ... [https://pmc.ncbi.nlm.nih.gov/articles/PMC3956047/]
- 54. The High Stability and Selectivity of Electrochemical ... [https://www.mdpi.com/1424-8220/24/3/985]
- 55. Novel design of non-enzymatic sensor for rapid monitoring ... [https://www.sciencedirect.com/science/article/abs/pii/S1572665716300285]
- 56. 旭月成功升级研发新款H2O2传感器,科研成果刊载于J Exp Bot ... [http://xuyue.net/index.php?option=com_content&view=article&id=2079:h2o2-jxpbot&catid=18&Itemid=561]
- 57. 一种植物体内h2o2动态监测可穿戴传感器的制备方法 [https://patents.google.com/patent/CN116008362A/zh]
- 58. Efficiency improvement in non-enzymatic H 2 O 2 detection ... [https://pubs.rsc.org/en/content/articlelanding/2020/nj/d0nj00526f]
- 59. Carbon nanotubes/lithium ferrite nanocomposites: magnetic and... [https://pubs.rsc.org/en/content/articlelanding/2025/ra/d5ra04502a]
- 60. The Graphene Oxide/Gold Nanoparticles Hybrid Layers for ... [https://www.mdpi.com/1420-3049/30/3/533]
- 61. Nanosensor Applications in Plant Science - PMC [https://pmc.ncbi.nlm.nih.gov/articles/PMC9496508/]
- 62. Validated method for phytohormone quantification in plants [https://www.frontiersin.org/journals/plant-science/articles/10.3389/fpls.2014.00417/full]
- 63. Assessment, Validation and Application to Real Samples of ... [https://www.mdpi.com/2297-8739/5/2/23]
- 64. Preparation of Medicinal Plants: Basic Extraction and ... [https://pmc.ncbi.nlm.nih.gov/articles/PMC7398001/]
- 65. Techniques for extraction and isolation of natural products [https://cmjournal.biomedcentral.com/articles/10.1186/s13020-018-0177-x]
- 66. Recent Advances in Electrochemical Sensing of Hydrogen ... [https://pmc.ncbi.nlm.nih.gov/articles/PMC9103167/]
- 67. A reliable electrochemical sensor for determination of H 2 ... [https://www.sciencedirect.com/science/article/abs/pii/S0026265X18312827]
- 68. Portable visual and electrochemical detection of hydrogen ... [https://www.nature.com/articles/s41378-023-00623-y]
- 69. Hydrogen peroxide is a central ROS regulator in plant immunity [https://link.springer.com/article/10.1007/s12298-025-01673-4]
- 70. Frontiers | Hydrogen Peroxide Signaling in Plant Development and... [https://www.frontiersin.org/journals/plant-science/articles/10.3389/fpls.2016.00230/full]
- 71. Noninvasive In Planta Live Measurements of H2O2 and ... [https://link.springer.com/protocol/10.1007/978-1-0716-3826-2_4]
- 72. Noninvasive In Planta Live Measurements of H2O2 and ... [https://pubmed.ncbi.nlm.nih.gov/38587735/]
- 73. Hydrogen Peroxide Electrochemical Sensor Based on Ag ... [https://pmc.ncbi.nlm.nih.gov/articles/PMC10611109/]
- 74. Recent Developments in Enzymatic Antioxidant Defence Mechanism ... [https://pmc.ncbi.nlm.nih.gov/articles/PMC8066271/]