Navigating the Data Deluge: Overcoming Key Data Handling Challenges in High-Throughput Plant Phenotyping
High-throughput phenotyping (HTP) generates massive, complex datasets, creating significant bottlenecks in data management, standardization, and analysis that can hinder crop improvement and breeding programs.
Navigating the Data Deluge: Overcoming Key Data Handling Challenges in High-Throughput Plant Phenotyping
Abstract
High-throughput phenotyping (HTP) generates massive, complex datasets, creating significant bottlenecks in data management, standardization, and analysis that can hinder crop improvement and breeding programs. This article provides a comprehensive analysis for researchers and scientists of the core data challenges, from foundational volume and variety issues to methodological applications of AI and cloud platforms. It offers practical troubleshooting strategies for data complexity and cost barriers, and explores validation frameworks and comparative technology assessments to guide investment and implementation, ultimately aiming to unlock the full potential of HTP for developing climate-resilient crops.
The Scale of the Challenge: Understanding the Data Bottleneck in Modern Phenotyping
Modern plant phenotyping, which involves the comprehensive assessment of complex plant traits such as development, growth, architecture, and yield, is generating unprecedented amounts of data [1]. The shift from traditional, manual phenotyping to automated high-throughput phenotyping (HTP) systems has ushered in a "big data" era characterized by three fundamental challenges: Volume, Variety, and Velocity [2]. These "Three Vs" present both tremendous opportunities and significant hurdles for researchers aiming to enhance crop improvement and ensure global food security [3] [2]. Effectively managing these dimensions is crucial for unlocking the potential of predictive breeding and precision agriculture [3].
The following table summarizes the key quantitative aspects of the plant phenotyping landscape, illustrating the scale and growth of this field:
Table 1: The Scale of High-Throughput Plant Phenotyping
| Aspect | Quantitative Metric | Context & Significance |
|---|---|---|
| Market Value | Projected to reach USD 161.6 million by 2025 with a CAGR of 6.3% (2019-2033) [4] | Indicates substantial and growing investment in phenotyping technologies and research. |
| Global Phenotyping Platforms | Nearly 200 large-scale facilities worldwide (as of 2016 statistics) [5] | Includes both indoor (≈82) and European field (≈81) mechanized platforms, forming the physical infrastructure for data generation. |
| Research Focus | Only 23% of phenotyping research publications focus on dicotyledonous crops [5] | Highlights a significant research gap despite dicots comprising 4/5 of angiosperm species and including major crops like soybean and cotton. |
| Data Generation Context | A single drone flight over a crop can generate gigabytes of data [2]. Genomic data involves thousands or millions of DNA SNPs [2]. | Provides concrete examples of the massive Volume of data generated by modern phenotyping and genomic tools. |
FAQ: Core Concepts and Troubleshooting
FAQ 1: What exactly do the "Three Vs" mean in the context of my phenotyping research?
- Volume refers to the immense quantity of data generated. For example, imaging from a drone flying over a crop weekly or genomic information based on millions of DNA markers creates datasets that are challenging to store, process, and analyze with traditional methods and infrastructure [2].
- Variety describes the diversity of data types. A single research project might combine genomic sequences, hyperspectral images, geospatial coordinates, farm management metadata, and climate data. This complexity requires different tools and procedures for each data type and poses challenges for integration [2] [6].
- Velocity has two key aspects: the speed at which new data is generated and must be analyzed, and the need for rapid computational processing to deliver timely insights for breeding decisions. Slow analysis can bottleneck the entire research pipeline [2].
FAQ 2: I am overwhelmed by the Volume of my image data. What are the first steps to manage this?
- Infrastructure Planning: Anticipate data growth and invest in adequate storage and computing resources. The solution is not to collect less data but to improve infrastructure to handle it [2].
- Data Sampling: Employ intelligent data sampling strategies during initial analysis to make large datasets more manageable without losing critical information [2].
- Automated Processing: Utilize automated image analysis pipelines and machine learning models to extract phenotypic traits from thousands of images non-destructively, replacing manual, labor-intensive methods [1].
FAQ 3: How can I handle the Variety of data from different sensors and platforms?
- Adopt FAIR Principles: Make your data Findable, Accessible, Interoperable, and Reusable. This is especially important for phenotypic data, which often lacks global standards [6].
- Use Integrated Tools: Invest in software and platforms that help consolidate multiple data sources into a unified dataset for analysis [2].
- Leverage Machine Learning: Machine and deep learning approaches are adept at handling large, heterogeneous datasets and can automatically extract features and identify patterns across different data types [1].
FAQ 4: The Velocity of my data analysis is too slow, hindering breeding decisions. What can I do?
- Optimize Computational Speed: Ensure your statistical software and algorithms are efficient and capable of handling large arrays of data. This might require upgrading hardware or using cloud-based computing resources [2].
- Implement Real-time Analytics: For precision breeding applications, explore streaming data platforms and models that can analyze data as it is collected, enabling immediate intervention [2].
- Focus on Robust Data Collection: Build comprehensive and well-documented datasets. This allows for faster reaction to new challenges, as the necessary information is already available to explore and develop solutions rapidly [2].
Experimental Protocols for Managing the Three Vs
Protocol 1: An Integrated Workflow for Field-Based High-Throughput Phenotyping
This protocol outlines a methodology for collecting and managing multi-source data in a field environment, directly addressing the Three Vs.
1. Experimental Design and Platform Selection:
- Select a phenotyping platform appropriate for the scale and traits of interest. Options include ground-based vehicles (for high-resolution data), UAVs (drones) (for rapid coverage of large fields), and sensor networks (for continuous monitoring) [5] [1].
- Establish a rigorous schedule for data capture across key plant developmental stages to ensure temporal consistency.
2. Multi-Sensor Data Acquisition:
- Equip the chosen platform with a suite of sensors to capture data Variety:
- RGB Cameras: For capturing morphological traits and plant architecture [5] [1].
- Hyperspectral Sensors: For assessing physiological and biochemical indicators such as chlorophyll and water content [1].
- Thermal Cameras: For monitoring plant temperature as an indicator of water stress [1].
- LiDAR: For creating 3D models of plant canopy structure [5].
- Geotag all data captures using onboard GPS to add spatial context.
3. Data Management and Pre-processing:
- Establish a centralized data repository to handle the data Volume. Use automated pipelines for basic pre-processing:
- Image stitching and orthomosaicking for UAV imagery.
- Sensor calibration and geo-referencing.
- Data cleaning to handle errors and inconsistencies inherent in complex datasets [2].
4. Trait Extraction and Data Analysis:
- Use machine learning (e.g., Random Forests for tabular data) and deep learning models (e.g., Convolutional Neural Networks for image data) to automatically extract phenotypic traits from the raw sensor data [1].
- Integrate the extracted phenotypic data with genomic and environmental data to build models for genetic gain [3].
Protocol 2: Implementing a Machine Learning Pipeline for Phenotypic Trait Extraction
This protocol provides a detailed methodology for using AI to manage data Volume and Velocity in image-based phenotyping.
1. Data Preparation and Annotation:
- Image Collection: Compile a large dataset of images from your phenotyping platform (Volume).
- Annotation: Manually label a subset of images to create ground truth data for training. For example, annotate individual leaves, fruits, or diseased areas. This is a labor-intensive but critical step.
2. Model Selection and Training:
- Model Choice: For image-based tasks, select a Deep Convolutional Neural Network (CNN) architecture, which is the state-of-the-art for image classification and segmentation [1].
- Training: Train the CNN on the annotated dataset. This process allows the model to learn hierarchical features directly from the data, bypassing the need for manual feature engineering [1].
- Validation: Use a held-out portion of the data to validate the model's accuracy and avoid overfitting.
3. Deployment and High-Throughput Analysis:
- Deployment: Run the trained model on the entire, non-annotated image dataset. This enables the rapid, automated analysis of thousands of images, dramatically increasing analysis Velocity [1].
- Result Export: The model outputs quantitative traits (e.g., leaf count, disease severity percentage) into a structured format for further statistical analysis.
The Scientist's Toolkit: Essential Research Reagents & Solutions
Table 2: Key Technologies and Platforms for High-Throughput Phenotyping
| Tool Category | Specific Examples | Primary Function |
|---|---|---|
| Phenotyping Platforms | LemnaTec 3D Scanalyzer, PHENOPSIS, PHENOVISION, "Plant Accelerator" [5] [1] | Automated, non-invasive systems for imaging and monitoring plants in controlled environments or fields. They form the core infrastructure for HTP. |
| Sensor Technologies | RGB, Hyperspectral, Thermal, and LiDAR sensors [5] [1] | Capture a wide Variety of morphological, physiological, and structural data from plants. |
| Software & Analytical Tools | AI/ML models (CNNs, Random Forests), Cloud-based analytics platforms [1] [4] | Process the high Volume of data, extract traits, and accelerate analysis Velocity. |
| Data Management Solutions | Platforms adhering to FAIR principles, Geospatial data infrastructure (e.g., for precision ag) [6] | Store, manage, and standardize heterogeneous data, enabling sharing and reuse. |
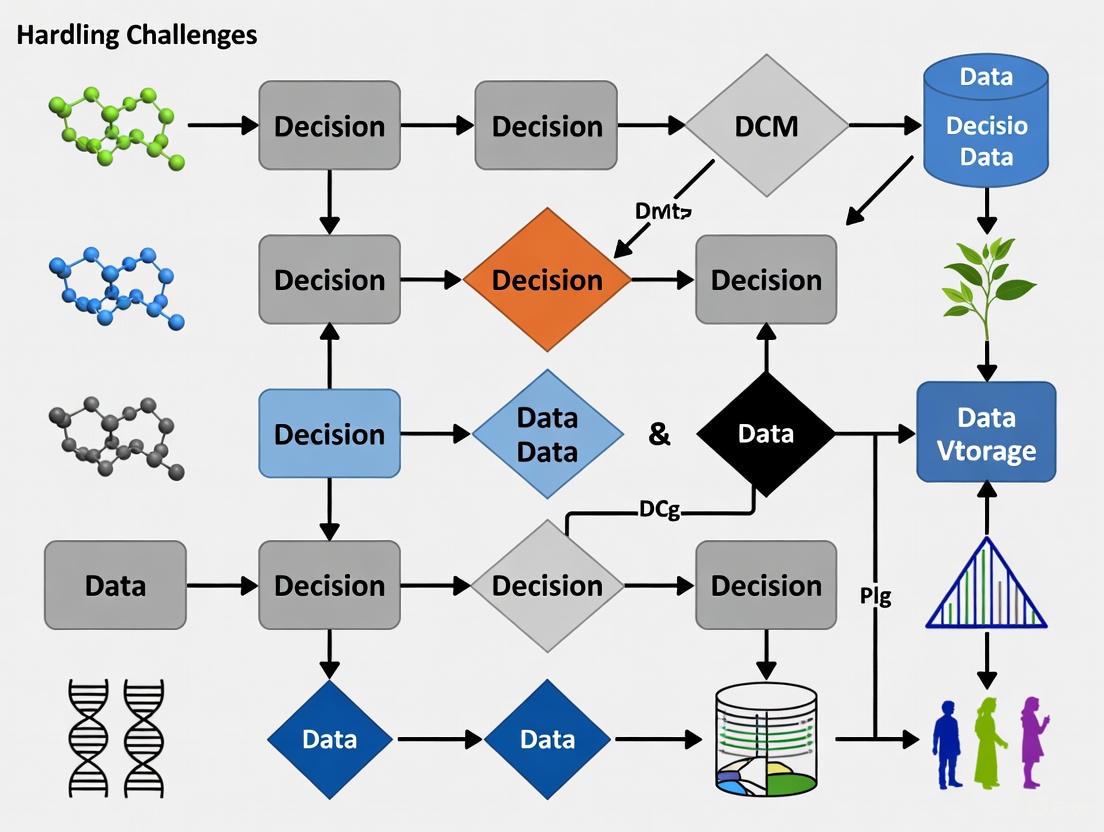
Visualizing the Big Data Challenges in Plant Phenotyping
The following diagram illustrates the logical relationships between the Three Vs, their drivers, and the solutions required to manage them in a plant phenotyping workflow.
Research Reagent Solutions: Essential Materials for HTPP
The following table details key hardware and software solutions essential for conducting high-throughput plant phenotyping (HTPP) research.
| Item Category | Specific Examples | Primary Function | Key Applications in HTPP |
|---|---|---|---|
| Platforms | Unmanned Aerial Vehicles (UAVs), Ground-Based Robotic Platforms (e.g., Scanalyzer [7]), Stationary Field Systems [8] | Automated, mobile, or fixed-position carriers for sensor deployment, enabling high-frequency, non-destructive data acquisition. [9] [10] | Large-scale field monitoring; precise, controlled-environment phenotyping. [8] [7] |
| Sensors | RGB, Multispectral (e.g., SMICGS [9]), Hyperspectral, Thermal, LiDAR, RGB-D Cameras [11] [10] | Capture various physical and chemical properties of plants across visible, non-visible, and 3D spatial domains. [9] [11] | Estimating biomass, chlorophyll content, water stress, canopy structure, and plant architecture. [9] [11] [7] |
| Computational Algorithms | Neural Radiance Fields (NeRF), SegVoteNet [12], Random Forest, other Machine/Deep Learning models (e.g., DarkNet53 [7]) | Process raw sensor data to reconstruct 3D models, segment plant organs, detect objects, and predict traits. [12] [9] | 3D canopy reconstruction, panicle detection, growth indicator modeling, and stress classification. [12] [9] [7] |
| Data Fusion & Registration Tools | Novel multimodal 3D registration algorithms [13], Multi-source sensor data fusion systems [10] | Align and integrate data from multiple sensors to create unified, information-rich datasets and correct for parallax. [13] [10] | Generating 3D multispectral point clouds, achieving pixel-precise alignment across camera modalities. [13] [10] |
Experimental Protocols for High-Throughput Phenotyping
Protocol 1: UAV-Based 3D Canopy Reconstruction and Panicle Phenotyping
This protocol outlines the methodology for efficient 3D reconstruction of sorghum canopies and phenotyping of panicle morphology using UAVs and advanced computer vision. [12]
- Data Acquisition: Employ a low-altitude UAV to capture videos (not just still images) of the crop canopy. This ensures efficient coverage and collects a continuous stream of data from multiple viewpoints. [12]
- 3D Model Generation: Process the video data using a Neural Radiance Fields (NeRF) algorithm. This deep learning technique generates high-quality, detailed 3D point clouds of the sorghum canopies from the 2D video frames. [12]
- Model Training & Semantic Segmentation:
- Create a synthetic, annotated dataset of 3D sorghum canopies to train deep learning models where real-world annotated data is scarce. [12]
- Employ the SegVoteNet model, a multi-task deep learning architecture that integrates VoteNet and PointNet++. This model is designed for semantic segmentation and 3D object detection directly on point cloud data. [12]
- The model's voting and sampling module leverages segmentation results to refine the generation of object proposals, improving the accuracy of detecting individual panicles. [12]
- Validation: Validate the model's performance using metrics like Mean Average Precision (mAP) at a 0.5 Intersection over Union (IoU) threshold. The referenced study achieved 0.850 mAP on real point cloud datasets. [12]
Protocol 2: Multimodal Image Registration for Plant Phenotyping
This protocol describes a method for accurately aligning images from different camera technologies, which is crucial for leveraging complementary data from multimodal systems. [13]
- Data Collection: Set up a system with multiple cameras (e.g., RGB, hyperspectral) along with a depth camera (e.g., Time-of-Flight camera) that provides 3D information for the scene. [13]
- Leverage Depth Information: Integrate the depth data into the registration process. This additional spatial information is key to mitigating parallax effects, a major challenge when aligning images taken from different viewpoints. [13]
- Occlusion Handling: Apply an integrated automated mechanism to identify and filter out various types of occlusions. This step minimizes registration errors caused by leaves or other plant parts hiding from the view of one camera but visible to another. [13]
- Registration Execution: Use a ray-casting-based algorithm to achieve pixel-precise alignment of the images from the different modalities. This method is not reliant on detecting plant-specific image features, making it robust across different plant species. [13]
Sensor Performance and Calibration Data
Calibration and validation are critical steps to ensure data quality. The following table summarizes key performance metrics from a novel sensor system.
| Calibration Parameter | Metric | Value/Outcome |
|---|---|---|
| Spectral Accuracy [9] | Max. deviation between preset and measured wavelengths | 0.43 nm |
| Crosstalk Correction [9] | Reflectance error (before vs. after correction) | Reduced from 26.49% to 6.47% |
| System Robustness [9] | Signal-to-Noise Ratio (SNR) | > 100 dB |
| Prediction Accuracy (Rice) [9] | R² for Above-Ground Biomass (AGB) | 0.93 |
| Prediction Accuracy (Rice) [9] | R² for Leaf Area Index (LAI) | 0.89 |
Troubleshooting Guides and FAQs
Data Acquisition & Sensor Issues
Q: My multispectral sensor data shows inconsistent reflectance values, even from the same plot. What could be wrong? A: This is often caused by spectral crosstalk and a lack of proper calibration.
- Solution: Implement a spectral crosstalk correction method. One study reduced reflectance errors from 26.49% to 6.47% by applying such a correction to a snapshot multispectral sensor. [9]
- Prevention: Regularly perform radiometric calibration using a standardized reference panel, especially when using snapshot sensors with mosaic filters. Ensure consistent sunlight conditions during data capture or use an integrated calibrated light source. [9]
Q: I am using multiple sensors, but the data does not align spatially, leading to flawed analysis. A: This is a classic multimodal registration problem, exacerbated by parallax in complex plant canopies.
- Solution: Integrate a 3D depth camera (e.g., Time-of-Flight) into your setup. Use a registration algorithm that leverages this 3D information and ray casting to achieve pixel-precise alignment across different camera modalities. This approach automatically detects and filters out occlusion effects. [13]
- Alternative Solution: For a robotic or UGV platform, develop a unified data fusion system that integrates RGB-D, multispectral, thermal, and LiDAR sensors with pre-calibrated extrinsic parameters to ensure synchronized and aligned data acquisition. [10]
Q: My UAV-based imagery is not producing high-quality 3D models for trait extraction. A: The issue may lie in the data capture method and processing algorithm.
- Solution: Instead of capturing still images, try collecting video data. Process this video with advanced reconstruction techniques like Neural Radiance Fields (NeRF), which are capable of generating high-fidelity 3D point clouds suitable for detailed phenotyping. [12]
Data Processing & Analysis Issues
Q: How can I accurately detect and count specific organs, like sorghum panicles, from 3D point cloud data? A: Traditional image processing methods may fail due to occlusion and complexity.
- Solution: Train a dedicated deep learning model like SegVoteNet on your 3D point clouds. This model performs semantic segmentation and 3D detection simultaneously. Its architecture uses a shared backbone and a voting mechanism that refines object detection based on segmentation results, achieving high precision (e.g., 0.850 mAP). [12]
- Pre-processing: If real annotated data is limited, consider building a 3D model to simulate your crop and generate a large, synthetic, annotated dataset for initial model training. [12]
Q: My AI model for stress detection is not generalizing well to new field data. A: This is typically due to insufficient or non-representative training data.
- Solution: Ensure you have a sufficiently large and varied dataset. A common guideline is to have at least 100 images per object class or genotype. [14] Employ data augmentation techniques or use a patch-based classification approach, which divides high-resolution images into smaller sub-regions to artificially increase the number of training samples. [14]
- Solution: Integrate multiple data sources. Fusing data from RGB, thermal, and multispectral sensors can create more robust models that capture a wider range of physiological responses, improving generalizability. [10] [7]
HTPP Experimental Workflow
The following diagram visualizes the core workflow and common troubleshooting points in a high-throughput plant phenotyping experiment.
High-throughput plant phenotyping (HTP) has emerged as a transformative tool in agricultural research, enabling the non-destructive, rapid assessment of plant traits across large populations using advanced imaging, sensors, and automated platforms [15] [8]. However, the immense data volumes generated by these technologies—from hyperspectral imagery, unmanned aerial vehicles, and IoT sensors—present significant bottlenecks in data storage, transfer, and management [16] [17]. These challenges complicate efforts to bridge the genotype-to-phenotype gap and develop climate-resilient crops [8]. Adhering to the FAIR principles—making data Findable, Accessible, Interoperable, and Reusable—is no longer optional but a scientific imperative to maximize research reproducibility, collaboration, and insight [18] [19]. This guide addresses common data management issues in HTP research, providing troubleshooting and protocols to overcome these hurdles.
Core Data Bottlenecks in HTP Research
The transition from data collection to actionable insight in HTP is fraught with technical challenges. The table below summarizes the primary bottlenecks and their practical implications for researchers.
Table 1: Key Data Management Bottlenecks in High-Throughput Plant Phenotyping
| Bottleneck Category | Specific Challenges | Impact on Research |
|---|---|---|
| Data Storage & Volume | Massive data flows from imaging sensors (RGB, hyperspectral, thermal); complex data types (3D point clouds, time-series) [16] [8]. | Overwhelmed storage infrastructure; difficulty in data centralization and backup; high costs [17]. |
| Data Transfer & Access | Moving large datasets from field to lab or between collaborators; data siloed in incompatible formats or systems [20]. | Delays in analysis; impeded collaboration and data sharing; failure to leverage collected data [19]. |
| Data Findability | Poor metadata practices; datasets not indexed in searchable resources; lack of persistent identifiers [19] [21]. | Inability for researchers (and machines) to discover existing datasets, leading to duplication of effort [18]. |
| Data Interoperability | Use of inconsistent data formats, vocabularies, and ontologies across labs and platforms [22] [20]. | Inability to integrate datasets for meta-analysis; errors in automated data processing [23]. |
| Data Reusability | Inadequate documentation about protocols, provenance, and data licensing [21] [20]. | Prevents validation of results and reuse of data in new studies, reducing the long-term value of research [18]. |
FAQs and Troubleshooting Guides
Data Storage and Handling
Q: Our phenotyping platform generates terabytes of image data. How can we manage storage costs without losing data?
A: Implementing a tiered storage strategy is key to balancing cost and accessibility.
- Issue: Raw data from hyperspectral and 3D sensors can quickly exhaust local server capacity [16].
- Solution:
- Immediate Tier (Hot Storage): Retain raw and actively processed data from current experiments on high-performance network-attached storage (NAS) or institutional servers.
- Intermediate Tier (Warm Storage): After primary analysis, move processed data (e.g., extracted trait measurements, analyzed images) to larger, more cost-effective storage systems.
- Archive Tier (Cold Storage): Use tape drives or cloud archive services (e.g., Amazon Glacier, Google Coldline) for raw data that must be kept for long-term preservation but is rarely accessed. Always keep derived, analysis-ready data more accessible than raw data volumes.
- Prevention: Plan storage needs and costs as part of your experimental design and grant proposals. Budget for data management as a necessary research cost [19].
Q: How can we efficiently centralize data from multiple sources (drones, field sensors, lab instruments)?
A: Dedicated agricultural trial management software is designed for this specific task.
- Issue: Manually merging data from spreadsheets, various image analysis outputs, and sensor feeds is error-prone and time-consuming [17].
- Solution: Utilize platforms like Bloomeo or GnpIS that support automated data integration via API feeds, flat file imports, and mobile app data entry [22] [17]. These systems structure data upon entry, linking it to the correct trial subplot and timestamp, which minimizes manual errors and speeds up the validation process.
- Prevention: Establish a data management plan before the experiment starts. Ensure all instruments and software can export data in a format compatible with your central system.
FAIR Data Implementation
Q: What are the most critical first steps to make our phenotyping data FAIR?
A: Focus on findability and reusability through rich metadata and persistent identifiers.
- Issue: Datasets with minimal description are effectively lost, even if stored, because they cannot be found or understood by others (or yourself in the future) [19].
- Solution:
- Create Rich Metadata: At a minimum, describe your dataset using the MIAPPE (Minimal Information About a Plant Phenotyping Experiment) standard, which covers experimental design, growth conditions, plant material, and observed variables [22].
- Use a Public Repository: Deposit your dataset in a repository such as FigShare, Dataverse, or a disciplinary repository like GnpIS that assigns a Digital Object Identifier (DOI). This makes your data findable and citable [22] [21].
- Apply a Clear License: Attach a license (e.g., Creative Commons) to your data so others know the terms of reuse [21].
Q: How can we ensure our data is interoperable with other studies?
A: Standardize your data using community-agreed vocabularies and formats.
- Issue: The same trait (e.g., "plant height") might be labeled and measured differently across studies, preventing integration [20].
- Solution:
- Use Ontologies: Describe traits and methodologies using terms from controlled vocabularies like the Crop Ontology (CO) or Plant Ontology (PO). For instance, instead of "plant height," use the formal ontology term (e.g.,
CO_323:0000010) with its precise definition [22]. - Adopt Standardized Protocols: Follow established phenotyping protocols where available. Document any custom protocols in detail.
- Use Open, Machine-Readable Formats: Store data in standardized, non-proprietary formats like CSV for tables or HDF5 for complex, hierarchical data, rather than in proprietary Excel formats [21].
- Use Ontologies: Describe traits and methodologies using terms from controlled vocabularies like the Crop Ontology (CO) or Plant Ontology (PO). For instance, instead of "plant height," use the formal ontology term (e.g.,
Data Transfer and Collaboration
Q: We need to share large HTP datasets with an international collaborator. What is the most effective method?
A: For large volumes, cloud-based repositories or high-speed transfer protocols are preferable to email or standard cloud drives.
- Issue: Files are too large for email attachments, and consumer cloud storage can be slow and unreliable for sync.
- Solution:
- Data Repository: The best practice is to use the same repository where your data is published (e.g., FigShare, Dataverse). This ensures version control and permanence.
- High-Speed Transfer Services: For unpublished data, use services like Globus, Aspera, or SCP which are designed for secure, high-speed movement of large scientific datasets.
- Prevention: Include data sharing plans and associated costs in your collaborative grant proposals.
Essential Research Reagent Solutions
The following tools and resources are critical for implementing effective and FAIR data management in HTP research.
Table 2: Key Reagents and Tools for FAIR Plant Phenotyping Data Management
| Tool / Resource | Function | Relevance to HTP Data Challenges |
|---|---|---|
| MIAPPE Standard | A metadata standard defining the minimal information required to describe a plant phenotyping experiment [22]. | Ensures Reusability by providing essential context about the experiment, plant material, and environment. |
| Crop Ontology (CO) | A set of controlled, standardized vocabularies for describing plant traits and measurement methods [22]. | Ensures Interoperability by allowing different systems and studies to unambiguously understand the meaning of traits. |
| Breeding API (BrAPI) | A standardized RESTful API specification for plant breeding data [22]. | Enables Accessibility and Interoperability by allowing different software tools and databases to communicate and exchange data seamlessly. |
| GnpIS / PHIS | Plant phenomics-specific data repositories [22]. | Provides a structured environment for data Storage, making data Findable (via indexing) and Accessible, while supporting FAIR principles. |
| Persistent Identifier (DOI) | A permanent unique identifier for a digital object, such as a dataset. | Makes data Findable and citable, ensuring it can always be located and credited, even if the underlying URL changes. |
| Dedicated Agronomy Software (e.g., Bloomeo) | Centralized platforms for managing agricultural trial data [17]. | Addresses data Storage and Transfer bottlenecks by providing a structured hub for data from multiple sources, streamlining validation and analysis. |
Experimental Workflow for FAIR HTP Data Management
The diagram below outlines a recommended experimental workflow, from data acquisition to publication, incorporating FAIR principles at every stage to mitigate bottlenecks.
The Impact of Unmanaged Data on Research Reproducibility and Breeding Cycles
Technical Support Center
Frequently Asked Questions (FAQs)
FAQ 1: What are the most common data-related causes of irreproducible results in high-throughput plant phenotyping (HTP) experiments? Irreproducible results often stem from inadequate metadata collection, improper data annotation, and a lack of standardized experimental protocols [24]. Without detailed metadata on environmental conditions and imaging sensors, it is impossible to recreate the experiment accurately. Furthermore, batch-to-batch phenotypic variation, even in highly standardized environments, is a significant but often unrecorded factor [25].
FAQ 2: How can we manage the massive volume of image data generated by HTP platforms without compromising data integrity? The key is implementing dedicated data management frameworks and standardized ontologies. Platforms like the Plant Genomics and Phenomics (PGP) repository and PIPPA (PSB Interface for Plant Phenotype Analysis) are designed to handle HTP data from the moment it is generated [24]. They facilitate proper data annotation, storage, and traceability, which are crucial for long-term data usability and sharing.
FAQ 3: Our multi-laboratory study produced conflicting results. How can we improve consistency in the future? Counterintuitively, embracing variability through systematic heterogenization in your experimental design can improve reproducibility. Studies show that implementing a multi-laboratory approach with as few as two sites significantly increases the reproducibility of findings without increasing the total sample size [25]. This approach tests the robustness of your results across diverse genetic and environmental backgrounds.
FAQ 4: What are the biggest pitfalls in analyzing HTP data, and how can we avoid them? A major pitfall is the high dimensionality of data, which can lead to spurious correlations and noise accumulation [26]. This occurs when unrelated covariates incidentally correlate with the outcome, leading to false discoveries. Using robust statistical methods designed for high-dimensional data, such as regularization and feature selection, is essential to mitigate this risk [26].
Troubleshooting Guides
Problem: Inconsistent phenotypic measurements across replicated experiments.
- Potential Cause: Unrecorded micro-environmental fluctuations or subtle differences in imaging sensor settings [25] [24].
- Solution:
- Systematize Metadata: Implement the Minimal Information About a Plant Phenotyping Experiment (MIAPPE) standard to ensure all environmental conditions, camera properties, and sample details are meticulously recorded [24].
- Introduce Controlled Variation: Design experiments across multiple independent batches or slightly varied conditions to ensure your findings are robust and not idiosyncratic to a single, highly specific environment [25].
Problem: Inability to integrate or compare your phenotyping data with public datasets.
- Potential Cause: Use of custom, non-standardized data formats and a lack of common ontologies for data annotation [24].
- Solution:
- Adopt Common Ontologies: Use established plant ontologies for trait naming and description.
- Utilize Public Repositories: Deposit and share data through structured repositories like AraPheno or the PGP repository, which encourage the use of standardized formats and vocabularies, enabling data fusion and meta-analysis [24].
Problem: High-dimensional phenotyping data leads to false positive associations.
- Potential Cause: Spurious correlations and incidental endogeneity, which are common in Big Data analysis [26].
- Solution:
- Apply Robust Statistics: Utilize statistical methods designed for high-dimensional data, such as penalized regression (e.g., Lasso) or sure independence screening, to reduce noise accumulation and improve variable selection [26].
- Independent Validation: Always validate identified features or markers using a hold-out validation dataset or through an independent replication study [26].
Data and Experimental Protocols
Table 1: Common High-Throughput Plant Phenotyping Platforms and Applications This table summarizes key HTP platforms, the traits they record, and their application in stress phenotyping, aiding researchers in selecting appropriate technology [1].
| Platform Name | Primary Traits Recorded | Crop Example(s) | Application in Stress Research |
|---|---|---|---|
| PHENOPSIS | Plant responses to soil water deficit | Arabidopsis thaliana | Drought stress analysis [1] |
| LemnaTec 3D Scanalyzer | Non-invasive trait screening | Rice (Oryza sativa) | Salinity tolerance traits [1] |
| GROWSCREEN FLUORO | Leaf growth, Chlorophyll fluorescence | Arabidopsis thaliana | Detection of multiple abiotic stress tolerances [1] |
| HyperART | Leaf chlorophyll content, Disease severity | Barley, Maize, Tomato, Rapeseed | Quantification of disease severity and leaf health [1] |
| PHENOVISION | Drought response traits | Maize (Zea mays) | Detection of drought stress and recovery [1] |
Table 2: Key Challenges of Big Data in Plant Phenotyping and Their Impacts on Breeding This table outlines core data challenges and how they directly impact the efficiency and success of breeding programs [26].
| Data Challenge | Impact on Research Reproducibility | Impact on Breeding Cycles |
|---|---|---|
| High Dimensionality & Noise Accumulation | Reduces statistical power; true signals are obscured by noise, leading to false negatives. | Slows down identification of reliable marker-trait associations, delaying selection. |
| Spurious Correlation | Generates false positive associations between traits and genetic markers. | Leads to breeding for incorrect traits, wasting time and resources on dead-end crosses. |
| Data Heterogeneity | Makes it difficult to combine datasets from multiple trials or locations, reducing statistical power. | Prevents effective genomic selection across environments, limiting genetic gain. |
| Heavy Computational Cost | Makes complex, robust analyses inaccessible, forcing researchers to use less rigorous methods. | Slows down the data analysis pipeline, preventing rapid, data-driven decisions in the field. |
Experimental Protocol: Implementing a Multi-Laboratory Phenotyping Study This protocol is designed to enhance reproducibility by systematically incorporating variation, based on the findings of Voelkl et al. as cited in [25].
- Objective: To validate the effect of a specific treatment (e.g., a new fertilizer or drought regimen) on plant growth.
- Design:
- Collaboration: Conduct the experiment simultaneously in at least two independent laboratories.
- Harmonization: Agree on a core set of protocols (e.g., treatment definition, primary outcome measure).
- Heterogenization: Allow for "real-world" variation in other factors (e.g., plant growth chamber models, minor variations in watering schedules, technicians).
- Data Collection:
- Standardized Metadata: All labs must adhere to the MIAPPE standard, rigorously recording all environmental and procedural metadata [24].
- Imaging: Use HTP platforms (e.g., from Table 1) to collect non-destructive image data over time.
- Data Analysis:
- Data Integration: Combine data from all laboratories, using the laboratory identifier as a blocking factor in the statistical model.
- Statistical Testing: Analyze the data using a mixed model that accounts for the variation introduced by the different laboratory environments. A treatment effect that remains significant across labs is considered robust and reproducible [25].
Workflow and Data Relationship Visualizations
HTP Data Impact on Breeding
Troubleshooting Data Issues
The Scientist's Toolkit: Research Reagent Solutions
Table 3: Essential Tools for Managing HTP Data
| Category | Item / Solution | Function |
|---|---|---|
| Data Management | MIAPPE Standards | Provides a checklist to ensure all critical experimental metadata is captured, enabling replication and data sharing [24]. |
| Data Repositories | AraPheno, PGP Repository | Centralized, structured databases for publishing and accessing plant phenotyping data, facilitating meta-analysis [24]. |
| Analysis Platforms | PlantCV, IAP | Open-source image analysis software that allows for customizable pipelines to extract phenotypic traits from HTP image data [24]. |
| Statistical Methods | Regularization (Lasso) | A class of regression analysis methods that reduces model complexity and mitigates false positives in high-dimensional data [26]. |
| Experimental Design | Multi-laboratory Trials | A study design that introduces systematic variation to test the robustness of findings, thereby enhancing reproducibility and external validity [25]. |
From Raw Data to Actionable Insights: Methodologies for Effective Data Management
Leveraging AI and Machine Learning for Automated Image Analysis and Trait Extraction
Technical Support Center
Troubleshooting Guides
Guide 1: Resolving Common Image Analysis Errors in GRABSEEDS
Problem: High rate of false positives in object (seed) identification due to noisy background. Solution: Adjust the sigma values for Gaussian de-noising within the Canny edge detector.
- Procedure:
- Access the command-line interface for GRABSEEDS.
- Increase the
sigmavalue (default is 1) to better handle background noise from materials like cloth. - If the issue persists, use the feature to change the background to a color that contrasts with the seed color [27].
Problem: Blurred edges in low-light conditions prevent proper object enclosure. Solution: Adjust the closing morphology kernel size to mend gaps in object outlines.
- Procedure:
- In the GRABSEEDS parameters, locate the closing morphology setting.
- Increase the
kernel size(default is 2 pixels) to close larger 'cracks' in the edges. - Be aware that increasing the kernel size also raises the risk of falsely connecting objects that are close together [27].
Problem: Failure to separate touching or overlapping seeds. Solution: Utilize the watershed segmentation feature or a deep learning model.
- Procedure:
- For moderately overlapping seeds, activate the
watershed segmentationfunction. This uses the furthest points from detected edges as markers to separate objects [27]. - For more complex cases, employ the integrated Segment Anything Model (SAM) by specifying the appropriate command-line flag. Note that this requires higher computational resources [27].
- For moderately overlapping seeds, activate the
Problem: Inaccurate text label recognition during batch processing. Solution: Leverage the consistent location of labels in batch images.
- Procedure:
- Use the image cropping function to define a specific area of the image that contains the text label.
- GRABSEEDS will then focus the Google tesseract-OCR engine on this pre-defined area, significantly speeding up and improving the accuracy of label extraction [27].
Table 1: GRABSEEDS Parameter Adjustments for Common Issues
| Problem | Key Parameter to Adjust | Default Value | Adjusted Value | Trade-off Consideration |
|---|---|---|---|---|
| Noisy background | Sigma (σ) in Canny edge detector | 1 | Increase (e.g., to 2 or 3) | May overlook smaller seeds due to increased smoothing [27]. |
| Blurred edges | Closing morphology kernel size | 2 pixels | Increase (e.g., to 3-5 pixels) | Risk of falsely connecting closely spaced objects [27]. |
| Incorrect object size | Minimum/Maximum size threshold | Not specified | Set based on known object size | Effectively filters out background noise mistakenly identified as targets [27]. |
Guide 2: Addressing Data Management and Model Performance Challenges
Problem: Inefficient or unsuccessful integration of multi-dimensional datasets from different sources (a core data challenge in plant phenotyping) [28]. Solution: Implement standardized data management and annotation practices.
- Procedure:
- Standardize Metadata: Create and use a common set of metadata descriptors for all images (e.g., growth stage, imaging conditions, stress treatment) [28].
- Centralize Data Storage: Utilize centralized data repositories that support rich metadata and are accessible to all collaborators [28].
- Systematic Annotation: For ground truth data, establish a clear protocol for manual annotation to ensure consistency across different annotators [29].
Problem: Limited availability of high-quality ground truth data for training deep learning models. Solution: Use Generative Adversarial Networks (GANs) to synthesize realistic training data.
- Procedure:
- Stage 1 - Image Augmentation: Use a model like FastGAN on your original RGB images to perform non-linear intensity and texture transformations, creating a larger set of augmented images [29].
- Stage 2 - Mask Generation: Train a conditional GAN (e.g., Pix2Pix) on a limited set of original RGB images and their corresponding manually created binary segmentation masks. Then, apply this trained model to the augmented RGB images from Stage 1 to automatically generate their segmentation masks [29].
- Validation: Manually annotate a subset of the generated images to calculate the Dice coefficient and validate the accuracy of the synthetic masks, which has been shown to range between 0.88 and 0.95 [29].
Problem: Poor performance of a YOLO-based model in detecting small plant structures (e.g., petioles) under varying stress conditions. Solution: Enhance the model architecture with modules that improve small-object detection.
- Procedure:
- Integrate AKConv: Incorporate Adaptive Kernel Convolution (AKConv) into the backbone's C3 module (C3k2) to enhance the model's ability to capture features from small and irregularly shaped objects [30].
- Redesign Feature Pyramid: Implement a recalibration feature pyramid detection head based on the P2 layer, which helps preserve fine-grained details from earlier feature maps that are crucial for detecting small structures [30].
- A study using this approach reported performance increases of 4.1% in recall, 2.7% in mAP50, and 5.4% in mAP50-95 for tomato phenotype recognition [30].
Frequently Asked Questions (FAQs)
FAQ 1: What are the most critical data management challenges when applying AI in plant phenotyping research?
Eight key data management challenges have been identified:
- Data Quality: Ensuring consistency and reliability of data from diverse sources and platforms [28].
- Data Integration: Combining multi-dimensional datasets (genomic, phenotypic, environmental) from different scientific approaches [28].
- Data Sharing: Facilitating the exchange of data across institutions and disciplines while respecting ethical and legal constraints [28].
- Metadata Standards: Developing and implementing validated, meaningful, and usable metadata descriptors [28].
- Data Curation: The labor-intensive process of annotating and maintaining large datasets, especially for ground truth generation [28] [29].
- Computational Infrastructure: Access to sufficient processing power and storage for large-scale AI model training and data analysis [28].
- Reproducibility: Ensuring that AI applications and analyses can be reliably reproduced, which depends on well-managed data and code [28].
- Workflow Management: Handling the complexity of integrated data analysis pipelines that span from data generation to model interpretation [28].
FAQ 2: My model performs well on validation data but poorly on new field images. What could be the cause?
This is a common issue often stemming from the domain shift between controlled validation environments and complex field conditions. Key factors include:
- Variable Lighting and Backgrounds: Field images have unpredictable illumination and cluttered backgrounds, unlike uniform lab settings [27] [30].
- Overfitting to Training Data: The model may have learned features specific to your training set (e.g., a particular background texture) that are not relevant in the field [28].
- Lack of Real-World Variability: Your training dataset may not encompass the full morphological and phenotypic diversity present in field conditions [30].
Mitigation Strategies:
- Use data augmentation techniques that specifically simulate field variations (e.g., random shadows, background swaps, noise injection) [30].
- Incorporate a diverse set of field images into your training and validation cycles.
- Consider using GANs to generate synthetic field images with accurate ground truth to expand your training dataset's domain coverage [29].
FAQ 3: How can I efficiently validate the accuracy of traits extracted by an automated image analysis tool like GRABSEEDS?
A multi-faceted validation approach is recommended:
- Visual Debugging: Use GRABSEEDS' built-in visual debugging tool, which generates a PDF document overlaying object contours, detected edges, and a list of identified objects on the original image for manual inspection [27].
- Comparison with Manual Measurements: Conduct a small-scale study where traits (e.g., seed count, leaf area) are measured manually and compared to the automated outputs using statistical metrics like correlation coefficients or mean absolute error [30].
- Geometric Analysis Validation: For traits like plant height calculated from bounding boxes, calculate the average relative error. For example, one deep learning-based study reported an average relative error of 6.9% for plant height and 10.12% for petiole count, which was deemed acceptable for non-destructive analysis [30].
Experimental Protocols & Workflows
Protocol 1: High-Throughput Phenotyping Pipeline for Stress Response Analysis
This protocol outlines a methodology for using automated image analysis to quantify plant phenotypic responses to abiotic stress (e.g., water stress).
1. Image Acquisition:
- Platform: Utilize high-throughput phenotyping platforms (e.g., LemnaTec systems) or standardized handheld imaging setups [31] [29].
- Settings: Maintain consistent lighting, camera angle, and resolution throughout the experiment. For time-series studies, images should be captured at regular intervals [30].
- Replication: Image multiple plants per treatment group to ensure statistical robustness.
2. Image Preprocessing:
- Format Standardization: Convert all images to a consistent format (e.g., PNG).
- Resizing: Resize images to a uniform dimension required by the analysis model (e.g., 1024x1024 pixels) [29].
- Normalization: Perform per-channel normalization of pixel values to a standard range (e.g., [0, 1]) [29].
3. Automated Trait Extraction with an Improved YOLO Model:
- Model Selection: Start with a base object detection model like YOLOv11n [30].
- Architectural Improvements:
- Trait Calculation: Use the bounding box information output by the model to calculate key phenotypic parameters through geometric analysis (e.g., plant height from the vertical bounding box axis) [30].
4. Data Integration and Statistical Analysis:
- Data Aggregation: Compile extracted traits into a structured data table.
- Stress Classification: Use the extracted traits as input features for machine learning classifiers (e.g., Random Forest, Support Vector Machine) to differentiate between stress conditions. Random Forest has been shown to achieve up to 98% accuracy in classifying water stress in tomatoes [30].
Workflow for Stress Response Phenotyping
Protocol 2: Generative Adversarial Training for Ground Truth Data Expansion
This protocol describes a two-stage GAN-based approach to generate synthetic plant images and their corresponding segmentation masks, addressing the data bottleneck.
1. Data Preparation:
- Seed Collection: Gather a limited set of original RGB plant images and their corresponding manually created binary segmentation masks (ground truth). Example sizes: 80-100 image-mask pairs [29].
- Preprocessing: Resize all images to a uniform size (e.g., 1024x1024 pixels) and normalize pixel values [29].
2. Stage 1: RGB Image Augmentation with FastGAN:
- Model: Train a FastGAN model on the original RGB images.
- Output: Generate a larger set of novel, realistic RGB plant images through non-linear intensity and texture transformations [29].
3. Stage 2: Segmentation Mask Generation with Pix2Pix:
- Model Training: Train a Pix2Pix conditional GAN on the paired original RGB images and their manual segmentation masks.
- Mask Synthesis: Apply the trained Pix2Pix model to the synthetic RGB images from Stage 1 to automatically generate their corresponding binary segmentation masks [29].
- Loss Function: Use Sigmoid Loss for efficient model convergence, which has been shown to achieve high Dice coefficients (0.94-0.95) [29].
4. Validation:
- Manual Annotation: Manually annotate a subset of the FastGAN-generated images to create a validation set.
- Accuracy Calculation: Compute the Dice coefficient between the Pix2Pix-predicted masks and the manual annotations for the validation set. Target accuracy: >0.88 Dice coefficient [29].
Two-Stage GAN Data Generation Workflow
The Scientist's Toolkit: Essential Research Reagents & Materials
Table 2: Key Software and Analytical Tools for AI-Based Plant Phenotyping
| Tool Name | Type/Function | Key Features | Application in Research |
|---|---|---|---|
| GRABSEEDS [27] | Image Analysis Software | Command-line tool for batch processing; extracts dimension, shape, and color traits; robust to variable lighting and overlapping objects. | Phenotyping of seeds, leaves, and flowers; QTL mapping and GWAS studies [27]. |
| PlantCV [27] | Image Analysis Toolkit | Comprehensive, flexible open-source toolkit for complex plant image analysis. | General-purpose plant phenotyping across laboratory and field conditions [27]. |
| YOLO Models (e.g., YOLOv11) [30] | Deep Learning Object Detection | Real-time performance; high accuracy for detecting small objects and complex plant structures; enables automated bounding-box-level trait extraction. | Automatic identification and counting of plant organs (leaves, petioles, fruits); structural phenotyping under stress [30]. |
| Pix2Pix & FastGAN [29] | Generative Adversarial Networks | FastGAN generates realistic RGB images. Pix2Pix generates segmentation masks from RGB images in a paired manner. | Automated generation of synthetic ground truth data to overcome the limited annotated data bottleneck [29]. |
| DIRT/3D [27] | Root Phenotyping Platform | Image-based 3D technology for phenotyping root architecture. | Non-destructive analysis of root system traits and their responses to environmental cues [27]. |
The Role of Cloud-Based Platforms and Data Hubs for Centralized Analysis
Technical Support Center: FAQs & Troubleshooting Guides
Frequently Asked Questions (FAQs)
Q1: How can we structure our research organization to best accelerate innovation using cloud platforms? Research leaders indicate that organizational change is often more complex than technological change. A successful strategy involves adopting agile operating models that differentiate research IT from central IT. Some institutions create dedicated hubs, such as the RMIT AWS Cloud Supercomputing Hub (RACE), to provide scalable High Performance Computing (HPC) services, freeing research IT staff from manual tasks to focus on enabling researchers [32].
Q2: How can we maintain open, collaborative research networks while meeting security and compliance requirements? The increase in cyber-attacks and the use of sensitive data in research necessitates robust governance. Data spaces are one solution, built with interoperability, data governance, and security in mind to facilitate organizing, accessing, and sharing data across different organizations and systems in a compliant manner [32].
Q3: What is the best way to create a consistent and seamless experience for researchers who are not cloud experts? There is a tension between making tools easy to use and training researchers to be cloud engineers. A solution is to use platforms like the Research and Engineering Studio on AWS (RES), which provides a web-based portal for administrators to create and manage secure cloud-based research environments. This allows scientists to visualize data and run interactive applications without needing deep cloud expertise [32].
Q4: How can we ensure our cloud adoption strategy is financially sustainable? Research institutions struggle to democratize cloud access in a financially sustainable way. Key practices include:
- Implementing FinOps: Using mechanisms to track project costs for both charge-back and show-back to ensure financial transparency [32].
- Utilizing Cost Tools: Leveraging frameworks like the Cloud Value Framework and Cost Optimization Flywheel for cost control and forecasting [32].
- Exploring Waivers: Investigating programs like the Global Data Egress Waiver to help predictably budget monthly cloud spend [32].
Q5: Our dataset was generated in a controlled environment. Will it work for field conditions? Models trained solely on controlled-environment data (e.g., greenhouses) may not perform accurately in the field. A dataset from a cloud-based automatic data acquisition system (CADAS) specifically notes this limitation. It is recommended to combine your controlled-environment dataset with field data to enhance model robustness and reduce performance gaps [33].
Troubleshooting Common Experimental Issues
Issue 1: Data Integration Errors from Multiple Sensors
- Problem: Inability to fuse data in real-time from multiple imaging sensors (e.g., RGB, spectral) on a phenotyping platform, leading to misaligned or unusable data.
- Solution: Implement a data registration and fusion method using established algorithms. One proven methodology involves using Zhang's calibration and a feature point extraction algorithm to calculate a homography matrix, which aligns the images. Experimental validation of this method shows a registration RMSE that does not exceed 3 pixels [34].
- Prevention: Ensure consistent sensor positioning and regular calibration checks as part of the experimental protocol.
Issue 2: "Camera Busy" Errors in Automated Image Acquisition Systems
- Problem: During automated, multi-camera image acquisition, the system throws a "camera busy" error, halting data collection.
- Solution: This is a known issue in systems like those using the gPhoto2 library. The solution implemented in the Cloud-based Automatic Data Acquisition System (CADAS) is to terminate the process identification number (PID) that is preventing the camera from operating within each capture loop. This reliably resolves the conflict [33].
- Prevention: Use a robust bash script that includes this PID termination step as a standard part of the image capture cycle.
Issue 3: Managing and Analyzing Extremely Large Phenotyping Datasets
- Problem: High-throughput phenotyping (HTP) platforms generate massive amounts of temporal and spatial data, impeding analysis and storage [1].
- Solution: Deploy a big data pipeline based on a robust architecture like the Lambda architecture. This is specifically designed for HTP data and can handle both real-time and batch processing for comprehensive analysis [35]. Furthermore, leverage machine learning (ML) and deep learning (DL) approaches to automatically extract useful information and phenotypes from these large datasets [1].
Experimental Protocols & Methodologies
Protocol 1: Cloud-Based Automatic Data Acquisition for Weed and Crop Imaging
This protocol details the methodology for setting up an automated system to capture plant images for deep learning-based weed detection [33].
- 1. Objective: To automate the acquisition of crop and weed images at fixed time intervals, accounting for different plant growth stages, thereby overcoming the labor-intensive nature of manual data collection.
- 2. Materials:
- Cameras: Twelve Canon EOS T7 and three EOS 90D visible spectrum digital cameras.
- Computer: A desktop computer (e.g., Dell with Intel Core i7 processor) running a Linux operating system, to act as the central control unit.
- Software: gPhoto2 image acquisition software (IAS) and a custom bash script.
- Storage: A 4TB external hard drive and an Amazon Web Services (AWS) S3 bucket for cloud storage.
- Connectivity: USB extension cables, a USB hub, and a Verizon wireless device for internet.
- Power: Power adapters for all cameras to enable continuous operation.
- 3. Method:
- System Setup: Mount the 15 cameras over the plant benches. Connect all cameras to the desktop computer via the USB hub and extension cables. Connect the external hard drive and ensure internet connectivity.
- Script Configuration: Develop and deploy a custom bash script on the control computer. The script should:
- Scan all cameras connected to the USB hub.
- Create a dedicated directory for each camera.
- In a loop for all 15 cameras, execute a command to capture an image.
- Terminate any process causing a "camera busy" error.
- Download the image to the local system.
- Move the image to the external hard drive and copy it to the AWS S3 bucket.
- Wait for a set time interval (e.g., 30 minutes) before repeating the loop.
- Data Post-Processing:
- Data Cleaning: Manually review the acquired images and remove poor-quality images from the dataset.
- Data Labeling: Use labeling software (e.g., Labelmg) on a single image from each day to designate each crop and weed plant as a distinct object, generating bounding box information.
- Automated Labeling: Use a Python script to automatically apply the labels from the reference image to all other images from that day, leveraging the fixed camera position.
- Image Cropping: Use a Python cropping script with the labeled text files to create individual, class-specific images of crops and weeds.
Protocol 2: High-Throughput Field Phenotyping using a Gantry-Style Robot
This protocol describes the use of an adjustable phenotyping robot for high-throughput data collection in field conditions [34].
- 1. Objective: To perform non-destructive, high-throughput phenotyping in both dry and paddy fields, adapting to different row spacing and carrying a high-payload sensor gimbal.
- 2. Materials:
- Phenotyping Robot: A gantry-style chassis with an adjustable wheel track (1400–1600 mm).
- Sensor Gimbal: A six-degree-of-freedom gimbal with high payload capacity, allowing precise height (1016–2096 mm) and angle adjustments.
- Imaging Sensors: Multiple integrated imaging sensors (e.g., RGB, hyperspectral).
- 3. Method:
- Robot Calibration: Adjust the robot's wheel track to match the row spacing of the experimental field to minimize crop damage.
- Sensor Registration and Fusion:
- Use Zhang's calibration method to calibrate each imaging sensor.
- Employ a feature point extraction algorithm to identify common points across the different sensor images.
- Calculate a homography matrix to enable the registration and fusion of data from the multiple sensors.
- Data Acquisition: Navigate the robot to fixed positions within the field. At each position, adjust the gimbal's height and angle as required, and trigger the multi-sensor data acquisition system.
- Validation: Validate the data quality by comparing the robot's sensor readings with handheld instruments. A strong correlation (e.g., r² > 0.90) confirms practicality and reliability.
Data Presentation
Quantitative Market Data for Plant Phenotyping
Table 1: Global Plant Phenotyping Market Forecast [36]
| Metric | Value (2025) | Value (2035) | Compound Annual Growth Rate (CAGR) |
|---|---|---|---|
| Market Size | USD 216.7 Million | USD 601.7 Million | 11.0% |
Table 2: Plant Phenotyping Market CAGR by Segment (2025-2035) [36]
| Segment | Example Technology | Projected CAGR |
|---|---|---|
| Sensors | Hyperspectral & Multispectral Sensors | 12.8% |
| Software | Data Management & Integration Software | 12.5% |
| Equipment | Growth Chambers / Phytotrons | 11.8% |
Table 3: Key Regional Focus Areas in Plant Phenotyping [36]
| Region | Primary Investment Focus | Key Driver |
|---|---|---|
| USA | AI-driven automation and high-throughput imaging. | Speed and precision for crop breeding. |
| Western Europe | Multi-sensor fusion and carbon-neutral technologies. | EU Green Deal and sustainability policies. |
| Japan / South Korea | Compact, cost-effective, lab-scale systems. | Space efficiency and affordability. |
Workflow Visualization
Data Flow in a Cloud-Based Phenotyping System
Cloud phenotyping data workflow.
High-Throughput Phenotyping Protocol
Automated image acquisition protocol.
The Scientist's Toolkit
Essential Research Reagents & Platforms
Table 4: Key Platforms and Software for Plant Phenotyping
| Item Name | Category | Function / Description |
|---|---|---|
| LemnaTec Scanalyzer System | High-Throughput Platform | An automated platform used for non-invasive, high-throughput phenotyping of various stresses in controlled environments [1]. |
| gPhoto2 Library | Software Library | A set of software applications and libraries for controlling digital cameras on Unix-like systems, enabling automated image capture [33]. |
| Labelmg | Software Tool | Used for the manual labeling and annotation of images to generate bounding box information for object detection models [33]. |
| Research & Engineering Studio (RES) on AWS | Cloud Platform | An open-source, web-based portal that allows administrators to create and manage secure cloud-based research environments without requiring deep cloud expertise from scientists [32]. |
| Hyperspectral Sensors | Sensor | Advanced sensors that capture data across many wavelengths, used for detecting plant health, chlorophyll content, and disease stress non-invasively [36]. |
FAQs and Troubleshooting for Plant Phenotyping Data Management
This technical support center addresses common challenges researchers face when implementing data standards in high-throughput plant phenotyping. These questions and solutions are framed within the broader context of overcoming data handling challenges to ensure findable, accessible, interoperable, and reusable (FAIR) data.
FAQ 1: What is the first step to make my phenotyping data MIAPPE-compliant?
Answer: The foundational step is to collect the minimum required metadata about your study. MIAPPE v1.2 provides a clear checklist for this purpose [37]. The core information you must provide includes:
- Study Description: A clear title, unique identifier, and description of the study [38].
- Investigation Details: The associated investigation's unique ID, title, and contact information [38].
- Experimental Context: The study's start and end date, geographic location (country, site, latitude, longitude), and a description of the growth facility [38].
- Biological Material: Unambiguous information about the germplasm (e.g., genotype, species) used in the experiment [39].
- Data File Links: A clear link and description for the data file generated by the study [38].
FAQ 2: My data is spread across multiple files and formats. How can PHIS help integrate it?
Answer: The Phenotyping Hybrid Information System (PHIS) is specifically designed to integrate multi-source and multi-scale data through its ontology-driven architecture [39]. Its key features address integration challenges:
- Unambiguous Identification: PHIS assigns unique identities to all objects in an experiment (e.g., plants, sensors, plots) and establishes their relationships using ontologies and semantics [39].
- Event Association: It links events, such as plant positions or annotations, to the relevant objects, making them easily traceable [39].
- Web Service Interoperability: PHIS can interoperate with external resources via web services, allowing data to be integrated into modeling platforms or other databases [39].
Troubleshooting Guide: If you encounter issues while importing data into PHIS, use the provided OpenSILEX Python tool, which offers programmable methods for creating experiments and importing data, ensuring consistency and saving time [40].
FAQ 3: I am using ISA-Tab. How do I correctly represent my experimental design for a field trial?
Answer: In the ISA-Tab format, the experimental design is primarily described in the Investigation file's "Study Design Descriptors" section [38].
- Step 1: In the
Study Design Typefield, provide a term from a controlled ontology. For a field trial, you would use a class from the Crop Research Ontology (CO), such asCO_715:0000145for a "complete block design" [38]. - Step 2: Use the
Comment[Study Design Description]field to provide a detailed, human-readable description of the design (e.g., "Lines were repeated twice at each location using a complete block design...") [38]. - Step 3: Define your
Observation Unit Level Hierarchy(e.g., field > block > plot > plant) and describe theObservation Unitin the respective comment fields [38].
FAQ 4: What are the most common data quality issues in phenotyping, and how can I fix them?
Answer: High-throughput phenotyping generates vast amounts of data that are prone to specific quality issues. The table below summarizes common problems and their solutions.
| Data Quality Issue | Description | Recommended Solution |
|---|---|---|
| Duplicate Data | Redundant records from multiple sources or system silos that skew analytics [41]. | Implement rule-based data quality management and de-duplication tools to detect and merge records [42]. |
| Non-Standardized Data | Inconsistent formats, units, or terminologies across data sources hamper analysis [42]. | Enforce standardization at the point of collection. Specify required formats and naming conventions [42]. |
| Missing Values | Gaps in the data that can severely impact analyses and lead to misleading insights [42]. | Employ data imputation techniques to estimate missing values or flag gaps for future collection [42]. |
| Outdated Information | Data that decays over time and misguides strategic decisions [41]. | Establish a regular data update schedule and use automated systems to flag old data for review [42]. |
| Inaccurate Data | Typos, misinformation, or incorrect entries that lead to flawed insights [42]. | Implement validation rules and data verification processes during data entry [42]. |
FAQ 5: How do PHIS, MIAPPE, and ISA-Tab work together?
Answer: These standards and tools form a complementary ecosystem for managing phenotyping data.
- MIAPPE is the content standard. It defines what metadata and data need to be reported to adequately describe a phenotyping experiment [37].
- ISA-Tab is a data exchange format. It is one of the implementations that can be used to structure and format your data and metadata according to the MIAPPE specification in a plain-text, tab-delimited format [38] [43].
- PHIS is an active information system. It is an ontology-driven platform that you can use to manage your experiments, integrating both the MIAPPE-standardized metadata and the actual phenotypic data, and making them accessible via a web interface and APIs [39] [40].
The following workflow diagram illustrates how these components interact in a typical data management pipeline.
Standardized Experimental Protocols for Data Collection
Adopting standardized protocols is critical for ensuring the consistency, reproducibility, and reusability of phenotyping data. Below are detailed methodologies for key experiments cited in the field.
Protocol 1: Canopy Height Estimation using UAS and SfM-MVS
This protocol details the high-throughput estimation of canopy height, a key architectural trait [44].
- 1. Experimental Setup: Establish ground control points (GCPs) throughout the field for georeferencing and model accuracy validation.
- 2. Image Acquisition: Use a UAS (drone) equipped with a high-resolution RGB camera. Fly the UAS over the field plot at a consistent altitude to capture overlapping images (≥80% front and side overlap) throughout the growing season. Conduct flights at consistent times of day to minimize shadow effects.
- 3. 3D Reconstruction: Upload the images to a photogrammetric software suite (e.g., Agisoft Metashape). Use the Structure from Motion and Multi-View Stereo (SfM-MVS) algorithm to generate a dense 3D point cloud of the canopy and a digital elevation model (DEM) of the ground surface.
- 4. Height Calculation: Generate a digital surface model (DSM) from the canopy point cloud. Subtract the DEM from the DSM to create a crop surface model (CSM), where each point represents the height of the canopy above the ground [44].
- 5. Data Output: The CSM provides a raster map of canopy height. Average values can be extracted for individual plots for statistical analysis and genotype comparison.
Protocol 2: Canopy Coverage Analysis using EasyPCC
This protocol measures canopy coverage, an indicator of crop growth and ground cover, using a robust segmentation method [44].
- 1. Image Collection: Capture high-resolution RGB images of the plots using a UAS or a ground-based vehicle. Ensure images are taken under uniform lighting conditions where possible.
- 2. Segmentation Model Application: Process the images using the EasyPCC application, which is based on the Decision Tree Segmentation Model (DTSM). This machine learning-based method is robust to varying illumination and shadows [44].
- 3. Pixel Classification: The DTSM classifies each pixel in the image as either "plant" or "background" (soil, etc.).
- 4. Coverage Calculation: The software calculates the percentage of "plant" pixels relative to the total number of pixels in the region of interest (e.g., a single plot).
- 5. Data Output: The primary output is a quantitative canopy coverage percentage for each plot. By conducting sequential imaging, a growth curve can be constructed to track development over time [44].
The following table details key resources and tools essential for implementing data standards in plant phenotyping research.
| Resource/Tool | Function |
|---|---|
| MIAPPE Checklist | The core specification document that provides a list of mandatory and recommended metadata to describe a phenotyping experiment [37]. |
| ISA-Tab Templates | Pre-formatted text file templates (Investigation, Study, Assay) that guide the structured reporting of MIAPPE-compliant metadata and data [38]. |
| PHIS (Phenotyping Hybrid Information System) | An open-source, ontology-driven information system for integrating, managing, and sharing multi-source phenotyping data from field and controlled conditions [39]. |
| Breeding API (BrAPI) | A standardized web service API that facilitates interoperability between different phenotyping databases and tools, and implements MIAPPE standards [37] [43]. |
| OpenSILEX Python Tool | A programmable tool for interacting with the PHIS system, allowing researchers to create experiments and import data via scripts for automation [40]. |
High-throughput phenotyping (HTP) using unmanned aerial vehicles (UAVs) has emerged as a transformative technology for plant research and breeding, capable of generating massive volumes of spectral and imagery data across large experimental areas [45] [46]. While this approach enables rapid, non-destructive measurements of plant health, architecture, and physiology, it simultaneously creates significant data handling challenges that can bottleneck research progress [47] [14]. The integration of robust data analytics pipelines with UAV-based data collection is therefore not merely advantageous but essential for translating raw sensor data into biologically meaningful insights.
This case study examines the successful implementation of an end-to-end phenotyping pipeline within a wheat breeding program, focusing specifically on the data management架构 and troubleshooting strategies employed to overcome common integration challenges. The methodologies and solutions presented serve as a replicable model for researchers facing similar hurdles in managing the complex data lifecycle from acquisition to analysis in high-throughput plant phenotyping research.
Experimental Framework & Design
Plant Materials and Growth Conditions
The case study involved a wheat mapping population consisting of 180 recombinant inbred lines (RILs) developed from a cross between the heat-tolerant 'Halberd' and moderately heat-susceptible 'Len' cultivars [46]. These were planted in an alpha lattice design with two replications, creating 364 individual plots. The experiment was conducted under both well-watered (WW) and drought (DR) conditions to evaluate drought resistance traits, with soil moisture content monitored regularly throughout the reproductive growth stages (jointing, heading, flowering, and grain filling) [45].
UAV Platform and Sensor Configuration
The data acquisition platform utilized a UAV equipped with multiple sensors to capture different aspects of plant physiology and structure:
- Multispectral sensors for capturing vegetation indices related to canopy structure, chlorophyll content, and water status
- RGB sensors for high-resolution color imagery and morphological assessment
- LiDAR for creating detailed 3D structural models of plant architecture [46]
Flights were conducted regularly throughout the growing season with careful attention to flight altitude, image overlap, and sensor calibration to ensure consistent, high-quality data collection [48].
Data Analytics Pipeline Architecture
The integrated analytics pipeline transformed raw UAV data into actionable insights through a multi-stage process:
Key Research Reagents and Computational Tools
Table 1: Essential research reagents and computational tools for UAV-based phenotyping pipelines
| Category | Specific Tool/Platform | Function in Pipeline | Application Example |
|---|---|---|---|
| UAV Platforms | DJI Enterprise Drones | Reliable flight platform for sensor deployment | Consistent data acquisition across growing season [48] |
| Sensor Technologies | Multispectral, RGB, LiDAR | Capture canopy structure, color, and reflectance | Measuring vegetation indices (NDVI, EVI, NDRE) [45] [46] |
| Data Management | Laboratory Information Management Systems (LIMS) | Centralized data repository and version control | Creating single source of truth for experimental data [47] |
| Analytical Software | R, Python with scikit-learn | Statistical analysis and machine learning implementation | Yield prediction models from spectral features [45] [49] |
| Cloud Platforms | Hiphen Cloverfield, Custom solutions | Data processing, storage, and collaboration | Automated extraction of agronomic traits from UAV imagery [48] |
Implementation Challenges and Troubleshooting Guide
Frequently Asked Questions (FAQs)
Table 2: Common technical challenges and their solutions in UAV phenotyping workflows
| Challenge Category | Specific Issue | Root Cause | Solution | Preventive Measures |
|---|---|---|---|---|
| Data Acquisition | Insufficient image resolution for analysis | Incorrect flight altitude or sensor choice | Reflight with optimized parameters | Calculate ground sampling distance pre-flight; match sensor to trait [48] |
| Data Quality | Inaccurate georeferencing between timepoints | Lack of permanent Ground Control Points (GCPs) | Implement stable, surveyed GCPs | Place and maintain GCPs before first flight; use RTK/PPK GPS [48] |
| Data Processing | Gaps in field maps (orthomosaics) | Inadequate front/side overlap (e.g., <70%) | Reacquire data with proper overlap (80/70% recommended) | Validate flight parameters using mission planning software [48] |
| Sensor Configuration | Inconsistent vegetation indices across dates | Varying weather conditions and sun angles | Use radiometric calibration panels | Include calibration targets in every flight; standardize timing [48] |
| Data Integration | Difficulty correlating spectral and yield data | Lack of standardized data formats and metadata | Implement unified data governance policies | Create data dictionaries and metadata standards early in project [47] |
Q1: How can we ensure consistent data quality when multiple operators conduct UAV flights throughout a long-term experiment?
A1: Standardization is critical for multi-operator experiments. Implement a comprehensive drone acquisition protocol document that specifies all flight parameters, including altitude, overlap, sensor settings, and weather limitations. The Hiphen Academy recommends establishing a standardized workflow including:
- Pre-flight checklists for equipment and settings
- Fixed ground control point (GCP) positions maintained throughout the experiment
- Radiometric calibration before each flight campaign
- Centralized storage with version control for all mission planning files [48]
Q2: What specific vegetation indices have proven most reliable for predicting grain yield in wheat under drought conditions?
A2: Research identified 17 UAV-based spectral indices strongly correlated with yield stability under drought. The most effective included:
- Normalized Difference Vegetation Index (NDVI): Strong correlation with grain yield in determinate wheat groups [46]
- Enhanced Vegetation Index (EVI): Effective for yield prediction while reducing saturation effects [45]
- Normalized Difference Red Edge (NDRE): Superior for assessing crop nitrogen status and photosynthetic activity [45]
- Excess Greenness Index (ExG): Valuable for biomass estimation and yield modeling [45]
Q3: How can we manage the large volumes of data generated by weekly UAV flights over multiple field sites?
A3: Effective data management requires both technical and organizational strategies:
- Technical: Implement a Laboratory Information Management System (LIMS) or Electronic Lab Notebook (ELN) as a single source of truth, which has been shown to improve data retrieval times by 30% and collaborative efficiency by 20% [47]
- Organizational: Establish clear data governance policies defining storage, access rights, and metadata requirements from project inception
- Computational: Utilize automated data validation and remediation processes, which can reduce data errors by 25-30% [47]
Results and Validation of the Integrated Approach
Pipeline Performance and Biological Insights
The integrated UAV-analytics pipeline successfully identified drought-resistant wheat genotypes through machine learning analysis of temporal vegetation patterns [45]. Key performance outcomes included:
- High heritability estimates for HTP traits confirmed their genetic control and suitability as selection criteria [49]
- Strong correlations between UAV-derived traits measured at headrow stage and final grain yield in replicated trials [49]
- Accurate prediction of grain yield using machine learning models trained on spectral indices, enabling indirect selection for yield years earlier than traditional methods [45] [49]
- Identification of novel drought response spectral indices that provided precise evaluation of drought resistance [45]
The pipeline particularly excelled at characterizing the stay-green (SG) trait, a key factor for improving grain quality and yield under terminal drought conditions by prolonging photosynthetic activity during reproductive stages [46]. The determinate group of wheat lines exhibited a positive correlation between NDVI and grain yield, while indeterminate lines showed no significant relationship, demonstrating the importance of combining appropriate genetics with advanced phenotyping [46].
Workflow Integration for Genetic Analysis
This case study demonstrates that successful integration of UAV-based phenotyping with analytics pipelines requires addressing both technical and organizational challenges. Based on our implementation experience, we recommend these best practices:
Establish Data Standards Early: Define metadata requirements, naming conventions, and quality metrics before data collection begins to prevent reconciliation issues [47]
Implement Robust Governance: Create clear data management policies covering storage, access, sharing, and archival, which can reduce data-related risks by 35-40% [47]
Validate with Ground Truthing: Maintain a program of traditional measurements alongside UAV data collection to validate automated phenotyping approaches [45] [46]
Plan for Computational Workload: Allocate sufficient computational resources for data processing, as photogrammetry and machine learning algorithms require substantial processing power and storage [45] [14]
The integrated pipeline proved highly effective for identifying drought-resistant wheat genotypes, predicting yield potential, and understanding the genetic basis of complex traits. This approach demonstrates how resolving data handling challenges in high-throughput phenotyping can significantly accelerate crop improvement programs and enhance our understanding of plant responses to environmental stresses [45] [49] [46].
Solving Real-World Hurdles: Strategies for Data Complexity and Cost
Overcoming High Initial Investment and Maintenance Costs
Frequently Asked Questions (FAQs)
FAQ 1: What are the main cost components of a high-throughput phenotyping (HTP) system? The costs extend beyond the initial hardware purchase. Major investments include the acquisition of automated conveyor belts or gantries, controlled imaging stations, sensors, data storage infrastructure, and the software pipelines required to process raw sensor data into analyzable traits. Ongoing maintenance and the significant human resources required for operation and data analysis also constitute a major part of the total cost [50] [51].
FAQ 2: Is low-cost sensor technology a viable way to reduce initial investment? Yes, the development of low-cost environmental sensors, smartphone-embedded imaging, and mobile imaging sensors has made "affordable phenotyping" more accessible [52]. However, it is crucial to consider the total cost of the phenotyping process. Low-cost hardware might be suitable for small-scale diagnostics, but for large-scale experiments requiring repeated measurements, the additional human effort needed to analyze poorly calibrated data can lead to higher overall costs and reduce the interpretability of the results [52].
FAQ 3: How can we maximize the return on investment (ROI) for an HTP platform? To optimize ROI, carefully tailor the system to your specific research questions [51]. Reusing existing data analysis pipelines from previous projects can drastically reduce implementation costs to 10–20% of the original development cost [50]. Furthermore, leveraging shared, high-quality public datasets for tool development and validation can supplement in-house data collection and accelerate research without additional experimental costs [50].
FAQ 4: What are the common data management challenges with HTP, and how can they be addressed? HTP generates vast, multi-dimensional data from various sensors [17]. Key challenges include centralizing this data, associating it with the correct trial plots, and managing its volume in real-time. Using dedicated agricultural data management software or database systems with API integrations is essential, as managing these datasets in spreadsheets is often impractical and prone to error [17].
FAQ 5: Why is data standardization important for cost-efficiency? A lack of interoperability between processing tools and analysis models prevents the research community from efficiently reusing data pipelines [50]. Adopting standardization guidelines like the Minimum Information About a Plant Phenotyping Experiment (MIAPPE) and the Breeding API (BrAPI) is a crucial step in making HTP datasets reusable data assets, which reduces future costs for data integration and tool development [50].
Troubleshooting Guides
Issue 1: Inaccurate Biomass Estimation from Top-View Images
Problem: Plant size estimates (often used as a proxy for biomass) from top-view cameras show significant deviations (over 20%) throughout the day, and linear calibration curves to actual biomass still show large errors despite a high r² value (>0.92) [51].
Solution:
- Diagnose Diel Leaf Movement: Monitor plants at the same time each day to minimize the impact of diurnal leaf movement (nyctinasty). Be aware that leaf angle changes can cause substantial variation in projected leaf area (PLA) without any change in actual biomass [51].
- Apply Correct Calibration: Do not assume a simple linear relationship between projected leaf area and total leaf area or biomass. For rosette species, this relationship is often curvilinear. Use a calibration curve that accounts for this, such as a model with a quadratic term or a ln-transformation of the variables [51].
- Validate Calibration Frequency: Determine if different treatments (e.g., drought stress), seasons, or genotypes require distinct calibration curves. A single calibration may not be valid across all experimental conditions [51].
Issue 2: High Costs of Data Processing and Analysis Pipeline Development
Problem: Developing a custom software pipeline for processing raw HTP sensor data into usable traits constitutes a major part of the platform's adoption cost [50].
Solution:
- Leverage Existing Tools: Before building a new pipeline, investigate and utilize existing image analysis and data processing tools from the community to avoid "re-inventing the wheel" [50].
- Design for Reusability: When custom development is necessary, design pipeline components with interoperability in mind. Use standardized data formats and semantics (ontologies) for input and output files to ensure that parts of the pipeline can be reused in future projects, reducing the cost of subsequent implementations by 80-90% [50].
- Utilize Benchmark Datasets: Use publicly available HTP benchmark datasets to assess and validate the performance of your tools. This helps identify limitations early and ensures the pipeline is robust before applying it to valuable experimental data [50].
Issue 3: Choosing Between Active and Passive 3D Phenotyping Methods
Problem: Difficulty selecting the appropriate 3D imaging technology due to trade-offs between cost, accuracy, and deployment environment [53].
Solution: Refer to the following decision table to evaluate the key characteristics of each method:
| Feature | Active 3D Imaging (e.g., LiDAR, Structured Light) | Passive 3D Imaging (e.g., Multi-view RGB Photogrammetry) |
|---|---|---|
| Technology Principle | Uses emitted laser/light patterns (e.g., triangulation, Time-of-Flight) [53] | Relies on ambient light and multiple 2D images [53] |
| Typical Equipment Cost | High (specialized scanners like LiDAR) to Medium (consumer Kinect) [53] | Low (uses standard RGB cameras) [53] |
| Data Accuracy/Quality | High precision and accuracy [53] | Varies; can be high but depends on processing [53] |
| Computational Processing | Lower; often provides direct 3D point clouds [53] | High; requires significant computation for 3D reconstruction [53] |
| Best Suited Environment | Controlled lighting; can be used in low-light [53] | Well-lit, controlled or field environments [53] |
| Example Application | High-precision organ-level measurement [53] | Canopy structure, growth tracking over time [53] |
Workflow for Cost-Optimized HTP Implementation
The following diagram illustrates a logical workflow for planning and implementing an HTP strategy that addresses cost challenges.
The Scientist's Toolkit: Key Research Reagent Solutions
The table below details essential "reagents" in the context of HTPP—the core sensor technologies and data solutions that enable research.
| Item / Solution | Function in HTPP Research |
|---|---|
| RGB Sensors | Standard color cameras used to capture basic morphological data, plant size, and development from visible light [17]. |
| Multi/Hyperspectral Sensors | Capture light in specific or hundreds of narrow spectral bands; used to detect abiotic stress, nitrogen content, and calculate vegetation indices like NDVI [50] [17]. |
| Thermal Imaging Sensors | Measure canopy temperature as a proxy for stomatal conductance and water stress levels in plants [17]. |
| 3D Imaging (LiDAR/Photogrammetry) | Reconstructs plant geometry to accurately measure biomass, leaf area, and complex architectural traits, overcoming limitations of 2D imaging [53]. |
| Public Benchmark Datasets | Standardized, high-quality phenotypic datasets used to validate new analysis tools, compare performance, and supplement in-house data without additional experimental cost [50]. |
| MIAPPE/BrAPI Standards | Standardization frameworks and APIs that ensure phenotypic data is well-annotated and interoperable, turning it into a reusable long-term asset and reducing future data integration costs [50]. |
Addressing Data Management Complexity and the Need for Specialized Expertise
High-throughput plant phenotyping (HTPP) has revolutionized plant science by enabling non-destructive, automated evaluation of thousands of plants for traits like size, development, and physiological status [51]. However, this technological advancement brings significant data management challenges that require specialized expertise to overcome. Modern HTPP systems generate massive volumes of data from diverse sensors including RGB cameras, hyperspectral imagers, and thermal sensors, creating complexities in data storage, processing, and interpretation [15]. The transition from traditional manual measurements to automated high-throughput approaches has shifted the research bottleneck from data collection to data management and analysis [51]. This article establishes a technical support framework to help researchers navigate these complexities through targeted troubleshooting guides, FAQs, and standardized protocols essential for robust phenotyping research.
Troubleshooting Guides: Common Data Management Challenges
Data Quality and Calibration Issues
Problem: Inconsistent data quality across imaging sessions
- Symptoms: Unexplained variations in measured plant traits, inconsistent results between replicates, drifting measurements over time.
- Root Causes: Changing lighting conditions, sensor calibration drift, environmental fluctuations, improper imaging setup.
- Solutions:
- Implement regular calibration protocols: Establish scheduled calibration for all imaging sensors using standardized reference materials [51].
- Utilize color and size references: Include color cards and size markers in every imaging session to enable post-acquisition normalization and correction [54].
- Standardize imaging conditions: Maintain consistent distance, angle, and lighting across all imaging sessions through automated positioning systems.
- Establish quality control checkpoints: Implement automated quality checks for focus, exposure, and contrast immediately after image capture.
Problem: Inaccurate trait extraction from sensor data
- Symptoms: Poor correlation between destructive and non-destructive measurements, implausible growth curves, high variability between technical replicates.
- Root Causes: Incorrect segmentation algorithms, inappropriate vegetation indices, diurnal plant movements, suboptimal processing parameters.
- Solutions:
- Validate with destructive measurements: Regularly correlate non-destructive measurements with traditional destructive analyses to verify accuracy [51].
- Account for diurnal variations: Schedule imaging at consistent times to minimize effects of diurnal leaf movements that can cause >20% deviation in size estimates [51].
- Optimize segmentation approaches: Test multiple segmentation methods (thresholding, background subtraction, machine learning) to identify the most robust approach for your specific plant system and growth stage [54].
Data Management and Integration Challenges
Problem: Managing massive phenotyping datasets
- Symptoms: Difficulty locating specific datasets, storage capacity overload, slow data processing, inability to share data effectively.
- Root Causes: Lack of standardized file naming conventions, insufficient storage infrastructure, inadequate metadata collection, absence of data management planning.
- Solutions:
- Implement MIAPPE-compliant metadata: Adopt the Minimum Information About a Plant Phenotyping Experiment (MIAPPE) standard to ensure complete experimental context is captured [37] [55].
- Establish data lifecycle protocols: Define clear protocols for raw data retention, processed data storage, and data sharing policies from project inception.
- Utilize structured storage solutions: Implement hierarchical storage management with automated backup systems and clear data organization schemas.
Problem: Integrating multi-modal sensor data
- Symptoms: Inability to correlate data from different sensors, temporal misalignment between measurements, conflicting results from different sensors.
- Root Causes: Lack of temporal synchronization between sensors, different spatial resolutions, incompatible data formats.
- Solutions:
- Implement temporal alignment protocols: Use precise timestamps and reference imaging events to synchronize data from all sensors.
- Develop sensor fusion algorithms: Create computational pipelines that intelligently combine data from RGB, hyperspectral, thermal, and other sensors.
- Establish cross-referencing systems: Use physical markers or plant identifiers that are visible across multiple sensor types to facilitate data integration.
Table 1: Common Data Quality Issues and Solutions
| Issue Category | Specific Problem | Potential Impact | Recommended Solution |
|---|---|---|---|
| Image Acquisition | Changing lighting conditions | Color measurement errors, inconsistent segmentation | Use standardized illumination; include color reference cards [54] |
| Image Acquisition | Diurnal leaf movements | >20% deviation in size estimates from top-view images | Image at consistent times; account for diurnal patterns [51] |
| Trait Extraction | Incorrect calibration curves | Systematic errors in derived traits (e.g., biomass) | Establish treatment-specific calibration; validate with destructive measurements [51] |
| Data Management | Incomplete metadata | Limited data reuse and sharing potential | Implement MIAPPE-compliant metadata standards [37] [55] |
| Data Management | Multi-sensor data integration | Inability to correlate traits from different sensors | Temporal synchronization; cross-referencing systems |
Frequently Asked Questions (FAQs)
Q1: What is the minimum metadata information required for plant phenotyping experiments to ensure data reproducibility and sharing?
A: The MIAPPE (Minimum Information About a Plant Phenotyping Experiment) standard provides a checklist of metadata required to adequately describe plant phenotyping experiments [37]. This includes:
- Investigation metadata: Title, description, submission date, and contact information
- Study metadata: Experimental design, growth conditions, and environmental parameters
- Assay metadata: Measurement procedures, instrumentation, and data processing protocols Essential components include plant material details, environmental conditions (light, temperature, humidity), experimental design description, and data processing methodologies. Following MIAPPE ensures your data is Findable, Accessible, Interoperable, and Reusable (FAIR) [55].
Q2: How often should we generate calibration curves for our phenotyping systems, and do different treatments require separate calibrations?
A: Calibration frequency depends on your specific system and research context:
- Initial validation: Establish comprehensive calibration curves during system setup
- Regular checks: Perform monthly validation checks with reference materials
- Treatment-specific calibrations: Different treatments (e.g., drought stress, nutrient variations) often require distinct calibration curves, as the relationship between proxy measurements (like projected leaf area) and actual traits (like total biomass) can vary significantly between conditions [51]
- Seasonal recalibration: Environmental factors like seasonal humidity and temperature changes may necessitate recalibration Always validate calibration curves with a subset of destructive measurements, especially when introducing new plant varieties or growing conditions.
Q3: What are the best practices for managing the enormous volumes of image data generated by high-throughput systems?
A: Effective data management requires a multi-tiered strategy:
- Distinguish between raw and processed data: Maintain original raw images but prioritize processed data for long-term storage when appropriate [55]
- Implement automated data pipelines: Use tools like PlantCV to standardize image processing and feature extraction [54]
- Utilize centralized storage platforms: Where available, use established repositories like the European Bioinformatics Institute for specific data types [55]
- Adopt professional data management: Implement robust backup strategies, potentially leveraging grid infrastructure like the European Grid Infrastructure for large-scale data [55]
Q4: How can we address the specialized expertise gap in data analysis for plant phenotyping?
A: Bridging this expertise gap requires multiple approaches:
- Collaborative partnerships: Establish cross-disciplinary teams combining plant biology, computer science, and engineering expertise
- Training and workflow standardization: Develop standardized analysis workflows using platforms like PlantCV that can be shared across research groups [54]
- Utilization of community resources: Leverage open-source tools, participate in phenotyping networks (EMPHASIS, IPPN), and attend specialized workshops
- Gradual skill development: Start with established protocols and gradually incorporate more advanced analytical approaches as team expertise grows
Experimental Protocols and Methodologies
Standardized Protocol for HTPP Experiment Setup
Objective: Establish consistent imaging and data collection procedures for reliable high-throughput plant phenotyping.
Materials:
- High-throughput phenotyping system with RGB imaging capability
- Reference color card (e.g., X-Rite ColorChecker)
- Size calibration markers
- Standardized plant containers and growth media
- Environmental monitoring sensors (light, temperature, humidity)
Procedure:
- Pre-experiment calibration:
- Verify all sensor calibrations according to manufacturer specifications
- Capture reference images of color cards and size markers at all planned imaging positions
- Establish baseline white balance and exposure settings
Experimental setup:
- Assign unique identifiers to all plants following a consistent numbering system
- Implement randomized block designs to account for environmental gradients within growth facilities
- Position reference markers permanently within the imaging area
Imaging schedule:
- Establish fixed imaging intervals based on plant growth rates (typically daily for early growth stages)
- Maintain consistent timing of image acquisition to minimize diurnal variation effects [51]
- Include quality control images at beginning and end of each imaging session
Data acquisition:
- Capture data from all sensors according to predetermined sequence
- Record all relevant environmental parameters concurrent with image acquisition
- Implement automated file naming incorporating date, time, experiment ID, and plant ID
Metadata documentation:
- Comply with MIAPPE standards for experimental metadata [37]
- Document any deviations from standard protocols
- Record environmental conditions throughout experiment duration
Protocol for Validation of Non-Destructive Measurements
Objective: Validate proxy measurements (e.g., digital biomass) against traditional destructive measurements.
Materials:
- Imaging system (RGB camera)
- Traditional measurement equipment (leaf area meter, balance)
- Plant material representing the expected size range in the experiment
Procedure:
- Sample selection:
- Select plants representing the full size range expected in your experiment
- Include multiple replicates (minimum n=5) for each size class
Parallel measurements:
- Acquire non-destructive images according to standard protocol
- Immediately harvest same plants for destructive measurements
- Measure total leaf area, fresh weight, and dry weight using established methods
Curve fitting:
- Plot destructive measurements against image-derived parameters
- Test linear and non-linear regression models to identify best fit
- For rosette species, expect curvilinear relationships between projected leaf area and total leaf area [51]
Validation:
- Apply calibration curve to independent validation dataset
- Calculate prediction error and adjust model if necessary
- Establish criteria for when recalibration is required
Table 2: Essential Research Reagent Solutions for HTPP
| Category | Item | Specification/Function | Application Notes |
|---|---|---|---|
| Calibration Tools | Reference color card | Standardized color patches for color correction and white balancing | Essential for cross-experiment comparison; should be included in every image [54] |
| Calibration Tools | Size calibration markers | Objects of known dimensions for pixel-to-metric conversion | Critical for accurate measurement of morphological traits |
| Growth Supplies | Standardized growth containers | Uniform size, color, and material properties | Minimizes container effect on measurements and root development |
| Growth Supplies | Standardized growth media | Consistent physical and chemical properties | Reduces substrate-induced variability in plant growth |
| Data Management | MIAPPE-compliant metadata template | Standardized format for experimental metadata | Ensures data reproducibility and sharing capability [37] [55] |
| Software Tools | PlantCV platform | Open-source image analysis software for plant phenotyping | Provides customizable workflow for diverse plant species and imaging types [54] |
Visualization of Data Management Workflows
HTPP Data Management and Analysis Pipeline
HTPP Data Management Pipeline
Image Analysis Workflow in PlantCV
PlantCV Image Analysis Workflow
Addressing data management complexity in high-throughput plant phenotyping requires both technical solutions and specialized expertise development. By implementing the standardized protocols, troubleshooting guides, and workflows presented in this technical support framework, research teams can navigate the challenges of massive dataset management, multi-sensor integration, and quality validation. The key to sustainable phenotyping research lies in adopting community standards like MIAPPE for metadata [37], establishing robust calibration and validation protocols [51], and leveraging open-source tools like PlantCV for reproducible analysis [54]. As the field continues to evolve with advancements in AI and sensor technologies [15], these foundational practices will enable researchers to fully leverage the transformative potential of high-throughput phenotyping while ensuring data quality, reproducibility, and sharing capability.
Mitigating Environmental Interference and Sensor Calibration Drift for Data Quality
Frequently Asked Questions (FAQs)
What are the most common environmental factors that cause sensor calibration drift? The primary environmental stressors that trigger calibration drift in sensitive phenotyping sensors are dust accumulation, humidity variations, and temperature fluctuations [56]. Dust can physically obstruct sensor elements, humidity can cause condensation and chemical reactions, and temperature changes can lead to physical expansion or contraction of sensor components [56].
How often should I calibrate my phenotyping sensors? Calibration frequency is not universal and depends on your specific environmental conditions. Environments with high levels of dust, extreme humidity swings, or significant temperature variations necessitate more frequent calibration checks [56]. A best practice is to establish a regular schedule based on sensor manufacturer recommendations and your own historical performance data, with the understanding that harsher conditions will require shorter intervals [56].
Why is my 'digital biomass' measurement from top-view images fluctuating significantly throughout the day? This is a common pitfall related to plant dynamics, not sensor error. Research shows that diurnal changes in leaf angle can impact plant size estimates from top-view cameras, causing deviations of more than 20% over the course of a day [51]. This highlights the importance of standardizing measurement timing or using side-view imaging to account for these morphological changes.
What is the consequence of using an incorrect calibration curve for my project? Using a poorly fitted or inappropriate calibration curve can lead to large relative errors in your data, even if the curve itself has a high statistical correlation (e.g., r² > 0.92) [51]. For example, assuming a simple linear relationship between projected leaf area and total leaf area in rosette species, when the true relationship is curvilinear, will result in systematic miscalculations of biomass [51]. Different treatments, seasons, or genotypes may also require distinct calibration curves.
What is the purpose of a multispectral calibration panel in drone phenotyping? Multispectral calibration using a provided panel is mandatory for accurate data [57]. It serves several critical functions:
- Standardization of Measurements: The panel provides known reference values, ensuring consistent measurements across different devices and experiments [57].
- Quality Control: It allows you to monitor the performance and stability of your imaging equipment, identifying issues like sensor drift [57].
- Normalization of Data: It provides a baseline to normalize measurements, enabling accurate comparison of plant traits across different conditions or time points [57].
Troubleshooting Guide
Issue: Inconsistent or Noisy Biomass Data from Load Cells
Problem: Biomass measurements from low-cost load cell systems are unstable, showing drift or noise that masks true plant growth signals.
Solution: This is a known challenge in automated phenotyping, often caused by mechanical noise, thermal drift, or vibrations [58]. Implement a data processing pipeline that includes software-based compensation algorithms.
- 1. Identify the Noise Source: Monitor data for patterns. Cyclical drift may correlate with day/night temperature cycles in the growth chamber. Spiky noise may be caused by nearby machinery or vibrations.
- 2. Apply Filtering and Compensation: Use environmental data (e.g., temperature logs from your growth chamber) to model and subtract thermal drift from the load cell signal [58]. Implement digital filters (e.g., low-pass filters) to smooth out high-frequency mechanical noise.
- 3. Validate with Ground Truth: Periodically validate your sensor readings against manual harvest data to ensure the compensation algorithms are working correctly and maintain high agreement with actual plant biomass [58].
Experimental Protocol for Load Cell Validation:
- Setup: Integrate load cells into individual growing trays in your vertical farm or growth chamber [58].
- Baseline Measurement: Record the stable weight of the tray and growth medium before planting.
- Data Collection: Continuously log weight data throughout the growth cycle, simultaneously recording environmental parameters like temperature.
- Destructive Harvest: At multiple time points (e.g., weekly), destructively harvest plants from a subset of trays and measure their fresh and dry weight manually.
- Model Calibration: Use the manual harvest data to calibrate the load cell output, creating a regression model that converts the raw, filtered signal into an accurate biomass estimate [58].
Issue: Discrepancies Between Sensor Data and Visual Plant Health
Problem: RGB or multispectral sensor data suggests a problem (e.g., low vegetation index), but visual inspection does not confirm it, or vice versa.
Solution: This often points to a calibration or data interpretation issue.
- 1. Verify Sensor Calibration: For multispectral sensors, ensure the calibration panel was used correctly at the beginning and end of the flight or scan [57]. Check for dirt or damage on the panel or sensor lens.
- 2. Check for Environmental Interference: Review the conditions during data capture. Was the lighting consistent? For field drones, was there high atmospheric haze or cloud cover that could affect light reflectance? Recalibrate under the exact lighting conditions of your crop [57].
- 3. Re-examine Your Calibration Curves: The relationship between sensor proxies (like projected leaf area) and the actual trait of interest (like total biomass) may not be linear or may change with plant development stage [51]. Ensure you are using a correctly parameterized and validated calibration model for your specific species and growth conditions.
Issue: Poor Data Quality After Integrating Multiple Sensors
Problem: Data becomes unreliable or inconsistent after combining datasets from different phenotyping platforms (e.g., drone imagery and indoor scanner data).
Solution: This is a classic data integration challenge arising from differences in collection methods, units, or definitions [59].
- 1. Develop a Data Management Plan: Establish a robust data governance framework before starting your experiment. This includes defining standardized protocols for all sensors, including units, formats, and metadata requirements [60].
- 2. Use Ground Control Points (GCPs): For geospatial data, use georeferenced Ground Control Points placed within your trial site. This ensures plot maps are consistent and don't shift between flights, which is essential for accurate height and biovolume measurements [57].
- 3. Implement Rigorous Data Validation: Establish automated data quality checks to flag invalid data, such as values outside a physically possible range (e.g., negative plant heights) or data that contradicts other validated measurements [59].
Table 1: Impact of Environmental Stressors on Sensor Calibration
| Environmental Stressor | Impact Mechanism | Potential Data Effect | Mitigation Strategy |
|---|---|---|---|
| Temperature Fluctuations [56] | Physical expansion/contraction of sensor components; electronic signal variability. | Drift in readings; inaccurate biomass or temperature data. | Use temperature-stable materials; implement software drift compensation; regular recalibration [58] [56]. |
| Humidity Variations [56] | Condensation causing short-circuiting or corrosion; desiccation of sensor elements. | Erratic sensor performance; sudden data spikes or drops. | Use protective, breathable housings; place sensors strategically; monitor environmental logs [56]. |
| Dust & Particulate Accumulation [56] | Physical obstruction of sensor surfaces and elements. | Reduced sensor sensitivity; false or dampened readings. | Regular cleaning schedules; use protective filters or housings [56]. |
| Diurnal Plant Movement [51] | Changes in leaf angle and plant architecture throughout the day. | >20% deviation in top-view plant size estimates. | Standardize imaging time; use multi-angle imaging systems. |
Table 2: Essential Reagent Solutions for Phenotyping Experiments
| Reagent / Material | Function in Experiment |
|---|---|
| Multispectral Calibration Panel [57] | Provides known reflectance values to standardize and normalize multispectral and hyperspectral imagery, ensuring data accuracy across time and devices. |
| Georeferenced Ground Control Points (GCPs) [57] | Acts as a spatial reference for drone or field imagery, enabling accurate image stitching, georeferencing, and precise measurement of plant height and biovolume. |
| Hydroponic Nutrient Solution [58] | Provides standardized nutrition in controlled environment agriculture (CEA), eliminating soil variability as a confounding factor in plant growth studies. |
| Reference Plant Samples [51] [58] | Used for destructive harvesting to establish ground truth data (e.g., dry biomass, total leaf area), which is critical for validating and calibrating non-destructive sensor measurements. |
Experimental Workflows and Pathways
In the field of high-throughput plant phenotyping, researchers are navigating an unprecedented data deluge. Advanced imaging sensors can generate over 100 megabytes of data for a single hyperspectral imaging session, creating significant challenges in data management, annotation, and metadata collection [24]. This technical support center provides targeted guidance for researchers, scientists, and drug development professionals seeking to maintain data veracity while leveraging the power of high-throughput screening technologies in their plant science investigations.
Frequently Asked Questions (FAQs)
Q1: What are the most critical factors for ensuring data integrity in high-throughput plant phenotyping? Data integrity in plant phenotyping requires adherence to the ALCOA+ principles: Attributable, Legible, Contemporaneous, Original, and Accurate [61]. Implementation of standardized ontologies like MIAPPE (Minimal Information About a Plant Phenotyping Experiment) and use of dedicated data management platforms such as GnpIS or PIPPA are essential for maintaining data quality throughout the research lifecycle [62] [24].
Q2: How can we manage the massive image data generated by automated phenotyping platforms? Dedicated analysis platforms like PlantCV, IAP (Integrated Analysis Platform), and InfraPhenoGrid offer user-friendly interfaces for processing large image datasets [24]. These systems facilitate the extraction of biologically meaningful parameters while maintaining provenance through comprehensive metadata tracking. For optimal performance, consider leveraging Graphical Processing Units (GPUs) with libraries like OpenCV to dramatically increase processing efficiency [24].
Q3: What workflow management strategies can improve screening efficiency? Effective workflow management involves process standardization, automation integration, and systematic data flow management [63]. Implementing structured workflows with clear status transitions (To Do, Doing, Done) reduces manual tracking and identifies bottlenecks early. Platforms like KanBo provide visual workflow systems that enhance coordination across laboratory teams while maintaining data security through permission controls [63].
Q4: How can we address reproducibility challenges in high-throughput screening? Reproducibility requires rigorous quality control measures, including standardized operating procedures, automated liquid handling systems to minimize human error, and comprehensive metadata collection about environmental conditions and imaging sensors [24] [64]. Platforms like PIPPA deploy 'sanity check' algorithms to flag outliers for further inspection, ensuring consistent results across experiments [24].
Q5: What are the key considerations for integrating phenotypic and genotypic data? Successful integration requires harmonization of metadata using common ontologies and standards. The BioSamples database serves as a central hub for metadata, enabling links between diverse datasets [24]. Resources like AraPheno and Plant Genomics and Phenomics Research Data Repository provide models for cross-domain data integration, though consistent implementation of standards across resources remains challenging [24].
Troubleshooting Guide
Poor Data Quality Issues
Problem: Inconsistent results across experimental runs
- Cause: Variable environmental conditions not properly recorded
- Solution: Implement automated environmental monitoring with MIAPPE-compliant metadata collection [24]
- Prevention: Use controlled growth chambers with integrated sensor networks and establish standard operating procedures for environmental logging
Problem: High rate of false positives in screening results
- Cause: Inadequate assay optimization and validation
- Solution: Conduct pilot studies to establish appropriate controls and thresholds
- Prevention: Implement robust statistical controls and plate layout optimization in 96-well formats to minimize edge effects and other positional artifacts [64]
Technical System Failures
Problem: Image analysis pipeline failures
- Cause: Disconnection between data management and analysis components
- Solution: Utilize integrated platforms like PlantCV or OMERO that combine analysis with data management [24]
- Prevention: Establish regular system validation checks and maintain version control for analysis algorithms
Problem: Data storage and retrieval challenges
- Cause: Unstructured "Big Data" from diverse imaging sensors [24]
- Solution: Implement ontology-driven data models like those in GnpIS for consistent annotation [62]
- Prevention: Adopt FAIR principles (Findable, Accessible, Interoperable, Reusable) from experiment design phase [62]
Workflow Efficiency Problems
Problem: Bottlenecks in sample processing
- Cause: Manual intervention in automated workflows
- Solution: Integrate robotic systems for sample handling and positioning [24]
- Prevention: Conduct workflow analysis to identify and optimize rate-limiting steps
Problem: Data integration difficulties
- Cause: Incompatible data formats across different phenotyping systems
- Solution: Implement middleware that translates between different system outputs using common ontologies [24]
- Prevention: Adopt community standards like Crop Ontology and Breeding API in new system acquisitions [62]
High-Throughput Plant Phenotyping Experimental Protocol
Protocol 1: Multi-Spectral Plant Imaging and Analysis
Objective: To non-invasively monitor structural, physiological and performance-related plant traits using automated imaging systems [24]
Materials:
- Plant-to-sensor system with conveyor or sensor-to-plant system with movable camera rig [24]
- RGB color sensors (400-1000 nm range) for visible spectrum imaging [24]
- Near-IR capable cameras (without IR cut-off filter) for imaging in darkness [24]
- Indium gallium arsenide (InGaAs) sensors (900-1700 nm) for Short Wave InfraRed (SWIR) water content measurement [24]
- Long Wave Infrared (LWIR) sensors (3-14 μm) for thermal imaging of stomatal conductance [24]
- Controlled growth environment with standardized conditions
Methodology:
- Experimental Design:
- Define study objectives and select appropriate sensor types based on traits of interest
- Establish control and treatment groups with sufficient biological replicates
- Document complete experimental metadata using MIAPPE standards [24]
Image Acquisition:
- Implement automated scheduling for image capture at consistent intervals
- Maintain fixed distance and angle between sensors and plant material
- Include calibration standards in each imaging session
Data Processing:
- Use platform-specific analysis tools (PlantCV, IAP) for trait extraction [24]
- Apply machine learning algorithms for pattern recognition in large datasets
- Export structured data with complete provenance information
Data Integration:
Data Tables
| Parameter | Value | Time Period | Source |
|---|---|---|---|
| Global HTS Market Value | $15,000 million | 2025 (Projected) | [65] |
| Global HTS Market Value | $25,000 million | 2033 (Projected) | [65] |
| Compound Annual Growth Rate (CAGR) | 6.5% | 2025-2033 | [65] |
| United States HTS Market Value | $8.94 billion | 2025 (Projected) | [66] |
| United States HTS Market Value | $19.28 billion | 2033 (Projected) | [66] |
| United States CAGR | 13.67% | 2026-2033 | [66] |
Table 2: Imaging Sensor Applications in Plant Phenotyping
| Sensor Type | Spectral Range | Measurable Plant Traits | Data Volume per Image |
|---|---|---|---|
| RGB Color Sensors | 400-1000 nm (with IR filter) | Morphological features, color changes | Medium (MB range) |
| Near-IR Cameras | 400-1000 nm (without IR filter) | Imaging in darkness, specific structural traits | Medium (MB range) |
| InGaAs Sensors (SWIR) | 900-1700 nm | Leaf water content, chemical composition | High (10s of MB) |
| LWIR Thermal Sensors | 3-14 μm | Canopy temperature, stomatal conductance | Medium (MB range) |
| Hyperspectral Imaging | Multiple bands across spectrum | Comprehensive physiological profiling | Very High (100+ MB) |
Research Reagent Solutions
Essential Materials for High-Throughput Plant Phenotyping
| Item | Function | Application Example |
|---|---|---|
| 96-well plate format | Compact footprint for parallel experiments | High-throughput assay development [64] |
| Automated liquid handling systems | Precise dispensing of reagents and samples | Sample preparation for molecular assays [64] |
| Fluorescence markers | Tagging specific cellular components | Cell-based assays and viability screening [65] |
| Standardized growth media | Consistent plant cultivation | Controlled environment studies [24] |
| Calibration standards | Sensor and image validation | Cross-experiment data comparability [24] |
| Enzyme-linked immunosorbent assays (ELISA) | Protein detection and quantification | Biochemical analysis in screening [64] |
Workflow Visualization
High-Throughput Plant Phenotyping Workflow
ALCOA Data Integrity Framework
Ensuring Data Integrity: Validation Frameworks and Technology Comparisons
Establishing Robust Data Validation and Quality Control Protocols
In high-throughput plant phenotyping (HTP), the massive volumes of complex, unstructured data generated by imaging sensors present significant data handling challenges [24]. Robust data validation and quality control (QC) protocols are essential to ensure the accuracy, reproducibility, and FAIRness (Findability, Accessibility, Interoperability, and Reusability) of phenotypic data. This technical support center provides targeted guidance to help researchers troubleshoot common issues and implement effective quality assurance throughout their phenotyping workflows.
Troubleshooting Guides
Image Data Quality Issues
| Symptom | Possible Cause | Solution |
|---|---|---|
| Blurry or out-of-focus images | Incorrect camera autofocus, motion blur from UAV/carrier movement, improper shutter speed | Calibrate autofocus on a static reference object; for UAVs, ensure adequate flight stabilization and lighting to allow faster shutter speeds [14]. |
| Inconsistent lighting/color balance | Changing ambient light (sunny vs. cloudy), automatic white balance fluctuations | Capture color reference charts (e.g., Macbeth chart) in the first and last images of a sequence; use controlled lighting in lab settings [24]. |
| Low contrast between plant and background | Sensor not optimized for the trait, unsuitable image analysis pipeline | For physiology, use multispectral or thermal sensors instead of RGB; ensure analysis pipeline uses optimal percentile of 3D point clouds for height estimation [67]. |
| Inaccurate 3D model from SfM/MVS | Insufficient image overlap, lack of visual features, poor lighting | For UAV flights, maintain >80% front and side overlap; increase image redundancy [67]. |
| Chunking or data transfer failures | Large file sizes from hyperspectral/3D sensors, network instability | Implement checksum verification (e.g., MD5, SHA-256) post-transfer; use resumable data transfer protocols [24]. |
Data Management and Integration Issues
| Symptom | Possible Cause | Solution |
|---|---|---|
| Inability to trace data provenance | Missing metadata, non-standard file naming, unlogged processing steps | Adopt the MIAPPE standard to define experimental metadata; use data management platforms like PIPPA or PHIS that enforce metadata entry at generation [24] [68]. |
| Difficulty integrating datasets from different sources | Lack of data interoperability, inconsistent ontologies, incompatible formats | Use community-standard ontologies for trait annotation; employ ISA-Tab or MIAPPE Template as exchange formats; leverage bridging resources like RDMkit [68]. |
| Poor performance of AI/ML models | Insufficient training data, inaccurate ground truth, lack of model generalization | Collect >100 images per object class/genotype; use data augmentation techniques; implement patch-based analysis to increase training samples [14]. |
| Low correlation between HTP and manual measurements | Protocol not validated for specific crop/trait, incorrect data processing | Validate HTP protocols via in silico experiments before real-world application; assess impact of treatment variance and heritability on accuracy [67]. |
Frequently Asked Questions (FAQs)
Q1: What is the minimum number of image replicates needed for reliable analysis? For robust AI-based image analysis, a minimum of 100 images per object class or genotype is recommended. If this is not feasible, use patch-based classification to generate more training samples from high-resolution images [14].
Q2: How can I quickly check if my sensor data and experimental metadata are sufficient for publication and sharing? Ensure your dataset complies with the MIAPPE (Minimum Information About a Plant Phenotyping Experiment) standard. This covers critical details about source material, experimental design, and environmental conditions, facilitating comparison and interpretation [24] [68].
Q3: Our HTP-estimated plant heights are inaccurate. Which factors should we investigate first? The accuracy of HTP-estimated plant heights is highly influenced by the choice of the percentile of points in dense 3D point clouds, experimental repeatability (heritability), and treatment variance (genetic variability). Flight altitude, while affecting 3D reconstruction quality, has less direct impact on height estimation accuracy [67].
Q4: How can we ensure our data visualizations and tool interfaces are accessible? Follow Web Content Accessibility Guidelines (WCAG). Use a color contrast ratio of at least 3:1 for graphical elements and 4.5:1 for text. Utilize tools like the WebAIM Color Contrast Checker and avoid using color as the only means of conveying information [69].
Q5: What is the most common pitfall when transitioning a phenotyping protocol from controlled environments to the field? Failing to account for the immense variability in environmental conditions (e.g., lighting, weather, background clutter). This requires increased replication and robust AI models trained specifically on field data to maintain accuracy [14].
Experimental Protocol: Validating an Aerial Imagery-Based HTP Protocol UsingIn SilicoExperiments
This methodology provides a cost-effective way to design and validate HTP approaches before real-world implementation [67].
Simulation of Phenotypic Values
- Input: Define parameters for genetic variability (treatment variance) and environmental noise (experimental repeatability/heritability).
- Process: Use statistical software to simulate a ground truth phenotypic dataset (e.g., plant height) based on these parameters.
Three-Dimensional Modeling of Trials
- Process: Generate a realistic 3D model of a plant trial, representing the simulated phenotypic values in a spatial context that mimics a real field layout.
Image Rendering and HTP Estimation
- Process: Render 2D aerial images from the 3D model, simulating different flight altitudes and camera specifications.
- Analysis: Process these synthetic images using your standard Structure-from-Motion (SfM) and Multi-View Stereo (MVS) pipelines to generate HTP-estimated values.
Validation and Inference
- Analysis: Compare the HTP-estimated values with the computer-simulated ground truth using correlation coefficients, regression analysis, and similarity indices.
- Output: Determine the accuracy of the HTP protocol and understand how factors like point cloud percentile, heritability, and genetic variability affect results.
HTP Protocol Validation Workflow
Research Reagent Solutions: Essential Tools for HTP Data Management
| Item | Function & Purpose |
|---|---|
| MIAPPE Standards | A set of guidelines defining the minimum metadata required to make a plant phenotyping experiment understandable and reusable [24] [68]. |
| Breeding API (BrAPI) | A standardized RESTful API that enables interoperability between databases and tools used in plant breeding and phenotyping [68]. |
| PlantCV | An open-source image analysis software package tailored for plant phenotyping. It allows for the customization of image analysis pipelines [24]. |
| PIPPA / PHIS | Web-based data management platforms that facilitate the storage, visualization, and analysis of phenotypic data, often with integrated QC checks [24]. |
| Color Reference Chart | A physical chart with known color values (e.g., Macbeth chart) included in image captures to standardize colors and correct for white balance variations [24]. |
| RDMkit | A central portal of guidelines from ELIXIR that helps researchers navigate the landscape of data management solutions, including those for plant phenotyping [68]. |
| WebAIM Contrast Checker | An online tool to verify that color contrast ratios in visualizations and interfaces meet WCAG accessibility standards [69]. |
HTP Data Ecosystem Relationships
Comparative Analysis of Leading Phenotyping Platforms and Their Data Outputs
The plant phenotyping market is experiencing rapid growth, driven by the need to enhance crop productivity and resilience. The market is projected to grow from USD 216.7 million in 2025 to USD 601.7 million by 2035, reflecting a strong Compound Annual Growth Rate (CAGR) of 11.0% [36]. Leading vendors have developed specialized platforms to address diverse research needs, from controlled laboratory environments to large-scale field trials.
Table 1: Key Vendors and Platform Specializations
| Vendor/Platform | Primary Specialization | Example Use-Cases & Traits Measured |
|---|---|---|
| LemnaTec [70] [1] | High-throughput lab & greenhouse phenotyping | Salinity tolerance traits in rice [1] |
| PhenoTech [70] | Large-scale field trials | High-throughput imaging and automation for field-based studies [70] |
| Hortimax [70] | Greenhouse environments | Tailored solutions for controlled environment agriculture [70] |
| KeyGene [70] | Genetic analysis | Integrated data platform for linking phenotype to genotype [70] |
| CropX [70] | Precision agriculture | Soil sensors combined with phenotypic data [70] |
| HIPhen (Cloverfield) [57] | Drone-based field phenotyping | Biomass proxy, canopy development, plant stress, and harvest index traits for numerous crops [57] |
| PHENOPSIS [1] | Controlled environment abiotic stress | Plant responses to soil water stress in Arabidopsis [1] |
Frequently Asked Questions (FAQs)
Platform Selection and Data Management
Q1: What are the primary criteria for selecting a phenotyping platform? Choosing the right platform depends heavily on your experimental scenario. For large-scale field trials, vendors like LemnaTec and PhenoTech excel with high-throughput imaging and automation. For controlled greenhouse environments, Hortimax offers tailored solutions. Researchers focusing on genetic analysis might prefer KeyGene's integrated data platform, while precision agriculture operations often benefit from CropX's soil sensors combined with phenotypic data [70]. The key is to define the primary environment (field, greenhouse, lab), the scale of the experiment, and the specific traits of interest.
Q2: What are the major data management challenges in high-throughput phenotyping? The two major challenges are data storage/volume and data annotation/integration [24]. A single flight with a multispectral UAS over a ~6-acre field can generate about 15 gigabytes of data [71]. Beyond storage, the lack of standardized formats and central repositories makes data sharing and meta-analysis difficult. The community is addressing this through the development of standards like the Minimal Information About a Plant Phenotyping Experiment (MIAPPE) to ensure data persistence, traceability, and reuse [24].
Technical Operation and Validation
Q3: Why are Ground Control Points (GCPs) necessary for accurate plant height measurements? Ground Control Points (GCPs) are essential for accurate height measurements as they provide known reference coordinates with centimetric precision. They help georeference data, correct errors in the 3D model, and validate accuracy. Using georeferenced GCPs is highly recommended to avoid distortions like the "bowl effect" in the generated digital elevation models, which would otherwise compromise the reliability of plant height and biovolume traits [57].
Q4: When and why is multispectral calibration mandatory? Multispectral calibration using a provided calibration panel is mandatory at the beginning and end of each flight when using sensors like the DJI Mavic 3M. This process adjusts the sensor to the exact lighting conditions, ensuring precise and consistent measurements of plant traits across different time points. It is crucial for standardizing measurements, quality control, normalizing data across experiments, and correcting for atmospheric effects [57]. While indices like NDVI may not require it, calculating absolute traits like Leaf Area Index or chlorophyll content does [57].
Q5: How does Explainable AI (XAI) address the "black box" problem in phenotyping data analysis? Machine and deep learning models, particularly deep neural networks, are often considered "black boxes" because it's difficult to understand how they make predictions [72]. Explainable AI (XAI) emerges to solve this by helping researchers understand the 'why' behind model predictions. XAI methods allow you to investigate the most influential features that lead to a result, which is central to sanity-checking models, increasing reliability, identifying dataset biases, and, most importantly, gaining biological insights from the data [72].
Troubleshooting Common Experimental Issues
Data Quality and Accuracy
Table 2: Troubleshooting Guide for Common Data Issues
| Problem | Potential Causes | Solutions & Best Practices |
|---|---|---|
| Inconsistent plant height measurements across time points. | Incorrect georeferencing; "Bowl effect" in the 3D point cloud. | Use georeferenced Ground Control Points (GCPs) [57]. Activate RTK mode on your drone for centimeter-level positioning accuracy [57]. |
| Spectral data (e.g., NDVI) is inconsistent between flights. | Changing ambient lighting conditions; lack of sensor calibration. | Perform mandatory multispectral calibration using a calibration panel at the start and end of every flight [57]. |
| Machine learning model performs well on training data but poorly in the real world. | Model is exploiting hidden biases in the dataset; the "black box" problem. | Employ Explainable AI (XAI) techniques to understand which features the model uses for decisions, helping to identify and correct biases [72]. |
| Data processing is taking too long (5-6 hours for UAS data). | Large data volumes; insufficient computing power. | This is a common limitation [71]. Plan for adequate processing time. Explore using Graphics Processing Units (GPUs) and libraries like OpenCV to dramatically increase processing efficiency [24]. |
Platform Performance and Integration
Problem: High error rate in automated image analysis. Solution: Ensure that the imaging conditions are consistent and that the platform's software is suitable for your specific crop and trait. Many platforms are species and context-specific [73]. For instance, the LemnaTec 3D Scanalyzer has been validated for salinity tolerance in rice [1], while HIPhen's Cloverfield supports a wide range of crops from wheat to orchards [57]. Using a platform outside its validated scope may require custom model training.
Problem: Inability to integrate phenotypic data with genomic information. Solution: This is a common challenge in bridging the phenotype-genotype gap. Focus on using platforms that support data export in standardized formats and employ ontologies for trait description. Frameworks like PIPPA and PlantCV are designed for data management and analysis, facilitating downstream integration [24]. Furthermore, multimodal deep learning models that fuse HTPP image data with genotype information have been shown to significantly improve genomic prediction accuracy [72].
Essential Experimental Protocols
Protocol: Drone-Based High-Throughput Phenotyping for Field Trials
This protocol outlines the steps for acquiring high-quality phenotypic data from a field trial using a drone, based on industry best practices [57].
I. Pre-Flight Preparation
- Equipment Check: Ensure the drone (e.g., DJI Mavic 3M), sensors (RGB and/or multispectral), and extra batteries are functional.
- Sensor Calibration: Perform a mandatory calibration of the multispectral sensor using the provided calibration panel. This is critical for accurate spectral data.
- GCP Deployment: Place Ground Control Points (GCPs) around and within the trial site. For the highest accuracy, georeference their positions using an RTK base station.
- Flight Planning: Develop a tailored flight protocol considering the target traits, crop growth stage (BBCH scale), and field size. Set the flight altitude (e.g., 400 feet can cover ~500 acres), overlap, and photo intervals accordingly.
II. In-Flight Operations
- RTK Activation: Activate the drone's RTK mode to ensure centimeter-level geo-referencing of captured images.
- Data Capture: Execute the pre-planned flight path, ensuring stable weather conditions.
III. Post-Flight Data Processing & Analysis
- Data Transfer and Storage: Transfer the large image datasets (e.g., ~15 GB for a 6-acre field) to a secure, high-capacity storage system [71].
- Image Stitching and Georeferencing: Use specialized software (e.g., HIPhen's Cloverfield) to stitch images into an orthomosaic, using the GCPs for accurate alignment.
- Trait Extraction: Run analysis pipelines to extract relevant agronomic indicators (e.g., biomass proxy, canopy cover, plant height). Processing can take several hours to days [71] [57].
- Data Integration and Validation: Use platforms like PIPPA or PlantCV for data management, visualization, and statistical analysis. Perform "sanity checks" to flag outliers [24].
The workflow for this protocol is summarized in the following diagram:
Diagram: Drone-Based Phenotyping Workflow.
Protocol: Integrating Explainable AI (XAI) into a Phenotyping Analysis Workflow
This protocol describes how to incorporate XAI techniques to interpret machine learning models used in phenotyping, based on frameworks presented in recent literature [72].
I. Model Training and Preparation
- Data Collection: Gather a labeled dataset from HTPP platforms (e.g., UAV images with corresponding yield measurements or stress scores).
- Model Selection and Training: Train a machine learning model for your specific task (e.g., classification of disease resistance or prediction of yield using a Convolutional Neural Network - CNN, or Random Forest).
- Performance Validation: Evaluate the model's performance on a held-out test set using standard metrics (e.g., accuracy, R²).
II. Generating Explanations
- Choose an XAI Method:
- For inherently interpretable models (ante hoc) like decision trees or linear regression, explanations are built-in.
- For "black box" models like CNNs, apply post hoc explanation methods such as SHAP (SHapley Additive exPlanations) or LIME (Local Interpretable Model-agnostic Explanations) to infer feature importance after training.
- Run Explanation Algorithm: Apply the chosen XAI method to the trained model and a subset of data to generate explanations (e.g., feature importance scores or saliency maps highlighting image regions that influenced the prediction).
III. Interpretation and Validation
- Biological Insight Extraction: Analyze the explanations to identify the most influential features (e.g., specific spectral bands, leaf angles, or image regions) that led to a prediction. This can help uncover novel biological relationships.
- Model Sanity Checking: Verify that the model is relying on biologically plausible features (e.g., leaf greenness for health prediction) and not on spurious correlations or dataset biases (e.g., background soil patterns).
- Hypothesis Generation: Use the insights to form new hypotheses about the biological processes driving plant phenotypes, which can be tested in subsequent experiments.
The logical flow of this protocol is illustrated below:
Diagram: XAI Integration Workflow in Phenotyping Analysis.
The Scientist's Toolkit: Key Research Reagent Solutions
Table 3: Essential Materials and Sensors for Plant Phenotyping
| Item Category | Specific Examples | Function & Application |
|---|---|---|
| Imaging Sensors | RGB (Red, Green, Blue) | Captures imagery in the visible spectrum for basic morphological analysis (e.g., plant architecture, color) [24] [57]. |
| Multispectral (Red, Green, Red Edge, NIR) | Captures data beyond visible light for assessing plant health, chlorophyll content, and biomass via vegetation indices like NDVI [57]. | |
| Thermal (LWIR) | Images surface temperature as a proxy for stomatal conductance and water use behavior [24]. | |
| Hyperspectral | Captures a very wide range of wavelengths for detailed biochemical and biophysical property analysis [36]. | |
| Platforms | Unmanned Aerial Vehicles (UAVs/Drones) | For scalable, field-based phenotyping. Models like DJI Mavic 3M or Matrice 300 are commonly used [57]. |
| Ground Platforms (Phenomobiles) | Mobile ground vehicles equipped with sensors for detailed, ground-level field phenotyping [36]. | |
| Controlled Environment Systems | Automated systems (e.g., LemnaTec Scanalyzers) in growth chambers for high-throughput, reproducible trait measurement [1]. | |
| Calibration & Accessories | Multispectral Calibration Panel | A mandatory tool for calibrating multispectral sensors to ensure accurate and consistent reflectance measurements across flights [57]. |
| Ground Control Points (GCPs) | Physical markers with known coordinates placed in the field to ensure accurate georeferencing and validation of spatial data [57]. | |
| Software & Analysis | Data Management Platforms (e.g., PIPPA, PlantCV, Cloverfield) | Web-based or standalone frameworks for managing, processing, analyzing, and visualizing phenotypic data and metadata [24] [57]. |
| Machine Learning Libraries (e.g., TensorFlow, PyTorch) | Libraries for building custom deep learning models for image classification, segmentation, and trait prediction [72] [1]. | |
| Explainable AI (XAI) Tools (e.g., SHAP, LIME) | Post-hoc algorithms used to interpret predictions from complex ML models and gain biological insights [72]. |
High-throughput plant phenotyping (HTPP) has emerged as a critical methodology to bridge the gap between genomic information and observable plant characteristics, which is widely regarded as a major bottleneck in developing new crop varieties and understanding plant traits [51] [74]. Automated HTPP enables non-invasive, rapid, and standardized evaluation of numerous plants for size, development, and physiological variables [51]. However, the massive volumes of data generated by sensors from platforms like unmanned aerial vehicles (UAVs), phenomobiles, and automated imaging systems present significant data handling challenges [75] [76]. Researchers face complexities in extracting meaningful biological insights from heterogeneous datasets, requiring sophisticated data analytics solutions ranging from open-source tools to commercial platforms. This technical support center addresses the specific data handling issues researchers encounter when implementing these solutions in phenotyping experiments.
Troubleshooting Guides and FAQs
Software Selection and Implementation
Q: How do I choose between open-source and commercial phenotyping software for my specific research needs?
A: The decision should be based on your technical resources, experimental scale, and required support. Open-source solutions like PREPs and IHUP offer customization and no cost but require technical expertise [77] [76]. Commercial platforms like Hiphen-plant or TraitFinder provide comprehensive support and validated pipelines but at higher financial cost [75] [78]. Consider these factors:
- Technical Expertise: Open-source tools often require programming knowledge (Python, R) or comfort with configuring parameters [76] [79]. Commercial platforms typically offer user-friendly graphical interfaces [77] [78].
- Experimental Scale: For large-scale, standardized data processing, commercial platforms may offer more robust and automated pipelines [75]. For specialized, novel analyses, open-source tools provide greater flexibility [76].
- Support Needs: Commercial solutions include technical support, training, and maintenance [78]. Open-source relies on community forums and self-troubleshooting.
Q: Why does my extracted "digital biomass" show poor correlation with destructively sampled dry weight?
A: This common issue often stems from inadequate calibration. As noted in phenotyping research, relationships between proxy traits (like projected leaf area) and actual biomass are often curvilinear, not linear [51].
- Troubleshooting Steps:
- Check Calibration Model: Ensure you are using the appropriate model (e.g., quadratic or log-transformed) for your species and growth stage, not just a simple linear regression [51].
- Validate Across Treatments: A calibration curve developed for control plants may not be valid for stressed plants. Generate separate calibration curves for different treatments if necessary [51].
- Control Environmental Variables: Diurnal changes in leaf angle can cause deviations of more than 20% in size estimates from top-view images. Standardize imaging time to minimize this effect [51].
Data Quality and Processing
Q: My UAV-based plant height estimates are inconsistent across different flight times. What could be causing this?
A: Inconsistencies can arise from multiple sources related to data acquisition and processing.
- Potential Causes and Solutions:
- Lighting Conditions: Varying sun angles and shadows throughout the day can alter the digital surface model (DSM) quality. Solution: Conduct flights during solar noon when possible to minimize shadow effects.
- Wind Effects: Plant movement due to wind can blur images and distort DSMs. Solution: Fly during calm conditions and use faster shutter speeds.
- Ground Control Points (GCPs): Inaccurate or insufficient GCPs can lead to poor georeferencing and height miscalculation. Solution: Use a sufficient number of well-distributed, high-precision GCPs.
- Software Settings: Inconsistent parameters in software like PREPs or IHUP for generating orthomosaics and DSMs can cause variability. Solution: Document and use identical processing parameters for all flights in a time series [77] [76].
Q: How can I improve the robustness of my deep learning models for plant disease detection from images?
A: The performance of deep learning algorithms is highly dependent on the quality and diversity of the training data [74].
- Troubleshooting Steps:
- Expand Training Dataset: Annotate more images, ensuring they cover different growth stages, multiple lighting conditions, various disease severity levels, and a range of plant genotypes.
- Use Data Augmentation: Apply techniques like rotation, flipping, scaling, and color jittering to artificially increase the diversity of your training dataset.
- Leverage Open-Source Datasets: Utilize publicly available, annotated plant image datasets to pre-train or supplement your model, following the collaborative ethos suggested by the research community [74].
- Check for Class Imbalance: Ensure your dataset has a balanced number of images for each disease class (healthy vs. infected) to prevent model bias.
Quantitative Comparison of Data Analytics Platforms
The table below summarizes key characteristics of selected open-source and commercial software platforms used in plant phenotyping data analytics.
Table 1: Benchmarking Comparison of Phenotyping Data Analytics Software
| Software Name | Type | Key Features | Target Users | Phenotyping Traits Measured | Technical Requirements |
|---|---|---|---|---|---|
| PREPs [77] | Open-Source | Per-microplot analysis from orthomosaics/DSMs; No GIS/programming skills needed. | Researchers, Plant Scientists | Crop height, coverage, volume index | 64-bit Windows (.NET) |
| IHUP [76] | Open-Source | Integrated modules for preprocessing, extraction, management, analysis; Customizable VI formulae. | Researchers, Non-experts | Plant height, VIs, fresh weight, drought weight | Graphical User Interface |
| Hiphen Platform [75] | Commercial | AI-powered algorithms; Production-grade data pipelines; Trait catalogues; Expert support. | Agronomists, Crop Scientists, R&D | Wide range of morphological & physiological traits | Satellite, UAV, Phenomobile data |
| TraitFinder [78] | Commercial | 3D multispectral scanning (PlantEye); Real-time data; Integrated with DroughtSpotter irrigation system. | Lab Researchers, Industrial R&D | 20+ parameters on growth (3D) and physiology | Compact physical footprint; HortControl software |
| Python (Pandas, NumPy) [79] | Open-Source | High-performance data structures; Extensive data manipulation and numerical computation libraries. | Data Scientists, Bioinformaticians | Custom trait analysis, data wrangling | Python programming knowledge |
| KNIME Analytics [79] | Open-Source | Visual workflow interface; Over 4,000 nodes for data tasks; Python/R integration. | Data Scientists, Non-expert Users | Custom workflow-based trait extraction | Visual programming skills |
Experimental Protocols for Benchmarking
Protocol: Validating UAV-Estimated Crop Height with Ground Truth Measurements
This protocol is adapted from use cases validating software like PREPs and IHUP [77] [76].
1. Objective: To establish a reliable calibration between plant height derived from UAV-based Digital Surface Models (DSMs) and manually measured plant height in the field.
2. Materials and Reagents:
- Research Reagent Solutions & Essential Materials:
- UAV with RGB Camera: For capturing high-resolution aerial imagery.
- Ground Control Points (GCPs): Markers with known coordinates for georeferencing accuracy.
- Differential GPS: For precisely recording the coordinates of GCPs and validation plants.
- Measuring Tape or Ruler: For manual plant height measurement.
- Phenotyping Software (e.g., PREPs, IHUP): For processing UAV imagery and extracting plot-level heights [77] [76].
- Statistical Software (e.g., R, Python): For performing regression analysis.
3. Methodology: 1. Experimental Setup: Establish plots in the field. Distribute at least 15-20 GCPs evenly across the study area and record their precise coordinates with a differential GPS. 2. UAV Data Acquisition: Conduct UAV flights at a consistent time of day (e.g., solar noon) to minimize shadow effects. Maintain consistent altitude and overlap between images. 3. Ground Truth Measurement: Immediately after the flight, manually measure the height of a representative sample of plants (e.g., 20 plants per plot) from the base to the highest extended leaf. Tag these plants or record their precise location for matching with UAV data. 4. Image Processing: Process the UAV images in your chosen software (e.g., PREPs) to generate a high-resolution DSM and orthomosaic. The software will extract plot-level crop height from the DSM [77]. 5. Data Extraction and Correlation: For each plant with a manual measurement, extract the corresponding height value from the software. Perform a linear regression analysis between the manual measurements (independent variable) and the software-extracted heights (dependent variable). A strong correlation (e.g., R² > 0.85) indicates the UAV method is reliable [77].
Protocol: Assessing Software Performance in Detecting Treatment Effects
1. Objective: To evaluate the ability of different analytics platforms to detect and quantify subtle phenotypic differences between plant genotypes or treatments.
2. Materials and Reagents:
- Research Reagent Solutions & Essential Materials:
- Plant Material: Multiple genotypes or plants subjected to different treatments (e.g., drought, fertilizer).
- Imaging System: Can be a UAV, phenomobile, or stationary scanner (e.g., PlantEye in TraitFinder) [78].
- Phenotyping Software A & B: Two platforms to be benchmarked (e.g., one open-source and one commercial).
- Data Analysis Platform (e.g., R, KNIME): For statistical comparison of the results from both software [79].
3. Methodology: 1. Image Acquisition: Capture high-quality images of all plants in the experiment using the chosen imaging system. 2. Parallel Processing: Process the exact same set of images through both Software A and Software B to extract key traits (e.g., vegetation indices, projected leaf area, plant height). 3. Statistical Analysis: For each extracted trait, perform an Analysis of Variance (ANOVA) or a similar statistical test using the data from each software. 4. Performance Comparison: Compare the outputs based on: * Sensitivity: The p-values from the ANOVA; lower p-values indicate a greater ability to detect significant differences between treatments. * Effect Size: The magnitude of differences detected between treatment groups. * Data Quality: The consistency and biological plausibility of the extracted trait values. * Throughput: The speed and computational resources required to process the dataset.
Workflow Visualization and Research Toolkit
Phenotyping Data Analysis Workflow
The following diagram illustrates the logical flow of data from acquisition to insight in a high-throughput plant phenotyping experiment, highlighting potential failure points and quality control checkpoints.
Phenotyping Data Analysis Workflow
Essential Research Toolkit for Phenotyping Data Analytics
Table 2: Key Research Reagent Solutions for High-Throughput Plant Phenotyping
| Item Category | Specific Examples | Function in Experiment |
|---|---|---|
| Imaging Sensors | RGB Camera, Multispectral Imager (e.g., PlantEye), Hyperspectral Sensor [75] [78] | Captures visual, structural (3D), and physiological (spectral) data from plants non-destructively. |
| Data Acquisition Platforms | Unmanned Aerial Vehicle (UAV), Phenomobile, Tractor-Mounted Array, Stationary Scanner (e.g., TraitFinder) [77] [75] [78] | Carries sensors to or over plants for automated, high-frequency data collection in field or controlled conditions. |
| Phenotyping Software | PREPs, IHUP, Hiphen Platform, TraitFinder [77] [75] [76] | Processes raw images, extracts phenotypic traits (height, coverage, VIs), and manages data. |
| Data Analytics & BI Tools | Python (Pandas, NumPy), R (Tidyverse), KNIME, Apache Superset [79] | Performs statistical analysis, data wrangling, machine learning, and visualization of extracted traits. |
| Calibration Equipment | Ground Control Points (GCPs), Differential GPS, Leaf Area Meter, Drying Oven [51] | Provides ground truth data for validating and calibrating image-based measurements. |
Evaluating the ROI of Integrated Data Management Systems in Breeding Programs
Frequently Asked Questions (FAQs): ROI and Technical Setup
What constitutes ROI for a breeding data management system? ROI extends beyond simple financial returns to include operational, strategic, and risk mitigation benefits. Key areas include cost savings from reduced manual processes, enhanced data accuracy, faster decision-making, increased business agility, and better compliance with regulatory requirements [80].
What are the most common technical challenges during implementation? A primary challenge is the seamless integration of disparate data types—such as field observations, pedigree, and genotyping information—from specialized databases into unified analytical workflows [81]. Other hurdles include user adoption resistance, the complexity of interconnected systems, and the ongoing need for system maintenance and updates [80].
How can I quantify the benefits of a new system to build a business case? Focus on measurable Key Performance Indicators (KPIs). Quantify time savings (e.g., a 50% reduction in preparing fieldbooks), reduced error rates, decreased data cleaning efforts, and a shorter time-to-market for new varieties, which can be accelerated by up to two breeding seasons [82].
Troubleshooting Common Integration Issues
Issue: Data from field, pedigree, and genotyping platforms will not integrate for analysis.
| Troubleshooting Step | Action and Goal |
|---|---|
| Check for BrAPI Compliance | Ensure all source systems (e.g., BMS, BreedBase, Germinate) are BrAPI-enabled. This standardizes data access across platforms [81]. |
| Utilize a Middleware Tool | Employ an R package like QBMS, which acts as a unified data access layer, to seamlessly retrieve and integrate data from multiple BrAPI-compliant databases [81]. |
| Validate Data Formats | Confirm that data types and formats from different sources (e.g., SNP markers, phenotypic observations) are compatible with the target analysis pipeline [83]. |
Issue: My team's productivity seems lower after implementation; the new system feels slow.
| Troubleshooting Step | Action and Goal |
|---|---|
| Re-baseline Productivity Metrics | Compare current task times (e.g., fieldbook generation, data cleaning) against pre-implementation baselines. Initial slowdowns are common during the learning phase [80] [82]. |
| Audit System Performance | Check for technical bottlenecks on the server or network that could be causing latency, especially when handling large genomic datasets [83]. |
| Provide Targeted Training | Identify and re-train users on specific, under-utilized features (e.g., automated derived trait calculations, germplasm list management) to improve fluency and efficiency [84]. |
Issue: I am encountering errors when calculating derived traits or executing analysis pipelines.
| Troubleshooting Step | Action and Goal |
|---|---|
| Verify Trait Formula | Within the system's ontology manager, check that the formula associated with the derived trait is correctly defined and validated [83]. |
| Inspect Input Data Quality | Ensure the primary trait data fed into the formula is accurate, complete, and falls within expected value ranges. Errors often originate from upstream data entry [85]. |
| Confirm Analysis Parameters | For statistical analysis, verify that the experimental design, model, and germplasm groupings are correctly specified in the system before execution [83]. |
A Framework for Calculating ROI in Breeding Programs
Calculating ROI involves a structured assessment of costs versus benefits. The following table summarizes key quantitative metrics and the calculation formula based on standard financial practices [85].
Table 1: Quantifiable Metrics for ROI Calculation
| Category | Specific Metric | How to Measure |
|---|---|---|
| Costs | Software/Hardware | Purchase and licensing fees; server/cloud infrastructure costs [85]. |
| Implementation & Training | Expenses for setup, configuration, and training employees [85]. | |
| Ongoing Maintenance | Annual support fees and costs for future updates [80]. | |
| Benefits | Time Savings | (Hours saved × hourly cost); e.g., 50% reduction in fieldbook prep [82]. |
| Error Reduction | (Time spent on rework × hourly cost) + cost of potential selection mistakes [82]. | |
| Accelerated Breeding | Monetized value of releasing a new variety 1-2 seasons earlier [82]. | |
| Improved Decision-Making | Value from more efficient resource allocation and higher genetic gains [86]. |
The standard ROI formula is [85]: ROI (%) = [(Total Benefits - Total Costs) / Total Costs] × 100
Experimental Protocol: Establishing an ROI Baseline
Objective: To quantitatively measure the impact of implementing an Integrated Data Management System (e.g., BMS Pro, QBMS) on breeding program efficiency and data integrity.
Materials and Reagents
- Software Systems: Existing system (e.g., spreadsheets), and the new Integrated Data Management System (e.g., BMS Pro [87] [83] or QBMS [81]).
- Representative Dataset: A curated set of breeding data encompassing germplasm lists, phenotypic observations, and pedigree information from a recent season.
- Timer and Data Logging Sheet: For recording task completion times and error counts.
Methodology:
- Pre-Implementation Audit:
- Task Efficiency: Measure the time required for 3-5 users to complete core tasks using the old system (e.g., creating a field book for a trial of 200 entries, cleaning a dataset of 1000 phenotypic records, generating a summary report for a selection meeting).
- Data Quality Audit: In the same datasets, manually identify and count errors (e.g., missing values, formatting inconsistencies, entry mistakes).
- Process Mapping: Document the workflow from data collection to decision-making, noting bottlenecks and redundant data entry points [80].
System Implementation & Training:
- Implement the new integrated system and conduct standardized training for all users [84].
Post-Implementation Assessment:
- After a 3-month acclimatization period, repeat the Task Efficiency and Data Quality Audit measures using the new system and the same representative datasets.
- User Satisfaction Survey: Administer an anonymous survey asking users to rate their satisfaction with data accessibility, workflow efficiency, and confidence in data quality on a scale of 1-5.
Data Analysis:
- Calculate the percentage change in task completion times and error rates.
- Use the data in the ROI framework (Table 1) to compute financial ROI.
Workflow and Logical Relationships in ROI Evaluation
The following diagram visualizes the end-to-end workflow for evaluating the ROI of an integrated breeding data system, from initial setup to final calculation.
The Scientist's Toolkit: Key Research Reagent Solutions
Table 2: Essential Software and Tools for Modern Breeding Data Management
| Tool / Solution | Primary Function | Relevance to Integrated Data Management |
|---|---|---|
| BMS Pro [87] [83] | A comprehensive Breeding Management System suite. | Centralizes management of germplasm, studies, trait ontology, and genotyping data, creating a single source of truth for the breeding program. |
| QBMS [81] | An R package for querying breeding management systems. | Acts as middleware, using BrAPI standards to seamlessly pull integrated data from various platforms (e.g., BMS, BreedBase) into R for statistical analysis and decision-making. |
| BrAPI (Breeding API) [81] | An open-source API standard for plant breeding data. | The fundamental "reagent" that enables interoperability between different databases and tools, solving the core challenge of data silos. |
| AI/ML Algorithms [86] | Artificial Intelligence and Machine Learning models. | Used on integrated datasets to improve predictive accuracy for complex traits, enabling genomic selection and accelerating the identification of superior germplasm. |
| High-Throughput Phenotyping (HTPP) Systems [51] | Automated, non-invasive sensors for plant evaluation. | Generates large, standardized phenotypic datasets that are a critical input for the integrated system, requiring robust data pipelines for storage and analysis. |
Conclusion
The transformative potential of high-throughput plant phenotyping for crop improvement is inextricably linked to overcoming its significant data handling challenges. A holistic approach that combines technological innovation—particularly in AI and cloud computing—with the widespread adoption of data standards and FAIR principles is essential. Future progress hinges on developing more cost-effective and user-friendly solutions, fostering greater interdisciplinary collaboration between data scientists and plant biologists, and building robust data governance frameworks. By systematically addressing these data management hurdles, the research community can fully leverage HTP to accelerate the development of resilient crops, directly contributing to global food security in the face of climate change.
References
- 1. A Comprehensive Review of High Throughput ... [https://pmc.ncbi.nlm.nih.gov/articles/PMC9590503/]
- 2. Beware the three Vs of data - Volume, Variety and Velocity [https://vsni.co.uk/beware-the-three-vs-of-data-volume-variety-and-velocity/]
- 3. Smart breeding driven by big data, artificial intelligence ... [https://www.sciencedirect.com/science/article/pii/S1674205222002957]
- 4. Strategic Trends in Plant Phenotyping Market 2025-2033 [https://www.datainsightsmarket.com/reports/plant-phenotyping-540105]
- 5. The field phenotyping platform's next darling: Dicotyledons [https://pmc.ncbi.nlm.nih.gov/articles/PMC9449727/]
- 6. Data challenges for future plant gene editing: expert opinion [https://pmc.ncbi.nlm.nih.gov/articles/PMC8580900/]
- 7. A survey on advances and insights of image analysis ... [https://link.springer.com/article/10.1007/s44279-025-00379-1]
- 8. Advanced High-Throughput Phenotyping Techniques for ... [https://www.mdpi.com/2673-7655/5/2/8]
- 9. New UAV-based sensor delivers real-time, non-destructive ... [https://www.eurekalert.org/news-releases/1099540]
- 10. Design and application of a multi-source sensor data ... [https://www.maxapress.com/article/id/68a529acfa6c5840a9a9da80]
- 11. Advanced Plant Phenotyping Technologies for Enhanced ... [https://www.mdpi.com/2072-4292/17/7/1166]
- 12. A scalable and efficient UAV-based pipeline and deep ... [https://www.sciencedirect.com/science/article/pii/S2643651525000561]
- 13. 3D multimodal image registration for plant phenotyping [https://www.sciencedirect.com/science/article/pii/S0168169925006441]
- 14. High-throughput phenotyping in grapevine breeding ... [https://oeno-one.eu/article/view/8458]
- 15. Advancing Crop Resilience Through High-Throughput ... [https://pmc.ncbi.nlm.nih.gov/articles/PMC11944878/]
- 16. Unlocking the potential of plant phenotyping data through ... [https://www.sciencedirect.com/science/article/pii/S2452310017300069]
- 17. High-Throughput Phenotyping in Crop Innovation - Doriane [https://www.doriane.com/blog/high-throughput-phenotyping-in-crop-innovation]
- 18. FAIR Principles [https://www.go-fair.org/fair-principles/]
- 19. Addressing barriers in FAIR data practices for biomedical ... [https://www.nature.com/articles/s41597-023-01969-8]
- 20. FAIR data principles: What you need to know [https://tiledb.com/blog/fair-data-principles-explained]
- 21. FAIR principles for Research - Data Management for Research [https://guides.library.cmu.edu/researchdatamanagement/FAIR_principles]
- 22. Applying FAIR Principles to Plant Phenotypic Data ... [https://pmc.ncbi.nlm.nih.gov/articles/PMC7718628/]
- 23. Data Management in Biobanking: Strategies, Challenges, and ... [https://pmc.ncbi.nlm.nih.gov/articles/PMC11417763/]
- 24. Unlocking the potential of plant phenotyping data through ... [https://pmc.ncbi.nlm.nih.gov/articles/PMC7477990/]
- 25. Reproducible preclinical research—Is embracing variability ... [https://pmc.ncbi.nlm.nih.gov/articles/PMC5837077/]
- 26. Challenges of Big Data Analysis - PMC - PubMed Central [https://pmc.ncbi.nlm.nih.gov/articles/PMC4236847/]
- 27. GRABSEEDS: extraction of plant organ traits through image ... [https://plantmethods.biomedcentral.com/articles/10.1186/s13007-024-01268-2]
- 28. Data management challenges for artificial intelligence ... [https://f1000research.com/articles/10-324]
- 29. Automated generation of ground truth images of greenhouse ... [https://pmc.ncbi.nlm.nih.gov/articles/PMC12495773/]
- 30. Deep learning-based approach for phenotypic trait ... [https://pmc.ncbi.nlm.nih.gov/articles/PMC12477189/]
- 31. The PhenoLab – an automated, high-throughput ... [https://www.sciencedirect.com/science/article/pii/S2772375525000784]
- 32. 5 best practices for accelerating research computing with ... [https://aws.amazon.com/blogs/publicsector/5-best-practices-for-accelerating-research-computing-with-aws/]
- 33. A novel automated cloud-based image datasets for high ... [https://pmc.ncbi.nlm.nih.gov/articles/PMC11599996/]
- 34. Design and implementation of a high-throughput field ... [https://www.sciencedirect.com/science/article/pii/S2643651525000202]
- 35. Development and deployment of a big data pipeline for ... [https://www.sciencedirect.com/science/article/pii/S2772375523000953]
- 36. Plant Phenotyping Market Share, Trends & Growth 2025 ... [https://www.futuremarketinsights.com/reports/plant-phenotyping-market]
- 37. About < MIAPPE < EMBL-EBI [https://www.miappe.org/]
- 38. MIAPPE/ISA-Tab-for-plant-phenotyping [https://github.com/MIAPPE/ISA-Tab-for-plant-phenotyping]
- 39. the ontology‐driven Phenotyping Hybrid Information System [https://pmc.ncbi.nlm.nih.gov/articles/PMC6585972/]
- 40. 2025 Hybrid Workshop on data standards in Plant ... [https://www.helsinki.fi/en/infrastructures/national-plant-phenotyping/2025-hybrid-workshop-data-standards-plant-phenotyping]
- 41. 14 Most Common Data Quality Issues and How to Fix Them [https://lakefs.io/data-quality/data-quality-issues/]
- 42. How to Fix Data Quality Issues? Ultimate Guide for 2025 [https://atlan.com/how-to-fix-data-quality-issues/]
- 43. Support < MIAPPE < EMBL-EBI [https://www.miappe.org/support/]
- 44. High-throughput field crop phenotyping: current status and ... [https://pmc.ncbi.nlm.nih.gov/articles/PMC8987842/]
- 45. Utilizing UAV-based high-throughput phenotyping and ... [https://www.sciencedirect.com/science/article/abs/pii/S0168169925007082]
- 46. UAV-Based Phenotyping: A Non-Destructive Approach to ... [https://www.mdpi.com/2072-4292/16/19/3710]
- 47. Advanced Strategies for Organizing Experimental Data in ... [https://sparkco.ai/blog/advanced-strategies-for-organizing-experimental-data-in-2025]
- 48. The Top 5 Mistakes To Avoid While Flying Drones For ... [https://www.hiphen-plant.com/the-top-5-mistakes-to-avoid-while-flying-a-drone-for-agriculture/]
- 49. "High-Throughput Phenotyping of Early Generation Small ... [https://digitalcommons.usu.edu/etd2023/393/]
- 50. Resources for image-based high-throughput phenotyping in ... [https://pmc.ncbi.nlm.nih.gov/articles/PMC8561249/]
- 51. Pitfalls and potential of high-throughput plant phenotyping ... [https://pmc.ncbi.nlm.nih.gov/articles/PMC10481964/]
- 52. What is cost-efficient phenotyping? Optimizing costs for ... [https://www.sciencedirect.com/science/article/abs/pii/S0168945217311482]
- 53. How to make sense of 3D representations for plant phenotyping [https://plantmethods.biomedcentral.com/articles/10.1186/s13007-023-01031-z]
- 54. Analysis Approaches - PlantCV - Read the Docs [https://plantcv.readthedocs.io/en/latest/analysis_approach/]
- 55. EMPHASIS - European Plant Phenotyping Infrastructure [https://www.plant-phenotyping.org/Data_Policy]
- 56. which environmental stressors trigger calibration drift [https://www.clarity.io/blog/which-environmental-stressors-most-often-trigger-calibration-drift-and-necessitate-shorter-calibration-intervals]
- 57. FAQ PhenoScale (Drone Phenotyping) [https://www.hiphen-plant.com/faq-phenoscale/]
- 58. Precise and Continuous Biomass Measurement for Plant ... [https://pmc.ncbi.nlm.nih.gov/articles/PMC12349567/]
- 59. What Are Common Data Quality Issues? → Question [https://pollution.sustainability-directory.com/question/what-are-common-data-quality-issues/]
- 60. Environmental Data Management Best Practices - EDM - ITRC [https://edm-1.itrcweb.org/environmental-data-management-best-practices-overview-of-guidance-documents/]
- 61. Exploring validation and data integrity in pharma [https://pharmatimes.com/web_exclusives/exploring_validation_and_data_integrity_in_pharma_1246876/]
- 62. Applying FAIR Principles to Plant Phenotypic Data ... [https://www.sciencedirect.com/science/article/pii/S2643651524000025]
- 63. Optimizing High-Throughput Screening Workflows in ... [https://kanboapp.com/en/optimizing-high-throughput-screening-workflows-in-scientific-research-a-guide-to-improved-efficiency-and-data-integrity/]
- 64. Optimizations in High Throughput Process Development [https://www.halolabs.com/blog/high-throughput-process-development/]
- 65. Drivers of Change in High-throughput Screening ... [https://www.datainsightsmarket.com/reports/high-throughput-screening-technology-1471015]
- 66. United States High-Throughput Screening Technology ... [https://www.linkedin.com/pulse/united-states-high-throughput-screening-technology-market-tykec/]
- 67. A novel way to validate UAS-based high - throughput ... phenotyping [https://pubmed.ncbi.nlm.nih.gov/33216217/]
- 68. Research Data Management Toolkit (RDMkit) [https://zenodo.org/records/7148792]
- 69. Data visualisation: colours - Government Analysis Function [https://analysisfunction.civilservice.gov.uk/policy-store/data-visualisation-colours-in-charts/]
- 70. Top Plant Phenotyping Companies & How to Compare ... [https://www.linkedin.com/pulse/top-plant-phenotyping-companies-how-bl7le/]
- 71. Limitations to High Throughput Phenotyping [https://passel2.unl.edu/view/lesson/6241e9314ecf/14]
- 72. Understanding plant phenotypes in crop breeding through ... [https://pmc.ncbi.nlm.nih.gov/articles/PMC12483962/]
- 73. Computer Vision Problems in Plant Phenotyping (CVPPP ... [https://www.plant-phenotyping.org/CVPPP2020]
- 74. More eyes on the prize: open-source data, software and ... [https://pmc.ncbi.nlm.nih.gov/articles/PMC10071051/]
- 75. Hiphen - Plant Phenotyping and Crop Image Analytics Solutions [https://www.hiphen-plant.com/]
- 76. IHUP: An Integrated High-Throughput Universal ... [https://www.sciencedirect.com/science/article/pii/S2643651524002607]
- 77. An Open-Source Software for High-Throughput Field Plant ... [https://www.sciencedirect.com/science/article/pii/S2643651524002358]
- 78. High-Throughput Automated Plant Phenotyping System [https://phenospex.com/products/plant-phenotyping/traitfinder-automated-plant-phenotyping-system/]
- 79. 11 Best Open-Source Data Analytics Tools in 2025 | Estuary [https://estuary.dev/blog/open-source-data-analytics-tools/]
- 80. How to Measure the ROI of System Integration Services [https://osher.com.au/blog/measure-roi-system-integration-services/]
- 81. QBMS 2.0: Advancing Data Integration for Modern Plant ... [https://icarda.org/media/news/qbms-20-advancing-data-integration-modern-plant-breeding]
- 82. Maximizing Results: The ROI of Investing in Plant Breeding ... [https://www.linkedin.com/pulse/maximizing-results-roi-investing-plant-breeding-enid-whesc]
- 83. User manual [https://bmspro.io/1903/training/bms-user-manual/introduction]
- 84. FAQ [https://www.integratedbreeding.net/1838/our-work/faq]
- 85. How to Calculate Data Integration ROI Effectively? [https://airbyte.com/data-engineering-resources/data-integration-roi]
- 86. Improving plant breeding through AI-supported data ... [https://pubmed.ncbi.nlm.nih.gov/40455285/]
- 87. Breeding Management System | Integrated Breeding Platform ... [https://bmspro.io/]