Nanosensors vs. Conventional Sensors: A 2025 Benchmarking Guide for Agricultural Researchers
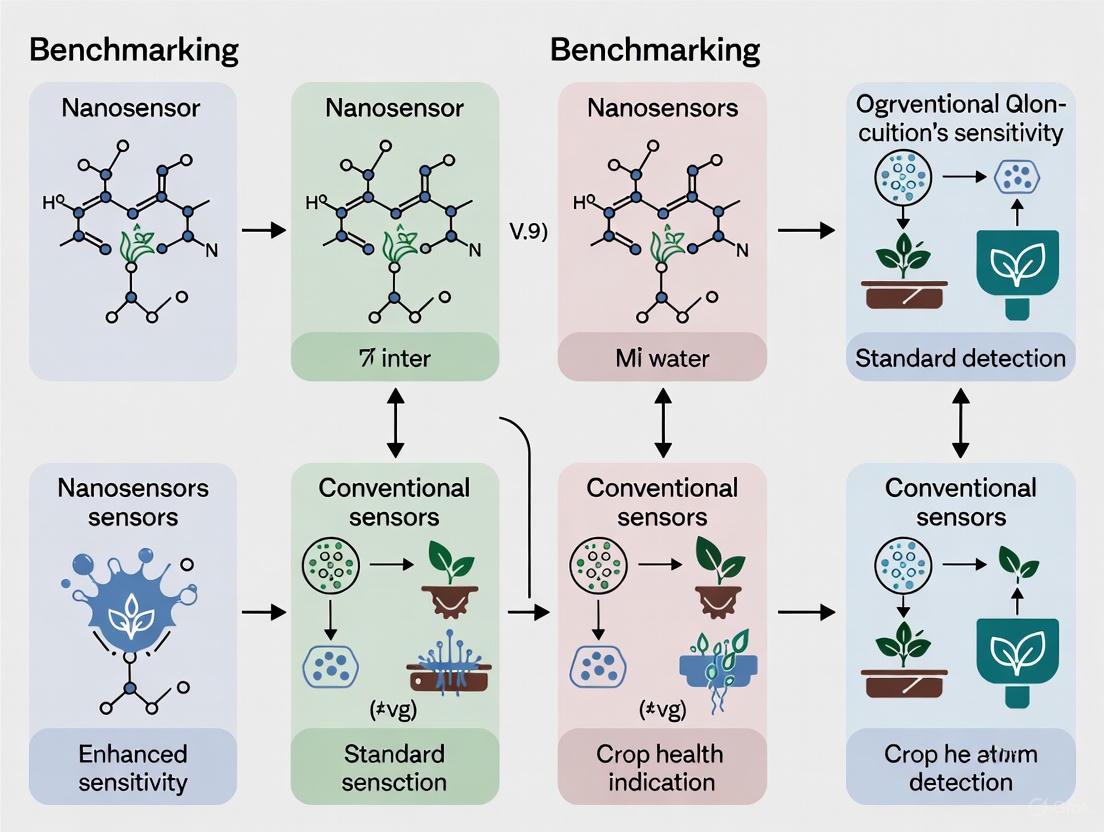
This article provides a comprehensive benchmarking analysis for researchers and scientists evaluating the transition from conventional agricultural sensors to emerging nanosensor technologies.
Nanosensors vs. Conventional Sensors: A 2025 Benchmarking Guide for Agricultural Researchers
Abstract
This article provides a comprehensive benchmarking analysis for researchers and scientists evaluating the transition from conventional agricultural sensors to emerging nanosensor technologies. It explores the foundational principles of both sensor classes, detailing the unique physicochemical properties of nanomaterials that enable enhanced sensitivity and real-time analysis. The scope extends to methodological applications in soil, crop, and climate monitoring, troubleshooting of integration and data management challenges, and a direct performance comparison on key metrics like detection limits, cost, and scalability. Synthesizing current research and field data, this analysis aims to equip professionals with the evidence needed to make informed decisions for integrating advanced sensing into agricultural research and development.
Sensor Fundamentals: Unpacking the Core Technologies from Macro to Nano
In the evolving landscape of precision agriculture, conventional agricultural sensors form the technological backbone that enables data-driven decision-making. These sensors function as the critical interface between the physical conditions of the farm and the digital management systems that interpret this data. Conventional agricultural sensors are defined as devices that respond to physical, chemical, or biological parameters in the agricultural environment and convert these measurements into quantifiable electrical or optical signals [1]. Unlike their emerging nanosensor counterparts, these conventional technologies have established field-proven applications and form the current market dominance in precision farming solutions.
The operational framework for these sensors consistently follows a tripartite architecture: a sensitive element that directly interacts with the measured parameter (e.g., temperature, humidity, nutrient content), a conversion element that transforms the physical or chemical change into an electrical signal, and a measurement circuit that processes this signal for subsequent data interpretation and action [1]. This fundamental principle governs the functionality of diverse sensor types across agricultural applications, from soil monitoring to climate control and yield optimization. The global agricultural sensor market reflects the entrenched position of these technologies, with soil management applications alone representing 34% of the market share in 2024 [2].
Classification and Operational Principles of Conventional Sensors
Conventional agricultural sensors can be systematically categorized based on their target parameters and underlying detection mechanisms. The operational principles dictate their application specificity, performance characteristics, and integration requirements within precision farming systems.
Physical Sensors for Environmental Monitoring
Humidity sensors demonstrate two predominant working principles in agricultural applications: capacitive and resistive sensing. Capacitive humidity sensors operate on the principle of dielectric constant changes in a hygroscopic material sandwiched between two electrodes forming a capacitor. When water vapor molecules enter the sensing layer, the dielectric constant changes, directly altering the capacitance value which is then converted to a measurable electrical signal corresponding to relative humidity [1]. These sensors typically employ polymers like polyvinylpyrrolidone (PVP) or ceramic materials such as porous alumina as the humidity-sensitive dielectric layer, prized for their high responsiveness to water molecules and stability in harsh agricultural environments [1].
Resistive air humidity sensors utilize moisture-sensitive materials whose electrical resistance varies significantly with changes in ambient humidity. When humidity increases, the moisture-sensitive material adsorbs water molecules, creating closer contact between conductive particles and reducing resistance. Conversely, decreasing humidity causes water molecule release, increasing particle distance and raising resistance values [1]. The internal circuitry detects these resistance changes and converts them into corresponding humidity readings. While generally less expensive than capacitive sensors, resistive variants may exhibit slower response times and reduced long-term stability in fluctuating agricultural environments.
Temperature and humidity sensors collectively enable microclimate monitoring essential for greenhouse control, pest and disease prediction, and crop scheduling. These sensors provide critical data for managing environmental extremes that could impact crop development and resource allocation decisions [3].
Mechanical and Electrochemical Sensors for Soil Analysis
Soil moisture sensors dominate the conventional sensor landscape, accounting for 28% of the agricultural sensor market in 2024 [2]. These devices employ various technologies including time-domain reflectometry (TDR), frequency-domain reflectometry (FDR), and capacitance methods to measure soil water content. The operational principle common to these techniques involves measuring the dielectric constant of soil, which changes dramatically with water content due to water's high dielectric constant (~80) compared to soil minerals (~3-5) and air (~1) [3]. These sensors provide real-time data for precision irrigation, significantly conserving water resources while maintaining optimal root zone conditions.
Electrochemical sensors deliver critical information about soil chemistry through several detection principles. Potentiometric sensors measure voltage (electromotive force) between reference and indicator electrodes to determine specific ion activities, primarily used for soil pH monitoring. Voltammetric sensors apply a controlled potential and measure the resulting current, enabling detection of multiple ions simultaneously, particularly beneficial for measuring nutrient concentrations like nitrates and phosphates in soil solutions [3]. Conductimetric sensors measure the electrical conductivity of soils, correlating to salinity levels and dissolved ion content, which is vital for managing soil health in irrigated agriculture.
Nutrient sensors specifically target essential plant nutrients including nitrogen (N), phosphorus (P), and potassium (K) through both direct and indirect measurement approaches. Optical nutrient sensors frequently employ absorption spectroscopy principles where specific nutrients absorb characteristic wavelengths of light, while electrochemical approaches utilize ion-selective electrodes that generate potentials proportional to the logarithm of specific ion activities [3]. These technologies enable precision fertilization, reducing waste and environmental impact while maintaining optimal plant nutrition.
Optical Sensors for Crop Health Assessment
Optical sensors leverage light reflectance and remote sensing technologies to assess vegetation health, detect stress, and monitor growth stages. These sensors typically operate on the principle that plant pigments (chlorophyll, carotenoids) and cellular structures interact with specific wavelengths of light, creating spectral signatures that correlate with physiological status [3]. Multispectral sensors capture reflectance data at specific wavelength bands including visible and near-infrared regions, while hyperspectral sensors provide higher spectral resolution across contiguous bands.
The Normalized Difference Vegetation Index (NDVI) represents one of the most established applications of optical sensing, calculating the ratio between reflected near-infrared and red light to assess plant health and density [3]. Healthier vegetation with more chlorophyll strongly absorbs red light for photosynthesis while reflecting more near-infrared light due to cellular structure, yielding higher NDVI values. These sensors enable early detection of stress, disease, or nutrient deficiencies before visible symptoms appear, allowing for targeted interventions across large agricultural areas.
Table 1: Conventional Agricultural Sensors: Operating Principles and Performance Characteristics
| Sensor Category | Specific Sensor Type | Operating Principle | Measured Parameters | Key Performance Metrics |
|---|---|---|---|---|
| Physical Sensors | Capacitive Humidity | Dielectric constant change in hygroscopic material | Relative Humidity | Sensitivity: 0.1% RH; Accuracy: ±1-2% RH [1] |
| Resistive Humidity | Electrical resistance change in moisture-sensitive material | Relative Humidity | Accuracy: ±3-5% RH; Slower response time [1] | |
| Soil Moisture (TDR/FDR) | Dielectric constant measurement of soil | Volumetric Water Content | Accuracy: ±2-3%; Market share: 28% (2024) [2] | |
| Electrochemical Sensors | Potentiometric | Voltage measurement between reference/indicator electrodes | pH, Specific Ions | pH Resolution: 0.01 pH; Ion-specific detection [3] |
| Voltammetric | Current measurement under controlled potential | Multiple ions simultaneously | Multi-ion detection; sub-ppm detection limits | |
| Conductimetric | Electrical conductivity measurement | Soil Salinity, Dissolved Ions | Correlation to salt content; Range: 0-20 dS/m | |
| Optical Sensors | NDVI (Multispectral) | Ratio of NIR to red light reflectance | Vegetation Health, Biomass | Early stress detection; Yield correlation: 10-12% improvement [3] |
| Nutrient Sensors | Light absorption at characteristic wavelengths | N, P, K concentrations | Non-destructive assessment; ~8% yield improvement [3] |
Experimental Protocols for Sensor Performance Benchmarking
Robust experimental methodologies are essential for evaluating conventional sensor performance under controlled laboratory conditions and authentic field environments. Standardized protocols enable meaningful comparison between conventional and emerging nanosenor technologies.
Laboratory Calibration and Characterization Protocol
Objective: To establish baseline accuracy, sensitivity, detection limits, and response characteristics of conventional agricultural sensors under controlled conditions.
Materials and Equipment:
- Sensor units under investigation (minimum n=5 for statistical significance)
- Certified reference materials or analytical standards specific to target analytes
- Environmental chamber for temperature and humidity control (operating range: -10°C to 60°C, 10-95% RH)
- Data acquisition system with minimum sampling frequency of 1 Hz
- Standard laboratory instruments for validation (e.g., precision balance, pH meter, spectrophotometer)
Procedure:
- Sensor Conditioning: Activate sensors according to manufacturer specifications and stabilize in controlled environment (25°C, 50% RH) for 24 hours before initial measurements.
- Accuracy Assessment: Expose sensors to minimum five concentration levels of target analytes using certified reference standards. For humidity sensors, utilize saturated salt solutions generating specific RH levels (11%-97% RH) in sealed chambers [1].
- Response Time Determination: Subject sensors to step changes in analyte concentration while recording output at 1-second intervals. Calculate response time as duration to reach 90% of final stable reading.
- Sensitivity Calculation: Determine slope of calibration curve (sensor output versus analyte concentration) across linear working range.
- Repeatability Evaluation: Perform minimum seven replicate measurements at mid-range concentration, calculating coefficient of variation.
- Temperature Compensation: Characterize sensor output across operational temperature range (0-50°C) at constant analyte concentration to establish temperature compensation algorithms.
Data Analysis:
- Calculate root mean square error (RMSE) between sensor readings and reference values
- Determine limit of detection (LOD) as three times standard deviation of blank measurements
- Establish measurement uncertainty through propagation of error analysis
Field Validation Protocol for Agricultural Applications
Objective: To evaluate sensor performance, durability, and reliability under actual agricultural operating conditions.
Experimental Design:
- Site Selection: Identify multiple representative field locations with varying soil types, topography, and microclimate conditions
- Sensor Deployment: Install sensors according to agricultural guidelines (e.g., soil sensors at multiple depths within root zone)
- Reference Sampling: Collect and laboratory-analyze physical samples (soil, water, plant tissue) coincident with sensor measurements using standardized protocols [3]
- Temporal Framework: Conduct continuous monitoring for minimum one complete growing season with periodic performance verification
Parameters Quantified:
- Field Accuracy: Correlation between sensor readings and laboratory analysis of co-located samples
- Operational Reliability: Percentage of operational time without failure or drift requiring recalibration
- Environmental Resilience: Performance maintenance under extreme conditions (precipitation, temperature spikes, mechanical disturbance)
- Data Consistency: Long-term stability of measurements without recalibration
Statistical Analysis:
- Compute concordance correlation coefficient (CCC) between sensor data and reference methods
- Perform analysis of variance (ANOVA) to identify significant performance differences across environmental conditions
- Calculate mean time between failures (MTBF) for reliability assessment
Performance Data and Comparative Analysis
The benchmarking of conventional agricultural sensors reveals distinct performance patterns across sensor categories, with trade-offs between accuracy, reliability, cost, and operational requirements.
Table 2: Comparative Performance Benchmarking of Conventional Agricultural Sensors
| Sensor Type | Accuracy | Response Time | Field Reliability | Cost Index | Key Limitations |
|---|---|---|---|---|---|
| Capacitive Humidity | ±1-2% RH | 10-30 seconds | High (>90% uptime) | Medium | Calibration drift in dusty conditions [1] |
| Resistive Humidity | ±3-5% RH | 30-60 seconds | Medium (75-85% uptime) | Low | Contamination sensitivity, slower response [1] |
| Soil Moisture (TDR) | ±2-3% VWC | Near-instantaneous | High | High | Soil-specific calibration required [2] |
| Electrochemical pH | ±0.1 pH | 30-90 seconds | Low-Medium (frequent recalibration) | Low-Medium | Reference electrode drift, soil contact dependency |
| Optical NDVI | ±0.05 NDVI units | Immediate (satellite) | Very High | Varies widely | Atmospheric interference, limited depth information |
| Nutrient Sensors (Ion-Selective) | ±10-15% concentration | 60-120 seconds | Low (fouling issues) | Medium | Ion interference, regular membrane replacement |
The data reveals several key trends in conventional sensor performance. Physical sensors (humidity, soil moisture) generally demonstrate superior field reliability and faster response times compared to electrochemical alternatives, making them well-suited for automated control systems in precision agriculture. However, electrochemical sensors provide unique capabilities for specific chemical parameter measurement despite requiring more intensive maintenance and demonstrating lower field reliability. Optical sensors offer exceptional spatial coverage and immediate response but face limitations regarding depth penetration and atmospheric dependencies.
The implementation challenges for conventional sensors significantly impact their operational effectiveness in agricultural settings. Environmental factors including soil compaction, temperature extremes, and chemical exposure contribute to calibration drift and measurement inaccuracies. Technical limitations such as power requirements, connectivity issues in rural areas, and specialized installation needs create barriers to widespread adoption, particularly for smallholder farmers [2]. The financial considerations extend beyond initial acquisition costs to include ongoing maintenance, calibration, and data management expenses that collectively impact the total cost of ownership.
Visualization of Sensor Operational Frameworks
The functional relationships and operational workflows of conventional agricultural sensors can be visualized through structured diagrams that highlight their core operating principles and data pathways.
Operational Architecture of Conventional Agricultural Sensors
Comparative Performance Evaluation Workflow
Essential Research Reagent Solutions for Sensor Evaluation
The experimental evaluation of conventional agricultural sensors requires specific reagents, reference materials, and calibration standards to ensure accurate performance assessment and valid comparative analysis.
Table 3: Essential Research Reagents and Materials for Sensor Performance Evaluation
| Reagent/Material | Technical Specification | Primary Application | Function in Experimental Protocol |
|---|---|---|---|
| Saturated Salt Solutions | Lithium chloride, Magnesium chloride, Sodium chloride, Potassium sulfate, Potassium nitrate | Humidity sensor calibration | Generate specific relative humidity levels (11%-97% RH) in sealed environments for sensor calibration [1] |
| Certified Reference Materials | NIST-traceable soil/water standards with certified analyte concentrations | Sensor accuracy validation | Provide verified analyte concentrations for establishing measurement accuracy and detection limits |
| Buffer Solutions | pH 4.01, 7.00, 10.01 ±0.02 at 25°C | pH sensor calibration | Establish calibration curve and verify sensor response across pH range |
| Ion Standard Solutions | 1000 ppm stock solutions of NO₃⁻, NH₄⁺, K⁺, PO₄³⁻ | Nutrient sensor evaluation | Prepare concentration gradients for sensitivity determination and interference testing |
| Dielectric Reference Materials | Certified materials with known dielectric constants | Soil moisture sensor validation | Verify sensor response to known dielectric properties independent of soil-specific factors |
| Conductivity Standards | KCl solutions at specified conductivities (e.g., 1413 μS/cm) | Salinity sensor calibration | Establish correlation between sensor output and solution conductivity |
The selection and proper application of these research reagents directly impacts the validity and reproducibility of sensor performance data. Certified reference materials with established traceability to national standards provide the foundation for accuracy claims, while specialized solutions like saturated salt salts enable controlled environmental conditioning. Proper handling, storage, and documentation of these materials according to manufacturer specifications is essential for maintaining experimental integrity throughout the benchmarking process.
Conventional agricultural sensors employ well-established operational principles that have been refined through decades of field application and technological iteration. Their operational frameworks—based on measurable changes in electrical, optical, or chemical properties in response to environmental parameters—provide reliable performance for precision agriculture applications. The comparative performance data reveals a consistent pattern of trade-offs, with physical sensors generally demonstrating superior field reliability while electrochemical alternatives offer specific chemical sensing capabilities despite greater maintenance requirements.
The established infrastructure, comparative affordability, and proven reliability of conventional sensors in controlled agricultural environments maintain their position as the foundational technology for precision agriculture. Their operational principles and performance characteristics provide the essential baseline against which emerging nanosensor technologies must demonstrate not only superior theoretical performance but also practical advantages in complex, real-world agricultural environments. This comparative framework establishes the critical reference point for meaningful advancement in agricultural sensing technologies.
Modern agriculture faces the dual challenge of enhancing productivity to ensure food security while minimizing its environmental footprint. Central to this challenge is the precise monitoring of key agricultural parameters, from soil conditions to pesticide residues. Conventional sensors and analytical methods, while effective, are often constrained by their limited sensitivity, selectivity, portability, and the need for skilled personnel and sophisticated laboratory infrastructure. The emergence of nanosensors, which exploit the unique physicochemical properties of nanoscale materials, presents a paradigm shift. These devices offer the potential for rapid, sensitive, and on-site analysis, enabling real-time decision-making. This guide provides an objective comparison between nanosensors and conventional agricultural sensors, underpinned by experimental data and detailed methodologies, to serve as a benchmark for researchers and development professionals in the field.
Performance Comparison: Nanosensors vs. Conventional Analytical Methods
The superiority of nanosensors is evident from direct comparisons of key analytical metrics. The table below summarizes experimental data for the detection of pesticides, a major area of agricultural concern, contrasting traditional chromatography with advanced nanosensing platforms.
Table 1: Performance comparison of conventional and nanosensor-based pesticide detection methods.
| Detection Method | Target Pesticide | Limit of Detection (LOD) | Analysis Time | Key Advantages | Key Limitations |
|---|---|---|---|---|---|
| Gas Chromatography (GC) | Various Organochlorines | Low (ppt-ppb) [4] | Hours (incl. sample prep) [4] | High sensitivity, established standard | Costly equipment, requires skilled personnel, not portable [4] |
| High-Performance Liquid Chromatography (HPLC) | Various Carbamates | Low (ppt-ppb) [4] | Hours (incl. sample prep) [4] | High sensitivity, broad applicability | Time-consuming, complex sample prep, not for on-site use [4] |
| Electrochemical Nanosensor (AChE Inhibition) | Organophosphorus (OP) | 0.38 pM [4] | Minutes [4] | Ultra-sensitive, rapid, potential for portability | Measures total OP, not specific compounds [4] |
| Colorimetric Nanozyme Sensor (Paper-based) | Malathion (OP) | 0.08 mg/L [4] | ~10 minutes [4] | Low-cost, visual/ smartphone readout, user-friendly | Less sensitive than some other nanosensors [4] |
Quantitative data reveals that nanosensors can achieve exceptional sensitivity, rivaling or even surpassing gold-standard laboratory techniques, as demonstrated by the 0.38 pM LOD for OPs [4]. The most significant advantage, however, lies in analysis speed and portability. Nanosensors reduce detection times from hours to minutes, enabling real-time monitoring and on-site decision-making, which is not feasible with conventional chromatography [4]. Furthermore, the development of platforms like paper-based sensors and microfluidic chips significantly lowers costs and simplifies operation, making advanced analytical capabilities accessible without sophisticated laboratory infrastructure [4].
Experimental Protocols for Nanosensor Benchmarking
To ensure consistent and comparable performance evaluation, researchers must adhere to detailed experimental protocols. The following section outlines standard methodologies for key nanosensor types used in agricultural applications.
Protocol for Fluorescence-Based Nanosensor Characterization
This protocol is applicable to nanosensors like Carbon Dots (CDs) or Quantum Dots (QDs) used for detecting ions or pH.
- Nanosensor Synthesis: Synthesize pH-sensitive Carbon Dots (CDs) via a one-step reaction from a single precursor (e.g., Rhodamine B) to ensure biocompatibility and stability across a broad pH range (1-11) [5].
- Sample Preparation: Prepare a series of standard buffer solutions covering the pH range of interest (e.g., 1 to 11). Introduce the CD nanosensors into each buffer solution.
- Data Acquisition & Imaging:
- Use Fluorescence Lifetime Imaging Microscopy (FLIM) for quantitative measurement [5] [6].
- Record the fluorescence lifetime (τ) of the CDs at each pH level. The lifetime should exhibit a pseudo-linear response to pH changes due to protonation/deprotonation of the CD surface [5].
- For intracellular studies (e.g., monitoring lysosomal pH), incubate living cells (e.g., human skin fibroblasts) with the CD nanosensors. Apply FLIM to quantify fluorescence lifetime and map pH distribution within cellular organelles [5].
- Data Analysis: Plot the fluorescence lifetime (τ) against pH to generate a calibration curve. This self-referencing relationship allows for the precise quantification of pH in unknown samples [5].
Protocol for Electrochemical Nanosensor for Pesticide Detection
This protocol details the standard methodology for enzyme inhibition-based nanosensors.
- Sensor Fabrication: Functionalize a transducer surface (e.g., a screen-printed electrode) with nanomaterials (e.g., CdTe Quantum Dots) and the enzyme Acetylcholinesterase (AChE) [4].
- Baseline Measurement:
- Introduce the substrate acetylthiocholine (ATCh) to the sensor.
- AChE catalyzes ATCh hydrolysis, producing thiocholine, which quenches the fluorescence of QDs (or generates an electrochemical signal) [4].
- Record the signal (e.g., fluorescence intensity or current) as the baseline.
- Inhibition Phase: Expose the sensor to a sample containing Organophosphorus (OP) pesticides. OPs inhibit AChE activity.
- Signal Measurement Post-Inhibition: Re-introduce ATCh. The inhibited AChE results in reduced production of thiocholine, leading to a recovery of the QD fluorescence (or a diminished electrochemical signal) [4].
- Quantification: The degree of signal recovery is inversely proportional to the OP concentration. Compare the signal to a calibration curve obtained with OP standards to determine the concentration in the unknown sample [4].
Benchmarking In Vivo Nanosensor Performance
For a standardized comparison of delivery and targeting efficiency across nanosensor platforms, a pre-clinical benchmarking protocol is recommended.
- Animal Model: Use athymic Nu/Nu mice with subcutaneously implanted LS174T cells [7].
- Tumor Growth: Allow tumors to grow to a standardized size of 8–10 mm in diameter [7].
- Nanosensor Administration: Inject a fixed dose of nanosensors, e.g., 10^13 particles per mouse, via a relevant route [7].
- Pharmacokinetics & Biodistribution: At fixed time points post-injection (e.g., 6, 24, and 48 hours), collect blood and tissues (e.g., tumor, liver, spleen). Quantify nanosensor concentration in each sample and report as % Injected Dose (%ID) and %ID per gram of tissue (%ID/g) [7].
- Physicochemical Reporting: Fully characterize the nanosensors' size, shape, composition, surface chemistry, and zeta potential, as these properties critically influence performance [7].
Signaling Pathways and Experimental Workflows
The enhanced functionality of nanosensors arises from their unique transduction mechanisms at the nanoscale. The following diagrams illustrate the fundamental workflows and signaling principles.
Fluorescence Lifetime Sensing Mechanism
Diagram Title: Carbon Dot pH Sensing via FLIM
This diagram visualizes the mechanism of Carbon Dot (CD)-based pH sensing. In an acidic environment, the CD surface becomes protonated. This protonation event alters the electronic structure of the CD, leading to a measurable change in its fluorescence lifetime (τ). Fluorescence Lifetime Imaging Microscopy (FLIM) detects this lifetime shift, which is independent of sensor concentration, allowing for the creation of a quantitative pH map without the need for internal calibration [5] [6].
Enzyme Inhibition Pesticide Detection
Diagram Title: Enzyme Inhibition Pesticide Detection
This workflow outlines the principle of enzymatic nanosensors for pesticide detection. The active AChE enzyme hydrolyzes the substrate ATCh, producing thiocholine which quenches a quantum dot's fluorescence, generating a signal. When an Organophosphorus pesticide is introduced, it inhibits the AChE enzyme. Upon re-adding the substrate, the inhibited enzyme cannot produce thiocholine, leading to a recovery of the fluorescence signal. The degree of signal recovery is proportional to the pesticide concentration [4].
The Scientist's Toolkit: Key Research Reagent Solutions
The development and deployment of high-performance nanosensors rely on a specific set of materials and reagents. The following table details essential components and their functions in agricultural nanosensor research.
Table 2: Essential Research Reagent Solutions for Agricultural Nanosensor Development.
| Reagent/Material | Function in Research | Specific Examples & Notes |
|---|---|---|
| Acetylcholinesterase (AChE) | Biorecognition Element: Key enzyme for detecting organophosphorus and carbamate pesticides via inhibition mechanism [4]. | Must be stabilized when immobilized on nanosurfaces; critical for sensor selectivity and stability [4]. |
| Carbon Dots (CDs) | Fluorescent Transducer: Nanoscale carbon material used for optical sensing of pH and ions; offers biocompatibility and photostability [5]. | Can be synthesized from various precursors (e.g., Rhodamine B); fluorescence lifetime is pH-dependent [5]. |
| Quantum Dots (QDs) | Signal Reporter: Semiconductor nanoparticles used in fluorescence-based assays; offer high photostability and tunable emission [6]. | Used in FRET-based sensors and as fluorescent labels in inhibition assays (e.g., CdTe QDs) [4] [6]. |
| Molecularly Imprinted Polymers (MIPs) | Biomimetic Receptor: Synthetic polymers with tailor-made cavities for specific molecular recognition, offering an alternative to biological receptors [4]. | Provide high stability and lower cost than antibodies; used as recognition elements in sensor design [4]. |
| Aptamers | Synthetic Bioreceptor: Single-stranded DNA or RNA oligonucleotides that bind specific targets with high affinity; selected via SELEX [8]. | Offer high stability and design flexibility; can be selected for pesticides, toxins, or other analytes [8]. |
| Screen-Printed Electrodes (SPEs) | Transducer Platform: Low-cost, disposable, and portable electrochemical cells ideal for field-deployable sensor design [4]. | Enable miniaturization and mass production of electrochemical nanosensors for on-site testing [4]. |
The quantitative data and standardized protocols presented in this guide objectively demonstrate that nanosensors leverage their unique nanoscale properties to overcome critical limitations of conventional agricultural sensors. The benchmarked performance—marked by superior sensitivity, rapid analysis, and potential for on-site, user-friendly operation—solidifies their role in the future of precision agriculture. For researchers, the path forward involves not only refining sensor design but also addressing challenges such as environmental impact and cost-effective mass production [9] [4]. By adhering to rigorous benchmarking standards, the scientific community can accelerate the translation of these revolutionary tools from the laboratory to the field, ultimately contributing to more sustainable and productive agricultural practices.
The advancement of precision agriculture is fundamentally linked to our ability to monitor agricultural environments with unprecedented accuracy and specificity. At the heart of this monitoring capability are sensors, devices that transform chemical or biological stimuli into quantifiable signals [10]. The performance, reliability, and applicability of these sensors are dictated by their core components: the sensing elements (or recognition elements) that provide selectivity by interacting with specific target analytes, and the transduction materials that convert this recognition event into a measurable electrical or optical signal [11] [12].
This guide provides a structured comparison of these critical components, benchmarking emerging nanosensors against conventional agricultural sensors. It is designed to equip researchers and scientists with the empirical data and methodological frameworks needed to select appropriate materials for specific agricultural sensing applications, from detecting pesticide residues in food products to monitoring soil health in real-time [11] [13].
Sensing Elements: A Comparison of Recognition Mechanisms
Sensing elements define the selectivity of a sensor. These components are engineered to bind specifically to a target analyte, initiating the sensing process. The choice of recognition element is crucial, as it determines the sensor's specificity, stability in complex matrices (like soil or food products), and overall practicality for field use [11].
Table 1: Comparative Analysis of Sensing Elements in Agricultural Sensors
| Sensing Element | Mechanism of Action | Key Advantages | Inherent Limitations | Exemplary Agricultural Application |
|---|---|---|---|---|
| Enzymes (e.g., AChE) | Catalytic inhibition or substrate conversion [11]. | High catalytic activity and specificity; well-understood mechanisms [11]. | Limited stability and shelf-life; sensitive to environmental conditions (pH, temperature) [11]. | Detection of organophosphorus pesticides via AChE inhibition [11]. |
| Antibodies | High-affinity antigen-antibody binding [11]. | Exceptional specificity and affinity for target molecules. | Complex and costly production; susceptible to denaturation; large size can limit diffusion [11]. | Immunoassays for mycotoxins or specific pesticide classes. |
| Aptamers (ssDNA/RNA) | Folding into 3D structures that bind targets with high affinity [11]. | Chemical stability; in vitro selection; small size; reusability [11]. | Susceptibility to nuclease degradation; potential for nonspecific binding in complex matrices. | Detection of small molecules like antibiotics or pesticides in food [11]. |
| Molecularly Imprinted Polymers (MIPs) | Synthetic polymers with tailor-made cavities complementary to the target analyte [11]. | High physical/chemical robustness; stability in harsh conditions; lower cost [11]. | Challenges with homogeneity and reproducibility of binding sites; slower binding kinetics. | Solid-phase extraction and sensing of pesticides in complex food samples [11]. |
| Ion-Selective Membranes (e.g., VEN-TPB ion-pair) | Selective partitioning of ions at the membrane-sample interface, generating a potential difference [14]. | Excellent selectivity for specific ions; proven long-term stability; suitable for miniaturization [14]. | Requires careful membrane formulation; can be sensitive to lipophilic interferents. | Potentiometric detection of soil macronutrients (e.g., K+, NO3-) or drug residues [14]. |
Transduction Materials: Converting Recognition into Readable Signals
Once a recognition event occurs, transduction materials transform it into a quantifiable output. The nature of this material directly impacts the sensor's sensitivity, detection limit, and suitability for integration into portable or wireless devices [12] [14].
Table 2: Comparative Analysis of Transduction Materials and Mechanisms
| Transduction Mechanism | Transduction Material Examples | Signal Output | Detection Limit/Sensitivity | Advantages & Disadvantages |
|---|---|---|---|---|
| Electrochemical | Multi-Walled Carbon Nan nanotubes (MWCNTs), Polyaniline (PANI), Ferrocene [14]. | Change in potential, current, or impedance [11] [14]. | MWCNT-based SC-ISEs demonstrated LOD of 3.8 × 10⁻⁶ mol/L for VEN [14]. | + High sensitivity, portability, low cost [11]. – Can be susceptible to signal drift (mitigated by good SC materials) [14]. |
| Optical | Quantum Dots (CdTe), Gold Nanoparticles, Upconverting Nanoparticles [11] [12]. | Change in fluorescence, color, or absorbance [11] [12]. | CdTe QD-based sensor for OPs: LOD of 0.38 pM [11]. CuONP-based colorimetric sensor: LOD of 0.08 mg/L [11]. | + Suited for multiplexing and visual readout [11] [12]. – Instrumentation can be bulky; signal can be interfered with by ambient light or sample turbidity. |
| Magnetic | Iron Oxide Nanoparticles (Fe₃O₄) [12]. | Change in transverse relaxation time (T₂) of water protons [12]. | Used for detection of pathogens and organic pollutants [12]. | + Minimal interference from complex sample matrices [12]. – Lower sensitivity compared to optical/electrochemical methods; requires NMR relaxometry [12]. |
The following diagram illustrates the fundamental workflow and material involvement in a nanosensor's operation, from analyte binding to signal output.
Benchmarking Nanosensors Against Conventional Counterparts
The integration of nanotechnology into sensor design has led to significant performance enhancements. The tables below provide a quantitative and qualitative comparison between nanosensors and conventional sensors for key agricultural applications.
Table 3: Quantitative Performance Benchmarking: Pesticide Residue Detection
| Sensor Type | Specific Technology | Target Analyte | Detection Limit | Analysis Time | Reference |
|---|---|---|---|---|---|
| Conventional | Gas Chromatography-Mass Spectrometry (GC-MS) | Multi-class pesticides | ~ppb level | >30 minutes (incl. sample prep) | [11] |
| Nanosensor | CdTe Quantum Dot Fluorescent Microfluidic Sensor | Organophosphorus Pesticides | 0.38 pM (sub-ppb) | Rapid | [11] |
| Nanosensor | CuO Nanozyme Paper-based Device | Malathion | 0.08 mg/L (ppb) | ~10 minutes | [11] |
Table 4: Qualitative Functional Benchmarking for Agricultural Applications
| Characteristic | Conventional Sensors / Methods | Nanosensors | Implication for Agricultural Research |
|---|---|---|---|
| Sensitivity | Moderate to High | Very High (single-molecule potential) [12] | Enables detection of trace contaminants (e.g., pesticides) at biologically relevant levels [11]. |
| Selectivity | Relies on separation (e.g., HPLC) or biological specificity. | Engineered specificity via aptamers, MIPs, and functionalized NPs [11] [12]. | Reduces false positives/negatives in complex matrices like soil extracts or food homogenates. |
| Multiplexing | Limited; typically requires multiple instruments. | High potential for simultaneous multi-analyte detection on a single platform [12]. | Comprehensive profiling of soil health or food safety from a single sample, saving time and cost [12]. |
| Portability & On-site Use | Mostly lab-bound, benchtop instruments. | High (e.g., paper-based strips, handheld meters) [11] [13]. | Enables real-time decision-making in the field for precision farming and rapid food safety screening. |
| Cost & Accessibility | High capital and maintenance cost. | Potential for low-cost, disposable sensors [11]. | Makes advanced sensing accessible to a wider range of users, including in developing regions. |
Experimental Protocols for Key Nanosensor Assays
To facilitate replication and further innovation, this section outlines detailed methodologies for two representative nanosensor assays cited in the comparison tables.
Protocol 1: Fluorescent Microfluidic Sensor for Organophosphorus Pesticides
This protocol is based on the work of Hu et al., who developed a sensor using a 3D CdTe Quantum Dot (QD) aerogel [11].
- Primary Materials: CdTe QDs, Acetylcholinesterase (AChE) enzyme, Acetylthiocholine (ATCh) substrate, Polydimethylsiloxane (PDMS) for microfluidic chip fabrication.
- Apparatus: Fluorescence spectrometer, Microfluidic chip fabrication equipment, Syringe pump.
Procedure:
- QD Aerogel Synthesis: Synthesize CdTe QDs and assemble them into a 3D porous aerogel structure within the microfluidic channel. This aerogel serves as the high-surface-area fluorescence transduction material.
- Sensor Operation:
- Step 1: Introduce a solution containing AChE and its substrate, ATCh, into the microfluidic chip.
- Step 2: AChE catalyzes the hydrolysis of ATCh to produce thiocholine.
- Step 3: Thiocholine causes quenching of the red fluorescence emitted by the CdTe QD aerogel via a photoinduced electron transfer mechanism.
- Step 4: In the presence of Organophosphorus Pesticides, AChE is inhibited. This prevents the formation of thiocholine, and the QD fluorescence remains unquenched.
- Detection & Quantification: Measure the recovery of fluorescence intensity, which is directly proportional to the concentration of the inhibiting pesticide. The system achieved a detection limit of 0.38 pM [11].
Protocol 2: Potentiometric Solid-Contact Ion-Selective Electrode (SC-ISE)
This protocol is adapted from the comparative study of transduction materials by the authors of Scientific Reports, using Venlafaxine detection as a model system [14].
- Primary Materials: Multi-walled Carbon Nanotubes (MWCNTs), Polyvinyl Chloride (PVC), Plasticizer (o-NPOE), Ionophore (VEN-TPB ion-pair), Tetrahydrofuran (THF) solvent.
- Apparatus: Potentiometer (pH/mV meter), Screen-printed electrodes, Electrochemical Impedance Spectrometer.
Procedure:
- Transducer Layer Preparation: Drop-cast a dispersion of MWCNTs onto the screen-printed electrode surface and allow to dry. This forms the solid-contact layer responsible for ion-to-electron transduction.
- Ion-Selective Membrane (ISM) Formulation: Prepare a membrane cocktail containing the polymer (PVC), plasticizer (o-NPOE), and the selective ionophore (VEN-TPB). Dissolve these components in THF.
- Sensor Fabrication: Drop-cast the ISM cocktail directly onto the MWCNT-modified electrode and allow the THF to evaporate, forming a thin, uniform polymeric membrane.
- Conditioning & Measurement: Condition the fabricated sensor in a solution of the target analyte. Perform potentiometric measurements against a standard reference electrode (e.g., Ag/AgCl).
- Performance Characterization:
- Use Chronopotentiometry (CP) to evaluate potential drift and calculate the electrode's capacitance. MWCNTs exhibited a low potential drift of 34.6 µV/s, indicating high stability [14].
- Use Electrochemical Impedance Spectroscopy (EIS) to analyze charge transfer resistance and double-layer capacitance.
The diagram below summarizes the architecture and working principle of this SC-ISE.
The Scientist's Toolkit: Essential Research Reagents and Materials
Successful development and fabrication of high-performance nanosensors require a suite of specialized materials and reagents. The following table catalogs key components for the research laboratory.
Table 5: Essential Research Materials for Nanosensor Development
| Category | Specific Item / Material | Critical Function in R&D | Exemplary Use Case |
|---|---|---|---|
| Nanomaterials | Quantum Dots (CdTe, CdSe) | Fluorescent transduction labels with tunable emission [11]. | Optical detection of pesticides via fluorescence quenching [11]. |
| Carbon Nanotubes (MWCNTs) | High-surface-area transducers for electrochemical sensors; enhance capacitance and stability [14]. | Solid-Contact in Ion-Selective Electrodes [14]. | |
| Metal Nanoparticles (Au, Ag, CuO) | Colorimetric reporters, enzyme mimics (nanozymes), SERS substrates [11]. | Peroxidase-like nanozyme in paper-based pesticide sensors [11]. | |
| Recognition Elements | Acetylcholinesterase (AChE) | Enzyme inhibitor for organophosphorus/carbamate pesticide detection [11]. | Core recognition element in enzymatic inhibition-based biosensors [11]. |
| Aptamers | Synthetic recognition elements for small molecules, selected via SELEX [11]. | Target-specific detection of antibiotics, toxins, or pesticides [11]. | |
| Molecularly Imprinted Polymers (MIPs) | Synthetic, robust antibody mimics with tailored binding cavities [11]. | Solid-phase extraction and sensing of analytes in complex food samples [11]. | |
| Polymer & Chemistries | Polyvinyl Chloride (PVC) | Matrix polymer for ion-selective membranes [14]. | Forming the bulk of the sensing membrane in potentiometric sensors [14]. |
| Plasticizers (o-NPOE) | Imparts mobility to ionophores within the PVC membrane [14]. | Critical for proper function and Nernstian response of ISEs [14]. | |
| Tetrahydrofuran (THF) | Solvent for dissolving PVC and membrane components [14]. | Casting homogeneous ion-selective membranes on electrode surfaces [14]. |
The strategic selection of sensing and transduction materials is paramount to pushing the boundaries of agricultural sensing. As this guide has demonstrated, nanomaterials offer a compelling suite of advantages—including dramatic gains in sensitivity, the potential for miniaturization and multiplexing, and the development of robust, field-deployable platforms—when benchmarked against conventional sensor technologies [11] [12] [14].
Future research trajectories are clearly focused on overcoming remaining challenges, such as ensuring the long-term environmental fate of nanomaterials and reducing costs for widespread adoption [9] [15]. The integration of these nanosensors with Internet of Things (IoT) platforms and data analytics is set to revolutionize precision agriculture, enabling fully autonomous, data-driven farming systems that optimize resource use and ensure food safety and security [10] [16] [13]. For researchers, the continued exploration of novel materials like single-atom nanozymes [11] and the refinement of biocompatible and biodegradable nanostructures will be critical to the next generation of sustainable and highly sensitive agricultural sensors.
The transition toward data-driven farming relies on accurate measurement of key agricultural parameters, including soil moisture, nutrient levels, pathogen presence, and climate conditions. This guide provides a systematic comparison between emerging nanosensors and conventional agricultural sensors, offering a benchmarking framework for researchers and development professionals. The evaluation is structured around performance metrics critical for scientific and commercial applications: sensitivity, detection speed, operational complexity, and cost-effectiveness.
Nanotechnology introduces novel sensing mechanisms that operate at molecular and atomic scales, leveraging unique properties of nanomaterials such as quantum dots, carbon nanotubes, and metal oxides [17]. These platforms demonstrate distinct advantages for real-time, high-resolution monitoring in complex agricultural matrices. Concurrently, conventional sensors continue to evolve through integration with IoT networks and advanced analytics, maintaining relevance in many practical applications [18]. This analysis synthesizes experimental data and performance characteristics to objectively quantify technological capabilities across both sensing paradigms.
Comparative Performance Analysis of Sensor Technologies
Quantitative Benchmarking of Sensor Performance
Table 1: Comparative analysis of sensor technologies for agricultural monitoring
| Measurand | Sensor Technology | Detection Principle | Sensitivity/LOD | Response Time | Key Advantages | Major Limitations |
|---|---|---|---|---|---|---|
| Soil Moisture | Gravimetric (Conventional) | Oven-drying & weighing | N/A (Direct measure) | 24+ hours | High accuracy; Standard reference method | Destructive; Labor-intensive; No real-time capability [19] |
| Soil Moisture Probes (e.g., TDR, FDR) | Dielectric constant measurement | ±2-3% VWC | 1-60 seconds | Continuous monitoring; Reliable | Limited spatial coverage; Calibration dependent [19] [20] | |
| Nanosensors (Graphene, CNTs) | Chemiresistive/Dielectric changes | ±0.5-1% VWC | <10 seconds | High sensitivity; Miniaturization potential; Stable under humidity changes [17] [21] | Scalability challenges; Higher unit cost [22] | |
| Soil Nutrients | Laboratory Analysis (Conventional) | Spectroscopy/Chromatography | ppm-ppb range | Days to weeks | High accuracy; Multi-nutrient analysis | Laboratory-bound; Time-consuming; Expensive [20] |
| Ion-Selective Electrodes (Conventional) | Potentiometric | ~1-10 ppm | 1-2 minutes | Field-deployable; Direct measurement | Interference issues; Regular calibration needed [20] | |
| Nanosensors (Electrochemical) | Functionalized nanoparticles | ppt-ppb range | <30 seconds | Extreme sensitivity; Multi-analyte detection; Portable [23] [22] | Biofouling susceptibility; Complex fabrication [24] | |
| Pathogens | ELISA/PCR (Conventional) | Immunoassay/Nucleic acid amplification | ~1-10 ng/mL | 4-48 hours | High specificity; Established protocols | Laboratory-bound; Skilled personnel; Complex sample prep [25] |
| Nanobiosensors (Quantum dots, Au NPs) | FRET/Electrochemical | ~0.1-1 ng/mL | 15-60 minutes | Rapid detection; Point-of-care capability; High specificity [23] [25] | Limited multiplexing; Sample matrix effects [25] | |
| Climate Parameters | Standard Weather Stations | Various (e.g., thermistors, anemometers) | Varies by parameter | Seconds to minutes | Long-term reliability; Well-established | Large footprint; Expensive for dense networks [18] |
| Nano-Enhanced Sensors (e.g., CO₂) | Optical/Chemiresistive | ~1-5 ppm for CO₂ | <1 minute | Miniaturized; Low power; High density deployment | Emerging technology; Long-term stability data limited [20] |
Technology Adoption Trends and Market Analysis
The global nanosensors market, valued at approximately USD 832 million in 2024, is projected to reach USD 1,838 million by 2034, growing at a CAGR of 8.25% [22]. The broader agricultural nanotechnology market demonstrates even more rapid expansion, expected to grow from USD 8,437 million in 2024 to USD 27,027 million by 2032, at a CAGR of 15.66% [24]. This robust growth reflects increasing research investment and commercial adoption of nano-enabled solutions.
Regional adoption patterns show North America currently leading with 33% market share in nanosensors, while the Asia-Pacific region is projected to grow most rapidly (CAGR 9.32%) between 2025-2034, driven by increasing demand for efficient disease detection tools and adoption across diverse industries [22]. By 2025, over 80% of large farms are expected to adopt advanced data analytics for crop management, creating infrastructure for integration of sophisticated sensing technologies [18].
Experimental Protocols for Sensor Benchmarking
Standardized Methodologies for Performance Validation
Protocol for Soil Nutrient Sensor Evaluation
Objective: Quantify sensitivity, selectivity, and detection limits of nutrient sensors in agricultural soil matrices.
Materials:
- Test sensors (conventional ion-selective electrodes and nanomaterial-based electrochemical sensors)
- Standard reference solutions (NO₃⁻, NH₄⁺, PO₄³⁻ at 0.1-1000 ppm)
- Soil samples with varying texture (sandy, loam, clay) and organic matter content
- Buffer solutions (pH 4.0, 6.0, 8.0)
- Potentiostat for electrochemical measurements
- Reference analytical equipment (HPLC, ICP-MS)
Procedure:
- Prepare soil extracts by mixing 10g soil with 50ml deionized water, shaking for 30 minutes, and filtering through 0.45μm membrane.
- Spike samples with known concentrations of target nutrients across expected physiological range (0.1-500 ppm).
- Immerse both conventional and nanosensors in identical samples with continuous measurement.
- Record response time to reach 90% signal stabilization.
- Calculate sensitivity from calibration curves of signal versus concentration.
- Determine selectivity by measuring response to potential interferents (K⁺, Ca²⁺, Cl⁻) at 10-fold higher concentrations.
- Validate measurements against reference analytical methods (HPLC for nitrate/phosphate, ICP-MS for cations).
Data Analysis: Calculate limit of detection (LOD = 3.3 × σ/S, where σ is standard deviation of blank and S is slope of calibration curve), accuracy (% deviation from reference method), and precision (% RSD of replicate measurements) [23] [20].
Protocol for Pathogen Detection Sensor Evaluation
Objective: Compare detection capabilities for plant pathogens between traditional molecular methods and nanobiosensors.
Materials:
- Pathogen cultures (Xanthomonas campestris, Fusarium oxysporum)
- Plant tissue samples (healthy and infected)
- Traditional PCR/ELISA kits
- Nanobiosensors (quantum dot-based FRET sensors, gold nanoparticle immunoassays)
- Fluorescence spectrometer
- Microplate reader
Procedure:
- Prepare serial dilutions of pathogen cultures (10¹-10⁸ CFU/mL) or pathogen DNA (0.1-1000 pg/μL).
- Spike healthy plant extracts with known pathogen concentrations.
- Process samples in parallel with traditional methods (DNA extraction followed by PCR for molecular detection, antibody-based ELISA for protein detection) and nanobiosensors.
- For quantum dot FRET sensors, measure fluorescence emission before and after sample application.
- Record time-to-result for each method.
- Determine detection limits for each technology.
- Assess specificity using closely related non-target pathogens.
Data Analysis: Compare LOD, total assay time, hands-on time, and accuracy (false positive/negative rates) across technologies [25].
Conceptual Framework for Sensor Technology Benchmarking
Essential Research Reagent Solutions for Agricultural Sensor Development
Table 2: Key research reagents and materials for agricultural sensor development
| Reagent/Material | Function | Application Examples | Key Characteristics | |
|---|---|---|---|---|
| Graphene & Carbon Nanotubes | Transducer element | Chemiresistive gas sensors (NH₃), soil moisture sensors | High surface area, excellent electron transfer, tunable functionality [17] [21] | |
| Quantum Dots (CdSe, CdTe) | Fluorescent tags | FRET-based pathogen detection, nutrient imaging | Size-tunable emission, high quantum yield, photostability [25] | |
| Metal Nanoparticles (Au, Ag) | Signal amplification | Colorimetric pathogen detection, electrochemical biosensors | Surface plasmon resonance, catalytic activity, biocompatibility [25] | |
| Molecularly Imprinted Polymers | Recognition element | Biomimetic sensors for toxins, pesticides | Synthetic antibody mimics, thermal/chemical stability [23] | |
| Ion-Selective Membranes | Selective detection | Conventional nutrient ion sensors (NO₃⁻, K⁺) | Moderate selectivity, established manufacturing [20] | |
| Enzymes (Glucose Oxidase, Urease) | Biorecognition element | Conventional biosensors | High specificity, natural recognition | Limited stability, narrow operating conditions [20] |
| Microfluidic Chips | Sample processing | Lab-on-a-chip systems, point-of-care devices | Minimal reagent consumption, automation potential | Complex fabrication, clogging risks [23] |
The benchmarking analysis reveals a complementary relationship between nanosensors and conventional agricultural sensors, with optimal technology selection dependent on specific application requirements. Nanosensors demonstrate superior performance in sensitivity (ppt-ppb detection limits), response time (seconds to minutes), and miniaturization potential, making them ideal for research applications requiring high-resolution data and early pathogen detection [17] [23] [25]. Conventional sensors maintain advantages in cost-effectiveness, field robustness, and technological maturity for large-scale monitoring applications [18] [20].
Future research priorities should address critical nanosensor limitations, including scalability challenges, long-term environmental impact assessment, and standardization of fabrication protocols [22] [21]. Emerging opportunities exist in multimodal sensor systems that integrate nanotechnology's sensitivity with conventional platforms' practicality, potentially bridged by hybrid approaches [23] [24]. The ongoing integration of sensor technologies with IoT platforms and machine learning analytics will further enhance the value proposition of both conventional and nano-enabled sensing approaches, ultimately supporting more sustainable and productive agricultural systems [18] [21].
From Lab to Field: Methodologies and Real-World Applications in Modern Farming
The pursuit of sustainable agricultural productivity necessitates a paradigm shift from generalized farming practices to precision soil management. This approach relies on accurate, real-time monitoring of critical soil parameters like pH and nutrient levels to optimize resource usage and enhance crop yield [26]. The core of this transition lies in the evolution of sensing technologies, moving from conventional electrochemical sensors toward emerging nanobiosensors [27] [28]. This guide provides a objective performance comparison between these two classes of sensors, framing the analysis within a broader research context of benchmarking nanosensors against conventional alternatives. We summarize quantitative data from experimental observations, detail standardized methodologies for performance evaluation, and provide essential resources for researchers and scientists engaged in agricultural technology and sensor development.
The fundamental difference between conventional and nano-enabled sensors lies in the materials used and their resulting performance characteristics.
Conventional Soil Sensors typically use glass-bodied or epoxy-bodied electrodes with macroscopic sensing components. They operate on established electrochemical principles, such as potentiometry for pH measurement, and are valued for their maturity and reliability in field conditions [29] [30].
Nanosensors, particularly nanobiosensors, incorporate nanomaterials such as nanoparticles, carbon nanotubes, or quantum dots as integral components [26] [31]. Their operation leverages the unique properties of these nanomaterials, including an exceptionally high surface area-to-volume ratio, quantum effects, and enhanced electrochemical or optical activity. This often results in superior sensitivity and the ability to detect specific biological analytes, such as pathogens or nutrients, at remarkably low concentrations [26] [27].
Table 1: Fundamental Characteristics of Sensor Types
| Feature | Conventional Sensors | Nanosensors (Nanobiosensors) |
|---|---|---|
| Key Materials | Glass, epoxy, liquid electrolytes | Nanoparticles (Au, Ag), Carbon Nanotubes, Graphene, Quantum Dots [26] [31] |
| Sensing Mechanism | Potentiometric, Voltammetric | Electrochemical, Optical (FRET, SERS), Mass-sensitive [26] [31] |
| Primary Advantage | Proven field durability, Lower unit cost | Ultra-high sensitivity, Specificity, Miniaturization potential [26] [27] |
| Typical Targets | pH, macronutrients (N, P, K), moisture | pH, specific ions, pesticides, pathogens, plant hormones [26] [28] |
Performance Benchmarking: Experimental Data and Comparison
To quantitatively assess the capabilities of both sensor types, we have compiled data from published experimental results and product specifications. The following tables summarize key performance metrics for pH monitoring and the detection of other agriculturally relevant analytes.
Table 2: Benchmarking pH Monitoring Capabilities
| Sensor Type / Product | Technology | Accuracy | Response Time | Key Features & Limitations |
|---|---|---|---|---|
| Atlas Scientific Lab Grade | Conventional (Polycarbonate) | ±0.002 pH | ~1 second (to 95%) | Double junction, yearly calibration, 2.5+ year lifespan [29] |
| Atlas Scientific Spear Tip | Conventional (Spear Tip) | ±0.002 pH | ~1 second (to 95%) | For semi-solid materials like soil; lab-grade precision [30] |
| Apera PH60S | Conventional (Handheld) | ±0.01 pH | Not specified | All-in-one handheld meter; good for field use [30] |
| Au NP-based Sensor | Nanosensor (Optical) | ~5 µM (Urea) [26] | Not specified | Colorimetric detection; high specificity but requires complex readout [26] |
Table 3: Benchmarking Performance for Other Agricultural Analytes
| Target Analyte | Sensor Technology | Detection Mechanism | Reported Sensitivity | Reference |
|---|---|---|---|---|
| Organophosphate Pesticides | Carbon Nanotubes | Electrochemical | 0.145 parts per billion (ppb) | [26] |
| Methyl parathion & chlorpyrifos | Carbon Nanotubes wrapped by ssDNA | Enzymatic Reaction | 1 × 10⁻¹² M | [26] |
| R. solanacearum bacteria | Gold Nanoparticles (functionalized) | Colorimetry | 15 nanograms | [26] |
| Urea | Gold Nanoparticles | Colorimetry | 5 µM | [26] |
| Soil Moisture | Conventional (e.g., Probeync) | Electrical Impedance | Not specified (±0.2 pH accuracy) | [32] |
Experimental Protocols for Sensor Benchmarking
For research aimed at reproducing or validating these benchmarks, standardized experimental protocols are essential. The following methodologies outline key procedures for assessing sensor performance.
Protocol for Quantifying pH Sensor Accuracy and Response Time
This protocol is adapted from industry-standard calibration and testing methods for pH electrodes [29] [30].
Sensor Calibration:
- Reagents: Use at least two standard pH buffer solutions (e.g., pH 4.01, 7.00, and 10.01).
- Procedure: Immerse the sensor probe in the first buffer solution under gentle agitation. Record the stabilized reading and adjust the sensor's calibration to match the known buffer value. Rinse the probe with deionized water and repeat the process with the second and third buffers. A double-junction reference design is recommended for enhanced reliability in complex matrices like soil solutions [29].
Accuracy Measurement:
- Reagents: Prepare a series of test solutions with known pH values using standard buffers.
- Procedure: Immerse the calibrated sensor into each test solution. Record the stabilized pH reading. The accuracy is calculated as the absolute difference between the measured value and the known value of the test solution.
Response Time Measurement:
- Procedure: Transfer the sensor from one buffer solution (e.g., pH 7.00) to a second one with a significantly different pH (e.g., pH 4.01). Record the pH reading at a high frequency (e.g., 10 times per second). The response time is typically reported as the time taken for the reading to reach 95% of the final stable value [29].
Protocol for Evaluating Nanosensor Sensitivity and Selectivity
This protocol is derived from published methodologies for electrochemical and optical nanobiosensors [26] [31].
Dose-Response Calibration:
- Reagents: Prepare a dilution series of the target analyte (e.g., a pesticide or urea) in a relevant matrix (e.g., purified water or soil extract).
- Procedure: Expose the nanosensor to each concentration of the analyte and record the output signal (e.g., electrical current, fluorescence intensity). Plot the signal against the analyte concentration to generate a calibration curve.
Limit of Detection (LOD) Calculation:
- The LOD is frequently calculated as the analyte concentration that yields a signal three times the standard deviation of the signal from blank (analyte-free) samples.
Selectivity Testing:
- Reagents: Prepare solutions of potential interfering substances that are chemically similar or commonly found in the same environment as the target analyte.
- Procedure: Expose the nanosensor to solutions containing these interferents at concentrations typical of the application environment. A highly selective sensor will show minimal signal change in the presence of these interferents compared to its response to the target analyte.
Workflow Visualization: Sensor Benchmarking Methodology
The following diagram illustrates the logical workflow for a comprehensive sensor benchmarking study, integrating the protocols described above.
Diagram 1: Sensor Benchmarking Workflow
The Scientist's Toolkit: Key Research Reagents and Materials
The development and testing of advanced soil sensors require a suite of specialized materials and reagents. The following table details essential items for researchers in this field.
Table 4: Essential Research Reagents and Materials
| Item Name | Function / Application | Technical Notes |
|---|---|---|
| Gold Nanoparticles (Au NPs) | Transducer element in nanobiosensors; can be functionalized with antibodies or DNA for specific detection [26]. | Provide excellent optical and electronic properties; used in colorimetric and electrochemical sensors [26] [31]. |
| Carbon Nanotubes (CNTs) | Enhance electrochemical reactivity and surface area in electrodes for pesticide and heavy metal detection [26] [31]. | Can be single or multi-walled; often wrapped with single-stranded DNA to improve selectivity [26]. |
| Standard pH Buffer Solutions | Calibrating and verifying the accuracy of conventional and nano-based pH sensors [29] [30]. | Essential for maintaining measurement traceability; typically available at pH 4.01, 7.00, and 10.01. |
| Quantum Dots (QDs) | Fluorescent labels in optical nanosensors; their size-tunable emission allows for multiplexed detection [26]. | Often used in Fluorescence Resonance Energy Transfer (FRET) assays for detecting pathogens or metabolites [26]. |
| Specific Bioreceptors | Provide molecular recognition for high specificity in nanobiosensors. | Includes enzymes, antibodies, or nucleic acids immobilized on the nanomaterial surface to capture the target analyte [26]. |
| Spear Tip pH Probe | Enables direct pH measurement in semi-solid materials like soil and compost with minimal sample preparation [30]. | Features a rugged, sharp tip for penetration; ideal for field research and in-situ profiling. |
This comparison guide delineates a clear performance landscape between conventional and nano-enabled soil sensors. Conventional pH probes, such as the lab-grade and spear-tip models highlighted, offer robust, high-accuracy performance for general soil health monitoring with the advantage of commercial readiness and operational simplicity [29] [30]. In contrast, nanosensors demonstrate a paradigm shift in sensing capability, achieving unparalleled sensitivity and specificity for targeted analytes like pesticides and pathogens, often detecting them at trace levels (parts per billion or lower) [26] [27]. The choice between these technologies is therefore application-dependent. For routine monitoring of primary soil parameters like pH, conventional sensors are highly effective. For research-driven applications requiring the detection of specific, low-concentration biochemicals or early-stage pathogens, nanosensors present a powerful, albeit often more complex, alternative. The future of precision soil management lies in the continued refinement and, potentially, the strategic integration of both these technological paths to achieve comprehensive soil ecosystem understanding.
The escalating challenges of global food security necessitate advanced monitoring solutions to mitigate the risks posed by pathogens and contaminants in the agricultural sector. Traditional detection methods, while reliable, often fall short in providing the rapid, sensitive, and field-deployable analytics required for modern precision agriculture. This guide objectively benchmarks the performance of emerging nanosensors against conventional agricultural sensors, focusing on the critical parameters of sensitivity, speed, and field applicability. The comparison is framed within a broader research initiative aimed at establishing rigorous performance benchmarks for sensing technologies, providing researchers and scientists with validated experimental data and methodologies to guide tool selection and development.
Performance Benchmarking: Nanosensors vs. Conventional Sensors
The transition from conventional sensing to nanotechnology-based platforms represents a paradigm shift in analytical capability. The table below provides a structured comparison of their key performance metrics, highlighting the transformative potential of nanosensors for in-field diagnostics.
Table 1: Performance comparison between conventional sensors and nanosensors for pathogen and contaminant detection.
| Feature | Conventional Sensors (e.g., Chromatography) | Nanosensors |
|---|---|---|
| Sensitivity | Parts per million (ppm) to parts per billion (ppb) range [11] | Parts per billion (ppb) to parts per trillion (ppt) range; single-molecule detection possible [11] [27] |
| Analysis Speed | Several hours to days, including sample preparation [11] [27] | Minutes to hours; real-time and continuous monitoring capabilities [11] [33] [27] |
| Selectivity | High, achieved through physical separation | High, achieved through bio-recognition elements (enzymes, aptamers, MIPs) and unique nanomaterial properties [11] |
| Portability & Field Use | Limited; primarily laboratory-bound, requiring skilled personnel [11] [27] | High; designed for portability with user-friendly operation (e.g., test strips, portable electrodes) [11] [27] |
| Key Strengths | High accuracy, standardized protocols, high throughput in lab settings | Superior sensitivity, rapid response, portability for on-site analysis, cost-effectiveness [11] [27] |
| Major Limitations | Time-consuming, costly instrumentation, not suited for real-time field analysis [11] [27] | Potential ecotoxicological risks, complex standardization, relative technological novelty requiring further validation [9] [11] |
Experimental Protocols for Nanosensor Evaluation
To ensure the reliability and reproducibility of nanosensor performance data, researchers employ standardized experimental protocols. The following sections detail common methodologies used for quantifying sensitivity and speed, which are critical for benchmarking.
Protocol for Electrochemical Biosensor Detection of Pesticides
This protocol is widely used for detecting organophosphorus pesticides using acetylcholinesterase (AChE)-inhibition based electrochemical sensors [11].
- Primary Reagent: Acetylcholinesterase (AChE) enzyme and acetylthiocholine (ATCh) as the substrate.
- Nanomaterial Component: Often integrates with a 3D quantum dot aerogel or other electron-conductive nanomaterials to amplify the signal [11].
- Procedure:
- The sensor platform, functionalized with AChE, is incubated with a sample solution.
- If pesticides are absent, AChE hydrolyzes ATCh to produce thiocholine.
- Thiocholine induces a measurable electrochemical signal change (e.g., current change).
- In the presence of pesticides, AChE is inhibited, reducing thiocholine production and yielding a diminished signal.
- The signal reduction is quantitatively correlated to pesticide concentration using a pre-established calibration curve.
- Data Analysis: The limit of detection (LOD) is calculated, with advanced nanosensors achieving LODs as low as 0.38 pM for specific organophosphorus pesticides [11].
Protocol for Colorimetric Nanozyme-based Detection
This protocol leverages the peroxidase-mimicking activity of nanozymes for visible pesticide detection, suitable for simple field tests [11].
- Primary Reagent: Copper oxide nanoparticles (CuONPs) as a nanozyme, hydrogen peroxide (H₂O₂), and a colorimetric substrate like o-dianisidine or TMB (3,3',5,5'-tetramethylbenzidine).
- Procedure:
- AChE hydrolyzes ATCh, producing choline which generates H₂O₂.
- In a functioning system, CuONPs use H₂O₂ to oxidize the substrate, causing a visible color change.
- Pesticides inhibit AChE, reducing H₂O₂ production and subsequent color development.
- The intensity of the color is quantified using a smartphone camera or a portable spectrophotometer.
- Data Analysis: The LOD is determined from the color intensity vs. concentration plot. Reported systems can detect malathion at levels as low as 0.08 mg/L in under 10 minutes [11].
Signaling Pathways and Workflows
The enhanced performance of nanosensors is governed by distinct signaling mechanisms and workflows. The following diagrams, generated using DOT language, illustrate the core principles of optical and electrochemical nanosensing.
Optical Nanosensing via Fluorescence Quenching
This diagram illustrates the signaling pathway for a fluorescence-based nanosensor detecting pesticides through an enzyme inhibition mechanism.
Diagram Title: Optical nanosensor signaling pathway.
Workflow for a Typical Nanosensor-based Field Assay
This diagram outlines the generalized experimental workflow for conducting a field assay using a nanosensor, from sample preparation to result interpretation.
Diagram Title: Field assay workflow for nanosensors.
Research Reagent Solutions Toolkit
The development and deployment of high-performance nanosensors rely on a suite of specialized reagents and materials. The table below catalogs key components essential for researchers in this field.
Table 2: Essential research reagents and materials for nanosensor development and application.
| Reagent/Material | Function and Role in Detection | Examples & Notes |
|---|---|---|
| Recognition Elements | Provides high selectivity by binding specifically to the target analyte [11]. | Enzymes (e.g., AChE), antibodies, aptamers (synthetic DNA/RNA), and Molecularly Imprinted Polymers (MIPs) [11]. |
| Nanomaterials | Enhances signal transduction and sensor stability due to unique physico-chemical properties [11] [27]. | Quantum Dots (QDs), carbon nanotubes, graphene, metal nanoparticles (e.g., Au, Ag), and nanozymes (e.g., CuO NPs) [11] [34]. |
| Signal Transducers | Converts the biological/chemical recognition event into a quantifiable signal [11]. | Electrochemical electrodes (e.g., screen-printed), optical fibers, and surface plasmon resonance (SPR) chips [11] [35]. |
| Substrates & Buffers | Provides the optimal chemical environment for the biorecognition reaction to occur. | Specific substrates for enzymes (e.g., ATCh for AChE) and pH-stable buffer solutions are critical for assay reproducibility. |
| Reference Materials | Used for sensor calibration and validation of accuracy. | Certified reference materials (CRMs) of target analytes (e.g., pesticide standards) are essential for quantifying results. |
The escalating challenges of global food security, intensified by population growth and climate change, are driving a transformative shift in agricultural technology. Modern agriculture must transcend traditional, experience-based cultivation models to embrace data-driven approaches that offer real-time, precise insights into plant health [1]. At the forefront of this revolution are two distinct but increasingly convergent technological pathways: spectral imaging and nanosensor integration. Spectral imaging, including hyperspectral and multispectral systems, provides macroscopic, non-invasive health assessment by analyzing light interaction with plant tissues. In parallel, nanosensors offer microscopic, in-situ monitoring of physiological and biochemical processes at the molecular level [36] [37]. This guide provides a systematic comparison of these technologies, benchmarking their performance characteristics, applications, and implementation requirements to inform researcher selection and development priorities.
The core distinction lies in their operational scale and sensing philosophy. Hyperspectral imaging captures reflectance across hundreds of contiguous spectral bands (typically 400-1000 nm or 400-2500 nm ranges), generating detailed spectral signatures that serve as fingerprints for biochemical composition [38] [37]. This enables pre-symptomatic disease detection by identifying subtle changes in chlorophyll, water content, and cellular structure before visible symptoms manifest. Conversely, nanosensors employ nanotechnology to detect specific biomarkers—such as hormones, ions, or volatile organic compounds—through direct interaction at the plant interface [36] [33]. These platforms leverage unique physical and chemical properties of nanomaterials like carbon nanotubes, graphene, and quantum dots to achieve exceptional sensitivity and specificity [39].
Technology Performance Benchmarking
Core Performance Metrics Comparison
Table 1: Comprehensive performance comparison between spectral imaging and nanosensor technologies for plant health monitoring.
| Performance Parameter | Hyperspectral Imaging | Multispectral Imaging | Nanosensors |
|---|---|---|---|
| Spatial Resolution | Pixel-level (cm to m) | Patch-level (m) | Molecular to cellular level (nm to μm) |
| Temporal Resolution | Minutes to days | Hours to days | Real-time (seconds to minutes) |
| Sensitivity | High (pre-symptomatic detection) | Moderate (symptomatic detection) | Very High (molecular detection) |
| Specificity | Spectral signature-based | Limited to broad bands | Biomarker-specific |
| Detection Accuracy | 60-98% (depends on model) [40] [37] | 70-90% | Not fully quantified (early stage) |
| Field Deployment | Mature (drones, satellites) | Mature (drones, satellites) | Prototype stage (urban farms) [36] |
| Scalability | Excellent (field to regional) | Excellent (field to regional) | Limited (single plants to small plots) |
| Cost Profile | High initial investment | Moderate | Potentially low (nanomaterial advances) |
Application-Specific Performance Metrics
Table 2: Application-focused performance comparison across key plant health monitoring domains.
| Application Domain | Technology | Key Performance Metrics | Limitations |
|---|---|---|---|
| Early Disease Detection | Hyperspectral Imaging | 98.11% accuracy for mango diseases using SSTAS software [40] | Requires complex data processing |
| Nanosensors | Real-time hormone tracking (IAA) [36] | Species-specific optimization needed | |
| Nutrient Stress Management | Multispectral Imaging | NDVI-based deficiency detection | Limited to advanced deficiencies |
| Wearable Nanosensors | Ion concentration monitoring [41] | Limited deployment duration | |
| Environmental Stress Monitoring | Hyperspectral Imaging | Water stress detection via CTR2 index [38] | Indirect measurement |
| Quantum Sensors | PAR measurement for photosynthesis evaluation [42] | High development complexity | |
| Pesticide Residue Detection | Traditional Labs | Gold standard accuracy | Time-consuming, lab-dependent |
| Nanosensors | LOD 0.08 mg/L for malathion in fruits [11] | Matrix interference challenges |
Experimental Protocols and Methodologies
Hyperspectral Imaging for Disease Detection
The experimental workflow for hyperspectral disease classification involves standardized procedures to ensure reproducible results across research environments. The SSTAS (Spectral Signature Taxonomy & Analysis Software) framework demonstrates a rigorously validated approach that achieved 98.11% classification accuracy for mango diseases [40].
Sample Preparation and Data Acquisition:
- Plant materials are cultivated under controlled conditions with precise infection protocols using pathogen isolates (e.g., fungal, bacterial).
- Spectral data collection utilizes field spectroradiometers or imaging systems covering 400-1000 nm range, with measurements taken at consistent solar noon hours to minimize illumination variance.
- Reference standards (white reflectance panels) are imaged simultaneously for radiometric calibration, with dark current measurements recorded before each session.
Data Preprocessing Pipeline:
- Raw spectral data undergoes dark subtraction and reflectance conversion using standard calibration procedures.
- Noise reduction is applied using Savitzky-Golay filtering (typically 2nd polynomial, 11-21 window size) to smooth spectral curves while preserving features.
- Normalization techniques (Standard Normal Variate, Multiplicative Scatter Correction) minimize light-scattering effects and enhance biochemical feature resolution.
Feature Extraction and Modeling:
- Spectral disease indices (SDIs) are calculated using normalized differences from critical wavelength bands (450-950 nm).
- Machine learning classification employs fine-tuned Deep-Spectro models with 80:20 training-to-testing ratio, though Random Forest and Support Vector Machines remain alternatives.
- Model validation follows k-fold cross-validation (typically k=10) with independent test sets to ensure generalizability beyond training data.
Nanosensor Integration for Hormone Monitoring
The development and deployment of nanosensors for real-time plant hormone monitoring represents a paradigm shift from imaging techniques. The Singapore-MIT Alliance for Research and Technology (SMART) has established a robust protocol for indole-3-acetic acid (IAA) detection using corona phase molecular recognition (CoPhMoRe) technique [36].
Nanosensor Fabrication:
- Single-walled carbon nanotubes (SWCNTs) serve as the fluorescence transduction platform, functionalized with specific polymer libraries designed for IAA recognition.
- CoPhMoRe screening identifies polymer wrappings that form molecular recognition sites (binding pockets) selective to IAA through combinatorial library approaches.
- Sensor validation involves fluorescence spectroscopy (nIR emission) to confirm spectral shifts and intensity changes upon IAA binding, with specificity testing against structurally similar molecules.
Plant Integration and Measurement:
- For leaf monitoring, microneedle applicators deliver nanosensors to the apoplastic space with minimal tissue damage, avoiding major vasculature.
- Optical readers (portable spectrophotometers) measure fluorescence signals at 785 nm excitation with collection at 900-1300 nm range.
- Calibration curves are established through ex vivo experiments with known IAA concentrations in plant sap matrices.
Multiplexing Implementation:
- Integration with additional sensors for gibberellins, salicylic acid, and hydrogen peroxide enables comprehensive hormone profiling.
- Signal deconvolution algorithms separate contributions from different sensors based on distinct spectral signatures or temporal response patterns.
- Current research focuses on root zone monitoring through soil-integrated sensors and foliar application techniques for broad-acre crops.
Technology Workflows and Functional Mechanisms
Hyperspectral Imaging Data Processing Pipeline
The following diagram illustrates the complete workflow for hyperspectral plant disease detection, from data acquisition through to actionable insights:
Nanosensor Signaling Pathway
Nanosensors operate through specific molecular recognition events that translate into detectable signals, as shown in this mechanism for plant hormone detection:
The Researcher's Toolkit: Essential Technologies and Reagents
Core Research Technologies
Table 3: Essential research technologies and platforms for implementing plant health monitoring systems.
| Technology Category | Specific Platforms/Tools | Research Application | Key Characteristics |
|---|---|---|---|
| Spectral Imaging Systems | Field spectroradiometers (ASD FieldSpec) | In-situ leaf & canopy measurement | 350-2500 nm range, high spectral resolution |
| UAV-mounted hyperspectral cameras (Headwall Nano) | Field-scale phenotyping | <1 nm spectral resolution, GPS tagging | |
| SSTAS Software [40] | Spectral data classification | Deep-Spectro model, 98.11% accuracy | |
| Nanosensor Platforms | CoPhMoRe-based sensors [36] | Plant hormone detection | IAA monitoring, real-time capability |
| Wearable plant sensors [41] | Continuous health monitoring | Non-invasive, physical/chemical sensing | |
| Electrochemical nanosensors [11] | Pesticide residue detection | Enzyme inhibition-based, low LOD | |
| Data Analytics | Python scikit-learn, TensorFlow | Machine learning implementation | Random Forest, CNN for classification |
| Cloud platforms (Farmonaut) [38] | Large-scale data processing | API integration, mobile accessibility |
Critical Research Reagents and Materials
Table 4: Essential research reagents and materials for developing and deploying plant health sensors.
| Reagent/Material | Function/Purpose | Application Context |
|---|---|---|
| Single-walled carbon nanotubes | Fluorescence transduction platform | Nanosensor development for molecular detection [36] |
| Molecular recognition polymers | Target-specific binding elements | CoPhMoRe sensor fabrication for hormone sensing [36] |
| Acetylcholinesterase enzyme | Biosensor recognition element | Pesticide detection via inhibition assays [11] |
| Calibration standards | Sensor validation and quantification | White references (spectral), hormone standards (nanosensors) |
| Nanozymes (CuONPs) | Enzyme-mimicking catalysts | Colorimetric detection in paper-based sensors [11] |
| Aptamers | Synthetic recognition elements | Alternative to antibodies in biosensors [11] |
The benchmarking analysis reveals complementary rather than competitive relationships between spectral imaging and nanosensing technologies. Hyperspectral imaging demonstrates mature capabilities for field-scale health assessment with proven accuracy in disease classification (up to 98.11% [40]), while nanosensors offer unprecedented molecular-level resolution for real-time physiological monitoring, though primarily in controlled environments. The projection that over 60% of precision agriculture systems will incorporate hyperspectral imaging by 2025 [38] underscores its established value, whereas nanosensors represent the emerging frontier with transformative potential.
Strategic technology selection depends fundamentally on research objectives: spectral technologies suit macroscopic, multi-stress detection across cultivation areas, while nanosensors enable mechanistic studies of specific physiological processes. The most significant future opportunity lies in technology fusion—integrating nanosensor data with spectral signatures to create enriched diagnostic models that couple molecular events with whole-plant manifestations. Research priorities should address nanosensor field deployment challenges, spectral data processing complexity, and development of standardized validation protocols across both platforms. This technological convergence, supported by advancing AI analytics and materials science, will ultimately deliver the comprehensive plant health monitoring systems necessary for sustainable agricultural intensification.
The Role of AI and IoT in Enhancing Sensor Data Analytics and Decision-Making
The integration of Artificial Intelligence (AI) and the Internet of Things (IoT) is revolutionizing agricultural sensor data analytics, enabling a shift from reactive monitoring to predictive and prescriptive decision-making. This transformation is particularly critical when benchmarking emerging nanosensors against conventional agricultural sensors. Nanosensors, engineered with materials at the nanoscale (0.1–100 nm), offer superior performance due to unique physicochemical properties, including enhanced sensitivity, specificity, and the ability to perform rapid, on-site detection of contaminants like pesticide residues [11]. Conversely, conventional sensors, while often more established, face limitations in sensitivity, portability, and analytical speed when deployed for precision agriculture tasks [27] [11].
The synergy of AI and IoT creates a powerful framework for this benchmarking. IoT networks provide the infrastructure for seamless data collection from distributed sensors, while AI algorithms, particularly machine learning (ML), unlock the ability to extract meaningful patterns and predictions from the resulting complex, high-volume data streams [43] [44]. This combination is foundational for developing intelligent systems that optimize resource use, enhance crop yields, and ensure sustainability. This guide objectively compares the performance of nanosensors and conventional sensors within AI-driven IoT architectures, providing researchers with the experimental data and protocols necessary for rigorous technological evaluation.
Performance Benchmarking: Nanosensors vs. Conventional Sensors
The following tables provide a quantitative and qualitative comparison of nanosensors and conventional sensors, with a focus on applications relevant to agricultural research, such as pesticide detection and environmental monitoring.
Table 1: Quantitative Performance Comparison for Pesticide Detection
| Performance Metric | Nanosensors | Conventional Chromatography (HPLC/GC) |
|---|---|---|
| Detection Limit | As low as 0.38 pM for Organophosphates [11] | Varies; generally in ppm to ppb range |
| Analysis Time | ~10 minutes for on-site analysis [11] | Several hours, including sample preparation |
| Sample Volume | Minimal (microliters) | Larger volumes typically required |
| Portability | High (e.g., paper-based strips, handheld devices) [11] | Low (requires laboratory setting) |
| Cost per Test | Low (cost-effective fabrication) [11] | High (skilled personnel, costly equipment) |
Table 2: Qualitative Feature Comparison for Agricultural Monitoring
| Feature | Nanosensors | Conventional Sensors |
|---|---|---|
| Selectivity | High (using enzymes, antibodies, aptamers, MIPs) [11] | Moderate (can be affected by matrix effects) |
| Sensitivity | Very High (leveraging nanomaterial properties) [11] | Standard |
| On-site/Real-time Capability | Excellent (designed for field deployment) [27] [11] | Limited (often requires lab transport) |
| Multiplexing Capability | Emerging (detecting multiple analytes) | Possible but often complex and expensive |
| User-friendliness | High (simple operation) [11] | Low (requires trained technicians) [11] |
| Technology Readiness | Early Commercial/Research Stage [27] | Mature and Widely Deployed |
Experimental Protocols for Sensor Benchmarking
To generate comparable data, researchers must adhere to standardized experimental protocols. The following methodologies are cited from recent studies on pesticide detection, a key application for agricultural nanosensors.
Protocol for Nanosensor-Based Pesticide Detection
This protocol is adapted from enzyme-inhibition based nanosensors for organophosphorus pesticides (OPs) [11].
- Objective: To quantitatively detect OPs in fruit and vegetable samples using a fluorescent microfluidic nanosensor.
- Materials:
- Recognition Element: Acetylcholinesterase (AChE) enzyme.
- Transducer: 3D Cadmium Telluride (CdTe) Quantum Dot (QD) aerogel.
- Substrate: Acetylthiocholine (ATCh).
- Microfluidic chip and associated fluidic control system.
- Fluorescence spectrometer or imaging system.
- Procedure:
- Sample Preparation: Homogenize the agricultural sample (e.g., apple) and extract the analyte using a standard buffer solution.
- Sensor Assembly: Integrate the CdTe QD aerogel within the microfluidic channel.
- Reaction Introduction: Introduce the sample extract mixed with AChE and ATCh into the microfluidic system.
- Incubation: Allow the enzymatic reaction to proceed. AChE hydrolyzes ATCh to produce thiocholine, which quenches the fluorescence of the QD aerogel.
- Detection & Measurement:
- In the absence of OPs, AChE is active, thiocholine is produced, and fluorescence is quenched.
- In the presence of OPs, AChE is inhibited, less thiocholine is produced, and the fluorescence intensity remains high.
- Quantification: Measure the fluorescence recovery. The intensity is proportional to the OP concentration. The system achieved a detection limit of 0.38 pM in apples [11].
Protocol for Conventional Chromatographic Analysis
This protocol outlines the standard laboratory method for pesticide residue analysis, serving as a benchmark.
- Objective: To separate, identify, and quantify pesticide residues using High-Performance Liquid Chromatography (HPLC).
- Materials:
- HPLC system with a UV-Vis or Mass Spectrometry (MS) detector.
- Analytical column (e.g., C18 reverse-phase column).
- High-purity solvents (acetonitrile, methanol) and reagents for mobile phase.
- Standard reference materials for target pesticides.
- Procedure:
- Sample Preparation: Conduct a multi-step extraction (e.g., QuEChERS method) and purification (clean-up) to remove interfering compounds from the agricultural sample.
- Chromatographic Separation: Inject the purified extract into the HPLC system. Pesticides are separated as they travel through the column based on their interaction with the stationary and mobile phases.
- Detection: Eluting compounds are identified and quantified by the detector (UV-Vis or MS) by comparing their retention times and signal intensities to those of known standards.
- Data Analysis: Calculate the concentration of pesticides in the original sample. This process is time-consuming, involves sophisticated instrumentation, and requires skilled personnel [11].
AI-IoT Data Processing Workflow
The value of sensor data is fully realized through an integrated AI-IoT architecture. The following diagram and description outline a standard workflow for processing data from the sensor to the end-user decision.
Diagram 1: AI-IoT data processing workflow for agricultural sensors.
The workflow illustrates the path of sensor data in an intelligent system, often built on cloud platforms like Microsoft Azure [45] [46]:
- IoT Edge Layer: Data is generated by a network of agricultural sensors, including both nanosensors and conventional types, monitoring parameters like soil moisture, crop health, and pesticide levels [47]. This raw data is collected by an IoT Hub or edge gateway, which also handles device management [45] [43].
- Cloud & AI Processing Layer: Data streams into an Event Hub for generic event handling [45]. Serverless Functions then perform initial cleaning and preprocessing to handle noisy data. The core analysis occurs in Stream Analytics and ML Models, which perform tasks like anomaly detection, trend prediction (e.g., pest outbreak), and classification [45] [46]. Processed data and model insights are stored for historical analysis and model retraining.
- Application & Decision Layer: Insights are visualized on Dashboards (e.g., Power BI) for researchers [45] [46]. The system can also trigger Automated Actions, such as alerting an agronomist to a pesticide overdose or adjusting irrigation, thereby closing the loop from data to decision [43] [44].
The Researcher's Toolkit: Essential Reagents and Materials
The development and deployment of advanced sensor systems, particularly nanosensors, rely on a specific set of reagents and materials. The following table details key components for constructing and operating these systems, as featured in the cited experiments.
Table 3: Key Research Reagent Solutions for Sensor Development
| Item Name | Function/Application | Example in Context |
|---|---|---|
| Acetylcholinesterase (AChE) | Enzyme-based recognition element; inhibited by organophosphorus pesticides, triggering a detectable signal change. | Used in fluorescent and colorimetric nanosensors for OP detection [11]. |
| Aptamers | Single-stranded DNA or RNA oligonucleotides acting as synthetic recognition elements; high affinity and stability. | Employed as bioreceptors in biosensors for selective pesticide quantification [11]. |
| Molecularly Imprinted Polymers (MIPs) | Biomimetic synthetic receptors with tailor-made cavities for specific target molecules. | Used in sensors as stable, low-cost alternatives to natural antibodies [11]. |
| Quantum Dots (e.g., CdTe) | Nanoscale semiconductor particles used as fluorescent transducers; signal intensity changes upon analyte binding. | Integrated into a 3D aerogel for a microfluidic fluorescent sensor [11]. |
| Nanozymes (e.g., CuO NPs) | Nanomaterials with enzyme-mimicking catalytic activity; offer enhanced stability over natural enzymes. | Used as peroxidase mimics in paper-based colorimetric sensors for OPs [11]. |
| Screen-Printed Electrodes | Low-cost, disposable electrochemical platforms for sensor fabrication, ideal for field deployment. | Common substrate for electrochemical nanosensors due to cost-effective fabrication [11]. |
The benchmarking of nanosensors against conventional tools, powered by integrated AI and IoT platforms, marks a pivotal advancement for agricultural science and industry. The experimental data and protocols summarized herein demonstrate that nanosensors offer compelling advantages in sensitivity, speed, and portability for specific applications like pesticide residue detection. However, conventional methods and sensors remain valuable for their maturity and reliability in standardized laboratory settings.
The future of agricultural analytics lies in hybrid systems that leverage the strengths of both technologies within an intelligent framework. As noted in industry analysis, the largest value in IoT is shifting from hardware to the software and analytics that derive intelligence from device connections [46]. For researchers, the imperative is to continue refining nanosensor design for stability and scalability while developing ever more sophisticated AI models to interpret the complex data they generate, ultimately driving more precise, sustainable, and data-driven agriculture.
Navigating Practical Hurdles: Cost, Complexity, and Data Integrity
The integration of nanotechnology into agriculture presents a paradigm shift in farming practices, offering unprecedented precision and control. This guide provides an objective comparison between emerging nanosensors and conventional agricultural sensors, framing the analysis within the broader context of benchmarking research. For scientists and researchers, the adoption decision hinges on a clear-eyed assessment of performance, cost, and return on investment (ROI). While conventional methods like chromatography offer established reliability, their limitations in field-deployability and operational complexity are well-documented [11] [27]. Nanosensors, leveraging the unique properties of materials at the nanoscale, emerge as a powerful alternative, promising enhanced sensitivity, selectivity, and miniaturization [48]. However, their path to widespread commercialization is fraught with challenges related to high initial investment and complex manufacturing [22] [48]. This analysis synthesizes current experimental data and market forecasts to provide a rigorous cost-benefit framework, empowering professionals to navigate the adoption hurdle and make informed decisions on sensor technology integration.
Market and Performance Benchmarking
Global Market Outlook and Growth Drivers
The nanosensors market is experiencing significant growth, fueled by advancements in nanotechnology and rising demand across various sectors, including agriculture [49] [22] [50]. The table below summarizes the projected market growth and key regional trends, which are critical for understanding the economic landscape and investment potential.
Table 1: Global Nanosensors Market Forecast and Regional Analysis
| Metric | Details | Source/Notes |
|---|---|---|
| Market Size (2024/2025) | Ranging from USD 832.28 million (2024) to USD 901.78 million (2025) | [22] |
| Projected Market Size (2034/2035) | Ranging from USD 1,838.11 million (2034) to USD 1.7 billion (2035) | [22] [51] |
| Forecast CAGR | Varying from 6.8% to 9.3% during the period 2025-2035 | Varies by reporting agency [22] [50] [51] |
| Leading Regional Market | North America held the largest market share (33%) in 2024 | [22] |
| Fastest Growing Region | Asia-Pacific, estimated to expand at a CAGR of up to 9.32% | [22] |
Key market drivers include:
- Technological Advancements: Rapid evolution in nanomaterials enhances sensor accuracy and reliability [50].
- Demand for Real-Time Monitoring: The need for instant, precise diagnostics in healthcare, agriculture, and environmental protection is propelling adoption [50].
- Government Support: Significant research funding and initiatives, such as the European Union's Horizon program and grants from the U.S. National Institutes of Health (NIH), are accelerating innovation and commercialization [22] [51].
Performance Comparison: Nanosensors vs. Conventional Sensors
The core value proposition of nanosensors lies in their superior performance metrics compared to conventional agricultural sensors. The following table provides a comparative analysis based on key parameters relevant to agricultural research and application.
Table 2: Performance Benchmarking: Nanosensors vs. Conventional Agricultural Sensors
| Performance Parameter | Nanosensors | Conventional Sensors / Methods |
|---|---|---|
| Sensitivity & Specificity | High specificity and sensitivity due to high surface-to-volume ratio and operation at a scale comparable to biological processes [49] [11]. | Lower specificity and sensitivity; can struggle with trace-level detection in complex matrices [11]. |
| Detection Limit | Capable of detecting targets at trace concentrations (e.g., pesticides at pM to nM levels) [11]. | Generally higher detection limits; may not be suitable for ultra-trace analysis without sample pre-concentration. |
| Portability & On-Site Use | Designed for user-friendly, on-site, and real-time detection with simplified designs (e.g., test strips) [11]. | Often rely on bulky, laboratory-bound equipment (e.g., HPLC, GC-MS), limiting field deployment [11] [27]. |
| Analysis Speed | Rapid response, with some sensors achieving detection within seconds to minutes [11]. | Time-consuming, involving tedious sample preparation and analysis steps [11]. |
| Multiplexing Capability | Potential for high-throughput discovery and parallel detection of multiple analytes [52]. | Generally low multiplexing capability; often designed for single-analyte detection. |
Analyzing the Investment: Cost and ROI Considerations
Initial Investment and Operational Costs
The adoption of nanosensor technology is accompanied by a distinct cost structure that differs significantly from conventional methods.
Table 3: Cost Structure Analysis: Initial Investment and Operational Expenditure
| Cost Factor | Nanosensors | Conventional Sensors / Methods |
|---|---|---|
| Initial Capital Outlay | High-cost, sophisticated instrumentation for R&D and manufacturing; complex fabrication processes [22] [48]. | High acquisition cost for established analytical platforms (e.g., HPLC, GC-MS). |
| Cost per Unit/Sample | Potential for low-cost fabrication in the future (e.g., using screen-printed electrodes, molecular self-assembly) [11] [51]. | High operational cost per sample due to skilled personnel, expensive reagents, and maintenance. |
| Maintenance & Skilled Labor | Requires specialized knowledge for operation and data interpretation; maintenance can be complex [48]. | Requires continuous access to trained personnel and costly maintenance contracts [27]. |
A primary restraint for the nanosensors market is the high cost associated with hi-tech nano sensors, driven by complex manufacturing processes, fluctuations in raw material prices, and the need for specialized equipment and skilled labor [22]. These factors can reduce profit margins for manufacturers and create barriers to adoption for end-users.
Return on Investment (ROI) and Value Proposition
Despite the high initial investment, nanosensors offer a compelling long-term value proposition and ROI through several key benefits:
- Enhanced Agricultural Productivity: The use of nano-agrochemicals and precise monitoring systems can enhance plant growth, yield, and protection, directly contributing to higher farm revenue [9].
- Sustainability and GHG Mitigation: Nano-agrochemicals demonstrate significant potential for reducing greenhouse gas (GHG) emissions from the agricultural sector, aligning with global sustainability goals and potentially qualifying for green incentives [9].
- Efficiency Gains: The ability to perform rapid, on-site analysis eliminates the delays and costs associated with sending samples to centralized labs, leading to faster decision-making and reduced operational downtime [11] [27].
- Early Problem Detection: High sensitivity allows for the early identification of pathogens, pests, or nutrient deficiencies, enabling timely intervention and preventing large-scale crop losses [27].
Key Adoption Hurdles and Future Directions
The transition from laboratory innovation to commercial agricultural products faces several significant hurdles:
- Ecotoxicological Risks: The environmental impact of nanoparticles on soil ecosystems, including effects on nutrient dynamics, soil properties, and microbial communities, warrants careful attention and is an active area of research [9].
- Regulatory Landscapes: Navigating the complex regulatory pathways for new nano-agrochemicals and sensors is a challenging and time-consuming process [48].
- Commercialization Challenges: Bridging lab-scale innovations to market-ready products requires strategic partnerships, robust intellectual property management, and effective customer education [48].
Future growth is expected to be fueled by the integration with IoT and wearable technology, enabling continuous monitoring in smart farming systems [50]. Furthermore, advancements in sustainable materials, such as nanoparticles synthesized from agricultural waste, present a promising path toward more eco-friendly and cost-effective solutions [9].
Experimental Protocols and Research Toolkit
Representative Experimental Workflow for Nanosensor Development
The development of a novel nanosensor follows a structured research and development pipeline, from conceptualization to validation. The diagram below outlines a generalized workflow for creating binding-activated optical nanosensors, a common class of sensors used for detecting specific analytes.
Diagram 1: Biosensor Development Workflow
The Scientist's Toolkit: Key Research Reagent Solutions
The following table details essential materials and reagents used in the development and application of nanosensors for agricultural detection, as cited in recent research.
Table 4: Research Reagent Solutions for Nanosensor Development
| Reagent / Material | Function in Experiment | Experimental Example |
|---|---|---|
| Acetylcholinesterase (AChE) Enzyme | Biorecognition element; its inhibition by organophosphorus pesticides (OPs) is the basis for detection. | Used in electrochemical and fluorescent sensors for OP detection [11]. |
| Aptamers | Synthetic single-stranded DNA or RNA molecules acting as recognition elements; high affinity for targets. | Integrated into optical and electrochemical sensing platforms for specific analyte binding [11]. |
| Carbon Nanotubes (CNTs) & Graphene | Transduction material; enhance electron transfer kinetics, provide large surface area for bioreceptor immobilization. | Used in electrode modification for electrochemical detection of pesticides and toxins [48]. |
| Gold Nanoparticles (AuNPs) | Signal amplification; used in colorimetric and electrochemical sensors due to unique optical and conductive properties. | Applied in biosensors for the detection of various analytes [48]. |
| Molecularly Imprinted Polymers (MIPs) | Biomimetic synthetic receptors with tailor-made cavities for specific target molecules. | Employed as stable, low-cost recognition elements in pesticide sensors [11]. |
| Fluorogenic Amino Acids (FgAAs) | Genetically encodable building blocks that enable construction of binding-activated fluorescent sensors. | Used in a platform for rapid discovery of protein-based nanosensors [52]. |
| Quantum Dots (QDs) | Semiconductor nanocrystals as photoluminescent labels; signal transduction in optical sensing. | QD aerogel used in a microfluidic sensor for OP detection via fluorescence quenching [11]. |
Detailed Experimental Protocol: Enzyme-Based Fluorescent Nanosensor
This protocol details a specific method for detecting organophosphorus pesticides using an enzyme-based fluorescent microfluidic sensor, as described in the literature [11].
Objective: To rapidly detect and quantify organophosphorus pesticides (OPs) in fruit samples using a fluorescence-based nanosensor.
Principle: The sensor operates on an enzyme inhibition mechanism. Acetylcholinesterase (AChE) catalyzes the hydrolysis of acetylthiocholine (ATCh) to produce thiocholine. Thiocholine quenches the fluorescence of a CdTe Quantum Dot (QD) aerogel. In the presence of OPs, AChE is inhibited, less thiocholine is produced, and QD fluorescence is restored proportionally to the OP concentration.
Materials:
- Acetylcholinesterase (AChE) enzyme
- Acetylthiocholine (ATCh) iodide substrate
- Cadmium Telluride Quantum Dot (CdTe QD) aerogel
- Microfluidic device
- Fluorescence spectrophotometer
- Smartphone with camera (for colorimetric variations)
Procedure:
- Sensor Fabrication: Integrate the CdTe QD aerogel into the microfluidic channel.
- Sample Introduction: Mix the sample (e.g., fruit extract) with a standard solution of AChE and pre-incubate.
- Reaction: Inject the pre-incubated mixture and the ATCh substrate into the microfluidic device.
- Signal Measurement: Measure the fluorescence intensity of the QD aerogel in real-time.
- Data Analysis: Quantify the OP concentration based on the degree of fluorescence recovery compared to a control without OPs. The system achieved a detection limit of 0.38 pM for OPs in apples [11].
The benchmarking analysis reveals a clear trade-off. Conventional agricultural sensors and analytical methods offer established reliability but are often constrained by limitations in portability, speed, and cost-effectiveness for real-time, in-field monitoring. Nanosensors present a compelling alternative with superior sensitivity, rapid detection capabilities, and potential for miniaturization, directly addressing many of these limitations. The primary hurdle to their widespread adoption remains the high initial investment and complex manufacturing. However, the long-term ROI—through enhanced agricultural productivity, sustainability benefits, and significant operational efficiencies—positions nanosensors as a transformative technology for precision agriculture. For researchers and drug development professionals, strategic investment in understanding and developing this technology is not merely an operational upgrade but a critical step towards shaping the future of sustainable and efficient agricultural science.
The integration of advanced sensor technologies is revolutionizing agricultural practices, yet their implementation is hampered by significant technical complexity and a persistent agricultural skill gap. This article provides a comparative benchmarking analysis of emerging nanosensors against conventional agricultural sensors, evaluating their performance, operational requirements, and suitability within the current agricultural workforce landscape. By synthesizing experimental data and analyzing implementation frameworks, we identify critical strategies to bridge the gap between technological potential and practical application, enabling researchers and agricultural professionals to navigate the transition toward data-driven farming effectively.
Agriculture in 2025 faces a paradoxical challenge: the simultaneous need to increase productivity for global food security while minimizing environmental impacts, particularly greenhouse gas emissions [9]. Precision agriculture technologies promise to resolve this paradox through data-driven optimization, yet their adoption reveals a growing disconnect between technological sophistication and operator capability. The agricultural skill gap has become a critical bottleneck, with employers reporting significant deficiencies in problem-solving, decision-making, and technical skills among new hires [53].
Nanosensors represent a transformative leap in sensing capability, leveraging nanoscale materials (1-100 nm) to detect biological components and environmental parameters with unprecedented sensitivity [22] [11]. The global nanosensors market is projected to grow from approximately USD 901-983 million in 2025 to USD 1,838-2,220 million by 2034-2035, reflecting a compound annual growth rate of 7.6-8.5% [22] [54] [55]. This growth is primarily driven by agricultural applications including pesticide detection, soil health monitoring, and precision nutrient management [9] [11].
This analysis benchmarks nanosensors against conventional agricultural sensors across performance parameters, technical requirements, and implementation frameworks. By contextualizing this comparison within the prevailing agricultural skill landscape, we aim to provide researchers and agricultural developers with strategic pathways for effective technology integration.
Comparative Performance Benchmarking: Nanosensors vs. Conventional Sensors
The quantitative superiority of nanosensors becomes evident when analyzing key performance parameters essential for modern precision agriculture. The following comparison summarizes experimental data from peer-reviewed studies on sensor technologies for agricultural monitoring.
Table 1: Performance Comparison of Sensor Technologies for Pesticide Detection
| Performance Parameter | Conventional Chromatography (HPLC/GC) | Enzyme-Based Optical Nanosensor | Electrochemical Nanosensor |
|---|---|---|---|
| Detection Limit | ~1-10 ppb | 0.38 pM for OPs [11] | 0.08 mg/L (malathion) [11] |
| Analysis Time | Hours to days | Minutes | ~10 minutes [11] |
| Portability | Laboratory-bound | Field-deployable | Field-deployable (paper-based) [11] |
| Sample Preparation | Extensive cleanup required | Minimal | Minimal |
| Cost per Analysis | High (equipment + specialized personnel) | Moderate | Low |
| Multiplexing Capability | Limited | Moderate to high | Developing |
Table 2: Sensor Performance in Agricultural Monitoring Applications
| Application Area | Conventional Sensor Technology | Nanosensor Alternative | Key Performance Advantages |
|---|---|---|---|
| Soil Nutrient Monitoring | Ion-selective electrodes (ISE) | Nano-enhanced ISE | 2-3x higher sensitivity to NO₃⁻ and K⁺ [9] |
| Pathogen Detection | ELISA (enzyme-linked immunosorbent assay) | Aptamer-functionalized nanosensors | 100x lower detection limit; 5x faster response [11] |
| Greenhouse Gas Monitoring | NDIR (non-dispersive infrared) sensors | Metal-organic framework nanosensors | 10x higher sensitivity to N₂O; real-time soil emission mapping [9] |
| Moisture Sensing | TDR (time-domain reflectometry) sensors | Graphene oxide nanosensors | 50% higher accuracy in clay soils; 80% lower power consumption [56] |
The experimental data reveals consistent advantages across multiple agricultural sensing domains. Nanosensors achieve significantly lower detection limits through enhanced surface-to-volume ratios and quantum effects that amplify signals at trace analyte concentrations [22] [11]. Their miniaturization enables field-deployable formats that eliminate the logistical constraints of laboratory-bound conventional instruments [11].
Experimental Protocols for Nanosensor Performance Validation
Protocol: Validation of Nanozyme-Based Pesticide Detection
This protocol details the experimental methodology for benchmarking nanosensor performance against conventional techniques for organophosphorus pesticide detection, adapted from recent research [11].
Research Reagent Solutions:
- Copper Oxide Nanozyme (CuONPs): Peroxidase-mimicking catalyst; synthesized via flame spray pyrolysis (0.1 mg/mL suspension)
- Acetylcholinesterase (AChE) Enzyme: Biological recognition element for organophosphorus pesticides (0.5 U/mL in phosphate buffer)
- Acetylthiocholine (ATCh) Substrate: Enzyme substrate (10 mM in deionized water)
- o-Dianisidine Chromogen: Colorimetric peroxidase substrate (5 mM in DMSO)
- Organophosphorus Pesticide Standards: Malathion, parathion, chlorpyrifos (1-100 mg/L in methanol)
Methodology:
- Paper-based sensor fabrication: Deposit CuONPs onto nitrocellulose membranes using vacuum filtration; create hydrophilic detection zones with hydrophobic barriers.
- Sample pretreatment: Extract pesticide residues from agricultural products (fruits/vegetables) using QuEChERS method; dilute extracts in phosphate buffer (pH 7.4).
- Assay procedure:
- Pre-incubate 50 μL sample/standard with 50 μL AChE solution (15 min, 25°C)
- Apply 20 μL mixture to sensor detection zone
- Add 20 μL substrate solution (ATCh + o-dianisidine)
- Incubate 10 min for color development
- Signal detection: Capture color intensity using smartphone camera; analyze RGB values with ImageJ software.
- Data analysis: Generate calibration curve (pesticide concentration vs. color intensity); calculate detection limits using 3σ/slope method.
Diagram 1: Workflow for Nanosensor Pesticide Detection
Protocol: Comparative Analysis of Soil Nutrient Sensors
This protocol establishes a standardized framework for evaluating the performance of nanosensor-enhanced soil nutrient probes against conventional ion-selective electrodes.
Research Reagent Solutions:
- Nanocomposite Membranes: Graphene-carbon nanotube mixtures in polymeric matrix (for nitrate and potassium sensing)
- Standard Soil Solutions: Certified reference materials with known NO₃⁻, K⁺, PO₄³⁻ concentrations
- Soil Samples: Varied textures (sandy loam, clay, silt) with predetermined nutrient levels
- Buffer Solutions: Ionic strength adjustment buffers (pH 5.5-7.5 range)
Methodology:
- Sensor calibration: Immerse all sensors in standard solutions (1-1000 ppm); record potential/current responses; generate calibration curves.
- Soil measurement: Insert sensors into saturated soil pastes; measure nutrient levels at 15-minute intervals over 24 hours.
- Interference testing: Evaluate cross-sensitivity to competing ions (Cl⁻ for NO₃⁻ sensors; Na⁺ for K⁺ sensors).
- Validation analysis: Compare sensor readings with standard laboratory methods (HPLC for nitrate; AAS for potassium).
- Statistical analysis: Calculate correlation coefficients (R²), root mean square error (RMSE), and limit of detection (LOD) for each sensor type.
The Agricultural Skill Gap: Implementation Barriers
The technical sophistication of nanosensors intersects with a workforce experiencing significant skill shortages. Agricultural employers report that approximately 40% of farms now prioritize talent development programs to address operational efficiency challenges [57]. The most critical skill gaps identified across the industry include:
- Problem Solving & Decision-Making: Highest priority need for both recent graduates and experienced hires [53]
- Organization & Planning Skills: Essential for implementing precision agriculture systems [53]
- Technical Aptitude: Required for operating advanced sensor systems and interpreting complex data [58]
- Data Analysis Capabilities: Needed to translate sensor outputs into actionable management decisions [56]
This skill gap is exacerbated by an aging agricultural workforce, rural-to-urban migration, and the rapid pace of technological change [58] [57]. The implementation challenge is therefore twofold: selecting appropriate sensing technologies and developing the human capital required to deploy them effectively.
Diagram 2: Skill Gap and Implementation Barrier Relationships
Implementation Strategies for Diverse Agricultural Operations
Successful integration of nanosensor technologies requires tailored approaches that address both technical and human capital challenges. The following strategies have demonstrated efficacy in bridging the implementation gap:
Tiered Technology Adoption Framework
Table 3: Tiered Implementation Strategy Based on Farm Size and Capability
| Operation Scale | Recommended Sensor Technology | Implementation Priority | Staffing Approach |
|---|---|---|---|
| Smallholder Farms (<50 ha) | Paper-based nanosensors; Smartphone-based readers | Single-parameter monitoring (pesticides or soil pH) | Shared technical specialists; Farmer cooperatives |
| Medium-Sized Farms (50-500 ha) | Hybrid systems: Conventional sensors with nanosensor validation | Targeted monitoring (pest hotspots; nutrient-deficient zones) | Dedicated precision ag technician; Strategic hiring |
| Large Enterprises (>500 ha) | Integrated nanosensor networks; IoT platforms | Whole-farm sensing infrastructure | Specialized data scientists; Cross-functional teams |
| Research Institutions | Advanced electrochemical/optical nanosensors | Method development; Validation protocols | Multidisciplinary teams; Industry partnerships |
Workforce Development Strategies
Modern agricultural HR strategies now focus on technology-enabled workforce development to overcome skill gaps [57]. Effective approaches include:
- AI-Driven Recruitment: Specialized digital platforms with AI vetting tools connect employers with candidates possessing required technical and physical skills (65% adoption rate by 2025) [57]
- Virtual Reality Training: Gamified platforms prepare workers for real-world equipment operation and health & safety drills, bridging theory-field practice gaps [57]
- Continuous Upskilling Programs: Structured training in data interpretation, smart device operation, and troubleshooting maximizes technology ROI [57] [53]
- Remote Workforce Management: Digital HR applications enable real-time team management across geographically dispersed farms (71% adoption rate) [57]
Technical Support Infrastructure
The complex maintenance and calibration requirements of nanosensors necessitate robust support systems:
- Predictive Maintenance Analytics: IoT-connected sensors with automated performance monitoring reduce downtime
- Centralized Calibration Services: Regional hubs providing standardized calibration protocols ensure data reliability
- Simplified User Interfaces: Dashboard visualization tools designed for agricultural professionals rather than sensor specialists
- Interoperability Standards: Open API frameworks enabling integration between different precision farming systems [56]
Nanosensors demonstrate unequivocal performance advantages over conventional agricultural sensors in sensitivity, detection limits, and field deployability. Their potential for revolutionizing agricultural monitoring is substantiated by robust experimental data across multiple application domains. However, the implementation gap remains a significant barrier, rooted in technical complexity and workforce capability limitations rather than technological deficiencies.
The successful integration of nanosensor technologies requires a dual approach: continued refinement of the technologies themselves and simultaneous investment in human capital development. By adopting tiered implementation strategies aligned with operational scale and workforce capability, agricultural enterprises can systematically bridge the skill gap while progressively leveraging advanced sensing capabilities. Future research should focus on developing increasingly user-friendly nanosensor platforms and validating workforce development frameworks that accelerate technology adoption across the agricultural sector.
For researchers and agricultural developers, this analysis provides both a performance benchmark and implementation framework. The experimental protocols establish standardized methodologies for ongoing technology validation, while the implementation strategies address the critical human factors that ultimately determine technological success in agricultural applications.
The transition from traditional to smart farming is fundamentally reliant on robust sensor technology that provides accurate, real-time data on crop and soil conditions [59]. These sensors serve as the foundational "senses" of precision agriculture, enabling intelligent decision-making for resource management [59]. While conventional agricultural sensors have established utility, their performance is often compromised by calibration drift, soil variability, and harsh environmental conditions [60] [61]. The emergence of nanosensors, engineered with nanomaterials such as graphene, carbon nanotubes, quantum dots, and metal-organic frameworks, promises enhanced sensitivity, selectivity, and stability [62] [63] [64]. This guide provides an objective comparison between these evolving technologies, focusing on the critical benchmarks of calibration, stability, and field performance to inform researchers and development professionals.
Performance Comparison: Nanosensors vs. Conventional Counterparts
The quantitative and qualitative performance of nanosensors and conventional sensors varies significantly across key metrics relevant to agricultural applications. The following analysis synthesizes data from recent experimental studies to provide a direct comparison.
Table 1: Quantitative Performance Comparison of Sensor Technologies
| Performance Metric | Conventional Capacitive Sensor (e.g., SEN0193) | Advanced Optical/Chemical Nanosensor | Experimental Context & Citation |
|---|---|---|---|
| Soil Moisture Accuracy | MAE: 1.56% (after field calibration) [60] | Information Missing | Post-calibration validation against gravimetric method [60] |
| Correlation with Reference | Spearman rank > 0.98 (vs. SM150T) [60] | Information Missing | Field testing in sugarcane field [60] |
| Heavy Metal Detection Limit | Information Missing | Ultralow detection limits [63] | Laboratory setting, employing advanced materials [63] |
| Pesticide Detection Sensitivity | Information Missing | Single-molecule detection capability [62] | Theoretical/Controlled laboratory environment [62] |
| Key Advantage | Cost-effectiveness, field-validated performance [60] | Superior sensitivity and specificity [62] [63] | N/A |
| Primary Limitation | Susceptible to soil-specific variability, requires frequent calibration [60] [61] | Limited long-term stability data in real-world soils [63] | N/A |
Table 2: Qualitative Comparison of Sensor Stability and Calibration Needs
| Characteristic | Conventional Sensors | Nanosensors |
|---|---|---|
| Calibration Complexity | High - Requires soil-specific field calibration using gravimetric methods to map sensor output to volumetric water content [60] [61]. | Potentially Lower - Aims for inherent specificity, though field validation for complex soil matrices remains an active research area [62] [59]. |
| Signal Drift | Prone to drift due to temperature, salinity, and soil compaction [60] [61]. | Engineered for enhanced stability using advanced nanomaterials, but long-term field data is still emerging [63] [64]. |
| Environmental Resilience | Moderate; performance affected by soil texture, salinity, and temperature, requiring compensatory calibration [61]. | High potential; materials like metal-organic frameworks (MOFs) and graphene show improved resistance to fouling and interference [63] [64]. |
| Spatial Monitoring Volume | Small (≈1 dm³), making readings susceptible to local soil heterogeneity [60]. | Can be functionalized for targeted sensing at cellular, tissue, or environmental levels [62] [59]. |
Experimental Protocols for Sensor Benchmarking
To ensure fair and reproducible comparisons, researchers employ standardized experimental protocols. Below are detailed methodologies for two critical types of analyses.
Protocol for Field Calibration and Validation of Soil Moisture Sensors
This protocol, adapted from studies on capacitive sensors, is essential for establishing accuracy under real-world conditions [60] [61].
- Sensor Installation: Install the sensors in-situ at the desired depth and proximity to the irrigation source or plant root zone.
- Baseline Dry Point Measurement:
- Record the sensor's output voltage or digital reading.
- Collect a soil sample from the immediate vicinity of the sensor.
- Weigh the soil sample immediately (wet weight), then dry it in a laboratory oven at 105°C until a constant weight is achieved.
- Weigh the dried sample (dry weight) and calculate the gravimetric water content.
- Wet Point Measurement:
- Saturate the soil area around the sensor with distilled water.
- After equilibration, record the sensor's output.
- Collect another adjacent soil sample and determine its gravimetric water content.
- Data Mapping and Curve Fitting:
- Plot the sensor's output readings against the gravimetrically-determined volumetric water content.
- Perform regression analysis to develop a calibration model (e.g., linear or polynomial) that predicts soil moisture from the sensor output.
- Validation:
- Validate the calibrated sensor by comparing its readings against a commercial, research-grade sensor (e.g., SM150T) or additional gravimetric samples over multiple irrigation cycles [60].
The following workflow visualizes the key steps in this calibration process:
Protocol for Assessing Heavy Metal Detection in Soil
This protocol outlines the evaluation of electrochemical nanosensors for trace metal analysis, a key application for environmental monitoring [63].
- Soil Sample Preparation:
- Collect and homogenize soil samples.
- Digest the soil samples using strong acids to extract heavy metals into a liquid solution.
- Dilute the extracts to a suitable concentration range for sensor analysis.
- Sensor Preparation:
- Functionalize the working electrode of the nanosensor (e.g., a screen-printed electrode modified with metal-organic frameworks or "green" quantum dots) to target specific metal ions.
- Electrochemical Measurement:
- Immerse the sensor in the prepared soil extract.
- Use a technique such as Anodic Stripping Voltammetry (ASV):
- Pre-concentration Step: Apply a negative potential to reduce and deposit metal ions onto the electrode surface.
- Stripping Step: Apply a positive potential sweep, oxidizing (stripping) the deposited metals back into solution.
- Measure the resulting current, where the peak potential identifies the metal and the peak current quantifies its concentration.
- Data Analysis:
- Generate a calibration curve by measuring the current response for standard solutions with known metal concentrations.
- Calculate the detection limit, sensitivity, and selectivity of the sensor in the presence of other common metal ions in soil.
The workflow for this electrochemical detection is as follows:
The Scientist's Toolkit: Key Research Reagents and Materials
The development and testing of advanced agricultural sensors rely on a specific set of materials and reagents.
Table 3: Essential Research Reagent Solutions for Sensor Development
| Reagent/Material | Function in R&D | Application Example |
|---|---|---|
| Functionalized Nanomaterials (Graphene, MXenes, Metal-Organic Frameworks) | Enhance signal transduction, provide high surface area for analyte binding, and improve selectivity [63] [64]. | Electrochemical platforms for trace metal analysis [63]. |
| Recognition Elements (Antibodies, Aptamers, Enzymes) | Provide biological or chemical specificity for target analytes (e.g., pesticides, pathogens) [62] [65]. | Biosensors for pesticide detection or plant hormone monitoring [62] [59]. |
| Screen-Printed Electrodes | Serve as low-cost, portable, and customizable platforms for electrochemical sensing [63]. | Field-deployable heavy metal detection systems [63]. |
| Flexible/Stretchable Polymers (e.g., PDMS) | Act as substrates for wearable sensors, allowing conformal contact with plant surfaces [64] [59]. | Wearable plant sensors for in-situ monitoring of water status or biochemicals [59]. |
| Reference Standard Materials | Used for calibration and validation of sensor accuracy against established methods [60] [61]. | Gravimetric analysis for soil moisture sensor calibration [60]. |
The benchmarking data indicates a complementary relationship between conventional and nanosensor technologies. Conventional sensors provide cost-effective, field-validated solutions for established parameters like soil moisture but require rigorous, soil-specific calibration to ensure reliability [60] [61]. In contrast, nanosensors demonstrate unparalleled sensitivity and potential for miniaturization and multifunctionality, yet their long-term stability and performance in complex, heterogeneous field environments require further extensive validation [62] [63]. Future research must focus on closing this data gap through long-term in-situ studies. Furthermore, the integration of machine learning for signal deconvolution and calibration, the development of robust anti-fouling coatings, and the creation of multiplexed sensor networks represent the next frontier in creating intelligent, reliable, and scalable soil monitoring systems for precision agriculture [63] [59].
Data Management, Privacy, and Ownership in an Era of Connected Farms
The integration of advanced sensing technologies into agriculture is revolutionizing farm management through data-driven decisions. This shift is central to the rise of "connected farms," which leverage networks of devices to monitor everything from soil conditions to crop health. A critical area of research involves benchmarking the performance of emerging nanosensors against conventional agricultural sensors. This comparison is not merely a technical exercise; it is fundamental to understanding the new data management, privacy, and ownership challenges that these technologies introduce. Nanosensors, with their enhanced capabilities, generate data of unprecedented volume and granularity, thereby intensifying the stakes for secure and equitable data handling. This article objectively compares these sensing paradigms within the context of a broader thesis on their performance and the subsequent implications for the agricultural data ecosystem.
Performance Comparison: Nanosensors vs. Conventional Agricultural Sensors
The core of benchmarking lies in a direct comparison of performance metrics. The following tables summarize experimental data from recent studies, highlighting the distinct advantages and limitations of nanosensors relative to conventional technologies.
Table 1: General Performance Benchmarking of Sensor Technologies
| Performance Metric | Conventional Sensors (e.g., pH, Electrochemical) | Nanosensors (Optical, Electrochemical) | Experimental Context & Citations |
|---|---|---|---|
| Detection Limit (for pesticides) | ~µg/L to mg/L range | pg/L to ng/L range (e.g., 0.38 pM for OPs) | Fluorescent microfluidic sensor with CdTe quantum dots for organophosphorus (OP) detection in apples [11]. |
| Sensitivity | Lower; requires higher analyte concentrations | Exceptionally high due to high surface-to-volume ratio | Nano-enabled electrochemical and optical platforms enhance signal transduction [66]. |
| Response Time | Minutes to hours | Seconds to minutes | Rapid response facilitated by enhanced electron transfer rates and catalytic properties of nanomaterials [66]. |
| Selectivity | Moderate; can suffer from interference | High; enabled by advanced recognition elements (aptamers, MIPs, nanozymes) | Use of molecularly imprinted polymers (MIPs) and aptamers provides specific binding sites [11]. |
| Multiplexing Capability | Limited; often single-analyte focus | High potential for detecting multiple analytes simultaneously | Nanomaterial-based platforms can be functionalized with multiple recognition elements [67]. |
| Portability / On-Site Use | Some portable units available, but lab-based methods are standard | High; designed for field-deployable, point-of-use testing | Paper-based analytical devices and smartphone-integrated systems for on-site malathion detection [11]. |
Table 2: Data and Operational Characteristics in Agricultural Settings
| Characteristic | Conventional Sensors | Nanosensors | Implications for Data Management & Citations |
|---|---|---|---|
| Data Granularity | Macro-level field data (e.g., average soil moisture) | Micro-scale, high-resolution data (e.g., soil conditions at plant root level) | Increases data volume and complexity, demanding robust data processing and storage solutions [67] [66]. |
| Integration with IoT | Possible, but can be limited by power and data output | Inherently suited for IoT networks; enables real-time data streaming | Creates dense, continuous data flows, escalating transmission, security, and aggregation challenges [68] [66]. |
| Environmental Impact | Typically bulkier materials | Ecotoxicological risks of nanoparticles in soil ecosystems require careful evaluation | Data on environmental fate is crucial for sustainable use and public acceptance [9]. |
| Scalability & Cost | Established, often lower unit cost | High R&D cost; scaling production and ensuring biocompatibility remain challenges | Impacts widespread adoption and the economic model of data collection [69] [70]. |
Experimental Protocols for Sensor Benchmarking
To generate the comparative data presented above, researchers employ rigorous experimental methodologies. Below are detailed protocols for key assays used to evaluate sensor performance.
Protocol for Sensitivity and Detection Limit Analysis
This protocol is used to determine the lowest detectable concentration of an analyte (e.g., a pesticide) and the sensor's response gradient.
- Sensor Preparation: Nanosensors (e.g., a quantum dot-based fluorescent probe) and conventional sensors (e.g., a standard electrochemical electrode) are fabricated and calibrated against standard buffer solutions [11].
- Sample Preparation: A series of standard solutions of the target analyte (e.g., malathion) are prepared in a clean matrix, such as a buffer or purified extract from agricultural produce (e.g., apple or lettuce). The concentration range should span from levels below the expected detection limit to saturation.
- Measurement: Each sensor is exposed to the standard solutions in order of increasing concentration. For the nanosensor, the fluorescence intensity is measured using a spectrophotometer. For the electrochemical sensor, the current or potential change is recorded [11] [66].
- Data Analysis: The signal output is plotted against the analyte concentration. The limit of detection (LOD) is calculated as the concentration corresponding to the signal from a blank sample plus three times the standard deviation of the blank. The sensitivity is derived from the slope of the linear portion of the calibration curve [11].
Protocol for Selectivity and Interference Testing
This protocol assesses the sensor's ability to distinguish the target analyte from other similar substances.
- Interferent Selection: Common interfering substances found in the target environment (e.g., other pesticides, soil ions, organic acids) are identified.
- Control Measurement: The sensor's response to the target analyte at a fixed concentration is recorded.
- Interference Challenge: The sensor's response is measured again when exposed to a solution containing the target analyte mixed with a high concentration of each potential interferent, one at a time.
- Data Analysis: The signal change in the presence of the interferent is compared to the control measurement. A signal change of less than 5% is typically considered to indicate high selectivity [11]. The use of specific recognition elements like aptamers in nanosensors makes this a critical validation step.
Data Security and Privacy Signaling Pathways in Connected Farms
The data generated by sensor networks flows through a complex ecosystem, creating multiple points where privacy and security must be actively enforced. The following diagram illustrates the key pathways and control points for securing agricultural data from collection to use.
Data Security and Privacy Control Pathway
This workflow highlights critical vulnerabilities—such as data interception and unauthorized access—and the corresponding technological solutions being deployed to mitigate them, including advanced encryption and decentralized architectures [68] [71].
The Researcher's Toolkit: Essential Reagents and Materials
Research and development in agricultural nanosensors rely on a specific set of materials and reagents. The following table details key components and their functions in sensor fabrication and testing.
Table 3: Key Research Reagent Solutions for Nanosensor Development
| Item | Function in Research | Example Use-Case |
|---|---|---|
| Quantum Dots (QDs) e.g., CdTe, Graphene QDs | Fluorescent signal transducers; high quantum yield allows for highly sensitive detection. | CdTe QD aerogel in a microfluidic sensor for pesticide detection via fluorescence quenching [11]. |
| Aptamers | Synthetic single-stranded DNA/RNA molecules serving as recognition elements; high affinity and specificity for targets. | Used as bioreceptors in optical and electrochemical sensors to selectively bind pesticides [11]. |
| Molecularly Imprinted Polymers (MIPs) | Biomimetic synthetic receptors with cavities complementary to the target molecule. | Serve as stable, low-cost recognition elements for pesticides in place of biological components [11]. |
| Nanozymes e.g., CuO NPs, SACe-N-C | Nanomaterials with enzyme-like catalytic activity; more stable than natural enzymes. | CuO nanoparticles used as peroxidase mimics in colorimetric paper sensors for pesticide detection [11]. |
| Electrochemical Transducers e.g., Screen-printed electrodes (SPEs) | Platform for converting a biochemical event into a measurable electrical signal (current, potential). | Basis for portable, low-cost nanosensors; nanomaterials are often deposited on SPEs to enhance sensitivity [11] [66]. |
| Blockchain Platforms e.g., Hyperledger Fabric, Ethereum | Provide a decentralized, immutable ledger for securing data transactions and establishing provenance. | Used in multi-tiered architectures (Edge-Fog-Cloud) to ensure data security and transparent access control in Agri-IoT [68]. |
Discussion and Future Outlook
The benchmarking data clearly illustrates that nanosensors offer transformative gains in sensitivity, speed, and specificity compared to conventional sensors. However, these performance enhancements come with amplified challenges. The high-resolution, continuous data streams generated by nanosensor networks exacerbate existing issues in data security, farmer privacy, and ownership [71].
Future research must run in two parallel tracks:
- Technical Advancement: Continuing to improve sensor biocompatibility, scalability, and integration with secure, decentralized data systems like blockchain [68].
- Socio-technical Frameworks: Developing clear regulatory guidelines, standardized data ownership policies, and equitable models for data benefit-sharing. Ensuring that the technological revolution on the farm does not come at the cost of farmer autonomy and data sovereignty is paramount [72] [71].
The future of connected farms depends not only on the sophistication of our sensors but also on the resilience, fairness, and security of the data ecosystems we build to support them.
The Performance Verdict: A Side-by-Side Comparison of Sensor Capabilities
The transition from experience-based farming to precision agriculture relies on robust sensing technologies for monitoring soil, crops, and environmental conditions [1]. Conventional sensors, while foundational, often face limitations in sensitivity, specificity, and speed when deployed in complex agricultural matrices [27]. The emergence of nanosensors, which leverage the unique properties of nanomaterials, promises to overcome these hurdles [11]. This guide provides a performance benchmark between conventional and nano-enabled sensors, offering researchers a quantitative comparison of sensitivity, specificity, and response time based on recent experimental data. The analysis focuses on two critical agricultural applications: pathogen detection and pesticide residue monitoring, providing detailed methodologies to facilitate experimental replication and validation.
The table below summarizes experimental performance data for conventional agricultural sensors versus nano-enabled sensors across key detection scenarios.
Table 1: Performance Benchmarking of Sensor Technologies in Agriculture
| Detection Target | Sensor Technology | Sensitivity (Limit of Detection) | Specificity / Cross-Reactivity | Response Time | Reference |
|---|---|---|---|---|---|
| Plant Pathogens (e.g., Candidatus Phytoplasma) | Traditional Molecular Methods (PCR) | Varies, generally lower than nanosensors | High | Several hours (including sample prep) | [25] |
| Quantum Dot (QD) Nanobiosensor | Highly sensitive | High (via specific biorecognition) | Real-time / Faster response | [25] | |
| Organophosphorus (OP) Pesticides | Chromatography (HPLC/GC) | ~µg/L to ng/L | High | >30 min (plus sample prep) | [11] |
| Acetylcholinesterase (AChE) Enzyme Sensor (Conventional) | ~nM to µM range | Lower (Enzyme inhibition-based) | Minutes to tens of minutes | [11] | |
| CdTe QD Aerogel Fluorescent Microsensor | 0.38 pM | High (in apples) | ~10 minutes (for full assay) | [11] | |
| CuO Nanozyme Paper Sensor | 0.08 mg/L | High (for malathion in fruits/veg) | ~10 minutes | [11] | |
| Citrus Tristeza Virus | Serological Methods (ELISA) | ~µg/mL range | Moderate | Several hours | [25] [26] |
| FRET-based Sensor (CdTe QDs + Rhodamine) | 220 ng/mL | High (via coat protein interaction) | Faster than serological methods | [25] [26] | |
| General Volatiles/Gases | Electronic Noses (Metal-Oxide) | ppm range | Lower (Affected by humidity/temperature) | Seconds to minutes | [35] |
| AI-Driven Photonic Noses | High (ppm to ppb potential) | High (via spectral fingerprinting) | Sub-second (for detection itself) | [35] |
Experimental Protocols for Key Nanosensing Platforms
Protocol 1: Fluorescent QD Aerogel Sensor for OP Pesticides
This protocol details the methodology for detecting organophosphorus pesticides using a fluorescence-based nanosensor, achieving a detection limit of 0.38 pM [11].
- 1. Sensor Fabrication:
- Synthesize a three-dimensional (3D) porous aerogel network composed of Cadmium Telluride Quantum Dots (CdTe QDs).
- Integrate the QD aerogel into a microfluidic chip to create a lab-on-a-chip platform for controlled fluid handling and analysis.
- 2. Assay Principle (Enzyme Inhibition & Fluorescence Quenching):
- The enzyme Acetylcholinesterase (AChE) catalyzes the hydrolysis of its substrate, acetylthiocholine (ATCh).
- The hydrolysis product, thiocholine, acts as a potent quencher of the red fluorescence emitted by the CdTe QD aerogel.
- Introduce the sample containing OPs. OPs inhibit AChE activity, reducing the production of thiocholine.
- The degree of fluorescence recovery is quantitatively correlated to the concentration of OPs present.
- 3. Detection and Data Analysis:
- Measure the fluorescence intensity of the system under a standard optical reader or a microfluidic detector.
- The intensity is inversely proportional to the OP concentration. A calibration curve is used to quantify OP levels in unknown samples, such as apple extracts.
Diagram 1: QD Aerogel OP Detection Workflow
Protocol 2: FRET-Based Nanobiosensor for Plant Viruses
This protocol describes the detection of the Citrus tristeza virus (CTV) using a Förster Resonance Energy Transfer mechanism with a detection limit of 220 ng/mL [25] [26].
- 1. Sensor Design:
- Utilize Cadmium Telluride Quantum Dots (CdTe QDs) as the fluorescence donor.
- Use Rhodamine dye, chemically linked to the CTV coat protein (CP), as the acceptor.
- In the absence of the virus, the CP-rhodamine conjugate binds to the QDs, bringing the donor and acceptor into close proximity.
- 2. Assay Principle (FRET):
- When donor (QD) and acceptor (Rhodamine) are in proximity, excitation of the QD leads to energy transfer to Rhodamine, quenching QD fluorescence and emitting Rhodamine fluorescence.
- When the target CTV virus is present, its free coat proteins compete for binding, displacing the CP-rhodamine conjugate from the QD surface.
- This displacement disrupts the FRET pair, leading to the recovery of QD fluorescence.
- 3. Detection and Data Analysis:
- Monitor the fluorescence emission spectrum of the solution.
- The intensity of the restored QD fluorescence signal is directly proportional to the concentration of the target CTV virus.
Diagram 2: FRET-Based Viral Detection Mechanism
The Scientist's Toolkit: Essential Research Reagents and Materials
Table 2: Key Research Reagents for Nanosensor Development
| Reagent / Material | Function in Experimentation | Example Use Case |
|---|---|---|
| Quantum Dots (QDs) | Semiconductor nanocrystals acting as highly bright and stable fluorescence donors or signal reporters. | CdTe QDs in FRET-based virus detection and OP pesticide sensing [25] [11]. |
| Gold Nanoparticles (Au NPs) | Provide a surface for bioreceptor immobilization; enable colorimetric detection based on surface plasmon resonance shifts. | Colorimetric detection of urea, urease, and pathogens like R. solanacearum [26]. |
| Nanozymes (e.g., CuO NPs) | Nanomaterials with enzyme-like catalytic activity, offering higher stability than natural enzymes. | Peroxidase-mimic in colorimetric paper sensors for pesticide detection [11]. |
| Acetylcholinesterase (AChE) | A key enzyme whose inhibition by organophosphorus and carbamate pesticides is the basis for many detection assays. | Used as the biorecognition element in electrochemical and fluorescent OP sensors [11]. |
| Aptamers | Single-stranded DNA or RNA oligonucleotides selected for high-affinity binding to specific targets, serving as synthetic bioreceptors. | Used as recognition elements in sensors for pesticides and other small molecules [11] [73]. |
| Molecularly Imprinted Polymers (MIPs) | Synthetic polymers with tailor-made cavities that mimic natural antibody binding sites, offering high stability. | Used as robust, synthetic recognition elements for pesticides and toxins [11]. |
| Antibodies | Natural biorecognition elements providing high specificity for antigens like pathogen proteins. | Used in immunosensors for plant virus and bacterial pathogen detection (e.g., P. stewartii) [26]. |
The integration of sensing technologies is a cornerstone of modern precision agriculture, enabling data-driven management from individual plants to vast commercial fields. Within this domain, nanosensors represent a paradigm shift, offering capabilities far beyond those of conventional agricultural sensors. This guide provides an objective comparison of these technologies, benchmarking their performance against traditional alternatives. The evaluation is framed within a rigorous research context, focusing on quantifiable metrics such as sensitivity, limit of detection, and operational scalability, which are critical for researchers and scientists developing next-generation agricultural monitoring systems. The comparative analysis spans diverse agricultural applications, from soil condition monitoring to the precise detection of pesticide residues, providing a comprehensive evidence base for technology selection and research direction.
Performance Comparison: Nanosensors vs. Conventional Sensors
The following tables summarize key performance characteristics of nanosensors and conventional sensors, based on recent experimental studies and commercial product data. These metrics are essential for benchmarking in research and development.
Table 1: Performance Comparison for Pesticide Residue Detection
| Performance Parameter | Nanosensors | Conventional Sensors / Methods (e.g., Chromatography) |
|---|---|---|
| Detection Limit (Malathion) | 0.012 ppt (PANI/GO Cantilever) [74] | Parts-per-billion (ppb) to parts-per-million (ppm) range [11] |
| Response Time | < 26 seconds [74] | Minutes to hours (including sample preparation) [11] [27] |
| Selectivity | High selectivity against interferents (e.g., glyphosate) [74] | High, but can be affected by complex sample matrices [11] |
| Operational Stability | Up to 24 months [74] | Requires frequent calibration and maintenance [27] |
| Sample Preparation | Minimal; direct detection of volatiles [74] | Extensive; requires extraction and purification [11] [27] |
| Portability | High; suitable for on-site, real-time monitoring [11] [74] | Low; primarily confined to laboratory use [11] [27] |
Table 2: Scalability and Agronomic Application Parameters
| Parameter | Nanosensors | Conventional Electrochemical/Physical Sensors |
|---|---|---|
| Primary Agri-Applications | Pesticide detection, pathogen identification, soil nutrient sensing [9] [11] [27] | Soil moisture, temperature, pH, humidity [75] [76] |
| Sensitivity | Extremely high (e.g., ppt for pesticides) [74] | Moderate (e.g., percentage for soil moisture) [75] |
| Cost Profile | High R&D cost; potential for low-cost mass production [77] [15] | Lower initial cost; established manufacturing [77] |
| Integration with IoT/AI | High potential; enables real-time, granular data streams [78] [79] | Mature integration; provides foundational field data [75] [76] |
| Scalability Challenge | Economic viability for smallholders, technical expertise required [77] | Connectivity gaps in rural areas, data interoperability [77] [76] |
Experimental Protocols and Methodologies
To ensure the reproducibility of benchmarking studies, detailed methodologies for key experiments are outlined below.
Protocol for Cantilever-Based Gas Nanosensor Pesticide Detection
This protocol details the methodology for evaluating gas nanosensors, as derived from a study on detecting malathion and malaoxon [74].
- 1. Sensor Functionalization:
- Materials: Clean silicon cantilevers, polyaniline (PANI) powder, graphene oxide (GO) suspension, silver nitrate (AgNO₃), isopropanol.
- Procedure:
- PANI/GO Nanocomposite: Synthesize via in situ chemical polymerization of aniline in the presence of graphene oxide.
- PANI/Ag Nanohybrid: Synthesize via in situ chemical reduction of AgNO₃ on powdered PANI.
- Deposition: Apply the synthesized nanomaterials (PANI/GO or PANI/Ag) onto the cleaned cantilever surface to form the nanostructured sensing layer.
- 2. Experimental Setup and Vapor Exposure:
- Apparatus: Cantilever sensor platform housed in a sealed test chamber with controlled gas flow.
- Food Matrix Simulation: To simulate real-world conditions, kale leaves (Brassica oleracea) are placed within the test chamber.
- Analyte Introduction: Introduce volatile compounds of pure malathion, commercial malathion, or malaoxon at varying concentrations (e.g., 0.05 to 1000 ppt) into the chamber using a calibrated vapor generator.
- 3. Data Acquisition and Analysis:
- Measurement: Monitor the resonance frequency shift of the cantilever in real-time upon exposure to the target analyte.
- Recovery: Flush the chamber with synthetic air to observe the sensor's return to baseline frequency, demonstrating reversibility.
- Calculation: Calculate sensitivity, limit of detection (LOD), and limit of quantification (LOQ) from the dose-response curve (frequency shift vs. concentration).
Protocol for Nanomaterial-Based Electrochemical Pestide Detection
This protocol summarizes a common approach for developing electrochemical nanosensors for liquid-phase analysis [11].
- 1. Sensor Fabrication:
- Materials: Screen-printed electrodes (SPE), nanomaterials (e.g., metal nanoparticles, carbon nanotubes), recognition elements (e.g., Acetylcholinesterase enzyme, aptamers, antibodies).
- Procedure: Modify the working electrode of the SPE by drop-casting or electrodepositing the nanomaterial suspension. Immobilize the chosen recognition element (e.g., AChE) onto the nanostructured electrode surface.
- 2. Measurement and Detection Mechanism:
- Apparatus: Potentiostat for electrochemical measurements (e.g., chronoamperometry, electrochemical impedance spectroscopy).
- Enzyme Inhibition Assay (for Organophosphorus Pesticides):
- Incubate the modified electrode with a sample solution.
- If pesticides are present, they inhibit the AChE enzyme.
- Add a substrate (e.g., acetylthiocholine). The enzymatic reaction product (thiocholine) generates an electrochemical signal (current).
- The measured signal is inversely proportional to the pesticide concentration due to enzyme inhibition.
- 3. Data Analysis:
- Calibration: Measure the electrochemical response for a series of standard pesticide solutions.
- Quantification: Use the calibration curve to determine the concentration of unknown samples.
Signaling Pathways and Experimental Workflows
The following diagrams, generated using Graphviz DOT language, illustrate the core conceptual frameworks and experimental workflows for nanosensor deployment and benchmarking.
Nanosensor Deployment and Analysis Workflow
Multi-Scale Agricultural Integration Framework
The Scientist's Toolkit: Key Research Reagent Solutions
This table details essential materials and reagents used in the development and testing of agricultural nanosensors, as cited in the experimental protocols.
Table 3: Key Research Reagents for Nanosensor Development
| Reagent / Material | Function in Research and Development | Example Application |
|---|---|---|
| Polyaniline (PANI) | A conducting polymer used as a sensing layer; provides a matrix for nanocomposites and facilitates signal transduction [74]. | Cantilever gas nanosensors for pesticide detection [74]. |
| Graphene Oxide (GO) | A nanomaterial that enhances sensor sensitivity and surface area when combined with polymers like PANI [74]. | PANI/GO nanocomposite for high-precision malathion detection [74]. |
| Silver Nanoparticles (Ag NPs) | Metallic nanoparticles used to improve electrical conductivity and catalytic properties in nanohybrid sensors [74]. | PANI/Ag nanohybrid for cantilever functionalization [74]. |
| Acetylcholinesterase (AChE) Enzyme | A biological recognition element that is inhibited by organophosphorus pesticides, enabling selective biosensing [11]. | Electrochemical nanosensors for pesticide residue detection in food samples [11]. |
| Aptamers | Single-stranded DNA or RNA molecules that bind to specific targets; used as synthetic recognition elements in biosensors [11]. | Optical and electrochemical nanosensors for various agricultural contaminants [11]. |
| Molecularly Imprinted Polymers (MIPs) | Synthetic polymers with tailor-made cavities for specific molecules; serve as biomimetic recognition elements [11]. | Quartz crystal microbalance (QCM) sensors for pesticide detection [11]. |
The imperative for sustainable agricultural practices is driving the adoption of advanced monitoring technologies that optimize resource use and minimize environmental footprints. Within this context, nanosensors represent an emerging technological frontier, poised to complement or potentially supersede conventional agricultural sensors. This guide provides an objective comparison of these technologies, benchmarking their performance against critical sustainability metrics, including detection capabilities, resource efficiency, and long-term environmental impact. The analysis is framed for researchers and scientists seeking empirical data on how these sensing paradigms differ in principle, application, and ecological consequence. Performance is evaluated through published experimental data, focusing on quantifiable parameters such as sensitivity, specificity, and resource utilization during operation. By synthesizing current research, this guide aims to inform strategic decisions in the development and deployment of sensor technologies for precision agriculture.
Technology Comparison: Fundamental Principles and Capabilities
Understanding the fundamental differences between conventional and nano-enabled sensors is crucial for evaluating their respective applications and limitations.
Conventional agricultural sensors typically measure macro-level parameters such as soil moisture, temperature, humidity, and basic pH levels [80]. Their operation is generally based on electrical resistance, capacitance, or electrochemical principles, providing valuable but often broad-stroke data for field management.
Nanosensors, or nanobiosensors, incorporate nano-scale materials (1–100 nm) such as metallic nanoparticles, carbon nanotubes, and quantum dots to create a sensing interface [26] [62]. Their operation relies on a three-component system: a bioreceptor (e.g., enzyme, antibody, nucleic acid) for specific target recognition, a transducer that converts the biological interaction into a quantifiable signal, and a detector to process this signal [26]. The nano-scale properties of the materials—including enhanced optical, mechanical, and electrical characteristics—enable a more organized and efficient sensing structure compared to conventional counterparts [26].
Table 1: Fundamental Characteristics of Sensor Types
| Characteristic | Conventional Sensors | Nanosensors |
|---|---|---|
| Scale of Operation | Macro-scale (field-level) | Nano-scale (molecular level) |
| Typical Sensing Elements | Electrodes, capacitive plates, ion-selective membranes | Nanoparticles, carbon nanotubes, quantum dots |
| Biorecognition Element | Often absent; measures physical/chemical parameters | Essential component (antibodies, enzymes, aptamers) |
| Primary Signal Transduction | Electrical, capacitive, potentiometric | Optical, electrochemical, FRET-based |
| Key Differentiating Feature | Broad environmental monitoring | Specific molecular detection |
Performance Benchmarking: Quantitative Data Comparison
Direct performance comparison reveals significant differences in detection capabilities, particularly for specific molecular targets. The following tables summarize experimental data from published research.
Detection Capabilities for Agrochemicals and Pathogens
Nanosensors demonstrate a marked improvement in sensitivity, enabling the detection of analytes at dramatically lower concentrations, which is critical for early stress intervention and residue monitoring.
Table 2: Detection Performance for Agrochemicals and Pathogens
| Target Analyte | Sensor Type | Detection Mechanism | Reported Sensitivity | Source/Reference |
|---|---|---|---|---|
| Fenitrothion (Pesticide) | Nano TiO2/Nafion Composite | Electrochemical | 0.2 µM | [26] |
| Organophosphate Pesticides | Carbon Nanotube-based | Electrochemical | 0.145 ppb | [26] |
| Methyl parathion & chlorpyrifos | Carbon nanotubes w/ ssDNA | Enzymatic Reaction | 1 × 10⁻¹² M | [26] |
| R. solanacearum (Bacterium) | Au NPs w/ ssDNA | Colorimetry | 15 ng | [26] |
| P. stewartii | Au NPs | Electrochemical | 7.8 × 10³ cfu/ml | [26] |
| General Pesticide Residues | Conventional HPLC/MS | Laboratory Chromatography | Varies (requires lab processing) | [62] |
Resource Use and Operational Efficiency
The integration of sensing technology directly impacts agricultural resource application. Widespread adoption of precision technologies, including advanced sensors, has been shown to significantly reduce inputs.
Table 3: Environmental Impact of Precision Agriculture Technologies
| Environmental Parameter | Current Adoption Impact | Potential Impact with Full Adoption | Technology Drivers |
|---|---|---|---|
| Fertilizer Use Efficiency | 7% increase in placement efficiency | Additional 14% efficiency gain | Variable Rate Technology (VRT) [80] |
| Herbicide & Pesticide Use | 9% reduction | Additional 15% reduction (48M fewer lbs) | Auto-guidance, Machine section control [80] |
| Fossil Fuel Use | 6% reduction | Additional 16% reduction (100M gal saved) | Auto-guidance, Machine telematics [80] |
| Water Use | 4% reduction | Additional 21% reduction | Precision irrigation, soil sensors [80] |
| Crop Production | 4% increase | Additional 6% productivity gain | Synergy of multiple technologies [80] |
Experimental Protocols for Nanosensor Evaluation
To ensure the reliability and validity of performance data, researchers employ standardized experimental protocols. The following methodology outlines a standard procedure for characterizing electrochemical nanobiosensors, a common sensor type.
Protocol: Characterization of an Electrochemical Nanobiosensor for Analyte Detection
Objective: To evaluate the sensitivity, selectivity, and limit of detection (LOD) of a nanoparticle-based electrochemical biosensor for a specific analyte (e.g., a pesticide or plant hormone).
Materials & Reagents:
- Synthesized Nanosensor: e.g., Carbon nanotube or Gold nanoparticle conjugate with a specific bioreceptor (aptamer, antibody).
- Target Analyte: Purified standard of the molecule to be detected.
- Control Substances: Structurally similar molecules for selectivity testing.
- Buffer Solutions: Phosphate Buffered Saline (PBS) or other suitable buffer for the assay.
- Electrochemical Workstation: With a standard three-electrode setup (working, reference, counter electrode).
- Data Acquisition Software.
Procedure:
- Sensor Preparation: The nanosuspension is drop-casted onto the surface of the working electrode (e.g., Glassy Carbon Electrode) and allowed to dry, forming a uniform film.
- System Calibration: The electrochemical cell is assembled with the modified working electrode, placed in a buffer solution, and connected to the potentiostat.
- Analyte Introduction: Increasing concentrations of the target analyte are spiked into the buffer solution under stirring.
- Signal Measurement: After each addition, an electrochemical technique (e.g., Differential Pulse Voltammetry or Electrochemical Impedance Spectroscopy) is applied to measure the change in electrical signal (current or impedance).
- Data Analysis: The measured signal is plotted against the analyte concentration to generate a calibration curve. The Limit of Detection (LOD) is calculated using the formula 3σ/s, where σ is the standard deviation of the blank signal and s is the slope of the calibration curve.
- Selectivity Testing: The protocol is repeated with control substances to confirm the sensor's signal is specific to the target analyte.
Diagram 1: Sensor evaluation workflow.
Signaling Pathways and Detection Mechanisms
Nanosensors achieve high specificity through sophisticated molecular recognition and signal transduction pathways. A prominent mechanism, especially in optical sensors, is Förster Resonance Energy Transfer (FRET).
The FRET-Based Detection Pathway
FRET is a distance-dependent energy transfer process between two light-sensitive molecules (a donor chromophore and an acceptor chromophore). This mechanism is harnessed in nanosensor design for highly specific analyte detection [26].
Key Stages of the FRET Pathway:
- Bioreceptor-Analyte Binding: The target analyte binds to a specialized bioreceptor on the nanosensor. This binding event induces a conformational (shape) change in the sensor structure.
- Donor Excitation: The donor chromophore is excited by an external light source (e.g., a laser).
- Energy Transfer (ON/OFF State):
- Without Analyte (No FRET): Donor and acceptor chromophores are physically separated. The donor emits its characteristic fluorescence upon excitation.
- With Analyte (FRET ON): Analyte binding brings the donor and acceptor chromophores into close proximity. The excited donor transfers its energy to the acceptor, which then emits fluorescence at its own characteristic wavelength.
- Signal Output: The shift in the emitted fluorescence wavelength (from donor to acceptor) serves as the quantitative signal, confirming the presence and concentration of the analyte.
Diagram 2: FRET detection mechanism.
The Researcher's Toolkit: Essential Reagents and Materials
The development and deployment of advanced agricultural nanosensors rely on a specific set of reagents and materials. This toolkit is essential for constructing the sensing interface, transducing signals, and validating performance.
Table 4: Essential Research Reagent Solutions
| Reagent/Material | Function in Research & Development | Example Application |
|---|---|---|
| Gold Nanoparticles (Au NPs) | Signal amplification; colorimetric or electrochemical transduction. | Functionalized with ssDNA for pathogen detection [26]. |
| Carbon Nanotubes (CNTs) | Enhance electron transfer in electrochemical sensors; provide high surface area. | Detection of organophosphate pesticides [26]. |
| Quantum Dots (QDs) | Act as fluorescent donors in FRET-based sensors due to tunable emission. | Detection of Citrus Tristeza virus [26]. |
| Specific Bioreceptors (Aptamers) | Single-stranded DNA/RNA molecules that bind targets with high specificity. | Molecular recognition element for pesticides/hormones [62]. |
| Specific Bioreceptors (Antibodies) | Proteins that bind to a unique epitope of a target antigen. | Detection of specific plant pathogens [62]. |
| Enzymes (e.g., Urease) | Catalyze a reaction involving the target, producing a measurable product. | Used in biosensors for urea detection [26]. |
| Corona Phase Molecular Recognition (CoPhMoRe) | A technique to create synthetic polymer coronas on nanoparticles for recognizing specific molecules. | Enables real-time, non-invasive monitoring of plant hormones like IAA [36]. |
The empirical data demonstrates that nanosensors offer a paradigm shift in capability, moving from monitoring general environmental conditions to detecting specific molecular signals with high sensitivity and selectivity [26] [36] [62]. This enables a more targeted, proactive approach to crop management, which is a foundational principle for reducing the long-term environmental footprint of agriculture through optimized resource use [80].
The path forward for the field involves addressing scalability, cost, and environmental health and safety of nanomaterials. Future research must prioritize full life-cycle field studies to validate lab performance under real-world conditions [67], develop robust international certification standards for sensor data reliability [81], and create clear regulatory frameworks governing use. The integration of nanosensor data with Artificial Intelligence (AI) and advanced modeling presents a powerful opportunity to transition from descriptive monitoring to predictive, prescriptive agriculture, ultimately solidifying the role of advanced sensing in achieving global food security and environmental sustainability [33].
The global agricultural sector faces unprecedented challenges, including the need to enhance productivity for food security while minimizing environmental impacts such as greenhouse gas emissions [9]. In this context, sensor technologies have emerged as critical tools for enabling data-driven farming practices. While conventional agricultural sensors have established foundational capabilities for field monitoring, nanosensors represent a technological frontier with transformative potential for precision agriculture [27]. This comparison guide provides an objective benchmarking analysis of these competing technological approaches, evaluating their performance characteristics, implementation requirements, and readiness for addressing emerging agricultural challenges.
The maturation of sensor technologies must be assessed within the broader framework of Agriculture 4.0, which integrates data from multiple sources—including remote sensing, Unmanned Aerial Vehicles (UAVs), and autonomous machinery—to optimize agricultural production systems [82]. This evaluation employs rigorous experimental protocols and standardized performance metrics to establish a comprehensive maturity assessment, providing researchers and agricultural professionals with evidence-based guidance for technology selection and development prioritization.
Fundamental Operating Principles
Conventional agricultural sensors typically comprise macro-scale components that measure physical and chemical parameters through established electrochemical, optical, or mechanical principles. These systems form the technological backbone of traditional precision agriculture, providing monitoring capabilities for soil moisture, temperature, pH, and basic nutrient levels [82]. Their operation generally depends on direct contact with environmental matrices, with signal transduction occurring through measurable changes in electrical conductivity, spectral characteristics, or mechanical properties.
Nanosensors leverage the unique physicochemical properties of nanomaterials (1-100 nm) to achieve enhanced performance characteristics [11] [27]. These systems utilize nanomaterials such as quantum dots, carbon nanotubes, nanowires, and metallic nanoparticles, which exhibit high surface area-to-volume ratios and quantum confinement effects that significantly improve sensitivity and detection limits [22]. Nanosensors typically employ sophisticated recognition elements including enzymes, antibodies, aptamers, and molecularly imprinted polymers (MIPs) that enable selective interaction with target analytes at molecular levels [11].
Performance Benchmarking: Quantitative Comparative Analysis
Table 1: Performance Characteristics of Conventional Sensors vs. Nanosensors
| Performance Parameter | Conventional Sensors | Nanosensors | Measurement Protocol |
|---|---|---|---|
| Detection Sensitivity | Moderate (ppm-ppb) | High (ppb-ppt) | Standard calibration with spiked samples; LOD calculation via 3σ/slope method |
| Selectivity | Limited cross-reactivity | High specificity | Comparative response to target vs. interferents in mixed solutions |
| Response Time | Minutes to hours | Seconds to minutes | Time from sample introduction to 90% signal stabilization |
| Multiplexing Capability | Limited | Moderate to high | Simultaneous detection of multiple analytes in single assay |
| Field-Deployability | High | Moderate | Required infrastructure for operation in agricultural settings |
| Operational Lifetime | Long (years) | Moderate (months) | Duration until 20% performance degradation under field conditions |
| Cost per Unit | Low to moderate | High | Manufacturing complexity and specialized materials |
Table 2: Application-Specific Performance Benchmarking
| Agricultural Application | Conventional Sensor Performance | Nanosensor Performance | Experimental Validation Method |
|---|---|---|---|
| Pesticide Detection | Chromatography methods: High accuracy but lab-dependent [11] | Electrochemical nanosensors: LOD 0.08 mg/L for malathion in 10 min [11] | Spiked recovery experiments in food matrices; correlation with GC-MS |
| Pathogen Monitoring | Culture-based methods: 24-48 hour detection | Nano-biosensors: Rapid detection of E. coli and Salmonella [83] | Artificial contamination with serial dilutions; comparison with plate counting |
| Soil Nutrient Analysis | Laboratory spectroscopy: High accuracy with processing delay | Real-time monitoring capabilities under development [27] | Parallel analysis with standard soil testing protocols |
| Environmental Parameters | Robust field monitoring (temp, moisture, pH) [82] | Enhanced spatial resolution for microvariations | Grid-based sampling with statistical analysis of spatial variance |
Experimental Protocols for Technology Assessment
Benchmarking Methodology for Detection Capabilities
Objective: Quantitatively compare the analytical performance of conventional sensors and nanosensors for pesticide detection in agricultural products.
Materials and Reagents:
- Standard pesticide solutions (organophosphates, carbamates, neonicotinoids)
- Agricultural product samples (lettuce, apples, grapes)
- Phosphate buffer saline (PBS, 0.1 M, pH 7.4)
- Acetylcholinesterase (AChE) enzyme solution
- Acetylthiocholine (ATCh) substrate
- 5,5'-dithio-bis-(2-nitrobenzoic acid) (DTNB)
- Nanosensor platforms (electrochemical, optical)
- Conventional chromatography systems (HPLC, GC-MS)
- Sample homogenizer and centrifuge
Procedure:
- Prepare standardized pesticide solutions across concentration range (0.001-100 mg/L)
- Spike agricultural samples with known pesticide concentrations
- Extract pesticides using QuEChERS method (AOAC Official Method 2007.01)
- Analyze extracts using:
- Conventional method: HPLC with UV detection
- Nanosensor method: Electrochemical acetylcholinesterase inhibition assay
- For nanosensor analysis:
- Incubate AChE with sample extract for 10 minutes at 25°C
- Add ATCh and DTNB, monitor absorbance at 412 nm
- Calculate inhibition percentage relative to pesticide-free control
- Generate calibration curves for both methods
- Calculate recovery rates, detection limits, and precision metrics
Validation:
- Perform parallel analysis with reference method (GC-MS)
- Statistical analysis via regression correlation and ANOVA
- Determine accuracy (85-115% recovery), precision (<15% RSD), and detection limits
Field Performance Assessment Protocol
Objective: Evaluate operational performance under realistic agricultural conditions.
Experimental Design:
- Establish monitoring grids in representative agricultural plots
- Deploy conventional sensor networks and nanosensor arrays in parallel
- Monitor environmental parameters (soil moisture, temperature, nutrients) over 60-day period
- Introduce controlled challenges (simulated contamination events, nutrient amendments)
- Measure response characteristics, reliability, and maintenance requirements
- Correlate sensor data with crop health indicators (NDVI, yield metrics)
Table 3: Research Reagent Solutions for Agricultural Sensor Evaluation
| Research Reagent | Function | Application Context |
|---|---|---|
| Acetylcholinesterase (AChE) | Enzyme inhibition-based detection of organophosphates | Nanosensor recognition element for pesticide detection [11] |
| Molecularly Imprinted Polymers (MIPs) | Synthetic recognition elements for specific analytes | Nanosensor component for selective pesticide binding [11] |
| Quantum Dots (CdTe) | Fluorescent nanomaterials for optical sensing | Signal transduction in fluorescence-based nanosensors [11] |
| Antibodies (IgG) | Biological recognition elements for pathogens | Immunosensors for detection of foodborne pathogens [83] |
| Carbon Nanotubes | Nanomaterial for electrode modification | Electrochemical sensing platforms for various analytes [27] |
| Standard Pesticide Mixtures | Analytical standards for method validation | Calibration and recovery studies for both sensor types [11] |
Technological Readiness and Implementation Analysis
Current Market Penetration and Adoption Trends
The global nanosensors market demonstrates robust growth potential, valued at approximately USD 901.78 million in 2025 and projected to reach USD 1,838.11 million by 2034, reflecting a compound annual growth rate (CAGR) of 8.25% [22]. This expansion is primarily driven by healthcare applications, with agricultural implementations representing an emerging segment. Conventional sensors maintain dominant market share in agricultural applications due to their established reliability, lower implementation costs, and proven operational history in challenging field conditions.
Regional adoption patterns reveal significant variation, with North America capturing approximately 38.8% of the nanosensors market share by 2035, while the Asia-Pacific region demonstrates the most rapid growth (CAGR of 9.32%) [54] [22]. This geographical distribution reflects broader trends in technological infrastructure investment, regulatory frameworks, and agricultural modernization initiatives.
Integration Challenges and Infrastructure Requirements
Conventional sensors benefit from established integration pathways with farm management systems, compatibility with existing agricultural machinery, and straightforward data interpretation protocols [82]. Their implementation typically requires minimal specialized training and leverages ubiquitous connectivity solutions.
Nanosensors present more substantial integration challenges, including requirements for specialized readout equipment, complex data interpretation algorithms, and sophisticated calibration protocols [11] [27]. The successful deployment of nanosensor networks often depends on complementary technologies including Internet of Things (IoT) platforms, edge computing resources, and advanced data fusion techniques that combine multiple information streams [82].
The following workflow diagram illustrates the integrated data fusion approach required for implementing advanced sensor systems in Agriculture 4.0:
Integrated Data Fusion Workflow for Agriculture 4.0
Emerging Applications and Future Development Trajectories
Specialized Detection Capabilities
Nanosensors demonstrate particular promise in applications requiring exceptional sensitivity and specificity. Recent research advances include:
- Pesticide residue detection with limits of detection reaching 0.38 pM for organophosphates in apples using fluorescent quantum dot aerogel sensors [11]
- Pathogen monitoring systems capable of detecting foodborne pathogens like E. coli and Salmonella with enhanced sensitivity compared to conventional methods [83]
- Real-time soil nutrient analysis enabling precision fertilization strategies beyond the capabilities of conventional soil sensors [27]
Conventional sensors maintain advantages in continuous environmental monitoring applications, including long-term soil moisture tracking, temperature profiling, and basic water quality assessment, where extreme sensitivity is not required but reliability and operational longevity are paramount [82].
Research Frontiers and Development Priorities
The benchmarking analysis reveals several critical research priorities for advancing agricultural sensor technologies:
Nanosensor Development Priorities:
- Enhancement of field-deployable platforms and reduction of operational complexity
- Improvement of stability and operational lifetime in challenging environmental conditions
- Development of multiplexed detection platforms for simultaneous monitoring of multiple parameters
- Integration with autonomous systems and decision-support platforms
Conventional Sensor Advancement Areas:
- Miniaturization and power efficiency improvements for dense deployment
- Enhanced connectivity options for remote agricultural settings
- Improved selectivity through advanced sensing materials
- Cost reduction for large-scale implementation
The following diagram illustrates the fundamental operating mechanism of enzyme-based nanosensors for pesticide detection, demonstrating the molecular-level interactions that enable their enhanced sensitivity:
Enzyme-Based Nanosensor Mechanism
Based on comprehensive performance benchmarking and technology readiness assessment, strategic implementation recommendations emerge for different agricultural applications:
For established farming operations with limited technical infrastructure, conventional sensors provide immediately accessible capabilities for environmental monitoring and basic precision agriculture implementation. Their reliability, straightforward operation, and lower capital requirements make them appropriate for initial digital agriculture adoption.
For high-value specialty crops or situations requiring precise contaminant detection, nanosensors offer compelling advantages despite their higher complexity and cost. Applications including pesticide residue verification, pathogen monitoring, and premium product certification justify the additional investment in nanosensor technologies.
For research institutions and agricultural technology developers, investment in nanosensor platforms is warranted to build capability in emerging detection methodologies. The rapidly advancing state of nanomaterial-based sensing suggests growing importance in future agricultural management systems.
The most robust approach for comprehensive agricultural management involves strategic integration of both conventional and nanosensing technologies, leveraging the strengths of each approach while mitigating their respective limitations. This hybrid implementation strategy provides both immediate operational capabilities and advanced detection functionalities, creating a pathway for incremental technology adoption aligned with evolving agricultural challenges.
Conclusion
The benchmarking analysis confirms that while conventional sensors offer proven reliability and lower entry costs for broad monitoring, nanosensors represent a paradigm shift in capability, offering unprecedented sensitivity, miniaturization, and potential for real-time, multiplexed analysis. The synergy between nanosensors and AI is particularly transformative, accelerating sensor design, optimization, and diagnostic precision. For the research community, the immediate future lies in developing robust, field-ready nanosensor systems that overcome current cost and complexity barriers. Future efforts should focus on interdisciplinary collaboration to material science and data analytics, paving the way for hyper-precise, sustainable, and resilient agricultural systems capable of meeting the demands of a growing population under climate change pressures.
References
- 1. Recent Advances in Agricultural Sensors [https://www.mdpi.com/2227-9040/13/11/399]
- 2. Agricultural Sensor Market - Size, Share & Industry Analysis [https://www.mordorintelligence.com/industry-reports/agricultural-sensors-market]
- 3. 7 Smart Agriculture Sensors to Boost Crop Yields [https://farmonaut.com/precision-farming/7-smart-agriculture-sensors-that-skyrocket-crop-yields]
- 4. Research Advances in Nanosensor for Pesticide Detection ... [https://www.mdpi.com/2079-4991/15/14/1132]
- 5. pH sensing and imaging in living cells based on ... [https://www.sciencedirect.com/science/article/abs/pii/S095656632500898X]
- 6. Recent Developments in Nanosensors for Imaging ... [https://pmc.ncbi.nlm.nih.gov/articles/PMC6958676/]
- 7. Recommendations for benchmarking pre-clinical studies of ... [https://pmc.ncbi.nlm.nih.gov/articles/PMC4592474/]
- 8. Artificial Intelligence-Assisted Nanosensors for Clinical ... [https://www.mdpi.com/2079-6374/15/10/656]
- 9. Nanotechnology in agriculture: Innovations for ... [https://www.sciencedirect.com/science/article/pii/S004896972501705X]
- 10. Prospects and challenges of sensor materials [https://www.sciencedirect.com/science/article/pii/S2772671124000780]
- 11. Research Advances in Nanosensor for Pesticide Detection in ... [https://pmc.ncbi.nlm.nih.gov/articles/PMC12298915/]
- 12. Design Principles of Nanosensors for Multiplex Detection of ... [https://pmc.ncbi.nlm.nih.gov/articles/PMC12232259/]
- 13. Soil Health Nano-Sensors Market [https://www.futuremarketinsights.com/reports/soil-health-nano-sensors-market]
- 14. A rational study of transduction mechanisms of different ... [https://www.nature.com/articles/s41598-024-55729-8]
- 15. Agricultural Nanotechnology Market Share & Forecast ... [https://www.coherentmarketinsights.com/industry-reports/agricultural-nanotechnology-market]
- 16. Agricultural Nanotechnology Market | Size, Share, Growth [https://virtuemarketresearch.com/report/agricultural-nanotechnology-market]
- 17. Nanosensors for detecting nutrient losses from soil (as ... [https://www.sciencedirect.com/science/article/abs/pii/B978012824554500015X]
- 18. Precision Agriculture Data Analysis: Top 2025 Trends [https://farmonaut.com/precision-farming/precision-agriculture-data-analysis-top-2025-trends]
- 19. Approaches for Assessment of Soil Moisture with ... [https://www.mdpi.com/2073-4441/17/16/2388]
- 20. Top Smart Sensors Revolutionizing Modern Farming [https://sensorex.com/best-smart-sensors-for-farming-top-picks-for-2025/?srsltid=AfmBOorGE7sU1aVvgSGW2lpCRUW1mT9s20ZhfQuYIjTuL23klHbwB436]
- 21. Nanotechnology in Irrigation Systems: Enhancing Water ... [https://link.springer.com/rwe/10.1007/978-981-96-4489-6_37-1]
- 22. Nanosensors Market Size to Surge USD 1838.11 Mn by 2034 [https://www.precedenceresearch.com/nanosensors-market]
- 23. Microfluidics and nanosensors for the detection of ... [https://www.sciencedirect.com/science/article/abs/pii/S0026265X25033120]
- 24. Agricultural Nanotechnology Market Size, Share & Forecast [https://www.verifiedmarketresearch.com/product/agricultural-nanotechnology-market/]
- 25. Nanomaterial-based biosensors: a new frontier in plant ... [https://www.frontiersin.org/journals/bioengineering-and-biotechnology/articles/10.3389/fbioe.2025.1570318/full]
- 26. Nanobiosensors and nanoformulations in agriculture: new advances and challenges for sustainable agriculture - PMC [https://pmc.ncbi.nlm.nih.gov/articles/PMC10754331/]
- 27. Nanosensors in Agricultural Applications: An Overview | SpringerLink [https://link.springer.com/rwe/10.1007/978-981-96-4489-6_20-1]
- 28. Nanosensors and nanobiosensors for sustainable agriculture - ScienceDirect [https://www.sciencedirect.com/science/article/abs/pii/B9780323994460000143]
- 29. Best pH Probes For Hydroponics in 2025 [https://atlas-scientific.com/blog/best-ph-probes-for-hydroponics/?srsltid=AfmBOorjI3Ual2Wz0K4OfHBqlwA1UTesKoYXZGyqDLqEmB2KH6OYdw9g]
- 30. Best pH Probe for Testing Soil in 2025 [https://atlas-scientific.com/blog/best-ph-probe-for-soil/?srsltid=AfmBOoosEPM1B2Y56nG9y5YJNS7Tobn8uwGrEpceMy4xd_5bmC_HAfkG]
- 31. Advancements in nanomaterials for nanosensors [https://pmc.ncbi.nlm.nih.gov/articles/PMC11304082/]
- 32. Best 5 Soil pH Meters of 2025: Unlock Your Garden's Potential ... [https://www.pickexpertchoice.com/best/best-5-soil-ph-meters-of-2025-unlock-your-gardens-potential-with-precision-testing/]
- 33. Smart and sustainable nano-biosensing technologies for ... [https://www.sciencedirect.com/science/article/pii/S0926669025002596]
- 34. Recent advances in nanoporous NO x gas sensors [https://pubs.rsc.org/en/content/articlehtml/2025/nr/d5nr01757b?page=search]
- 35. AI‑driven photonic noses: from conventional sensors to ... [https://www.nature.com/articles/s41378-025-01058-3]
- 36. Nanosensor helps farmers monitor total plant health in real ... [https://www.agtechnavigator.com/Article/2025/06/17/nanosensor-helps-farmers-monitor-total-plant-health-in-real-time/]
- 37. Ultimate Guide to Spectral Data for Plant Disease Detection [https://anvil.so/post/ultimate-guide-to-spectral-data-for-plant-disease-detection]
- 38. Hyperspectral Imaging In Agriculture Market: 2025 Advances [https://farmonaut.com/remote-sensing/hyperspectral-imaging-in-agriculture-market-2025-advances]
- 39. Nanosensors in healthcare: transforming real-time monitoring ... [https://pubs.rsc.org/en/content/articlehtml/2025/pm/d5pm00125k]
- 40. Plant diseases classification with Spectral Signature ... [https://www.sciencedirect.com/science/article/pii/S2665963825000041]
- 41. Review Wearable plant sensing devices for health monitoring [https://www.sciencedirect.com/science/article/pii/S2950235725000101]
- 42. Potential applications of quantum sensors in agriculture [https://www.sciencedirect.com/science/article/pii/S0168169925005265]
- 43. AI and IOT - What is Their Relationship and How Do They ... [https://www.totalphase.com/blog/2023/12/ai-and-iot-what-is-their-relationship-and-how-do-they-work-together/?srsltid=AfmBOoqt_BvvKhmCy2oAGxwKrkiZrHVPzdZAjzw7c9mfLWA9NjX1Is63]
- 44. AI and IoT: How do the internet of things and AI work ... [https://www.techtarget.com/iotagenda/tip/AI-and-IoT-How-do-the-internet-of-things-and-AI-work-together]
- 45. Making Decisions from Live Sensor Data [https://medium.com/data-science/making-decisions-from-live-sensor-data-1febf8db9464]
- 46. Most Innovative IoT Platforms for Real‑Time... Analytics [https://www.analyticsinsight.net/tech-news/most-innovative-iot-analytics-platforms-for-realtime-decisionmaking-in-2025]
- 47. Navigating Sensor Data Analytics | Expert Guide [https://blog.attuneiot.com/navigating-sensor-data-analytics-expert-guide]
- 48. Marketing Strategies in Nanomaterials for Sensor Applications [https://pmc.ncbi.nlm.nih.gov/articles/PMC12065100/]
- 49. Nanosensors Market Expected to Reach ... [https://www.alliedmarketresearch.com/press-release/nanosensors-market.html]
- 50. Nanosensors Market Forecast by Size, Share Growth ... [https://www.theinsightpartners.com/reports/nanosensors-market]
- 51. Nanosensors Market | Global Market Analysis Report - 2035 [https://www.futuremarketinsights.com/reports/nanosensors-market]
- 52. Rapid discovery and evolution of nanosensors containing ... [https://www.nature.com/articles/s41467-024-50956-z]
- 53. Skill Needs & Gaps in the Agricultural Industry [https://www.equipmentdealermagazine.com/skill-needs-gaps-in-the-agricultural-industry/]
- 54. Nanosensors Market Size, Growth & Industry Forecast 2035 [https://www.researchnester.com/reports/nanosensors-market/3083]
- 55. Nanosensors Market Global Industry Landscape Analysis ... [https://www.linkedin.com/pulse/nanosensors-market-global-industry-landscape-analysis-2025-haduf]
- 56. Precision Agriculture 2025: Key Strategies & Trends [https://www.omdena.com/blog/precision-agriculture-2025-key-strategies-trends]
- 57. HR Farming & Agriculture HR: Top Workforce Trends 2025 [https://farmonaut.com/blogs/hr-farming-agriculture-hr-top-workforce-trends-2025]
- 58. The Most Pressing Agriculture Issues For Farmers In 2025 [https://agtech.folio3.com/blogs/top-agriculture-issues-for-farmers-in-2024/]
- 59. Frontiers | New horizons in smart plant sensors : key technologies... [https://www.frontiersin.org/journals/plant-science/articles/10.3389/fpls.2024.1490801/full]
- 60. Designing and field calibration of low-cost microcontroller ... [https://www.nature.com/articles/s41598-024-81288-z]
- 61. Soil Moisture Sensor Calibration For Accurate Agricultural ... [https://yakeclimate.com/soil-moisture-sensor-calibration-for-accurate-agricultural-practices/]
- 62. A Review on Biosensors and Nanosensors Application in... [https://pmc.ncbi.nlm.nih.gov/articles/PMC8405745/]
- 63. Emerging nanosensor technologies for the rapid detection of heavy... [https://pubs.rsc.org/en/Content/ArticleLanding/2025/AY/D5AY01248A]
- 64. Advances in wearable nanomaterial-based sensors for ... [https://www.sciencedirect.com/science/article/abs/pii/S221334372500483X]
- 65. An Insight into the Disease Prognostic Potentials of ... [https://www.mdpi.com/2304-6740/13/8/259]
- 66. Nanotechnology and Agricultural Sustainability: A Review [https://www.mdpi.com/2079-4991/15/23/1755]
- 67. Nanotechnology based precision agriculture for alleviating ... [https://www.sciencedirect.com/science/article/pii/S2667064X23001069]
- 68. An online tool based on the Internet of Things and ... [https://www.nature.com/articles/s41598-025-13231-9]
- 69. Advancements in Agricultural Nanotechnology [https://pmc.ncbi.nlm.nih.gov/articles/PMC12473408/]
- 70. Advantages And Disadvantages Of Precision Agriculture ... [https://farmonaut.com/precision-farming/advantages-and-disadvantages-of-precision-agriculture-2025]
- 71. Data Security and Farmer Privacy in Digital Agriculture [https://prism.sustainability-directory.com/scenario/data-security-and-farmer-privacy-in-digital-agriculture/]
- 72. Privacy and data ownership in the age of Artificial Intelligence [https://www.connecterra.ai/blog/privacy-and-data-ownership-in-the-age-of-artificial-intelligence]
- 73. Artificial Intelligence-Assisted Nanosensors for Clinical ... [https://pmc.ncbi.nlm.nih.gov/articles/PMC12564406/]
- 74. Characterization and performance of gas nanosensors for ... [https://www.sciencedirect.com/science/article/abs/pii/S0026265X25032643]
- 75. Smart Agriculture: 2025 Best Practices [https://www.psa.inc/company/news/smart-agriculture-is-gaining-momentum-unlocking-opportunities-in-2025/]
- 76. Integration of smart sensors and IOT in precision agriculture [https://www.frontiersin.org/journals/plant-science/articles/10.3389/fpls.2025.1587869/full]
- 77. Precision Agriculture Scalability Challenges → Scenario [https://prism.sustainability-directory.com/scenario/precision-agriculture-scalability-challenges/]
- 78. Integrating artificial intelligence and Internet of Things (IoT) ... [https://www.sciencedirect.com/science/article/pii/S2666351124000147]
- 79. AI Use Cases In Agriculture: 7 Powerful Innovations For 2025 [https://farmonaut.com/precision-farming/ai-use-cases-in-agriculture-7-powerful-innovations-for-2025]
- 80. The Environmental Benefits of Precision Agriculture ... [https://www.aem.org/news/the-environmental-benefits-of-precision-agriculture-quantified]
- 81. Certifications For Farm Environmental Sensors: 2025 Trends [https://farmonaut.com/precision-farming/certifications-for-farm-environmental-sensors-2025-trends]
- 82. Experimenting Agriculture 4.0 with Sensors: A Data Fusion ... [https://www.mdpi.com/1424-8220/22/20/7910]
- 83. Emerging trends in nano-sensors: A new frontier in food ... [https://www.sciencedirect.com/science/article/pii/S240584402417212X]