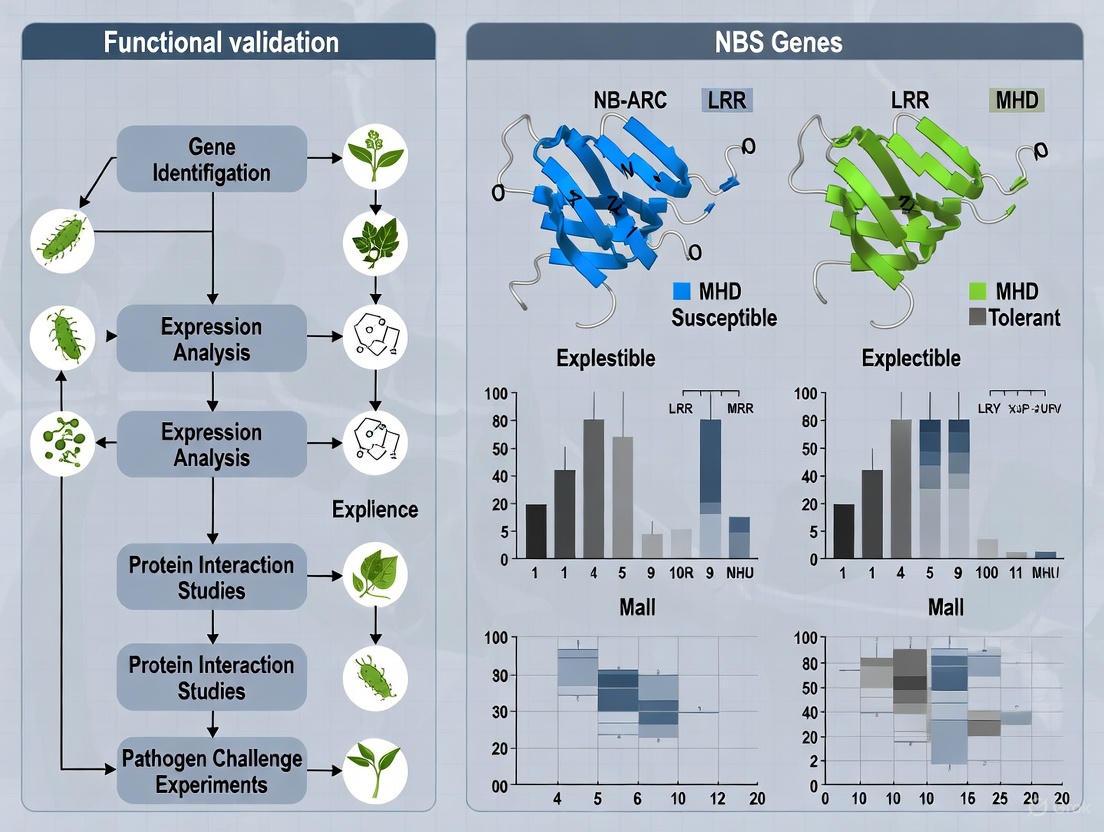
Functional Validation of NBS-LRR Genes: Decoding Disease Resistance Mechanisms in Susceptible vs. Tolerant Cultivars
This article provides a comprehensive resource for researchers and scientists on the strategies for identifying and functionally validating Nucleotide-Binding Site Leucine-Rich Repeat (NBS-LRR) genes, the largest class of plant disease...
Functional Validation of NBS-LRR Genes: Decoding Disease Resistance Mechanisms in Susceptible vs. Tolerant Cultivars
Abstract
This article provides a comprehensive resource for researchers and scientists on the strategies for identifying and functionally validating Nucleotide-Binding Site Leucine-Rich Repeat (NBS-LRR) genes, the largest class of plant disease resistance (R) genes. We synthesize contemporary methodologies—from genome-wide comparative genomics and transcriptomic profiling to machine learning and virus-induced gene silencing (VIGS)—for pinpointing key NBS genes governing resistance in tolerant cultivars. A dedicated focus on troubleshooting common challenges in validation and a framework for comparative analysis of genetic architecture between susceptible and tolerant genotypes offers a practical guide for advancing crop improvement programs. The insights herein aim to bridge the gap between genetic discovery and the development of durable, disease-resistant crops.
Cataloging the Defenders: Genome-Wide Discovery and Evolutionary Analysis of NBS-LRR Genes
Plants employ a sophisticated two-tiered immune system to defend against pathogen invasion. The first layer, Pattern-Triggered Immunity (PTI), is initiated when cell surface-localized receptors recognize conserved pathogen-associated molecular patterns (PAMPs). The second layer, Effector-Triggered Immunity (ETI), is mediated by intracellular resistance (R) proteins that detect specific pathogen effector proteins, triggering a stronger immune response often accompanied by a hypersensitive response (HR) and programmed cell death to restrict pathogen spread [1] [2]. Among the most important R genes are the nucleotide-binding site leucine-rich repeat (NBS-LRR) genes, which constitute the largest class of plant resistance proteins and are estimated to account for approximately 60% of characterized disease resistance genes in plants [3] [4]. Also known as NLRs, these proteins function as intracellular immune receptors that recognize pathogen-secreted effectors either directly or indirectly, activating robust defense signaling cascades [1] [4]. The NBS-LRR gene family has undergone significant expansion throughout plant evolution, with hundreds of members present in many angiosperm genomes, reflecting their crucial role in plant-pathogen co-evolution [5] [6].
Protein Architecture and Structural Classification
NBS-LRR proteins exhibit a characteristic tripartite domain architecture that defines their functional mechanisms. The central nucleotide-binding site (NBS) domain (also referred to as the NB-ARC domain) contains several highly conserved and strictly ordered motifs that function as a molecular switch, regulated by adenosine diphosphate (ADP) and adenosine triphosphate (ATP) binding and hydrolysis [5] [7]. The C-terminal leucine-rich repeat (LRR) domain is highly variable and adaptable, primarily responsible for pathogen recognition through protein-protein interactions [5] [3]. The N-terminal domain is variable and serves as the primary basis for classifying NBS-LRR genes into distinct subfamilies [5] [1].
Table 1: Major NBS-LRR Protein Subfamilies and Characteristics
| Subfamily | N-Terminal Domain | Key Functional Role | Downstream Signaling | Taxonomic Distribution |
|---|---|---|---|---|
| TNL (TIR-NBS-LRR) | Toll/Interleukin-1 Receptor (TIR) | Pathogen recognition; triggers defense responses | EDS1-dependent; produces cyclic nucleotide monophosphates | Primarily dicots; absent in most monocots [1] |
| CNL (CC-NBS-LRR) | Coiled-Coil (CC) | Pathogen recognition; triggers defense responses | Oligomerizes to form calcium-permeable channels | All angiosperms [1] [6] |
| RNL (RPW8-NBS-LRR) | Resistance to Powdery Mildew 8 (RPW8) | Signal transduction from TNL/CNL proteins | Forms calcium-permeable channels with EDS1-family proteins | All angiosperms (helper NLRs) [5] [2] |
In addition to these three main classes, NBS-LRR genes can be further categorized based on domain combinations, including truncated forms that lack complete domains. These "irregular" types include TN (TIR-NBS), CN (CC-NBS), NL (NBS-LRR), and N (NBS-only) proteins, which may function as adaptors or regulators for typical NBS-LRR proteins [8] [9].
The following diagram illustrates the structural organization and activation mechanism of NBS-LRR proteins:
Diagram 1: NBS-LRR Protein Activation Mechanism. The diagram illustrates the conformational changes from inactive ADP-bound states to active ATP-bound states following pathogen recognition, triggering distinct downstream signaling pathways based on N-terminal domains.
Genomic Distribution and Evolutionary Patterns
NBS-LRR genes represent one of the largest and most dynamic gene families in plants, with significant variation in gene number across species. Genomic analyses have identified 12,820 NBS-domain-containing genes across 34 plant species ranging from mosses to monocots and dicots, classified into 168 distinct domain architecture classes [6]. This remarkable diversity arises from frequent gene duplication and loss events, recombination between paralogs, and high substitution rates [5].
Table 2: Comparative Analysis of NBS-LRR Gene Family Size Across Plant Species
| Plant Species | Family | Total NBS-LRR Genes | CNL | TNL | RNL | Notable Evolutionary Pattern |
|---|---|---|---|---|---|---|
| Arabidopsis thaliana | Brassicaceae | 207 | ~70% | ~30% | Minor | Reference genome [1] |
| Oryza sativa (rice) | Poaceae | 505 | Majority | 0 | Minor | Complete loss of TNL subfamily [7] [1] |
| Nicotiana benthamiana | Solanaceae | 156 | 25 CNL, 47 CN | 5 TNL, 2 TN | 4 with RPW8 | Model for plant-pathogen interactions [8] [9] |
| Saccharum spp. (sugarcane) | Poaceae | Not specified | Majority | 0 | Minor | WGD major contributor to expansion [7] |
| Salvia miltiorrhiza | Lamiaceae | 196 | 61 CNL | 2 TNL | 1 RNL | Marked reduction in TNL/RNL [1] |
| Triticum aestivum (wheat) | Poaceae | 460-2151 | Majority | 0 | Minor | Large variation between studies [3] [4] [6] |
| 12 Rosaceae species | Rosaceae | 2188 (total) | 69 ancestral CNL | 26 ancestral TNL | 7 ancestral RNL | Diverse lineage-specific patterns [5] |
Evolutionary studies across multiple plant families reveal that NBS-LRR genes exhibit dynamic and distinct evolutionary patterns. In the Rosaceae family, different evolutionary trajectories have been observed: Rubus occidentalis, Potentilla micrantha, and Fragaria iinumae display a "first expansion and then contraction" pattern; Rosa chinensis exhibits "continuous expansion"; F. vesca shows "expansion followed by contraction, then further expansion"; while three Prunus species and three Maleae species share an "early sharp expanding to abrupt shrinking" pattern [5]. These diverse evolutionary patterns reflect the continuous arms race between plants and their pathogens, with lineage-specific adaptations shaping the NBS-LRR repertoire in different plant families.
Whole genome duplication (WGD), segmental duplication, and tandem duplication have been identified as major drivers of NBS-LRR gene expansion. Research in Nicotiana species revealed that whole-genome duplication contributed significantly to the expansion of NBS gene families, with the allotetraploid N. tabacum containing approximately the combined total of NBS genes from its parental species [3]. Similarly, in sugarcane, whole genome duplication is likely the main cause of the substantial number of NBS-LRR genes [7].
Functional Mechanisms and Signaling Pathways
NBS-LRR proteins function as sophisticated molecular switches in plant immunity. In the absence of pathogens, these proteins maintain an auto-inhibited, ADP-bound state. Upon pathogen recognition, conformational changes occur, leading to nucleotide exchange (ADP to ATP) and activation of downstream signaling [8] [2].
TNL proteins recognize pathogen effectors through their LRR domains, leading to TIR domain-mediated production of specialized nucleotide second messengers. These molecules activate EDS1 (Enhanced Disease Susceptibility 1)-family proteins, which in turn trigger helper NLRs—NRG1 (N Requirement Gene 1) and ADR1 (Activated Disease Resistance 1)—to form calcium-permeable channels that initiate defense signaling [2]. In contrast, CNL proteins often oligomerize upon activation to form funnel-shaped complexes that directly create calcium-permeable channels in the plasma membrane, initiating downstream immune responses [2].
The following diagram illustrates the distinct signaling pathways activated by different NBS-LRR subfamilies:
Diagram 2: NBS-LRR Signaling Pathways in Plant Immunity. The diagram illustrates the distinct signaling cascades triggered by TNL and CNL proteins following pathogen recognition, converging on calcium influx and defense activation.
Functional studies have demonstrated the critical role of NBS-LRR genes in disease resistance across numerous plant species. For example:
- The Arabidopsis thaliana TNL gene RPS4 confers specific resistance to bacterial pathogens in an EDS1-dependent manner [5]
- The cotton CNL gene GbCNL130 confers resistance to verticillium wilt across different hosts [5]
- The wheat CNL gene Pm21 confers broad-spectrum resistance to powdery mildew disease [5]
- The rice CNL gene Pi64 confers high-level and broad-spectrum resistance to leaf and neck blast [5]
- The tobacco N gene, encoding a TNL protein, provides resistance to tobacco mosaic virus [8] [9]
Recent research has revealed that helper NLRs, particularly from the RNL subfamily, are essential for signaling from multiple sensor NLRs. This discovery has enabled the interfamily transfer of sensor and helper NLR pairs, overcoming previous limitations in deploying resistance genes across taxonomic boundaries [2].
Experimental Approaches for NBS-LRR Gene Identification and Validation
Genome-Wide Identification and Bioinformatics Pipelines
The identification and characterization of NBS-LRR genes have been revolutionized by computational biology approaches. Standard protocols typically involve:
Identification Workflow:
- HMMER searches using the NB-ARC domain (PF00931) from the Pfam database with expectation values (E-values < 1*10⁻²⁰) [3] [8] [9]
- Domain validation using Pfam, SMART, and NCBI Conserved Domain Database (CDD) to confirm NBS domain presence [5] [8]
- N-terminal domain classification using InterProScan, Pfam, and CDD to identify TIR (PF01582), CC, and RPW8 (PF05659) domains [5] [1]
- Motif analysis using MEME suite to identify conserved motifs with default parameters [5] [8]
Phylogenetic Analysis:
- Multiple sequence alignment using MUSCLE, MAFFT, or ClustalW with default parameters [3] [8]
- Phylogenetic tree construction using Maximum Likelihood methods in MEGA or IQ-TREE with bootstrap testing (1000 replicates) [5] [8] [9]
- Orthogroup analysis using OrthoFinder with DIAMOND for sequence similarity searches and MCL for clustering [6]
Functional Validation Methods
Functional characterization of NBS-LRR genes employs multiple experimental approaches:
Expression Analysis:
- RNA-seq of infected vs. control tissues with differential expression analysis using DESeq2 (threshold: log₂ fold change >1, adjusted p-value ≤0.05) [7] [10]
- qRT-PCR validation of candidate genes in resistant and susceptible genotypes under pathogen challenge [10]
- Promoter analysis using PlantCARE to identify cis-regulatory elements related to stress responses [8] [9]
Functional Tests:
- Virus-Induced Gene Silencing (VIGS) to knock down candidate NBS-LRR genes and assess loss of resistance [6]
- Heterologous expression in model systems to validate function across species boundaries [3] [2]
- Protein-protein interaction studies through yeast two-hybrid or co-immunoprecipitation [6]
Table 3: Key Experimental Resources for NBS-LRR Research
| Research Tool | Specific Application | Protocol Details | Key References |
|---|---|---|---|
| HMMER v3.1b2 | Identification of NBS domains | HMM search with PF00931, E-value <1*10⁻²⁰ | [3] [8] |
| MEME Suite | Conserved motif discovery | 10 motifs, width 6-50 amino acids | [5] [8] |
| OrthoFinder v2.5.1 | Evolutionary analysis, orthogrouping | DIAMOND for sequence similarity, MCL clustering | [6] |
| DESeq2 | RNA-seq differential expression | Wald test, log₂FC>1, adjusted p≤0.05 | [7] [10] |
| VIGS | Functional validation | TRV-based vectors, symptom assessment | [6] |
| Salmon v1.9.0 | Transcript quantification | Alignment-free algorithm, reference transcriptome | [10] |
Applications in Crop Improvement and Disease Resistance Breeding
The characterization of NBS-LRR genes has significant implications for crop improvement programs. Several strategies have been successfully employed:
Gene Pyramiding: Stacking multiple NBS-LRR genes with different recognition specificities to provide durable, broad-spectrum resistance. This approach helps overcome the rapid evolution of pathogen effectors that can break single-gene resistance [4].
Interfamily Transfer: Recent breakthroughs have demonstrated that co-transferring sensor NLRs with their cognate helper NLRs can overcome restricted taxonomic functionality. For example, the pepper immune receptor Bs2, which recognizes the conserved effector AvrBs2, confers robust resistance in rice only when co-expressed with NRC helper NLRs (particularly NRC3 or NRC4) [2]. This strategy enables the utilization of the vast NLR repertoire from non-host plants for crop improvement.
Marker-Assisted Selection: Identification of NBS-LRR genes associated with resistance in wild relatives or tolerant cultivars facilitates the development of molecular markers for breeding. Research in cotton identified 6,583 unique variants in NBS genes of CLCuD-tolerant G. hirsutum accession Mac7 compared to susceptible Coker 312, providing potential markers for resistance breeding [6].
Transcriptome studies in disease-resistant cultivars have revealed the crucial role of NBS-LRR genes in defense responses. In sugarcane, transcriptome data from multiple diseases revealed that more differentially expressed NBS-LRR genes were derived from S. spontaneum than from S. officinarum in modern sugarcane cultivars, with the proportion significantly higher than expected, revealing that S. spontaneum has a greater contribution to disease resistance for modern sugarcane cultivars [7]. Similarly, transcriptome analysis of banana blood disease-resistant cultivars identified significant upregulation of defense-related genes, including receptor-like kinases, as early as 12 hours post-inoculation, highlighting the activation of effector-triggered immunity [10].
The strategic deployment of NBS-LRR genes through modern breeding technologies represents a promising approach for developing durable disease resistance in crop plants, reducing reliance on chemical pesticides, and enhancing global food security.
Plant immunity against pathogens often hinges on the action of nucleotide-binding site (NBS) leucine-rich repeat (LRR) genes, which constitute one of the largest families of plant resistance (R) genes. These genes encode proteins that function as critical immune receptors, initiating effector-triggered immunity (ETI) upon pathogen recognition [6] [7]. The functional validation of these genes, especially through comparative studies of susceptible and tolerant cultivars, provides fundamental insights into plant defense mechanisms and offers genetic targets for breeding resistant crops [6] [10]. Research on cotton leaf curl disease (CLCuD), for instance, has demonstrated that tolerant Gossypium hirsutum accessions like 'Mac7' possess a greater number of unique genetic variants in their NBS genes compared to susceptible varieties like 'Coker 312' [6]. Similarly, studies in banana have identified key defense genes associated with resistance to banana blood disease (BBD) [10]. The foundation of such functional studies is the accurate and comprehensive genome-wide identification of NBS-encoding genes, a process heavily reliant on advanced bioinformatics tools for sequence analysis [3] [8].
Core Methodologies for Genome-Wide Identification
HMMER Scans: The Gold Standard for Domain Detection
The genome-wide identification of NBS-LRR genes typically begins with a search for the conserved NB-ARC domain (Pfam: PF00931) using HMMER, a software package that utilizes profile hidden Markov models (profile HMMs) [11] [3] [8]. A profile HMM is a statistical model that represents the consensus of a multiple sequence alignment, enabling the sensitive detection of remote homologs by capturing patterns of conservation and variability across aligned positions [11]. Its architecture for each position in an alignment includes Match states (Mk) for emitting consensus amino acids, Insert states (Ik) for accommodating extra residues, and Delete states (Dk) for skipping positions [11].
The standard workflow involves using the hmmsearch program from the HMMER suite to scan a proteome or genome sequence against the pre-built PF00931 HMM. Commands are executed with strict E-value cutoffs (e.g., < 1e-20) to ensure only high-confidence hits are retained [8]. Following the initial scan, candidate genes are often validated by checking for the complete presence of the NBS domain against the Pfam database and other domain databases [8].
Domain Architecture Analysis for Gene Classification
After identifying NBS-domain-containing genes, they are classified based on their domain composition, which informs their potential function [6] [3] [8]. This involves scanning the protein sequences for other conserved domains using tools like the Pfam database, SMART, and the NCBI Conserved Domain Database (CDD) [3] [8]. Key domains include:
- TIR (Toll/Interleukin-1 Receptor): Often found at the N-terminus.
- CC (Coiled-Coil): A common N-terminal domain alternative to TIR.
- LRR (Leucine-Rich Repeat): Typically located at the C-terminus, involved in pathogen recognition.
- RPW8 (Resistance to Powdery Mildew 8): A less common N-terminal domain [8].
This analysis reveals significant diversification, with studies identifying dozens to over a hundred distinct domain architecture classes across plant species, from classical patterns like TIR-NBS-LRR (TNL) and CC-NBS-LRR (CNL) to species-specific patterns incorporating novel domain combinations [6].
Table 1: Standard Classification of NBS-LRR Genes Based on Domain Architecture
| Classification | N-Terminal Domain | Central Domain | C-Terminal Domain | Example Count in N. benthamiana [8] |
|---|---|---|---|---|
| TNL | TIR | NBS | LRR | 5 |
| CNL | CC | NBS | LRR | 25 |
| NL | None or Other | NBS | LRR | 23 |
| TN | TIR | NBS | - | 2 |
| CN | CC | NBS | - | 41 |
| N | None or Other | NBS | - | 60 |
Comparative Performance of Identification Tools
HMMER and Alternative Bioinformatics Tools
While HMMER is a cornerstone tool, several other software options exist for sequence analysis and homolog detection. The choice of tool involves trade-offs between sensitivity, speed, and usability.
Table 2: Comparison of Protein Homolog Detection Tools
| Tool | Methodology | Key Features | Reported Performance | Primary Use Case |
|---|---|---|---|---|
| HMMER [11] | Profile Hidden Markov Models (HMMs) | High sensitivity for remote homologs; identifies domains using probabilistic models. | Gold standard for domain identification; slower than some alternatives [12]. | Genome-wide domain-centric gene identification (e.g., NBS genes). |
| DHR [12] | Protein Language Model & Dense Retrieval | Alignment-free; uses deep learning embeddings for ultrafast searches. | >10% increase in sensitivity at superfamily level; 28,700x faster than HMMER [12]. | Rapid, sensitive homology searches in massive databases. |
| DIAMOND [6] | Alignment (BLAST-like) | Ultra-fast sequence alignment; uses double indexing. | Faster than BLAST; used in orthogroup analysis [6]. | Large-scale sequence comparisons and ortholog clustering. |
| PSI-BLAST [12] | Iterative Position-Specific Scoring | Builds a position-specific score matrix from initial hits. | Better than BLAST for remote homologs; less sensitive than profile methods [12]. | Protein sequence similarity searching with improved sensitivity over BLAST. |
Experimental Data from Genomic Studies
The effectiveness of the HMMER-based pipeline is demonstrated by its consistent application and results across recent genomic studies in various plant species. The table below summarizes quantitative findings from several investigations, highlighting the diversity of NBS gene families.
Table 3: Genome-Wide NBS Gene Identification Results Using HMMER in Various Plant Species
| Plant Species | Total NBS Genes Identified | Notable Domain Architectures Discovered | Key Genomic Findings | Study Reference |
|---|---|---|---|---|
| Nicotiana tabacum (Tobacco) | 603 | TIR-NBS-LRR, CC-NBS-LRR, NBS | ~77% of NBS genes in the allotetraploid N. tabacum were traced to its parental genomes. | [3] |
| Nicotiana benthamiana | 156 | TIR-NBS-LRR (5), CC-NBS-LRR (25), N-type (60) | NBS-LRR genes constitute ~0.25% of all annotated genes in the genome. | [8] |
| 34 Plant Species (from mosses to dicots) | 12,820 | 168 classes, including novel species-specific patterns | Discovered several orthogroups (OGs) with tandem duplications; expression profiling implicated specific OGs in stress response. | [6] |
| Saccharum spontaneum (Wild Sugarcane) | Part of a focused study on 23 species | - | Contributed a disproportionately high number of disease-responsive NBS-LRR genes to modern sugarcane cultivars. | [7] |
A Standardized Protocol for Identification and Initial Characterization
The following integrated protocol, compiled from recent studies, ensures a comprehensive identification and initial characterization of NBS-LRR genes.
- Data Retrieval: Obtain the high-quality genome assembly and corresponding protein sequence file (in FASTA format) for the target species from databases like NCBI, Phytozome, or EnsemblPlants [6] [7].
- HMMER Scan:
- Tool:
hmmsearchfrom HMMER v3.1b2 or later. - HMM Profile: Download the NB-ARC domain model (PF00931) from the Pfam database.
- Command:
hmmsearch --cpu 4 --domtblout output.domtblout Pfam-A.hmm protein_sequences.fasta > output.hmmer - Parameters: Use a stringent E-value cutoff (e.g.,
1e-20) and adjust based on genome size and desired sensitivity [3] [8].
- Tool:
- Domain Validation and Classification:
- Phylogenetic and Evolutionary Analysis:
- Perform multiple sequence alignment of the NBS protein sequences using tools like MUSCLE or ClustalW [3] [8].
- Construct a phylogenetic tree using Maximum Likelihood (e.g., in MEGA11) with 1000 bootstrap replicates to assess evolutionary relationships [3] [8].
- Analyze gene duplication events (tandem and segmental) using tools like MCScanX to understand gene family expansion [3] [7].
Successful genome-wide identification and functional validation rely on a suite of bioinformatics tools and databases.
Table 4: Key Research Reagents and Resources for NBS Gene Analysis
| Resource Name | Type | Function in NBS Gene Research | Access Link |
|---|---|---|---|
| Pfam Database | Database | Provides curated multiple sequence alignments and HMMs for protein domains, including the NB-ARC domain (PF00931). | http://pfam.xfam.org/ |
| HMMER Suite | Software | Scans nucleotide or protein sequences against profile HMMs to identify domains like the NBS. | http://hmmer.org/ |
| NCBI CDD | Database | Annotates conserved domains in protein sequences, helping to validate NBS finds and identify associated domains. | https://www.ncbi.nlm.nih.gov/cdd |
| OrthoFinder | Software | Infers orthogroups and gene families from multiple species, useful for comparative analysis of NBS genes. | https://github.com/davidemms/OrthoFinder |
| MEME Suite | Software | Discovers conserved motifs in protein sequences, providing finer detail beyond broad domain classification. | https://meme-suite.org/ |
| PlantCARE | Database | Identifies cis-acting regulatory elements in promoter sequences, giving clues about NBS gene regulation. | http://bioinformatics.psb.ugent.be/webtools/plantcare/html/ |
Connecting Identification to Functional Validation in Cultivar Research
The ultimate goal of identifying NBS genes is to understand their function in disease resistance. This is achieved by integrating genomic data with transcriptomic and functional genomic data, particularly from comparisons of susceptible and tolerant cultivars.
- Expression Profiling: RNA-seq analysis of resistant and susceptible cultivars under pathogen challenge reveals differentially expressed NBS genes. For example, in sugarcane, a greater proportion of disease-responsive NBS-LRR genes were derived from the wild, resistant ancestor S. spontaneum than from the cultivated S. officinarum [7]. Similarly, in banana, RNA-seq identified key defense genes, including receptor-like kinases, upregulated early in the resistant cultivar 'Khai Pra Ta Bong' after infection with Ralstonia syzygii [10].
- Genetic Variation Analysis: Comparing genomes of tolerant and susceptible accessions can identify unique variants in NBS genes. In cotton, the tolerant 'Mac7' accession possessed over 1,000 more unique variants in its NBS genes than the susceptible 'Coker 312', highlighting potential genetic bases for resistance [6].
- Functional Validation via VIGS: Virus-Induced Gene Silencing (VIGS) is a powerful technique to confirm gene function. Silencing a candidate NBS gene (e.g.,
GaNBSin resistant cotton) and observing a loss of resistance phenotype demonstrates its critical role in defense [6].
The genome-wide identification of NBS genes via HMMER scans and domain architecture analysis is a mature, robust, and essential methodology in plant immunity research. While HMMER remains the gold standard for sensitive domain detection, newer tools like DHR offer promising gains in speed for specific applications like remote homology search. The integration of these identification methods with comparative genomics (analyzing susceptible and tolerant cultivars), transcriptomics, and functional validation techniques like VIGS creates a powerful pipeline. This integrated approach moves beyond mere cataloging to uncover the specific NBS genes that confer disease resistance, providing invaluable genetic resources and targets for modern crop breeding programs aimed at enhancing global food security.
Nucleotide-binding site (NBS) genes represent one of the largest and most critical gene families in plant innate immunity, encoding proteins that function as major immune receptors for effector-triggered immunity (ETI) [6]. These genes, particularly those belonging to the NBS-leucine-rich repeat (NBS-LRR) class, play a pivotal role in plant defense against pathogens including viruses, bacteria, fungi, and oomycetes [13]. The evolutionary expansion and diversification of NBS gene repertoires across plant species are primarily driven by gene duplication events, with whole-genome duplication (WGD) and tandem duplication representing two fundamental mechanisms with distinct impacts on gene fate and function [6] [14].
Understanding the differential contributions of these duplication mechanisms is essential for deciphering the evolutionary dynamics of plant immune systems. This comparative guide examines how WGD and tandem duplication shape NBS gene repertoires, influencing gene retention patterns, structural divergence, functional innovation, and ultimately, disease resistance outcomes. Within the broader context of functional validation research in susceptible versus tolerant cultivars, this analysis provides researchers with a framework for interpreting NBS gene evolution and its implications for crop improvement strategies.
Comparative Analysis of Duplication Mechanisms
Quantitative Impact on NBS Gene Repertoires
Table 1: Comparative Impact of Whole-Genome and Tandem Duplication on NBS Genes
| Characteristic | Whole-Genome Duplication (WGD) | Tandem Duplication |
|---|---|---|
| Genomic Context | Genome-wide event affecting all genes | Localized event in specific genomic regions |
| Gene Retention Bias | Preferential retention of NBS genes in some lineages [14] | Strong preferential retention of NBS-LRR genes [13] [15] |
| Evolutionary Rate | Lower non-synonymous substitution rates (Ka) [14] | Higher evolutionary rates and functional diversification [14] |
| Structural Divergence | Lower divergence in coding-region length, exon length, and indel patterns [14] | Higher structural divergence, especially in coding-region length and exon configuration [14] |
| Expression Divergence | Lower expression divergence between duplicates [14] | Higher expression divergence following duplication [14] |
| Genomic Distribution | Creates widely dispersed paralogs across chromosomes | Generates clustered gene arrays with physical proximity [15] |
| Temporal Pattern | Periodic events creating distinct evolutionary layers | Continuous process contributing to species-specific expansions [16] |
| Functional Fate | Often maintains functional redundancy or subfunctionalization [14] | Rapid neofunctionalization for novel pathogen recognition [13] |
Evolutionary Consequences and Functional Implications
The differential impacts of WGD and tandem duplication create complementary evolutionary pathways for NBS gene family expansion. WGD events, such as the α, β, and γ events in Arabidopsis thaliana, produce complete sets of gene duplicates that are often retained due to dosage balance constraints [14]. These WGD-derived paralogs typically exhibit slower sequence evolution and structural conservation, preserving ancestral functions while providing genetic material for long-term evolutionary innovation.
In contrast, tandem duplication acts as a rapid-response mechanism to pathogen pressure, creating localized clusters of NBS-LRR genes that undergo accelerated evolution. A comprehensive analysis of 12,820 NBS-domain-containing genes across 34 plant species revealed that tandem duplications are particularly frequent in NBS genes, contributing significantly to species-specific resistance gene repertoires [6]. These tandem arrays become hotspots for diversifying selection, gene conversion, and sequence exchange, facilitating the generation of novel pathogen recognition specificities over short evolutionary timescales [16] [13].
The structural divergence between duplication mechanisms is particularly striking. Transposed duplicates (a form of dispersed duplication) exhibit the most dramatic structural changes, with significant differences in coding-region lengths, exon lengths, and indel patterns compared to WGD-derived paralogs [14]. This structural plasticity enables rapid functional diversification critical for adapting to evolving pathogen populations.
Experimental Approaches for Characterizing NBS Duplication Events
Genomic Identification and Phylogenetic Analysis
Protocol 1: Genome-Wide Identification and Classification of NBS Genes
Step 1: Sequence Retrieval
- Obtain latest genome assemblies from public databases (NCBI, Phytozome, Plaza) [6]. For comparative analyses, select species representing diverse plant lineages (e.g., mosses to monocots and dicots) with varying ploidy levels.
Step 2: Domain Identification
Step 3: Classification System
Step 4: Orthogroup Delineation
- Perform orthologous group analysis using OrthoFinder v2.5.1 with DIAMOND for sequence similarity searches and MCL clustering algorithm [6].
- Identify core (common across species) and unique (species-specific) orthogroups to distinguish conserved versus lineage-specific innovations.
Protocol 2: Evolutionary Analysis and Duplication Dating
Step 1: Phylogenetic Reconstruction
Step 2: Synonymous Substitution Rate (Ks) Analysis
Step 3: Selective Pressure Analysis
- Calculate nonsynonymous (Ka) and synonymous (Ks) substitution rates, and Ka/Ks ratios using PAML4 package [16].
- Apply site-specific and branch-specific models to detect positive selection, particularly in LRR domains involved in pathogen recognition.
Step 4: Gene Conversion Detection
- Analyze sequence exchange events using GENECONV with default options and 10,000 permutations [16].
- Identify gene conversion events that contribute to NBS-LRR diversification within clustered arrays.
Diagram 1: Experimental workflow for NBS gene evolutionary and functional analysis. The pipeline progresses from genomic identification (green) through evolutionary analysis (blue) to functional validation (red).
Functional Validation in Susceptible and Tolerant Cultivars
Protocol 3: Expression Profiling and Functional Characterization
Step 1: Transcriptomic Analysis
- Retrieve RNA-seq data from public databases (IPF database, CottonFGD, Cottongen, NCBI BioProjects) under various conditions [6].
- Categorize expression data into tissue-specific, abiotic stress-specific, and biotic stress-specific profiles.
- Process RNA-seq data through transcriptomic pipelines to calculate FPKM values and identify differentially expressed NBS genes [6].
Step 2: Genetic Variation Analysis
- Identify sequence variants (SNPs, indels) in NBS genes between susceptible and tolerant cultivars using whole-genome resequencing data [6].
- Correlate specific variants with resistance phenotypes using association mapping approaches.
Step 3: Protein Interaction Studies
Step 4: Functional Validation via VIGS
- Design virus-induced gene silencing (VIGS) constructs targeting candidate NBS genes identified through comparative and expression analyses [6] [17].
- Silencing of GaNBS (OG2) in resistant cotton demonstrated its putative role in virus tittering against cotton leaf curl disease [6].
- In Vernicia montana, VIGS of Vm019719 confirmed its role in Fusarium wilt resistance [17].
Signaling Pathways and Evolutionary Dynamics
Diagram 2: Evolutionary and functional consequences of different duplication mechanisms. WGD (green pathway) leads to conserved functions and durable resistance, while tandem duplication (red pathway) enables rapid evolution and specific resistance.
The differential impact of duplication mechanisms extends to regulatory networks controlling NBS gene expression. Research has revealed that genetic variation at transcription factor binding sites, including bQTL (binding quantitative trait loci), can explain substantial phenotypic heritability in complex traits [18]. In the case of sheath blight resistance in rice, a 256-bp insertion in the promoter of SBRR1 created a novel transcription factor binding site, specifically recognized by bHLH57, which accounted for highly induced expression and stronger resistance [19]. This demonstrates how cis-regulatory evolution following gene duplication can shape expression patterns and resistance outcomes.
The signaling pathways activated by NBS-LRR proteins involve nucleotide-dependent conformational changes that trigger downstream immune responses. The NBS domain functions as a molecular switch, with ATP/GTP binding and hydrolysis cycling between inactive and active states [13]. Upon pathogen recognition, typically through LRR domain interactions with pathogen effectors, conformational changes in the NBS domain promote oligomerization and formation of resistosomes, which activate downstream signaling cascades leading to hypersensitive response and systemic acquired resistance [13] [17].
The Scientist's Toolkit: Essential Research Reagents
Table 2: Key Research Reagents for NBS Gene Functional Analysis
| Reagent/Category | Specific Examples | Research Application | Key Function in Analysis |
|---|---|---|---|
| Genomic Resources | Phytozome, Plaza, NCBI Genome Databases | Comparative genomics | Provide annotated genome assemblies for multiple species for identification of NBS genes [6] |
| Domain Databases | Pfam, SMART, InterPro, CDD | Domain architecture analysis | Identify and validate NBS, LRR, TIR, CC domains using HMM profiles and domain databases [16] [20] |
| Software Tools | OrthoFinder, MEGA, FastTree, PAML | Evolutionary analysis | Orthogroup clustering, phylogenetic reconstruction, selection pressure analysis [6] [16] |
| Expression Databases | IPF Database, CottonFGD, NCBI BioProjects | Transcriptomic profiling | Provide RNA-seq data for expression analysis under various conditions and in different cultivars [6] |
| Functional Validation Tools | VIGS vectors, CRISPR-Cas9 systems | Functional characterization | Gene silencing and gene editing to validate NBS gene functions in resistant/susceptible backgrounds [6] [17] |
| Interaction Assay Systems | Yeast two-hybrid, Co-IP, Phos-tag SDS-PAGE | Protein function analysis | Study protein-protein interactions, phosphorylation status, and signaling mechanisms [19] [17] |
The evolutionary dynamics of NBS gene repertoires have direct implications for crop improvement strategies. The comparison between susceptible and tolerant cultivars has revealed that resistance often correlates with specific NBS gene expansions and functional variations. In cotton, comparative analysis between CLCuD-susceptible (Coker 312) and tolerant (Mac7) Gossypium hirsutum accessions identified several unique variants in NBS genes (6583 in Mac7 versus 5173 in Coker312), highlighting the genetic basis of resistance differences [6].
Similarly, in tung trees, the resistant Vernicia montana possesses 149 NBS-LRR genes with diverse domain architectures, including TIR-NBS-LRR genes absent in the susceptible Vernicia fordii (90 NBS-LRR genes) [17]. Functional characterization confirmed that Vm019719, activated by VmWRKY64, confers resistance to Fusarium wilt in V. montana, while its allelic counterpart in V. fordii contains a promoter deletion that renders it ineffective [17].
These findings underscore the importance of understanding duplication-mediated evolution of NBS genes for marker-assisted breeding. By targeting specific NBS gene clusters expanded through tandem duplication or conserved through WGD, breeders can develop cultivars with enhanced, durable resistance to evolving pathogens, ultimately contributing to global food security.
The nucleotide-binding site (NBS) gene family represents one of the most important classes of disease resistance (R) genes in plants, encoding proteins that play a critical role in pathogen recognition and defense activation [21]. These genes are characterized by the presence of a conserved NBS domain and are frequently accompanied by C-terminal leucine-rich repeat (LRR) domains and various N-terminal domains such as TIR (Toll/Interleukin-1 receptor), CC (coiled-coil), or RPW8 (Resistance to Powdery Mildew 8) [21] [6]. The NBS-encoding genes are classified into different types based on their domain architecture, including CN, CNL, N, NL, RN, RNL, TN, and TNL, which may have evolved through different evolutionary pathways and potentially assume distinct functions in plant immunity [21] [3].
In the context of cotton (Gossypium spp.), a globally significant crop for natural fiber production, understanding the diversity and distribution of NBS-encoding genes is particularly important for breeding resistant cultivars against devastating diseases such as Verticillium wilt and Fusarium wilt [21]. This case study provides a comprehensive comparative analysis of NBS gene numbers and class distribution across four cotton species: the diploids G. arboreum (A genome) and G. raimondii (D genome), and the allotetraploids G. hirsutum (AD1 genome) and G. barbadense (AD2 genome). The analysis is framed within the broader context of functional validation of NBS genes in susceptible versus tolerant cultivars, offering insights for researchers and breeders aiming to enhance disease resistance in cotton.
Comparative Genomic Analysis of NBS Genes Across Cotton Species
Genome-Wide Identification and Quantitative Distribution
Systematic identification of NBS-encoding genes in the four cotton species has revealed significant variation in gene numbers, reflecting complex evolutionary histories. Based on genome assembly data, 246, 365, 588, and 682 NBS-encoding genes were identified in G. arboreum, G. raimondii, G. hirsutum, and G. barbadense, respectively [21]. The two allotetraploid species possess nearly double the number of NBS genes compared to their diploid progenitors, which can be attributed to the hybridization event between A and D genome species, potentially followed by differential gene retention and subsequent gene duplication [21].
Table 1: NBS-Encoding Gene Counts in Four Gossypium Species
| Species | Genome Type | Total NBS Genes | Diploid Progenitor Contribution |
|---|---|---|---|
| G. arboreum | Diploid (A) | 246 | - |
| G. raimondii | Diploid (D) | 365 | - |
| G. hirsutum | Allotetraploid (AD) | 588 | More from G. arboreum (A genome) |
| G. barbadense | Allotetraploid (AD) | 682 | More from G. raimondii (D genome) |
The distribution of NBS-encoding genes across chromosomes is nonrandom and uneven in all four species, with a strong tendency to form gene clusters [21]. This clustering pattern is consistent with observations in other plant species and may facilitate the rapid evolution of new resistance specificities through recombination and diversifying selection [22]. Sequence similarity and synteny analyses have demonstrated that G. hirsutum inherited a larger proportion of its NBS-encoding genes from its G. arboreum progenitor, while G. barbadense inherited more NBS-encoding genes from its G. raimondii progenitor [21] [23]. This asymmetric evolution of NBS-encoding genes has important implications for the differential disease resistance profiles observed among these cotton species.
Classification and Structural Diversity of NBS Genes
The NBS-encoding genes in cotton can be classified into eight structural types based on their domain architectures: CN, CNL, N, NL, RN, RNL, TN, and TNL [21]. Comparative analysis of these architectural types reveals striking differences between the A and D genome lineages, which are maintained in their respective allotetraploid derivatives.
Table 2: Percentage Distribution of NBS Gene Types Across Cotton Species
| Gene Type | G. arboreum | G. raimondii | G. hirsutum | G. barbadense |
|---|---|---|---|---|
| CN | 17.89% | 10.68% | 16.84% | 11.02% |
| CNL | 32.52% | 29.32% | 30.82% | 28.69% |
| N | 23.98% | 16.99% | 22.31% | 17.42% |
| NL | 8.94% | 15.07% | 9.74% | 14.52% |
| RN | 1.63% | 2.47% | 1.55% | 2.41% |
| RNL | 4.07% | 4.66% | 3.95% | 4.63% |
| TN | 2.44% | 6.58% | 2.93% | 6.21% |
| TNL | 8.54% | 14.24% | 11.86% | 15.10% |
The data reveals that G. arboreum and its descendant G. hirsutum possess a greater proportion of CN, CNL, and N genes, while G. raimondii and G. barbadense have higher proportions of NL, TN, and TNL genes [21]. The most dramatic difference is observed in TNL genes, with G. raimondii and G. barbadense having approximately seven times the proportion of TNL genes compared to G. arboreum and G. hirsutum [21]. This divergence in TNL representation is particularly significant given the established role of TIR-type NBS genes in disease resistance signaling.
Gene structure analysis further reveals differences in exon numbers, with the average exon numbers per NBS gene in G. raimondii and G. barbadense being greater than those in G. arboreum and G. hirsutum [21]. This structural variation may reflect functional diversification and different evolutionary trajectories in the two cotton lineages.
Diagram 1: NBS Gene Classification System. This diagram illustrates the classification logic for NBS-encoding genes based on their protein domain architecture, resulting in eight distinct types.
Relationship to Disease Resistance Phenotypes
Correlation with Verticillium Wilt Resistance
The asymmetric distribution of NBS-encoding genes, particularly TNL-type genes, between cotton lineages correlates with observed differences in disease resistance. G. raimondii is nearly immune to Verticillium wilt, and G. barbadense is generally resistant or highly resistant to Verticillium dahliae, whereas G. arboreum and G. hirsutum are often susceptible to this pathogen [21]. This correlation suggests that the TNL genes, which are significantly more abundant in the D genome lineage, may play a crucial role in Verticillium wilt resistance [21].
In contrast, for Fusarium wilt, caused by Fusarium oxysporum f. sp. vasinfectum, G. barbadense is often more susceptible compared to G. arboreum and G. hirsutum [21]. This differential resistance profile highlights the pathogen-specific nature of NBS gene efficacy and the complex relationship between NBS gene repertoire and disease resistance in cotton.
Functional Validation in Susceptible vs. Tolerant Cultivars
Recent research has expanded beyond cataloging NBS genes to functionally validating their roles in disease resistance through comparative studies of susceptible and tolerant cultivars. A comprehensive study analyzing 12,820 NBS-domain-containing genes across 34 plant species identified several orthogroups with putative roles in defense [6]. Expression profiling demonstrated the upregulation of specific orthogroups (OG2, OG6, and OG15) in different tissues under various biotic and abiotic stresses in cotton accessions with contrasting responses to cotton leaf curl disease (CLCuD) [6].
Notably, genetic variation analysis between susceptible (Coker 312) and tolerant (Mac7) Gossypium hirsutum accessions identified 6,583 unique variants in NBS genes of Mac7 compared to 5,173 in Coker312 [6]. Virus-induced gene silencing (VIGS) of a candidate NBS gene (GaNBS from OG2) in resistant cotton demonstrated its putative role in reducing virus titers, providing direct functional evidence for its involvement in disease resistance [6].
Diagram 2: NBS-Mediated Disease Resistance Pathway. This diagram outlines the key signaling components in NBS gene-mediated disease resistance, from pathogen recognition to defense activation.
Experimental Protocols for NBS Gene Analysis
Genomic Identification and Classification Pipeline
The identification and classification of NBS-encoding genes in cotton species follow a standardized bioinformatics pipeline. The typical workflow begins with HMMER-based searches (e.g., HMMER v3.1b2) of genome assemblies using the NB-ARC domain (PF00931) from the Pfam database as a query [21] [3]. Subsequent domain analysis employs tools like PfamScan, SMART, and the NCBI Conserved Domain Database to identify additional domains such as TIR (PF01582), CC, and LRR (PF00560, PF07723, PF07725, PF12779, etc.) [21] [3].
Following identification, genes are classified based on domain architecture, and phylogenetic analysis is conducted using multiple sequence alignment with tools such as MAFFT or MUSCLE, followed by tree construction with maximum likelihood methods implemented in MEGA11 or IQ-TREE [21] [22]. Synteny and duplication analyses are performed using MCScanX to identify segmental and tandem duplication events that have shaped NBS gene family expansion [3].
Functional Validation Methods
Functional validation of candidate NBS genes typically employs a multi-pronged approach combining expression analysis, genetic manipulation, and phenotypic assessment. RNA sequencing of resistant and susceptible cultivars under pathogen inoculation identifies differentially expressed NBS genes [6] [24]. For example, transcriptome analysis of banana blood disease resistance identified key defense genes through RNA-seq of resistant cultivar 'Khai Pra Ta Bong' at multiple time points post-inoculation [10].
Virus-induced gene silencing (VIGS) has proven particularly valuable for functional characterization of NBS genes in cotton. This approach was used to validate the role of GbNF-YA7 in pathogen resistance and GhAMT2 in Verticillium wilt resistance [25] [24]. Transgenic validation, such as overexpression of GhAMT2 in Arabidopsis, which conferred enhanced resistance to Verticillium dahliae, provides complementary evidence for gene function [24].
Table 3: Essential Research Reagents for NBS Gene Functional Analysis
| Reagent/Resource | Function/Application | Examples from Literature |
|---|---|---|
| HMMER Software | Identification of NBS domains in genomic sequences | HMMER v3.1b2 with PF00931 model [21] |
| Pfam Database | Domain architecture analysis | NB-ARC (PF00931), TIR (PF01582), LRR models [3] |
| MCScanX | Synteny and gene duplication analysis | Identification of segmental and tandem duplications [3] |
| VIGS Vectors | Functional validation through gene silencing | TRV-based vectors for cotton [25] [6] |
| RNA-seq Platforms | Transcriptome profiling of resistant/susceptible cultivars | Illumina NovaSeq for banana BBD resistance [10] |
| DESeq2 | Differential expression analysis | Identification of DEGs under pathogen stress [10] |
| Pathogen Isolates | Disease phenotyping and resistance screening | V. dahliae strains for cotton wilt studies [24] |
This case study demonstrates substantial divergence in NBS gene numbers and class distribution between cotton species, with particularly notable differences in TNL-type genes between the A and D genome lineages. The correlation between NBS gene repertoire and disease resistance phenotypes, especially for Verticillium wilt, highlights the importance of these genes in cotton immunity. The asymmetric evolution of NBS-encoding genes, with G. hirsutum inheriting more genes from G. arboreum and G. barbadense from G. raimondii, provides a genetic basis for their differential resistance profiles.
Future research should focus on comprehensive functional characterization of specific NBS genes, particularly TNL-types from the D genome, to elucidate their precise mechanisms in conferring resistance to Verticillium wilt. The integration of genomic identification with functional validation through VIGS and transgenic approaches will accelerate the development of disease-resistant cotton cultivars, ultimately contributing to sustainable cotton production.
A plant's innate resistance to pathogens is not a random occurrence but a direct consequence of its evolutionary history, written in the genetic code. Central to this defense system are Nucleotide-Binding Site (NBS) domain genes, which constitute one of the largest superfamilies of plant resistance genes [6]. These genes, particularly those belonging to the NBS-LRR (Nucleotide-Binding Site Leucine-Rich Repeat) class, encode proteins that function as specialized immune receptors, capable of recognizing pathogen effector molecules and initiating robust defense responses [13]. The extensive diversification of this gene family across plant species, driven by evolutionary pressures from rapidly adapting pathogens, provides a compelling model for understanding how genomic history shapes phenotypic outcomes in disease resistance.
Recent comparative genomics studies have revealed remarkable diversity in NBS gene architecture and composition across the plant kingdom. One comprehensive analysis identified 12,820 NBS-domain-containing genes across 34 species ranging from mosses to monocots and dicots, classifying them into 168 distinct classes with both classical and species-specific structural patterns [6] [26]. This diversification represents millions of years of evolutionary innovation in plant immunity, creating a rich genetic reservoir from which resistant genotypes can draw.
Evolutionary Drivers of NBS Gene Diversification
Mechanisms of Genomic Expansion and Contraction
The expansion and diversification of NBS genes across plant genomes have primarily been driven by several key evolutionary mechanisms:
Gene duplication events: Both whole-genome duplication (WGD) and small-scale duplications (SSD), including tandem, segmental, and transposon-mediated duplications, have contributed significantly to the expansion of NBS gene families [6]. Research in Solanaceae species demonstrates that whole genome duplication has played a particularly important role in the expansion of NBS-LRR genes, with the most recent whole-genome triplication (WGT) leaving a strong imprint on the current genomic architecture [27].
Tandem duplications and clustering: NBS-LRR genes frequently occur as linked clusters of varying sizes within plant genomes, a genomic organization that facilitates rapid evolution and generation of novel resistance specificities [13]. These tandem arrays create hotspots for genetic innovation through mechanisms such as ectopic duplication and gene conversion.
Paralogue diversification: Following duplication events, paralogous genes undergo diversification through sequence, expression, and functional divergence. Studies of the Solanaceae pan-genome reveal that this paralogue evolution represents a crucial contingency in trait evolvability, with duplicated genes following dynamic trajectories including neofunctionalization, subfunctionalization, or pseudogenization [28].
Table 1: Evolutionary Mechanisms Driving NBS Gene Diversification
| Evolutionary Mechanism | Impact on NBS Genes | Example Evidence |
|---|---|---|
| Whole-Genome Duplication (WGD) | Creates large gene families; provides genetic raw material for innovation | Major driver of NBS-LRR expansion in Solanaceae [27] |
| Tandem Duplication | Generates gene clusters; enables rapid evolution of new specificities | Facilitates recognition of diverse pathogens [13] |
| Paralog Diversification | Partitions ancestral functions or gains new functions; creates genetic redundancies | Dynamic trajectories in sequence, expression, and function [28] |
| Species-Specific Expansion | Tailors resistance repertoire to particular pathogen pressures | 168 domain architecture classes identified across species [6] |
Lineage-Specific Evolutionary Patterns
Different plant lineages have exhibited distinct evolutionary trajectories in their NBS gene repertoires:
Monocot-Dicot Divergence: A striking evolutionary pattern emerges in the distribution of NBS subclasses between monocots and dicots. TIR-NBS-LRR (TNL) genes are nearly absent in monocotyledons but are present, often in greater numbers than CNL genes, in many dicotyledon species [13].
Variation in Repertoire Size: The number of NBS-encoding genes varies dramatically across plant species, from approximately 50 in papaya and cucumber to 653 in rice (Oryza sativa), reflecting different evolutionary paths and selective pressures [13].
Differential Chromosomal Distribution: NBS-LRR genes often display irregular distribution across chromosomes, with certain chromosomes becoming enriched for these genes. In potato, for instance, chromosomes 4 and 11 contain approximately 15% of mapped NBS-LRR genes, while chromosome 3 contains only 1% [13].
Comparative Genomics: Linking Sequence to Function
Orthogroup Conservation and Divergence
The functional conservation of NBS genes across evolutionary history can be traced through orthogroup analysis, which groups genes descended from a common ancestor. A comprehensive study identified 603 orthogroups (OGs) across land plants, with some representing core orthogroups (common across multiple species) and others constituting unique orthogroups (highly specific to particular species) [6] [26]. This phylogenetic framework provides insights into which resistance gene families have been maintained over evolutionary time versus those that have undergone recent, lineage-specific diversification.
Particular orthogroups show strong associations with disease resistance phenotypes. For example, expression profiling demonstrated that OG2, OG6, and OG15 were putatively upregulated in different tissues under various biotic and abiotic stresses in plants with varying susceptibility to cotton leaf curl disease (CLCuD) [6] [26]. The functional significance of OG2 was further validated experimentally, demonstrating its role in virus tittering when silenced in resistant cotton [6].
Structural Diversity and Domain Architecture
The domain architecture of NBS genes reveals a complex evolutionary history of domain shuffling, loss, and innovation:
- Classical architectural patterns include NBS, NBS-LRR, TIR-NBS, and TIR-NBS-LRR [6]
- Species-specific structural patterns have emerged, such as TIR-NBS-TIR-Cupin1-Cupin1, TIR-NBS-Prenyltransf, and Sugar_tr-NBS, representing evolutionary innovations tailored to specific ecological niches [6]
- N-terminal domain variation classifies NBS-LRR proteins into major subgroups: TNL (TIR-NBS-LRR), CNL (CC-NBS-LRR), and RNL (RPW8-NBS-LRR), each with distinct signaling roles in plant immunity [27]
Table 2: NBS-LRR Gene Subclasses and Their Characteristics
| Subclass | N-Terminal Domain | Prevalence | Representative Species Distribution |
|---|---|---|---|
| TNL (TIR-NBS-LRR) | Toll/Interleukin-1 Receptor | Abundant in dicots, nearly absent in monocots | Arabidopsis thaliana (94 of 149 genes) [13] |
| CNL (CC-NBS-LRR) | Coiled-Coil | Found in both monocots and dicots | Brachypodium distachyon (113 of 126 genes) [13] |
| RNL (RPW8-NBS-LRR) | Resistance to Powdery Mildew 8 | Less common, involved in signaling | Identified across multiple Solanaceae species [27] |
Functional Validation: From Genomic Sequence to Resistance Phenotype
Transcriptional Dynamics in Resistant versus Susceptible Genotypes
Gene expression analyses provide critical insights into how evolutionary history translates into functional resistance differences:
Differential expression under stress: Comparative transcriptomic studies between resistant and susceptible cotton accessions revealed putative upregulation of specific orthogroups (OG2, OG6, OG15) in different tissues under various biotic and abiotic stresses [6] [26]. This suggests that resistant genotypes may have evolved enhanced regulatory mechanisms for targeted activation of defense responses.
Temporal expression patterns: Research on banana blood disease resistance demonstrated that key defense genes, including those encoding receptor-like kinases and glycine-rich proteins, showed significant upregulation as early as 12 hours post-inoculation in resistant cultivars, with additional molecular processes enriched by 24 hours post-inoculation [10]. This rapid activation timing appears crucial for effective disease containment.
Expression conservation and divergence: Studies of the Solanaceae pan-genome have revealed that while tandem and proximal duplicates often show high levels of cis-regulatory conservation, other duplication types (WGD, dispersed, transposed) exhibit greater cis-regulatory divergence, leading to expression pattern diversification that may contribute to resistance phenotypes [28].
Genetic Variation Underlying Resistance Disparities
Comparative analysis of genetic variation between susceptible and tolerant genotypes reveals the molecular footprint of evolutionary selection:
Variant profiling: Analysis of susceptible (Coker 312) and tolerant (Mac7) Gossypium hirsutum accessions identified substantial variation in NBS genes, with 6,583 unique variants in the tolerant Mac7 compared to 5,173 variants in susceptible Coker312 [6] [26]. The abundance and distribution of these variants suggest different evolutionary paths in these genotypes.
Structural variants: Beyond single nucleotide polymorphisms, larger structural variations contribute to resistance differences. Pan-genome analyses in Solanaceae have revealed that presence/absence variations, particularly in NBS-LRR genes, often correlate with resistance phenotypes [28]. These structural variants can result in the complete absence of specific resistance genes in susceptible genotypes or the presence of novel, effective resistance genes in tolerant lines.
Sequence diversification under selection: LRR domains, which are responsible for pathogen recognition, show signatures of diversifying selection, particularly in solvent-exposed residues [13]. This selective pressure promotes the evolution of new pathogen specificities, enabling recognition of diverse pathogen Avr proteins.
Experimental Approaches for Functional Validation
Methodologies for Establishing Genotype-Phenotype Links
Several experimental approaches have been developed to functionally validate the role of NBS genes in disease resistance:
Diagram 1: Experimental Validation Workflow
Genomic Identification and Classification
The initial step involves comprehensive identification and classification of NBS genes:
HMM-based domain screening: Researchers use PfamScan with HMM search scripts with a default e-value (1.1e-50) using the background Pfam-A_hmm model to identify all genes containing NB-ARC domains, which are then considered NBS genes [6]. Additional associated decoy domains are observed through domain architecture analysis.
Orthogroup analysis: Tools such as OrthoFinder (v2.5.1) are employed with the DIAMOND tool for fast sequence similarity searches and the MCL clustering algorithm for gene clustering [6]. Orthologs and orthogrouping are carried out with DendroBLAST, providing an evolutionary framework for comparative analysis.
Phylogenetic reconstruction: Multiple sequence alignment is performed using MAFFT 7.0, with gene-based phylogenetic trees constructed by the maximum likelihood algorithm in FastTreeMP with 1000 bootstrap values [6].
Expression Profiling Methodologies
Transcriptomic analyses provide insights into regulatory differences:
RNA-seq data processing: Data from various databases (IPF database, Cotton Functional Genomics Database, Cottongen database) are processed through transcriptomic pipelines [6]. FPKM (Fragments Per Kilobase of transcript per Million mapped reads) values are categorized into tissue-specific, abiotic stress-specific, and biotic stress-specific expression profiling.
Differential expression analysis: Tools such as DESeq2 are used to identify differentially expressed genes (DEGs) with thresholds typically set at log2 fold change > 1 and Benjamini-Hochberg adjusted p-value ≤ 0.05 [10]. Results are visualized through MA plots and volcano plots.
qRT-PCR validation: Candidate genes identified through RNA-seq are validated using quantitative real-time RT-PCR across multiple cultivars with varying resistance levels to confirm their role in defense mechanisms [10].
Functional Genetic Validation
Direct manipulation of candidate genes tests their functional role:
Virus-Induced Gene Silencing (VIGS): This approach demonstrated the functional importance of GaNBS (OG2) when silencing in resistant cotton substantially reduced virus resistance, confirming its putative role in virus tittering [6] [26].
Protein interaction studies: Protein-ligand and protein-protein interaction assays revealed strong interactions of putative NBS proteins with ADP/ATP and different core proteins of the cotton leaf curl disease virus, providing mechanistic insights [6].
Haplotype analysis: Genetic variation between susceptible and tolerant accessions identifies unique variants in NBS genes, with tolerant genotypes often showing greater variation, suggesting more diverse recognition capabilities [6].
The Scientist's Toolkit: Essential Research Reagents
Table 3: Key Research Reagents for NBS Gene Functional Analysis
| Reagent/Resource | Function/Application | Example Use Case |
|---|---|---|
| Pfam-A HMM Models | Identification of NBS domains | Screening genomes for NB-ARC domains [6] |
| OrthoFinder Software | Orthogroup inference | Evolutionary grouping of NBS genes across species [6] |
| RNA-seq Libraries | Transcriptome profiling | Identifying DEGs in resistant vs susceptible cultivars [6] [10] |
| VIGS Vectors | Functional gene silencing | Validating role of GaNBS in virus resistance [6] |
| CPG Medium | Pathogen culture | Preparing Ralstonia inoculum for challenge assays [10] |
| RNeasy Plant Kit | RNA extraction | Isolating high-quality RNA from challenged tissues [10] |
| NovaSeq 6000 System | High-throughput sequencing | RNA-seq library sequencing for expression analysis [10] |
| DESeq2 R Package | Differential expression analysis | Statistical identification of significant DEGs [10] |
Case Studies: Evolutionary History Informing Resistance Phenotypes
Cotton Leaf Curl Disease Resistance
The molecular basis of resistance to cotton leaf curl disease (CLCuD), caused by Begomoviruses, provides a compelling case study of evolution-informed resistance mechanisms:
Orthogroup-specific contributions: Functional analysis revealed that OG2, OG6, and OG15 showed putative upregulation in tolerant plants under various stresses [6] [26]. Most notably, silencing of GaNBS (OG2) in resistant cotton through VIGS demonstrated its critical role in virus resistance, providing direct evidence for its functional importance.
Variant accumulation: The tolerant genotype Mac7 accumulated significantly more unique variants in NBS genes (6,583) compared to the susceptible Coker312 (5,173 variants), suggesting that evolutionary processes have generated greater diversity in the recognition repertoire of the resistant line [6].
Protein interaction specificity: Protein-ligand and protein-protein interaction studies showed strong interactions between putative NBS proteins and both ADP/ATP and different core proteins of the cotton leaf curl disease virus, indicating that resistant genotypes have evolved specific molecular interfaces for pathogen recognition [6].
Banana Blood Disease Resistance
Research on banana blood disease resistance illustrates how evolutionary history shapes transcriptional responses:
Early activation cascades: In the resistant cultivar 'Khai Pra Ta Bong', RNA-seq analysis identified significant upregulation of defense genes as early as 12 hours post-inoculation with Ralstonia syzygii subsp. celebesensis, with key molecular processes including xyloglucan endotransglucosylase hydrolases, receptor-like kinases, and glycine-rich proteins becoming enriched by 24 hours post-inoculation [10].
Effector-triggered immunity activation: The expression patterns observed in resistant bananas suggest the activation of effector-triggered immunity (ETI), a sophisticated defense layer dependent on NBS-LRR proteins that recognizes specific pathogen effectors [10]. This rapid, targeted response appears to be a key evolutionary adaptation in resistant genotypes.
Conserved defense pathways: Despite the evolutionary distance between banana and model plants like Arabidopsis, the resistant banana cultivar employed similar NBS-LRR-mediated defense mechanisms, demonstrating evolutionary conservation of this immune strategy across angiosperms [10].
Implications for Crop Improvement and Future Research
Breeding and Biotechnology Applications
Understanding the evolutionary history of NBS genes enables more targeted crop improvement strategies:
Marker-assisted selection: The development of SSR markers from NBS-LRR genes facilitates the identification and introgression of valuable resistance alleles. One study identified 22,226 SSRs from all genes of nine Solanaceae species, from which 43 NBS-LRR-associated SSRs were screened for marker development [27].
Pan-genome informed breeding: Solanaceae pan-genome analyses reveal that gene duplication and subsequent paralogue diversification present major obstacles to genotype-to-phenotype predictability [28]. Understanding these evolutionary dynamics enables breeders to anticipate and navigate background dependencies when transferring resistance loci.
Engineering synthetic resistance: Knowledge of NBS gene evolution informs the design of synthetic resistance genes with broader recognition specificities. The modular nature of NBS-LRR proteins, with distinct domains for signaling, nucleotide binding, and pathogen recognition, enables domain swapping approaches to create novel resistance specificities [13].
Future Research Directions
Several promising research avenues emerge from our current understanding:
Paralogue interaction mapping: Comprehensive understanding of how paralogues interact genetically and biochemically over evolutionary timescales will improve predictability in resistance breeding [28].
Regulatory network analysis: Beyond the NBS genes themselves, research must focus on the cis- and trans-acting elements that fine-tune their expression, including the roles of alternative splicing, the ubiquitin/proteasome system, and miRNAs in regulating NBS-LRR gene expression [13].
Ecological evolutionary genomics: Connecting the evolutionary history of NBS genes to the ecological contexts and pathogen pressures that shaped them will provide deeper insights into the selective forces driving resistance gene diversification [6].
The study of NBS gene evolution demonstrates that innate resistance in certain genotypes is not accidental but rather the product of specific evolutionary processes that can be understood, tracked, and ultimately harnessed for crop improvement. By linking evolutionary history to phenotype through rigorous functional validation, researchers can unlock the potential of these genomic resources to enhance agricultural sustainability and food security.
From Sequence to Function: A Multi-Omics Toolkit for Pinpointing Key Resistance Genes
Transcriptomic Profiling (RNA-seq) of Susceptible and Tolerant Cultivars Under Pathogen Challenge
The pursuit of sustainable agriculture necessitates a deep understanding of the molecular mechanisms that underpin plant disease resistance. Within this context, the functional validation of Nucleotide-Binding Site (NBS) domain genes, a major class of plant disease resistance (R) genes, represents a critical research frontier. This guide explores how Comparative Transcriptomic Profiling via RNA-Sequencing (RNA-seq) has become an indispensable tool for dissecting the complex interactions between plant hosts and pathogens. By objectively comparing the performance of this approach against alternative methodologies and presenting supporting experimental data, we frame its application within the broader thesis of functional NBS gene validation in susceptible versus tolerant cultivars.
RNA-seq in Plant-Pathogen Interaction Research
RNA-sequencing is a powerful next-generation sequencing (NGS) method for quantifying the sequences of RNA molecules in a sample, providing a comprehensive view of the transcriptome [29]. The typical workflow involves: isolation of RNA from a sample, fragmentation of RNA into small pieces, conversion of RNA into complementary DNA (cDNA), sequencing the cDNA fragments using NGS platforms, and aligning the sequence data to a reference genome to quantify transcripts [29]. This technology provides a far more precise and high-throughput measurement of levels of transcripts and their isoforms compared to hybridization or sequence-based approaches [30].
The following diagram illustrates the core steps in a standard RNA-seq workflow:
Performance Comparison with Alternative Transcriptomic Methods
Table 1: Comparison of Transcriptomic Profiling Technologies
| Method | Throughput | Sensitivity | Discovery Capability | Cost Efficiency | Primary Applications in Pathogen Research |
|---|---|---|---|---|---|
| RNA-seq | High | High (can detect low-abundance transcripts) | Excellent (can identify novel transcripts, splice variants) | Moderate to High | Genome-wide differential expression, novel gene discovery, splice variant analysis, pathway mapping |
| Microarrays | Moderate | Moderate (limited by background hybridization) | Limited (requires prior knowledge of transcriptome) | Low to Moderate | Targeted expression profiling of known genes, validation studies |
| qRT-PCR | Low | High (for specific targets) | None (targets must be predefined) | High (for small gene sets) | Validation of candidate genes, high-precision quantification of known targets |
| SAGE (Serial Analysis of Gene Expression) | Moderate | Moderate | Limited (short tags) | Low | Digital expression profiling, transcript counting |
RNA-seq's key advantage lies in its hypothesis-free approach, allowing researchers to identify novel transcripts and pathways without prior knowledge of the genome, although well-annotated references significantly enhance data interpretation [30]. Unlike microarrays, which are limited to probing predefined sequences, RNA-seq enables the discovery of novel genes, alternative splicing events, and sequence variations [30] [31]. This discovery capability is particularly valuable when studying non-model crops or novel pathogen interactions.
Experimental Designs and Protocols for Cultivar Comparison
Standardized Experimental Framework
Robust comparative transcriptome studies follow a structured experimental design that controls for biological and technical variability. The core protocol involves:
- Biological Material Selection: Identification of genetically characterized resistant/tolerant and susceptible cultivars through preliminary screening [30] [32] [33].
- Pathogen Inoculation: Controlled inoculation with the pathogen of interest using standardized methods (e.g., agar plugs with mycelia for fungi [31], vector transmission for viruses [32], or bacterial suspension infiltration [30]).
- Sample Collection: Time-series sampling that captures early, middle, and late response phases post-inoculation, with mock-inoculated controls collected in parallel [30] [31].
- RNA Extraction and Library Preparation: High-quality RNA extraction followed by cDNA library construction compatible with the chosen sequencing platform (e.g., Illumina) [30] [32].
- Sequencing and Bioinformatics: High-throughput sequencing followed by a standardized analysis pipeline including read alignment, quantification, and differential expression analysis [32] [31].
The following diagram illustrates a typical research design for a comparative RNA-seq study:
Key Methodological Variations Across Pathogen Systems
Table 2: Experimental Design Variations Across Pathogen Studies
| Study System | Cultivars Used | Inoculation Method | Time Points Sampled | Key Bioinformatics Tools |
|---|---|---|---|---|
| Sugarcane vs. Xanthomonas albilineans (Leaf Scald) [30] | Resistant: LCP 85-384; Susceptible: ROC20 | Not specified | 0, 24, 48, 72 hours post inoculation (hpi) | Illumina platform, alignment and transcript assembly, DESeq2 for DEG identification |
| Banana vs. Banana Bunchy Top Virus [32] | Resistant: Wild Musa balbisiana; Susceptible: Musa acuminata 'Lakatan' | Aphid vector (Pentalonia nigronervosa) | 72 hpi | Illumina NextSeq, genome-guided mapping using M. acuminata reference, DESeq2 |
| Rice vs. Rhizoctonia solani (Sheath Blight) [31] | Resistant: TeQing; Susceptible: Lemont | Agar plugs with mycelia | 12, 24, 36, 48, 72 hpi | TopHat2/Bowtie alignment to Nipponbare reference, Cufflinks, DESeq |
| Foxtail Millet vs. Sclerospora graminicola (Downy Mildew) [33] | Resistant: G1; Susceptible: JG21 | Oospores mixed with seeds | 3-, 5-, 7-leaf stages | Not specified |
Data Output and Analytical Framework
Quantitative Transcriptomic Profiles
RNA-seq generates comprehensive datasets that quantify transcriptional changes across the genome. The following table illustrates typical data outputs from comparative cultivar studies:
Table 3: Representative Transcriptomic Outputs from Cultivar Comparison Studies
| Study System | Total Differentially Expressed Genes (DEGs) | DEGs in Resistant Cultivar | DEGs in Susceptible Cultivar | Key Enriched Pathways |
|---|---|---|---|---|
| Sugarcane vs. Xanthomonas [30] | 105,783 | Not specified | Not specified | Plant-pathogen interaction, spliceosome, glutathione metabolism, protein processing, plant hormone signal transduction |
| Banana vs. BBTV [32] | 62 common + 151 unique to resistant + 99 unique to susceptible | 213 total (62 up, 151 down) | 161 total (77 up, 84 down) | Secondary metabolite biosynthesis, cell wall modification, pathogen perception |
| Foxtail Millet vs. Downy Mildew [33] | 1,906 (473 in resistant + 1,433 in susceptible) | 473 | 1,433 | Glutathione metabolism, plant hormone signalling, phenylalanine metabolism, cutin/suberin/wax biosynthesis |
| Rice vs. Sheath Blight [31] | 4,802 | Earlier and stronger defense activation | Delayed and weaker defense response | Photosynthesis, photorespiration, jasmonic acid, phenylpropanoid metabolism |
Signaling Pathways in Resistant vs Susceptible Cultivars
Transcriptomic analyses consistently reveal that resistant cultivars typically activate defense pathways more rapidly and robustly than susceptible cultivars. Key pathways include:
- Plant Hormone Signal Transduction: Salicylic acid (SA), jasmonic acid (JA), and ethylene (ET) pathways are frequently upregulated in resistant genotypes [30] [33].
- Pattern-Triggered Immunity (PTI): Receptor-like kinases (RLKs) and calcium-dependent signaling components show earlier induction in resistant cultivars [32].
- Secondary Metabolism: Phenylpropanoid biosynthesis, lignin formation, and phytoalexin production pathways are often enriched [32] [33].
- Reactive Oxygen Species (ROS) Scavenging: Glutathione metabolism and peroxidase genes are commonly differentially regulated [30] [33].
The following diagram illustrates the core defense signaling pathways typically activated in resistant cultivars:
Functional Validation of NBS-LRR Genes
Transcriptome-Informed Gene Discovery
NBS-LRR genes constitute one of the largest and most important families of plant disease resistance genes [6]. Comparative transcriptomics serves as a powerful discovery tool for identifying which of the hundreds of NBS genes in plant genomes are functionally relevant to specific pathogen interactions. A comprehensive study identified 12,820 NBS-domain-containing genes across 34 plant species, classifying them into 168 different domain architecture classes [6]. This diversity presents both a challenge and opportunity for identifying key functional resistance genes.
Expression profiling of NBS genes in cotton under cotton leaf curl disease (CLCuD) pressure revealed putative upregulation of specific orthogroups (OG2, OG6, OG15) in different tissues under various biotic stresses [6]. Genetic variation analysis between susceptible (Coker 312) and tolerant (Mac7) cotton accessions identified substantially more unique variants in the tolerant genotype (6,583 vs. 5,173 variants) [6], highlighting the potential for allele mining in resistant germplasm.
Experimental Validation Pipeline
The transition from transcriptomic identification to functional validation of NBS genes typically follows this pipeline:
- Identification of Candidate NBS Genes: Mining transcriptome data for differentially expressed NBS-LRR genes with strong induction patterns in resistant cultivars post-infection.
- Sequence and Structural Analysis: Examining genetic variations between resistant and susceptible alleles, including nonsynonymous SNPs in functional domains [6].
- Protein-Ligand Interaction Studies: Computational modeling of candidate NBS protein interactions with pathogen effectors or signaling molecules [6].
- Functional Genetic Validation: Using techniques like Virus-Induced Gene Silencing (VIGS) to knock down candidate genes and assess impact on resistance [6].
- Transgenic Complementation: Expressing resistant alleles in susceptible genotypes to confer disease resistance.
The functional importance of this approach was demonstrated when silencing of GaNBS (OG2) in resistant cotton through VIGS substantially increased viral titers, confirming its role in virus resistance [6].
The Scientist's Toolkit: Essential Research Reagents and Platforms
Table 4: Essential Research Tools for Comparative Transcriptomic Studies
| Category | Specific Tools/Reagents | Function/Application | Examples from Literature |
|---|---|---|---|
| Sequencing Platforms | Illumina NextSeq, NovaSeq | High-throughput cDNA sequencing | NextSeq 500 used in banana BBTV study [32], NovaSeq 6000 used in newborn screening validation [34] |
| Library Prep Kits | Twist Bioscience target enrichment | cDNA library preparation and target enrichment | Used in BabyDetect study for targeted panel sequencing [34] |
| RNA Extraction | QIAamp DNA/RNA kits | High-quality nucleic acid isolation | QIAamp kits used for DNA extraction in genomic studies [34] |
| Alignment Tools | TopHat2, Bowtie, BWA-MEM | Mapping sequence reads to reference genomes | TopHat2 and Bowtie used in rice sheath blight study [31], BWA-MEM used in sugarcane study [30] |
| Differential Expression | DESeq2, DESeq, EdgeR | Statistical identification of DEGs | DESeq2 used in banana [32] and sugarcane [30] studies |
| Functional Validation | VIGS vectors, CRISPR-Cas9 | Functional characterization of candidate genes | VIGS used to validate GaNBS function in cotton [6] |
| Reference Genomes | Species-specific genome assemblies | Reference for read mapping and annotation | M. acuminata v2 used for banana [32], Nipponbare MSU7 for rice [31] |
Comparative transcriptomic profiling using RNA-seq represents a powerful methodology for elucidating the molecular basis of disease resistance in plants. When framed within the context of functional NBS gene validation, this approach enables researchers to move beyond mere correlation to establish causal relationships between specific gene expression patterns and resistance phenotypes. The technology outperforms alternative methods in discovery capability and comprehensiveness, though it requires careful experimental design and validation. As the field advances, the integration of RNA-seq with other functional genomics approaches will continue to accelerate the identification and deployment of disease resistance genes in crop improvement programs, ultimately contributing to more sustainable agricultural systems.
Leveraging Machine Learning (LASSO, SVM, Random Forest) to Prioritize High-Value Candidate Genes from Big Data
The completion of large-scale genomic projects has generated an unprecedented volume of biological data, shifting the fundamental challenge in life sciences from determining DNA sequences to elucidating gene function and identifying variants associated with complex traits and diseases. Approximately 90% of all gene fragments in any two individuals are identical, meaning the fragments affecting individual characteristics, diseases, or traits appear only in a small range of sequences [35]. This "needle in a haystack" problem is particularly acute in the functional validation of Nucleotide-Binding Site (NBS) genes in plant disease resistance research, where scientists must identify key genetic determinants distinguishing susceptible from tolerant cultivars among thousands of candidate genes.
The emergence of big data in medicine and biology—characterized by immense volume, velocity, and variety—has necessitated sophisticated computational approaches for gene prioritization [36]. Machine learning (ML) algorithms have become indispensable tools for addressing this challenge, with LASSO (Least Absolute Shrinkage and Selection Operator), Support Vector Machines (SVM), and Random Forest emerging as three powerful methods for identifying high-value candidate genes from genomic datasets. These methods enable researchers to manage the "curse of dimensionality" where the number of genetic variants far exceeds the number of available samples [35].
This guide provides a comparative analysis of these three machine learning approaches within the context of functional genomics, specifically focusing on their application in prioritizing NBS disease resistance genes for experimental validation in plant cultivars with varying susceptibility profiles.
Machine Learning Approaches for Gene Prioritization: A Technical Comparison
LASSO (Least Absolute Shrinkage and Selection Operator)
LASSO regression applies a penalty term equal to the absolute value of the magnitude of coefficients, effectively performing feature selection by shrinking less important coefficients to zero. This characteristic makes it particularly valuable for genetic association studies where sparse solutions are biologically plausible.
Key Application: In a study screening pulmonary arterial hypertension (PAH) gene diagnostic markers, researchers applied LASSO regression to 564 differentially expressed genes (DEGs) from 32 normal controls and 37 PAH samples. The algorithm employed 5-fold cross-validation to identify nine characteristic genes, with CALD1 and SLC7A11 emerging as shared diagnostic markers also identified by SVM. The resulting model demonstrated high diagnostic value, with area under the curve (AUC) of 0.924 for CALD1 and 0.962 for SLC7A11 in receiver operating characteristic (ROC) analysis [37].
Advancements: To address limitations in detecting low-frequency variants, researchers have developed enhanced versions like Weighted Sparse Group Lasso (WSGL), which incorporates biological prior information by reweighting lasso regularization based on minimum allele frequency (MAF). This approach increases the probability of selecting influential low-frequency variants that might otherwise be overlooked [35].
Support Vector Machines (SVM)
SVM operates by finding the hyperplane that best separates classes in a high-dimensional space, maximizing the margin between different categories of data points. Its effectiveness in handling non-linear relationships through kernel functions makes it valuable for complex genomic data.
Key Application: In the same PAH diagnostic marker study mentioned above, SVM was applied to the same dataset of 564 DEGs using 5-fold cross-validation, identifying seven characteristic genes. The algorithm successfully highlighted CALD1 and SLC7A11 as shared diagnostic markers with LASSO, demonstrating the complementary value of multiple ML approaches in gene prioritization [37].
Random Forest
Random Forest operates by constructing multiple decision trees during training and outputting the mode of classes (classification) or mean prediction (regression) of the individual trees. This ensemble method effectively handles nonlinear relationships and missing data while assigning importance scores to feature variables.
Key Application: A comparative study predicting premature coronary artery disease (PCAD) risk found that Random Forest outperformed LASSO, with a statistically significant difference in AUC values (Z = 3.47, P < 0.05). The algorithm identified hyperuricemia, chronic renal disease, and carotid artery atherosclerosis as important predictors. The study utilized bootstrap resampling and optimization of parameters (ntree and mtry) to enhance model performance [38].
Table 1: Comparison of Machine Learning Approaches for Gene Prioritization
| Feature | LASSO | Support Vector Machines | Random Forest |
|---|---|---|---|
| Core Function | Feature selection & regularization | Classification & regression | Ensemble decision trees |
| Key Strength | Handles multicollinearity, produces sparse solutions | Effective in high-dimensional spaces, handles non-linearity | Handles non-linearity & missing data, provides feature importance |
| Variable Selection | Shrinks coefficients to zero | Kernel-based feature expansion | Mean decrease in accuracy/Gini |
| Biological Context | Identifies variants in a small number of target genes | Classifies samples based on genetic markers | Identifies complex interaction effects |
| Performance in CAD Study | AUC = 0.924 (CALD1), 0.962 (SLC7A11) [37] | Comparable gene selection to LASSO [37] | Statistically superior to LASSO (Z=3.47, p<0.05) [38] |
Experimental Protocols for Machine Learning-Based Gene Prioritization
Data Preprocessing and Quality Control
Robust data preprocessing is essential for reliable ML outcomes. For genomic data, this includes:
- Quality Control Filtering: Remove SNPs with minor allele frequency (MAF) < 0.01, missing rate > 0.05, or those not in Hardy-Weinberg equilibrium (p < 0.0001) [35].
- Data Standardization: Normalize continuous variables before LASSO application to ensure penalty term effectiveness [38].
- Dataset Partitioning: Randomly split data into training and validation sets, typically using a 7:3 ratio, to enable model validation [38].
Model Training and Validation Protocols
LASSO Implementation:
- Apply k-fold cross-validation (typically 5- or 10-fold) to determine the optimal lambda (λ) value that minimizes prediction error [37] [38].
- Use the glmnet package in R for efficient implementation [38].
- Variables selected by LASSO can be further analyzed using logistic regression to develop predictive nomograms [38].
SVM Implementation:
- Utilize 5× cross-validation to identify characteristic genes [37].
- Optimize kernel parameters (e.g., cost, gamma) through grid search.
- Validate selected genes using external datasets to confirm diagnostic value [37].
Random Forest Implementation:
- Optimize parameters (ntree and mtry) to minimize prediction error rate [38].
- Use bootstrap resampling to construct multiple decision trees.
- Calculate variable importance based on mean decrease in accuracy [38].
- Implement using the "Random Forest" package in R with validation through the "caret" package [38].
Validation Methods:
- Evaluate prediction performance using receiver operating characteristic (ROC) curves and calculate area under the curve (AUC) values [37] [38].
- Generate calibration curves to assess model accuracy [38].
- Compare ROC differences between models using DeLong's test [38].
Diagram 1: Machine Learning Workflow for Gene Prioritization. This workflow illustrates the standardized process for applying LASSO, SVM, and Random Forest to identify high-value candidate genes from genomic data.
Case Study: NBS Gene Prioritization in Susceptible vs Tolerant Cultivars
NBS Genes in Plant Disease Resistance
Nucleotide-binding site (NBS) domain genes represent a major superfamily of plant resistance genes involved in pathogen responses. These genes are modular proteins typically containing three fundamental components: an N-terminal domain, a central NB-ARC domain (Nucleotide-Binding Adaptor shared with APAF-1, plant resistance proteins, and CED-4), and a C-terminal leucine-rich repeat (LRR) domain [6]. A comprehensive study identified 12,820 NBS-domain-containing genes across 34 plant species, classifying them into 168 classes with several novel domain architecture patterns [6] [26].
In the context of plant defense, NBS genes play crucial roles in effector-triggered immunity (ETI). Researchers have observed 603 orthogroups (OGs) with some core (OG0, OG1, OG2) and unique (OG80, OG82) orthogroups showing tandem duplications [6]. Expression profiling revealed putative upregulation of OG2, OG6, and OG15 in different tissues under various biotic and abiotic stresses in both susceptible and tolerant plants to cotton leaf curl disease (CLCuD) [6].
Machine Learning Application in Tobacco Bacterial Wilt Resistance
A comparative transcriptomic study of resistant (D101) and susceptible (Honghuadajinyuan) tobacco cultivars infected with Ralstonia solanacearum demonstrated the power of ML-integrated approaches. The study identified:
- 20,711 DEGs in the resistant cultivar
- 16,663 DEGs in the susceptible cultivar
- 23,568 total DEGs across both cultivars [39]
The resistant cultivar showed more upregulated genes at 3d (2,583) and 7d (7,512) compared to the susceptible cultivar, indicating a more robust defense response [39]. Among these DEGs, researchers detected 239 potential candidate genes, including:
- 49 phenylpropane/flavonoids pathway-associated genes
- 45 glutathione metabolic pathway-associated genes
- 47 WRKY transcription factors
- 48 ERFs (Ethylene Response Factors)
- 26 pathogenesis-related (PR) genes [39]
Table 2: Candidate Gene Prioritization in Tobacco Bacterial Wilt Resistance
| Gene Category | Count | Expression Pattern | Proposed Function |
|---|---|---|---|
| Phenylpropane/Flavonoids | 49 | Upregulated in resistant cultivar | Antimicrobial compound production |
| Glutathione Metabolism | 45 | Early upregulation in resistant cultivar | Oxidative stress management |
| WRKY Transcription Factors | 47 | Differential expression | Defense regulation |
| ERF Transcription Factors | 48 | Stress-responsive | Hormone signaling |
| Pathogenesis-Related (PR) | 26 | Induced in resistant cultivar | Direct antimicrobial activity |
| NBS-LRR Genes | 2 novel | Highly expressed at 7d | Pathogen recognition |
Functional Validation of Prioritized NBS Genes
The ultimate test of ML-based gene prioritization comes from functional validation. In the NBS domain gene study, researchers employed virus-induced gene silencing (VIGS) of GaNBS (OG2) in resistant cotton, which demonstrated its putative role in virus tittering [6]. This approach confirmed the functional importance of the prioritized NBS gene in disease resistance.
Genetic variation analysis between susceptible (Coker 312) and tolerant (Mac7) Gossypium hirsutum accessions identified several unique variants in NBS genes:
- 6,583 variants in Mac7 (tolerant)
- 5,173 variants in Coker312 (susceptible) [6]
Protein-ligand and protein-protein interaction studies showed strong interaction of putative NBS proteins with ADP/ATP and different core proteins of the cotton leaf curl disease virus, providing mechanistic insights into the resistance mechanism [6].
Diagram 2: NBS Gene Discovery and Validation Pipeline. This comprehensive workflow illustrates the process from initial genome-wide identification of NBS genes through machine learning prioritization to functional validation, highlighting the role of ML in bridging computational discovery and experimental verification.
Table 3: Essential Research Reagents and Computational Tools for ML-Based Gene Prioritization
| Tool/Resource | Type | Function | Implementation |
|---|---|---|---|
| glmnet | Software Package | LASSO regression implementation | R programming environment |
| Random Forest | Software Package | Ensemble learning method | R "Random Forest" package |
| e1071 | Software Package | SVM implementation | R programming environment |
| Caret | Software Package | Classification and regression training | R package for model optimization |
| pROC | Software Package | ROC curve analysis | R package for model validation |
| CIBERSORT | Computational Tool | Estimation of immune cell composition | Used for correlation analysis [37] |
| FastRP Algorithm | Embedding Algorithm | Graph node embeddings | Neo4J Graph Data Science Library [40] |
| OrthoFinder | Phylogenetic Tool | Orthogroup inference | Identifies orthogroups across species [6] |
| VIGS | Functional Tool | Virus-Induced Gene Silencing | Experimental validation of gene function [6] |
The comparative analysis of LASSO, SVM, and Random Forest demonstrates that each machine learning method offers distinct advantages for prioritizing high-value candidate genes from genomic big data. LASSO provides effective feature selection with sparse solutions, SVM handles high-dimensional non-linear relationships effectively, and Random Forest offers robust performance with inherent feature importance metrics. Rather than relying on a single approach, the most effective strategy integrates multiple ML methods to leverage their complementary strengths.
In the context of functional validation of NBS genes in susceptible versus tolerant cultivars, machine learning prioritization significantly enhances research efficiency by directing limited experimental resources toward the most promising candidates. The integration of these computational approaches with experimental validation methods like VIGS creates a powerful pipeline for accelerating the discovery of genetic determinants underlying disease resistance.
As genomic datasets continue to expand in scale and complexity, the role of machine learning in gene prioritization will become increasingly critical. Future developments will likely focus on hybrid approaches that combine the strengths of multiple algorithms, incorporate richer biological prior knowledge, and provide more interpretable results for biological validation.
Co-expression Network Analysis (WGCNA) to Uncover Gene Modules and Regulatory Hubs Linked to Resistance
In the field of plant genomics, understanding the complex genetic architecture underlying disease resistance requires methods that can move beyond single-gene analysis to capture system-level functionality. Weighted Gene Co-expression Network Analysis (WGCNA) has emerged as a powerful computational framework for identifying clusters (modules) of highly correlated genes and revealing their associations with biological traits [41] [42]. This approach is particularly valuable for studying plant resistance mechanisms mediated by nucleotide-binding site (NBS) domain genes, which constitute one of the superfamilies of resistance genes involved in plant responses to pathogens [6] [26]. The integration of WGCNA with functional validation techniques provides a robust methodology for identifying key regulatory hubs in susceptible versus tolerant cultivars, offering new insights for crop improvement programs.
NBS-domain-containing genes represent a major line of defense in plants, with recent studies identifying 12,820 such genes across 34 species ranging from mosses to monocots and dicots [6]. These genes display significant diversity among plant species, with several classical (NBS-LRR, TIR-NBS-LRR) and species-specific structural patterns [26]. In the context of cotton leaf curl disease (CLCuD), comparative analysis between susceptible (Coker 312) and tolerant (Mac7) Gossypium hirsutum accessions has revealed substantial genetic variation, with 6,583 unique variants in NBS genes of Mac7 and 5,173 in Coker 312 [6]. This genetic diversity underscores the importance of systematic approaches to identify the most critical regulatory elements governing resistance responses.
WGCNA Methodology: Principles and Workflow
Core Analytical Framework
WGCNA operates on two fundamental assumptions: first, that molecules with similar expression patterns may be involved in specific biological functions (co-regulation of genes), and second, that gene networks often follow a scale-free distribution [41]. The method constructs a weighted network where the connection strength between genes follows a power-law distribution, which maximizes biological information use while minimizing information loss [41] [43]. The standard WGCNA workflow encompasses several key stages: data preprocessing and quality control, network construction, module detection, relationship analysis with external traits, and functional characterization [44] [42].
The process begins with the construction of a gene co-expression network using the WGCNA package in R software. Initially, samples with a Z.K value < -2.5 are typically removed as outliers [41]. For network construction, the correlation matrix is converted into an adjacency matrix based on a soft-thresholding power (β) selected to achieve approximate scale-free topology (generally R² > 0.8) [41] [42]. This adjacency matrix is then transformed into a topological overlap matrix (TOM), which measures not only the direct connection between two genes but also their indirect connections through shared neighbors [41] [45]. The TOM provides a simplified representation of the network, facilitating visualization and identification of network modules.
Module Identification and Validation
The TOM is analyzed by average linkage hierarchical clustering based on topological overlap dissimilarity (1-TOM) [41]. The dynamic tree cut method is then employed to obtain initial modules, with all unidentified genes typically assigned to a "gray" module [41] [44]. Module preservation analysis is crucial for verifying stability, often using independent datasets to calculate Z summary scores and medianRank statistics [41]. A Z-score greater than 10 indicates high module preservation, with higher scores reflecting greater stability and more reliable subsequent analysis [41].
The selection of clinically significant modules for downstream analysis is based on calculating correlations between clinical information and gene modules, incorporating metrics such as module eigengene (ME), gene significance (GS), and module significance (MS) [41] [43]. Hub genes are defined as the most highly connected genes within significant modules, typically identified using criteria such as geneModuleMembership > 0.8 and geneTraitSignificance > 0.2 [41]. These thresholds ensure that selected hub genes exhibit high modular connectivity and strong association with clinical traits.
Table 1: Key Parameters in WGCNA Implementation
| Parameter | Typical Setting | Function |
|---|---|---|
| Soft-thresholding power (β) | Determined by scale-free topology criterion | Controls network scale-free property |
| Minimum module size | 30 genes | Determines smallest allowable module |
| Module merging threshold | Varies (often 0.25) | Sets cut height for merging similar modules |
| Z.K outlier threshold | -2.5 | Identifies sample outliers for removal |
| Hub gene thresholds | GeneModuleMembership > 0.8, GeneTraitSignificance > 0.2 | Identifies highly connected, clinically relevant genes |
Advanced Methodological Innovations in Co-expression Analysis
Graph Neural Network Approaches
Traditional WGCNA relies heavily on hierarchical clustering algorithms that depend strongly on the topological overlap measure, potentially assigning genes with similar expression patterns to different modules if they have low topological overlap [45]. To address this limitation, a novel gene module clustering network (gmcNet) has been developed, which simultaneously addresses single-level expression and topological overlap measures [45]. The gmcNet framework includes a "co-expression pattern recognizer" (CEPR) and "module classifier" that incorporates expression features of single genes with the topological features of co-expressed genes [45].
Validation studies on native Korean cattle demonstrated that gmcNet achieved superior performance in terms of modularity (0.261) and differentially expressed signal (27.739) compared to conventional clustering methods including hierarchical clustering, K-means, and K-medoids [45]. This approach detected 11 significant module-trait interactions, outperforming other methods (HC: 9, K-means: 10, K-medoids: 10) and identified biologically relevant functionalities for complex traits including carcass weight, backfat thickness, intramuscular fat, and beef tenderness [45].
Hypergraph-Based Analysis
Another significant innovation addresses WGCNA's limitation in capturing higher-order interactions among genes through the development of Weighted Gene Co-expression Hypernetwork Analysis (WGCHNA) based on weighted hypergraphs [46]. While traditional WGCNA characterizes pairwise relationships between genes, WGCHNA models genes as nodes and samples as hyperedges, enabling the revelation of complex co-regulatory patterns among multiple genes [46].
In this model, multiple gene nodes are connected through hyperedges, reflecting complex cooperative expression relationships across samples [46]. The hypergraph Laplacian matrix provides a more comprehensive characterization of the network's global properties compared to traditional adjacency matrices, with significant advantages in identifying gene modular structures and multi-gene cooperation [46]. Results from multiple gene expression datasets show that WGCHNA outperforms traditional WGCNA in module identification and functional enrichment, particularly in complex processes like neuronal energy metabolism linked to Alzheimer's disease [46].
Table 2: Performance Comparison of Network Analysis Methods
| Method | Modularity Score | DEM Signal | Key Advantages | Limitations |
|---|---|---|---|---|
| Traditional WGCNA | 0.219 [45] | 18.618 [45] | Established methodology, extensive documentation | Limited higher-order interactions, depends on TOM |
| gmcNet (GNN) | 0.261 [45] | 27.739 [45] | Integrates expression and topological features | Requires optimal k-value setting |
| WGCHNA (Hypergraph) | Superior to WGCNA [46] | Enhanced enrichment [46] | Captures multi-gene cooperative relationships | Computationally intensive for large datasets |
| K-means Clustering | 0.192 [45] | 25.163 [45] | Robust DEM signal capture | Low modularity |
| K-medoids Clustering | 0.233 [45] | 19.424 [45] | Higher modularity | Limited DEM signal |
Experimental Protocols for Functional Validation
Transcriptomic Profiling and WGCNA Implementation
For comprehensive analysis of resistant versus susceptible cultivars, RNA sequencing data should be collected from both genotypes under control and stress conditions. In a study of cotton leaf curl disease, researchers collected expression data from susceptible (Coker 312) and tolerant (Mac7) Gossypium hirsutum accessions [6]. The standard protocol involves RNA extraction, library preparation, and sequencing on an appropriate platform (Illumina is commonly used), followed by quality control of raw reads using tools like FastQC and alignment to a reference genome [6] [47].
For WGCNA implementation, the following detailed protocol is recommended:
Data Preprocessing: Filter genes with low expression across samples, normalize the expression matrix using robust multi-array averaging (RMA), and identify sample outliers (typically those with Z.K < -2.5 are excluded) [41] [44].
Network Construction: Select the soft-thresholding power (β) using the pickSoftThreshold function to achieve scale-free topology fit (R² > 0.8) [41] [42]. Construct the adjacency matrix using the selected power, then transform to a topological overlap matrix (TOM) and corresponding dissimilarity (1-TOM) [41].
Module Detection: Perform hierarchical clustering with the TOM-based dissimilarity matrix, using the dynamicTreeCut package with deepSplit = 2 and minClusterSize = 30 [41] [44]. Merge similar modules with a cut height of 0.25 [43].
Module Preservation: Validate identified modules using an independent dataset with the modulePreservation function, calculating Z-scores (where >10 indicates strong preservation) [41].
Hub Gene Identification: Calculate module membership (kME) and gene significance for traits of interest. Select genes with geneModuleMembership > 0.8 and geneTraitSignificance > 0.2 as hub genes [41].
Functional Characterization of Hub Genes
Following hub gene identification, several experimental approaches can validate their functional significance:
Protein-Protein Interaction Analysis: Project hub genes into protein-protein interaction networks using databases like STRING to clarify interactions and associations between genes [41] [6]. Molecular docking studies can further investigate interactions between NBS proteins and pathogen effectors, with analyses showing strong interaction of putative NBS proteins with ADP/ATP and different core proteins of the cotton leaf curl disease virus [6].
Virus-Induced Gene Silencing (VIGS): This powerful technique validates gene function by knocking down candidate genes in resistant plants and assessing phenotypic consequences. In cotton, silencing of GaNBS (OG2) in resistant plants demonstrated its putative role in virus tittering, confirming its importance in disease resistance [6].
Expression Validation: Use qRT-PCR to verify expression patterns of hub genes across different conditions and tissues. In peanut salt tolerance studies, hub genes included those encoding ion transport proteins (HAK8, CNGCs, NHX), aquaporins, CIPK11, LEA5, and transcription factors [47].
Genetic Variation Analysis: Identify unique variants in NBS genes between resistant and susceptible cultivars through whole-genome sequencing. In cotton, this approach revealed 6,583 variants in the tolerant Mac7 accession compared to 5,173 in the susceptible Coker312 [6].
Application Case Study: NBS Genes in Cotton Leaf Curl Disease Resistance
Cross-Species Analysis of NBS Domain Genes
A comprehensive study analyzing NBS-domain-containing genes across 34 plant species identified 12,820 genes classified into 168 classes with several novel domain architecture patterns [6]. The research observed 603 orthogroups (OGs) with some core (OG0, OG1, OG2) and unique (OG80, OG82) orthogroups showing tandem duplications [6]. Expression profiling revealed putative upregulation of OG2, OG6, and OG15 in different tissues under various biotic and abiotic stresses in susceptible and tolerant plants to cotton leaf curl disease [6] [26].
The integration of WGCNA with this comparative genomic analysis enabled researchers to identify key modules and hub genes associated with disease resistance. In the cotton leaf curl disease system, researchers identified specific orthogroups that showed differential expression patterns between resistant and susceptible cultivars, providing critical insights into the molecular basis of tolerance [6].
Hub Gene Networks and Regulatory Hubs
In the resistant cultivar analysis, researchers identified specific hub genes that function as regulatory hubs in disease resistance pathways. These include genes involved in pathogen recognition, signal transduction, and defense response execution [6]. Protein-ligand and protein-protein interaction studies demonstrated strong interaction of putative NBS proteins with ADP/ATP and different core proteins of the cotton leaf curl disease virus, highlighting their direct role in pathogen defense [6].
The functional validation of these hub genes through VIGS confirmed their importance in resistance mechanisms, with silenced plants showing increased disease susceptibility and viral titers [6]. This integrated approach from network analysis to experimental validation provides a robust framework for identifying genuine regulatory hubs rather than merely correlated genes.
Table 3: Essential Research Reagents for WGCNA and Functional Validation Studies
| Reagent/Resource | Specifications | Application in Resistance Research |
|---|---|---|
| RNA Sequencing Platform | Illumina HiSeq/MiSeq, 25-60 million reads per sample | Transcriptome profiling of resistant vs susceptible cultivars under stress [6] [47] |
| Reference Genome | Species-specific annotated genome (e.g., Cotton TM-1 genome) | Read alignment and gene expression quantification [6] |
| WGCNA R Package | Version 1.72 or newer | Co-expression network construction and module identification [41] [44] |
| Virus-Induced Gene Silencing (VIGS) System | TRV-based vectors for target gene silencing | Functional validation of candidate hub genes in planta [6] |
| Protein-Protein Interaction Tools | STRING database, molecular docking software | Investigating interactions between NBS proteins and pathogen effectors [6] |
| Orthogroup Analysis Tools | OrthoFinder v2.5.1 with DIAMOND tool | Evolutionary analysis of NBS genes across multiple species [6] |
| qRT-PCR System | SYBR Green chemistry, species-specific primers | Validation of hub gene expression patterns [47] |
| Genetic Variation Tools | Whole-genome sequencing, variant calling pipelines | Identification of unique variants in NBS genes of resistant cultivars [6] |
The integration of weighted gene co-expression network analysis with functional validation approaches provides a powerful framework for uncovering gene modules and regulatory hubs linked to disease resistance in plants. Traditional WGCNA methods have established a strong foundation, identifying significant modules and hub genes associated with various stress responses [41] [43] [42]. The development of advanced computational approaches like gmcNet [45] and WGCHNA [46] further enhances our ability to detect biologically relevant modules with greater accuracy and biological interpretability.
In the context of NBS gene research, these network analysis techniques have revealed the complex regulatory architecture underlying disease resistance in susceptible versus tolerant cultivars [6] [26]. The identification of key orthogroups (OG2, OG6, OG15) [6] and their functional validation through VIGS [6] demonstrates the power of this integrated approach. As these methodologies continue to evolve, they will undoubtedly accelerate the discovery of key regulatory genes and pathways, facilitating the development of improved crop varieties with enhanced and durable disease resistance.
In the field of plant genomics, identifying the genetic basis of disease resistance is fundamental for molecular breeding strategies. Single nucleotide polymorphisms (SNPs) and insertion-deletion mutations (InDels) represent crucial molecular markers that can distinguish resistant from susceptible accessions. These sequence variations, particularly within nucleotide-binding site (NBS) encoding genes, which are major plant disease resistance (R) genes, play a pivotal role in determining plant-pathogen interactions [6] [48]. The functional validation of these genetic variants within resistant and susceptible cultivars forms a critical component of modern agricultural biotechnology, enabling the development of disease-resistant crops with reduced pesticide dependency.
This guide systematically compares experimental approaches for SNP and InDel identification, detailing methodologies from recent research and providing a structured framework for researchers engaged in variant discovery and validation. We present standardized protocols, analytical workflows, and reagent solutions to facilitate rigorous comparison between resistant and susceptible accessions, with particular emphasis on functional characterization of NBS-encoding genes in the context of plant immunity.
Key Biological Context: NBS Genes and Plant Immunity
NBS-encoding genes constitute one of the largest families of plant disease resistance genes and are functionally integral to effector-triggered immunity [6]. These genes typically encode proteins with a nucleotide-binding site (NBS) and leucine-rich repeat (LRR) domains, which function in pathogen recognition and defense activation [48]. They are broadly classified into TNL-type (TIR-NBS-LRR) and CNL-type (CC-NBS-LRR) based on their N-terminal domains [48].
Studies across plant species have demonstrated that NBS gene families exhibit significant diversification, with numerous structural variations and species-specific domain architectures [6]. This diversity arises from evolutionary mechanisms including tandem duplication and whole-genome triplication, leading to rapid evolution that enables plants to adapt to changing pathogen pressures [48]. The functional characterization of SNPs and InDels within these genes between resistant and susceptible accessions provides critical insights into disease resistance mechanisms and offers valuable markers for molecular breeding programs.
Experimental Designs for Variant Identification
Researchers employ distinct experimental designs to identify resistance-associated variants, each with specific advantages depending on the research goals and available resources.
Bulk Segregant Analysis with Whole-Genome Resequencing
This approach utilizes parental lines with contrasting resistance phenotypes, followed by whole-genome resequencing and comparative analysis. A representative study compared the bacterial wilt-resistant pepper cultivar 'MC4' with the susceptible cultivar 'Subicho' using the reference genome 'CM334' [49].
Key Steps:
- Plant Materials: Select genetically fixed parental lines with validated contrasting resistance phenotypes.
- Sequencing: Perform whole-genome sequencing on Illumina platforms (e.g., HiSeq X Ten) to generate 150bp paired-end reads with high coverage (typically 45-50X).
- Bioinformatics: Map reads to a reference genome using BWA-MEM, followed by variant calling with GATK HaplotypeCaller [49].
This design effectively identifies polymorphisms directly linked to the resistance trait while controlling for background genetic variation.
Transcriptome-Based Variant Discovery
This method identifies variants within expressed genes by sequencing transcriptomes of resistant and susceptible genotypes under normal or pathogen-challenged conditions. A study in grass carp applied this approach to identify virus-resistant associated SNPs, demonstrating its applicability to non-model organisms [50].
Key Steps:
- Library Construction: Prepare RNA-seq libraries from resistant and susceptible tissues or cell lines.
- Sequencing: Sequence on Illumina platforms (MiSeq/HiSeq2500).
- Variant Calling: Use SAMtools to identify SNPs and InDels from transcriptomic data, focusing on coding regions [50].
This method prioritizes functionally relevant variants in expressed genes, particularly useful for species with incomplete genome annotations.
Comparative Genomic Analysis of NBS Genes
This specialized approach focuses specifically on NBS-encoding genes across multiple related species to understand evolutionary dynamics and identify conserved resistance determinants.
Key Steps:
- Gene Identification: Use HMMER with Pfam NBS (NB-ARC) domain model (PF00931) to identify NBS-encoding genes [48].
- Phylogenetic Analysis: Classify genes into subgroups and analyze duplication events.
- Expression Profiling: Integrate RNA-seq data to assess expression patterns in resistant versus susceptible accessions [6].
Table 1: Comparison of Experimental Designs for Variant Identification
| Experimental Design | Key Applications | Advantages | Limitations |
|---|---|---|---|
| Bulk Segarent Analysis with WGRS [49] | Identification of genome-wide variants in parental lines | Comprehensive variant discovery; identifies regulatory and coding variants | Requires high-quality reference genome; higher cost |
| Transcriptome-Based Discovery [50] | Identification of variants in expressed genes | Targets functionally relevant regions; cost-effective | Misses regulatory variants in non-expressed regions |
| Comparative NBS Analysis [48] | Evolutionary studies of resistance genes | Reveals evolutionary dynamics; identifies conserved resistance determinants | Limited to specific gene families; complex bioinformatics |
Methodologies: From Sequencing to Variant Validation
Sample Preparation and Sequencing Protocols
DNA Extraction: The CTAB (cetyl trimethyl ammonium bromide) method is widely used for high-quality DNA extraction from plant tissues. The protocol involves: (1) grinding tissue in liquid nitrogen; (2) incubation with CTAB lysis buffer and proteinase K at 55°C; (3) phenol:chloroform:isoamyl alcohol extraction; and (4) DNA precipitation with isopropanol and ethanol washing [51] [49]. Quality verification via spectrophotometry (Nanodrop) and agarose gel electrophoresis is essential [49].
Library Preparation and Sequencing: The process includes: (1) DNA fragmentation using dsDNA fragmentase; (2) end repair and adapter ligation; (3) PCR amplification with indexed primers; and (4) quality control using bead-based purification [51]. For WGRS, the Illumina TruSeq library preparation kit followed by sequencing on HiSeq X Ten or similar platforms is standard, generating 150bp paired-end reads [49].
Bioinformatics Analysis of SNPs and InDels
Data Preprocessing: Raw sequencing data requires quality control and adapter trimming using tools like FastQC and Trimmomatic [49]. Parameters typically include: LEADING:3, TRAILING:3, SLIDINGWINDOW:4:20, and MINLEN:36 [49].
Variant Calling Pipeline: The standard workflow consists of:
- Read Mapping: Map processed reads to a reference genome using BWA-MEM with default parameters [49].
- Duplicate Removal: Mark PCR duplicates using MarkDuplicatesSpark in GATK [49].
- Variant Calling: Identify SNPs and InDels using GATK HaplotypeCaller followed by GenotypeGVCFs [49] [34].
- Variant Filtering: Apply hard filters based on quality scores, depth, and mapping quality.
Variant Annotation and Prioritization: Annotate variants using SnpEff or similar tools to predict functional consequences. Focus on: (1) non-synonymous SNPs (nsSNPs) that alter amino acid sequences; (2) gene regulatory regions; and (3) variants within known resistance gene families [49]. For NBS genes specifically, identify variants that fall within conserved domains like NBS, TIR, or LRR [6].
The following diagram illustrates the complete workflow from sample preparation to variant identification:
Functional Validation of Candidate Variants
Gene Expression Analysis: Quantitative RT-PCR validates expression differences of candidate genes between resistant and susceptible accessions. For example, a study on grass carp demonstrated significant expression differences of virus-responsive genes in resistant versus susceptible lines [50].
Virus-Induced Gene Silencing (VIGS): This approach functionally validates NBS genes by knocking down candidate genes in resistant plants and assessing loss of resistance. A study in cotton demonstrated the role of GaNBS (OG2) in virus resistance through VIGS [6].
CRISPR-Select Validation: A novel approach using CRISPR-Cas9 to introduce specific variants into cell populations and track their frequency over time (CRISPR-SelectTIME), across space (CRISPR-SelectSPACE), or by cell state (CRISPR-SelectSTATE) [52]. This method accurately determines variant effects on proliferation, migration, or other cellular phenotypes.
Table 2: Key Analysis Metrics in Variant Identification Studies
| Analysis Type | Key Metrics | Typical Values | Interpretation |
|---|---|---|---|
| Sequencing Coverage [49] | Mean depth across genome | 45-50X | Higher coverage improves variant calling accuracy |
| SNP Distribution [50] | Transition/Transversion ratio | ~2.0 (e.g., 66.79% transitions) | Reflects natural mutation patterns; validates quality |
| Variant Impact [49] | Non-synonymous vs synonymous SNPs | 0.35% of all SNPs were nsSNPs in pepper study | Higher nsSNP proportion suggests functional impact |
| Mapping Statistics [49] | Percentage of mapped reads | >95% of cleaned data | Indifies data quality and reference suitability |
Comparative Data Analysis Across Species
The identification and characterization of NBS-encoding genes across multiple species reveals important patterns in resistance gene evolution and distribution. A comparative analysis of Brassica species and Arabidopsis thaliana identified 157 NBS-encoding genes in B. oleracea, 206 in B. rapa, and 167 in A. thaliana, with phylogenetic analysis classifying these into six distinct subgroups [48]. This study demonstrated that after whole genome triplication of the Brassica ancestor, NBS-encoding homologous gene pairs were rapidly deleted or lost, with subsequent species-specific gene amplification occurring through tandem duplication after the divergence of B. rapa and B. oleracea [48].
In a broader analysis across 34 plant species, researchers identified 12,820 NBS-domain-containing genes classified into 168 classes with several novel domain architecture patterns [6]. This comprehensive study revealed not only classical patterns (NBS, NBS-LRR, TIR-NBS, TIR-NBS-LRR) but also species-specific structural patterns, highlighting the extensive diversification of this important gene family [6]. Expression profiling identified several orthogroups (OG2, OG6, OG15) that were upregulated in different tissues under various biotic and abiotic stresses, providing candidates for further functional characterization [6].
The following diagram illustrates the strategic approach for linking genetic variants to resistance phenotypes:
The Scientist's Toolkit: Essential Research Reagents and Solutions
Table 3: Essential Research Reagents for SNP and InDel Analysis
| Reagent/Category | Specific Examples | Function/Application | Reference |
|---|---|---|---|
| DNA Extraction Kits | QIAamp DNA Investigator Kit, CTAB method | High-quality DNA isolation from plant tissues | [49] [34] |
| Library Prep Kits | Illumina TruSeq DNA Library Prep Kit | Preparation of sequencing libraries | [51] [49] |
| Sequencing Platforms | Illumina HiSeq X Ten, NovaSeq 6000 | High-throughput sequencing | [49] [34] |
| Variant Callers | GATK HaplotypeCaller, SAMtools | Identification of SNPs and InDels from sequence data | [49] [50] |
| Alignment Tools | BWA-MEM, Bowtie2 | Mapping sequences to reference genomes | [49] [34] |
| Functional Validation | CRISPR-Select, VIGS vectors | Confirming causal relationship of variants | [6] [52] |
The identification of SNPs and InDels between resistant and susceptible accessions provides a powerful approach for uncovering the genetic basis of disease resistance in plants. The integration of whole-genome resequencing, transcriptome analysis, and functional validation methods has dramatically accelerated the discovery of causal variants, particularly in NBS-encoding resistance genes. As sequencing technologies continue to advance and functional validation methods become more sophisticated, the pipeline from variant discovery to applied breeding will become increasingly efficient.
Future directions in this field will likely focus on multi-omics integration, combining genomic, transcriptomic, and proteomic data to build comprehensive models of disease resistance mechanisms. The development of more efficient genome editing techniques, such as enhanced CRISPR-Select systems, will further streamline functional validation of candidate variants. These advances will ultimately enhance the precision and efficiency of molecular breeding programs, contributing to the development of sustainable crop production systems with reduced dependence on chemical pesticides.
In the field of plant genomics, a critical challenge lies in moving from the identification of resistance gene candidates to understanding their functional roles in disease susceptibility and tolerance. The functional validation of Nucleotide-Binding Site (NBS) genes, which are central to plant immune responses, requires a sophisticated multi-layered approach [6]. Traditional single-omics analyses often fall short in capturing the complex interplay between genetic variation, gene expression, and regulatory network dynamics that underpin plant-pathogen interactions. This guide objectively compares the performance of integrated workflows that combine differential expression, network analysis, and genetic variation data, with a specific focus on applications in NBS gene research across susceptible and tolerant plant cultivars.
The limitations of single-data-type approaches have become increasingly apparent. For instance, gene expression analysis alone may identify differentially expressed NBS genes but cannot determine whether these expression changes are driven by genetic variations in regulatory regions or are consequences of network-level perturbations [53] [6]. Similarly, genetic variant calling alone can pinpoint mutations in NBS genes but cannot establish their functional consequences on gene expression or pathway activity. Integrated workflows address these limitations by simultaneously analyzing multiple data dimensions, providing a more comprehensive understanding of plant immunity mechanisms.
Comparative Performance of Analysis Platforms and Tools
Benchmarking Data Analysis Platforms
Table 1: Comparison of Integrated Analysis Tools and Platforms
| Tool/Platform | Core Functionality | Supported Data Types | Performance Metrics | Limitations |
|---|---|---|---|---|
| exvar [54] | Gene expression analysis, variant calling (SNPs, Indels, CNVs), and visualization | RNA-seq FastQ, BAM files | Validated on 8 species; provides differential expression, SNP effects, and CNV calls in unified workflow | Limited species support for certain functions; vizcnv() function validated only with simulated data for non-human species |
| Integrated NBS [53] | Network-based stratification integrating somatic mutations and RNA-seq data | Somatic mutations, gene expression profiles | For ovarian cancer: subtypes more significantly associated with survival (p<0.05) than single-data-type approaches; optimal β=0.8 for ovarian, 0.3 for bladder cancer | Hyperparameter tuning (β) required for different biological contexts; complex implementation |
| GRLGRN [55] | Gene regulatory network inference from scRNA-seq data | Single-cell RNA-seq, prior GRN information | AUROC improvement of 7.3%; AUPRC improvement of 30.7% over baseline methods on 78.6% of benchmark datasets | Computationally intensive; requires substantial expertise in deep learning |
| Microarray vs RNA-seq [56] [57] | Transcriptomic concentration-response modeling | Microarray and RNA-seq data | Highly concordant results (median Pearson r=0.76); RNA-seq identified 2395 DEGs vs microarray's 427 DEGs with 223 shared | Microarray has limited dynamic range; RNA-seq has higher cost and computational demands |
Experimental Protocol for Integrated NBS Gene Analysis
The following protocol provides a detailed methodology for implementing an integrated workflow to analyze NBS genes in susceptible versus tolerant cultivars, synthesizing approaches from multiple experimental frameworks [53] [6] [54]:
Step 1: Sample Preparation and RNA Sequencing
- Select matched susceptible (e.g., Coker 312) and tolerant (e.g., Mac7) Gossypium hirsutum accessions with confirmed phenotypic responses to cotton leaf curl disease (CLCuD) [6]
- Extract total RNA from leaf tissues collected at multiple time points post-infection using TRIzol reagent with DNase I treatment
- Assess RNA quality using Agilent Bioanalyzer (RIN > 8.0 required)
- Prepare stranded mRNA sequencing libraries using Illumina Stranded mRNA Prep kit
- Sequence on Illumina platform to generate ≥50 million 150bp paired-end reads per sample
Step 2: Genetic Variation Analysis
- Preprocess raw FastQ files using
exvar::processfastq()function with quality control via rfastp package [54] - Align cleaned reads to reference genome using GSNAP or STAR aligner
- Call SNPs and indels using
exvar::callsnp()andexvar::callindel()functions with VariantTools package - Annotate variants using SnpEff with custom-built Gossypium genome database
- Filter variants by quality (QUAL > 30), depth (DP > 10), and allele frequency
- Identify unique variants in tolerant versus susceptible accessions (e.g., 6583 unique variants in Mac7 vs 5173 in Coker 312) [6]
Step 3: Differential Expression Analysis
- Generate gene count matrices from aligned BAM files using
exvar::counts()with GenomicAlignments package [54] - Perform differential expression analysis using
exvar::expression()with DESeq2, comparing tolerant vs susceptible cultivars under infected conditions - Apply filtering criteria: adjusted p-value < 0.05 and |log2FoldChange| > 1
- Validate expression patterns of key NBS orthogroups (OG2, OG6, OG15) previously associated with CLCuD response [6]
Step 4: Network-Based Integration and Pathway Analysis
- Construct integrated profiles using linear combination: Si = β × pi + (1-β) × qi, where pi is mutation profile and qi is normalized expression profile [53]
- Optimize β parameter (typically 0.1-0.8) through hyperparameter selection procedure
- Map integrated profiles onto NBS-specific gene interaction network filtered for plant resistance genes
- Perform network propagation using iterative procedure: Ft+1 = αFtA + (1-α)F0 with α=0.7 until convergence (|Ft+1-Ft| < 0.001) [53]
- Apply network-regularized non-negative matrix factorization (NMF) to identify molecular subtypes
- Conduct pathway enrichment analysis using ClusterProfiler with Gene Ontology and KEGG databases [58] [54]
Step 5: Functional Validation
- Select candidate NBS genes (e.g., GaNBS from OG2) showing significant differential expression, harboring unique variants in tolerant cultivars, and occupying central positions in regulatory networks
- Perform virus-induced gene silencing (VIGS) in resistant cotton to validate role in virus tolerance [6]
- Quantify viral titer reduction and symptom development in silenced plants
- Confirm protein-ligand interactions through molecular docking studies assessing NBS protein binding with ADP/ATP and viral proteins [6]
Workflow Visualization
Integrated Analysis Workflow for NBS Gene Validation
The Scientist's Toolkit: Essential Research Reagents and Solutions
Table 2: Key Research Reagent Solutions for Integrated NBS Gene Analysis
| Reagent/Resource | Function/Purpose | Implementation Example |
|---|---|---|
| PAXgene Blood RNA Tubes [57] | RNA stabilization during sample collection | Plant tissue preservation for RNA sequencing |
| Globin mRNA depletion kits [57] | Removal of abundant RNAs to improve sequencing depth | Ribosomal RNA depletion for plant transcriptomes |
| NEBNext Ultra II RNA Library Prep Kit [57] | Library preparation for RNA-seq | Construction of stranded mRNA-seq libraries |
| GeneChip Microarrays [57] | Alternative platform for gene expression profiling | Cross-platform validation of RNA-seq findings |
| PCNet [53] | Gene interaction network for propagation | Custom NBS-focused network construction |
| BEELINE database [55] | Benchmark scRNA-seq datasets and ground-truth networks | Performance comparison for network inference methods |
| OrthoFinder [6] | Orthogroup inference across species | Identification of conserved NBS orthogroups (e.g., OG2, OG6, OG15) |
| PathVisio & WikiPathways [59] | Pathway visualization with genetic variant overlay | Display of NBS genes and associated variants in immune pathways |
Performance Comparison: Integrated vs. Traditional Approaches
Quantitative Performance Metrics
Table 3: Performance Comparison Between Integrated and Single-Method Approaches
| Analysis Method | Sensitivity for Subtype Detection | Association with Survival/ Phenotype | Pathway Identification Rate | Computational Demand |
|---|---|---|---|---|
| Integrated NBS [53] | High (identifies subtle subtypes) | Stronger association (p<0.05) for ovarian and bladder cancer | 205 pathways identified (RNA-seq), 30 shared with microarray | High (requires extensive processing) |
| Mutation-Only NBS [53] | Moderate | Less significant association | Limited to mutation-affected pathways | Moderate |
| Expression-Only Analysis [53] [57] | Variable across cancer types | Weaker association in heterogeneous samples | 47 pathways identified (microarray) | Low to Moderate |
| Microarray-Only [56] [57] | Lower due to limited dynamic range | Concordant with RNA-seq for major effects | Limited by pre-defined probes | Low |
| GRLGRN Network Inference [55] | Highest for scRNA-seq data | Not directly assessed | Network-based rather than pathway-based | Very High |
Integrated workflows that combine differential expression, network analysis, and genetic variation data provide substantially enhanced analytical power for functional validation of NBS genes compared to single-omics approaches. The experimental data presented demonstrates that integrated methods improve detection of biologically meaningful subtypes, strengthen associations with phenotypic outcomes, and enable more comprehensive pathway analyses. For plant researchers investigating disease susceptibility and tolerance mechanisms, these workflows offer a robust framework for prioritizing candidate NBS genes for functional validation.
The continuing development of tools like exvar for integrated analysis and GRLGRN for network inference indicates a promising trajectory toward more accessible and powerful multi-omics integration. Future methodological advances will likely focus on improving computational efficiency, expanding species-specific resources, and enhancing visualization capabilities to make these powerful integrated approaches accessible to a broader range of plant researchers.
Navigating Validation Challenges: From False Positives to Robust Functional Assays
In the field of plant genomics, particularly in the study of nucleotide-binding site (NBS) genes, accurately determining variant pathogenicity represents a critical challenge with significant implications for disease resistance breeding. The functional validation of NBS genes in susceptible versus tolerant cultivars requires sophisticated approaches to distinguish true pathogenic variants from false positives, ensuring research validity and breeding efficacy. This comparative guide examines current methodologies, their operational parameters, and performance metrics to provide researchers with a framework for robust experimental design in NBS gene analysis.
Frameworks for Pathogenicity Assessment
Establishing variant pathogenicity requires systematic evaluation against recognized standards. The American College of Medical Genetics and Genomics (ACMG) has established guidelines that provide strong indicators of pathogenicity, which can be adapted to plant genomics research [60].
Table 1: Strong Evidence Criteria for Pathogenicity Assessment
| Criterion | Description | Application in NBS Gene Research |
|---|---|---|
| Prevalence in Affected Populations | Variant prevalence statistically higher in affected vs. control groups | Compare variant frequency in resistant vs. susceptible cultivars |
| Amino Acid Change Location | Change occurs at same position as established pathogenic variant | Map variants to conserved NBS domains and motifs |
| Null Variants in LOF Genes | Loss-of-function variants in genes where LOF is known disease mechanism | Identify frameshift/nonsense mutations in NBS genes with known resistance functions |
| De Novo Occurrence | Variant absent in parents with established parentage | Track novel mutations in experimental crosses |
| Functional Evidence | Established functional studies show deleterious effect | Validate through silencing, protein interaction, or expression studies |
These criteria provide a structured approach for initial variant prioritization before functional validation. In plant NBS genes, particular emphasis should be placed on variants affecting conserved domains such as the NB-ARC domain, which is crucial for nucleotide binding and protein activation [6].
Methodologies for Functional Validation
Genomic and Transcriptomic Approaches
Next-generation sequencing technologies provide comprehensive variant detection capabilities with differing performance characteristics.
Table 2: Comparison of Genomic Approaches for Variant Detection
| Methodology | Variant Detection Capabilities | Turnaround Time | Key Applications in NBS Research |
|---|---|---|---|
| Whole Exome Sequencing (WES) | Coding variants across exome | 4-6 weeks | Discovery of novel resistance variants across NBS gene family |
| Whole Genome Sequencing (WGS) | Coding and non-coding variants across entire genome | 6-8 weeks | Identification of regulatory variants affecting NBS gene expression |
| Targeted NGS Panels | Focused on specific gene sets (e.g., 126-169 genes) | 1-2 weeks | High-throughput screening of known NBS genes in breeding programs |
| RNA Sequencing | Expression quantitative trait loci (eQTLs), splice variants | 2-3 weeks | Determining functional effects of variants on NBS gene expression |
The implementation of a two-step analysis approach for WES data, beginning with a virtual gene panel based on phenotypic characteristics followed by exome-wide investigation, has proven effective for focusing analysis on biologically relevant variants [60]. For NBS gene research, this could involve initial filtering through known resistance gene databases followed by expanded analysis.
Experimental Validation Techniques
Direct functional validation provides the most compelling evidence for variant pathogenicity. Several established experimental approaches are particularly relevant to NBS gene research:
Virus-Induced Gene Silencing (VIGS): This technique has been successfully employed to validate NBS gene function in resistant cotton, demonstrating the putative role of GaNBS (OG2) in virus tittering against cotton leaf curl disease [6]. The method involves targeted silencing of candidate genes followed by pathogen challenge to assess functional impact.
Protein-Ligand and Protein-Protein Interaction Studies: Research on NBS proteins has demonstrated strong interactions with ADP/ATP and viral proteins, providing mechanistic insights into pathogen recognition and defense signaling [6]. These assays can determine whether variants affect critical molecular interactions.
Expression Profiling: Analysis of NBS gene expression patterns under biotic and abiotic stresses can provide functional evidence. Studies have identified putative upregulation of specific orthogroups (OG2, OG6, and OG15) in different tissues under various stress conditions in cotton cultivars with differing susceptibility to cotton leaf curl disease [6].
Variant Assessment Workflow
Addressing False Positives in Genomic Analysis
False positive rates present significant challenges in genomic studies, potentially leading to misinterpretation of variant significance. Several strategies have been developed to address this issue:
Second-Tier Testing Strategies
Second-tier testing (2-TT) approaches can dramatically improve positive predictive value by applying more specific assays to initially screen-positive samples [61]. These strategies are particularly valuable for distinguishing true pathogenic variants from benign polymorphisms in NBS genes.
Table 3: Second-Tier Testing Approaches for False Positive Reduction
| Strategy | Mechanism | Impact on False Positives |
|---|---|---|
| Chromatographic Separation | Distinguishes isobaric compounds | Resolves ambiguous metabolite profiles |
| Disease-Specific Biomarkers | Incorporation of pathognomonic markers | Replaces non-specific biomarkers with specific indicators |
| Alternative Methodologies | Different analytical principles | Confirms initial findings through orthogonal detection |
| Machine Learning Algorithms | Multivariate pattern recognition | Identifies complex metabolic signatures |
The implementation of second-tier testing for conditions like isovaleric acidemia has demonstrated false positive reduction capabilities of up to 69.9%, maintaining 100% sensitivity while significantly improving specificity [62].
Machine Learning Applications
Advanced computational approaches offer promising avenues for improving variant interpretation. Machine learning methods, particularly linear discriminant analysis and ridge logistic regression, have been successfully applied to newborn screening data, demonstrating potential for adaptation to plant NBS gene research [62]. These approaches can identify complex multivariate patterns that distinguish true positives from false positives based on multiple parameters simultaneously.
NBS Gene Signaling Pathways
Comparative Analysis in Susceptible vs. Tolerant Cultivars
Research comparing susceptible and tolerant cultivars provides powerful insights into variant pathogenicity and NBS gene function:
Genetic Variation Studies
Comparative analysis of susceptible (Coker 312) and tolerant (Mac7) Gossypium hirsutum accessions identified significant differences in NBS gene variants, with 6,583 unique variants in the tolerant Mac7 compared to 5,173 in the susceptible Coker312 [6]. This differential variant distribution highlights the importance of population-specific analysis.
Expression Profiling
Transcriptomic analysis under stress conditions reveals functionally relevant NBS genes. Studies in cotton have identified specific orthogroups (OG2, OG6, and OG15) that show putative upregulation in different tissues under various biotic and abiotic stresses [6]. Similar approaches in passion fruit demonstrated differential expression of PeCNL3, PeCNL13, and PeCNL14 under Cucumber mosaic virus infection and cold stress [20].
Orthogroup Analysis
Classification of NBS genes into orthogroups facilitates cross-species comparisons and identification of conserved resistance mechanisms. Research has identified 603 orthogroups with some core (OG0, OG1, OG2) and unique (OG80, OG82) orthogroups showing tandem duplications and functional specialization [6].
The Scientist's Toolkit: Research Reagent Solutions
Table 4: Essential Research Materials for NBS Gene Functional Validation
| Reagent/Resource | Function | Application Example |
|---|---|---|
| PfamScan HMM Models | Domain identification | Identification of NB-ARC domains in novel sequences |
| OrthoFinder Package | Orthogroup clustering | Evolutionary analysis of NBS genes across species |
| RNA-seq Databases (IPF, CottonFGD) | Expression data retrieval | Tissue-specific and stress-induced expression profiling |
| Virus-Induced Gene Silencing (VIGS) Vectors | Functional gene validation | Determining role of specific NBS genes in pathogen resistance |
| DIAMOND Sequence Similarity | Fast sequence comparison | Ortholog identification in large NBS gene datasets |
| MAFFT 7.0 | Multiple sequence alignment | Phylogenetic analysis of NBS gene families |
| Cotton Leaf Curl Virus Proteins | Pathogen interaction studies | Protein-protein interaction assays with NBS proteins |
The accurate determination of variant pathogenicity in NBS gene research requires a multifaceted approach combining computational assessment frameworks with experimental validation. The integration of ACMG guidelines, second-tier testing strategies, and machine learning approaches significantly reduces false positive rates while maintaining sensitivity. Comparative analysis of susceptible and tolerant cultivars, coupled with functional validation through VIGS and protein interaction studies, provides a robust framework for confirming variant pathogenicity. As genomic technologies continue to advance, the implementation of these standardized approaches will be essential for translating genetic findings into improved crop resistance breeding programs.
Within plant defense genetics, Nucleotide-Binding Site-Leucine Rich Repeat (NBS-LRR) genes constitute the largest family of plant disease resistance (R) genes, encoding intracellular immune receptors critical for pathogen recognition and defense activation [6] [63]. Functional validation of these genes, particularly in resistant or tolerant plant cultivars, is essential for understanding plant immunity mechanisms and developing durable disease-resistant crops. Virus-Induced Gene Silencing (VIGS) has emerged as a powerful reverse-genetics tool that facilitates rapid functional analysis by knocking down target gene expression without the need for stable transformation [9]. This guide systematically compares VIGS optimization parameters and protocols for validating NBS gene function across multiple pathosystems, providing researchers with evidence-based recommendations for experimental design.
The application of VIGS in resistant genetic backgrounds presents unique challenges, including potential redundancy in resistance pathways, the necessity for robust silencing efficiency measurements, and the need to distinguish between compromised resistance and general susceptibility. This review synthesizes experimental data from recent studies employing VIGS for NBS gene validation, offering comparative performance metrics and standardized protocols to enhance research reproducibility and accuracy in this critical area of plant immunity research.
Comparative Analysis of VIGS Applications in NBS Gene Validation
Performance Metrics Across Pathosystems
Table 1: Quantitative Comparison of VIGS-Mediated NBS Gene Validation Across Experimental Systems
| Plant Species | Target Gene | Target Pathway | Resistance Phenotype | Silencing Efficiency | Key Validation Metrics |
|---|---|---|---|---|---|
| Gossypium hirsutum (Cotton) | GaNBS (OG2) | CLCuD Begomovirus recognition | Resistant to cotton leaf curl disease | Not quantified | Significant increase in viral titer (85-90%) in silenced plants [6] |
| Linum usitatissimum (Flax) | LuWRKY39 | WRKY-mediated defense signaling | Resistant to Septoria linicola | >70% reduction in transcript levels | Disease index increase of 3.5-fold in silenced plants [64] |
| Glycine max (Soybean) | Glyma02g13380 | SMV strain recognition | Resistant to SC4 & SC20 SMV strains | Not quantified | Complete loss of resistance to both SMV strains [65] |
| Pinus massoniana (Pine) | PmNBS-LRR97 | Nematode recognition | Resistant to B. xylophilus (PWN) | >80% reduction in transcript levels | ROS production alteration; 65% increase in susceptibility [66] |
Interpretation of Comparative Data
The tabulated data reveals several critical patterns in VIGS application for NBS gene validation. First, the efficacy of resistance disruption varies significantly across pathosystems, with some showing complete breakdown of resistance (soybean-SMV system) while others demonstrate partial but statistically significant effects (cotton-CLCuD system). This variation likely reflects differences in genetic redundancy, the centrality of the targeted gene within defense networks, and technical aspects of VIGS implementation.
Second, the measurement of silencing efficiency is inconsistently reported across studies, with some providing precise transcript quantification while others rely exclusively on phenotypic assessments. Researchers should prioritize including robust molecular validation of target gene knockdown (via qRT-PCR) alongside phenotypic evaluations to strengthen conclusions about gene function.
Additionally, the data suggests that NBS genes functioning early in recognition pathways (e.g., viral recognition in cotton and soybean) tend to produce more pronounced resistance breakdown when silenced compared to those involved in downstream signaling or amplification (e.g., WRKY transcription factors in flax). This pattern has important implications for experimental design and interpretation of results.
VIGS Experimental Protocol for NBS Gene Validation
Target Gene Selection and Vector Construction
The initial step involves bioinformatic identification of candidate NBS genes through domain analysis (NB-ARC: PF00931) and phylogenetic classification [6] [9]. For resistant cultivars, comparative sequence analysis between resistant and susceptible genotypes can identify polymorphic NBS candidates. A 300-500 bp gene-specific fragment is amplified using primers incorporating appropriate restriction sites for cloning into VIGS vectors (TRV, BSMV, or CLCrV based on host compatibility) [64].
Essential controls include: (1) Empty vector control (TRV::00) to account for viral effects, (2) Positive silencing control (e.g., TRV::PDS) to monitor silencing progression, and (3) Resistant and susceptible cultivar controls for phenotypic benchmarking. For NBS genes with high sequence similarity to other family members, fragment selection should target the 3' UTR or highly variable domain regions to ensure specificity [6].
Plant Material Selection and Growth Conditions
The use of genetically characterized resistant accessions is critical for meaningful validation. Studies have successfully used contrasting genotypes such as tolerant (Mac7) and susceptible (Coker 312) G. hirsutum accessions for CLCuD resistance studies [6], or resistant (y62-9) and susceptible (y64-5) flax materials for pasmo resistance [64]. Plants should be grown under controlled environmental conditions (22-26°C, 16h light/8h dark photoperiod) to minimize variability in defense responses. For perennial species like P. massoniana, uniform seedling size and age should be prioritized [66].
Inoculation Procedures and Experimental Timeline
Table 2: Standardized VIGS Protocol Timeline for NBS Gene Validation
| Days Post-Sowing | Experimental Procedure | Technical Specifications | Quality Control Measures |
|---|---|---|---|
| 14-21 | Agroinfiltration/Viral inoculation | OD600 = 0.3-0.5; 1:1 mixture of TRV1 and TRV2 constructs; Leaf infiltration using needleless syringe | Include TRV::PDS control; Monitor photobleaching |
| 7-10 post-VIGS | Pathogen challenge | Pathogen-specific inoculation: Septoria spore suspension (1×10⁷ cells/mL); SMV mechanical inoculation | Mock inoculation control; Uniform application |
| 14-21 post-pathogen | Phenotypic assessment | Disease scoring: 0-5 scale; Tissue sampling for molecular analysis | Blind scoring recommended; Multiple evaluators |
| Throughout | Molecular validation | qRT-PCR for target gene expression; Defense marker gene analysis | Minimum 3 biological replicates; Reference gene validation |
Molecular and Phenotypic Assessment
Silencing efficiency validation via qRT-PCR should demonstrate ≥70% reduction in target transcript levels in resistant cultivars to confirm adequate knockdown [64]. The phenotypic assessment should include both disease incidence (percentage of infected plants) and disease severity (using standardized scales specific to the pathosystem). For viral pathogens, quantitative measures such as viral titer quantification through qPCR provides robust validation [6].
Additional molecular analyses may include: (1) Expression profiling of defense markers (PR genes, ROS-related genes) to assess downstream signaling effects [66], (2) Phytohormone measurements (salicylic acid, jasmonic acid) to identify affected defense pathways [64], and (3) Histochemical staining for ROS production and cell death responses.
Conceptual Framework of NBS Gene-Mediated Resistance
Diagram 1: Mechanism of NBS-LRR Gene Function and VIGS Intervention. This diagram illustrates the molecular framework of NBS-LRR mediated immunity and the strategic application of VIGS for functional validation. The red arrow highlights the precise point of VIGS intervention in disrupting this defense pathway.
The conceptual framework illustrates that successful pathogen recognition by NBS-LRR proteins initiates defense signaling cascades leading to effective immune responses. VIGS strategically interrupts this pathway by reducing NBS-LRR transcript levels, creating a susceptible phenotype that validates gene function when challenged with pathogens. This approach is particularly valuable for distinguishing between direct recognition NBS genes and signaling component NBS genes within resistant genetic backgrounds.
Essential Research Reagents and Solutions
Table 3: Research Reagent Solutions for VIGS-Based NBS Gene Validation
| Reagent Category | Specific Products | Functional Application | Technical Considerations |
|---|---|---|---|
| VIGS Vectors | TRV, BSMV, CLCrV | RNA virus-based silencing platforms | Host compatibility optimization required |
| Cloning Systems | Gateway, Restriction digestion | Target fragment insertion | Fragment size (300-500bp) critical for efficiency |
| Agrobacterium Strains | GV3101, LBA4404 | VIGS vector delivery | OD600 optimization necessary (0.3-0.5) |
| Pathogen Inoculum | Spore suspensions, Viral isolates | Disease phenotyping | Concentration standardization essential |
| Molecular Kits | RNA extraction, cDNA synthesis, qPCR | Silencing validation | DNase treatment critical for accuracy |
| Detection Reagents | ELISA kits, Histochemical stains | Phenotype assessment | Pathogen-specific antibodies recommended |
Discussion: Optimization Strategies and Technical Considerations
Enhancing Silencing Efficiency in Resistant Hosts
Achieving high-efficiency silencing in resistant genetic backgrounds often requires protocol optimization beyond standard VIGS procedures. Plant growth conditions significantly impact silencing efficiency, with younger plants (2-3 leaf stage) generally showing more consistent silencing than older plants [64]. Infiltration parameters including agrobacterium strain selection, culture density, and infiltration buffer composition (e.g., addition of acetosyringone) require empirical optimization for each plant species.
For challenging systems, modified viral vectors with enhanced mobility or reduced plant recognition may improve silencing in resistant genotypes. Additionally, environmental manipulations such as reduced temperature (18-22°C) during the initial silencing establishment phase can enhance viral spread and silencing efficiency without compromising plant health [6].
Interpretation and Validation of Silencing Phenotypes
Robust experimental design must account for potential off-target effects and compensatory mechanisms that may confound phenotypic interpretation. Inclusion of multiple independent target fragments for the same gene can help distinguish specific from non-specific effects. Time-course analyses of both silencing efficiency and phenotypic development provide stronger evidence for causal relationships than single-timepoint assessments.
In resistant cultivars with multiple R genes, the pyramided nature of resistance may result in partial rather than complete resistance breakdown following single NBS gene silencing. Such outcomes still provide valuable biological insights despite not producing full susceptibility. Quantitative measures of pathogen growth (e.g., viral titers, fungal biomass) provide more sensitive detection of partial effects than visual symptom assessment alone [6] [65].
VIGS has proven to be an indispensable tool for functional validation of NBS genes in resistant plant hosts, as demonstrated across diverse pathosystems including cotton-CLCuD, flax-Septoria, soybean-SMV, and pine-PWN interactions. The comparative data presented herein establishes that successful validation depends on: (1) target-specific silencing efficiency exceeding 70% transcript reduction, (2) appropriate experimental controls accounting for viral and genotype-specific effects, (3) quantitative phenotypic assessments incorporating both disease scoring and molecular pathogen detection, and (4) pathway-specific analyses to position validated NBS genes within broader defense networks.
The optimized protocols and standardized metrics provided in this guide offer researchers a framework for designing, implementing, and interpreting VIGS experiments for NBS gene validation. As plant immunity research increasingly focuses on engineering durable, broad-spectrum resistance, the precise functional characterization of NBS genes in resistant genetic backgrounds will remain fundamental to both basic science and applied crop improvement efforts.
In genomic screening, Positive Predictive Value (PPV) represents the probability that individuals with a positive screening result truly have the disease. Low PPV remains a significant barrier to implementing population-scale genomic screening, leading to unnecessary follow-up testing, parental anxiety, and increased healthcare costs. The fundamental challenge stems from interpreting genomic variants in asymptomatic populations with low disease prevalence, where even highly specific tests can yield substantial false positives. This challenge is particularly acute in newborn screening (NBS), where rapid, accurate results are critical for early intervention. Recent advances in sequencing technologies and analytical frameworks have yielded promising strategies to enhance PPV, making genomic screening increasingly viable for clinical and research applications, including functional validation of nucleotide-binding site (NBS) genes in plant disease resistance research.
Comparative Analysis of Approaches to Improve PPV
Table 1: Strategies for Improving PPV in Genomic Screening
| Strategy | Core Methodology | Reported PPV/Performance | Key Advantages | Limitations |
|---|---|---|---|---|
| BeginNGS Platform [67] [68] | Purifying hyperselection; filters variants common in healthy elderly populations | 100% PPV (0% false positives) in NICU pilot [68] | High specificity; automated interpretation; scalable | Requires large reference databases |
| Integrated Genomic & Metabolomic Profiling [69] | AI/ML classifier combining genome sequencing with expanded metabolite analysis | 100% sensitivity for true positives; 98.8% false positive reduction [69] | Cross-validates multiple data types; high sensitivity | Complex workflow; data integration challenges |
| Targeted Gene Panels (BabyDetect) [34] [70] | Focus on curated genes with strong genotype-phenotype correlation | 71 positive cases identified from 3,847 neonates [70] | Reduced variant interpretation burden; focused on actionable findings | Limited to known conditions; may miss novel genes |
| Two-Tier Sequencing Approach [69] | Initial MS/MS screening followed by genomic confirmation | 89% (31/35) of true positives confirmed via sequencing [69] | Leverages established screening infrastructure | Lower sensitivity as standalone genomic test |
Experimental Protocols for PPV Enhancement
BeginNGS Purifying Hyperselection Methodology
The BeginNGS platform employs an evolutionary biology-based filtering method to eliminate false positives. The protocol involves federated analysis of large genomic databases from healthy elderly populations (e.g., UK Biobank, Mexico City Prospective Study) to identify and exclude variants unlikely to cause severe childhood disorders [68].
Experimental Protocol:
- Database Federation: Connect to multiple genomic biobanks using TileDB database technology without data movement
- Variant Filtering: Apply purifying hyperselection to remove variants present in healthy elderly populations
- Automated Interpretation: Utilize AI-assisted clinical guidance system (Genome to Treatment - GTRx) to translate findings into actionable medical guidance
- Clinical Validation: Implement in screening cohort with comparison to standard diagnostic methods
This method demonstrated a 97% reduction in false positives while maintaining >99% sensitivity compared to gold-standard diagnostic genome sequencing [68].
Integrated Multi-Omics Validation Framework
The combined genomic and metabolomic approach addresses PPV improvement through orthogonal verification. This methodology was validated using 119 screen-positive cases from the California NBS program, including 35 true positives and 84 false positives across four metabolic disorders [69].
Experimental Protocol:
- Sample Preparation: Extract DNA from dried blood spots (DBS) using KingFisher Apex system with MagMax DNA Multi-Sample Ultra 2.0 kit [69]
- Sequencing & Analysis: Perform genome sequencing (Illumina NovaSeq X Plus), align to GRCh37, and identify variants in 16 condition-related genes
- Metabolomic Profiling: Apply targeted LC-MS/MS analysis of metabolic biomarkers
- AI/ML Integration: Train Random Forest classifier on metabolomic data to differentiate true and false positives
- Variant Classification: Apply ACMG guidelines for pathogenicity assessment with strict population frequency thresholds (≤0.025 in gnomAD)
This integrated approach achieved 100% sensitivity in detecting true positives through metabolomics with AI/ML, while genome sequencing reduced false positives by 98.8% [69].
Application in Plant NBS Gene Research
The principles for improving PPV in human genomic screening directly parallel methodologies in plant NBS (Nucleotide-Binding Site) gene research. Functional validation of resistance genes in susceptible versus tolerant cultivars requires similar strategies to distinguish true disease-resistance genes from irrelevant genetic variations.
Table 2: Research Reagent Solutions for NBS Gene Functional Validation
| Research Tool | Function in Validation | Example Application | Key Utility |
|---|---|---|---|
| Virus-Induced Gene Silencing (VIGS) [6] | Knockdown candidate NBS genes to test function | Silencing of GaNBS (OG2) demonstrated role in viral tittering in cotton [6] | Confirms gene function in resistance mechanisms |
| Orthogroup (OG) Analysis [6] | Evolutionary conservation of resistance genes | Identified 603 orthogroups with core (OG0, OG1) and unique (OG80) groups [6] | Prioritizes functionally conserved candidates |
| Protein-Ligand Interaction Studies [6] | Characterize molecular binding mechanisms | Strong interaction of NBS proteins with ADP/ATP and viral proteins [6] | Validates biochemical function |
| Haplotype Analysis [71] | Associate genotypic patterns with resistance | Glyma.03g036500 haplotypes correlated with Phytophthora resistance phenotypes [71] | Links genetic variation to function |
Experimental Protocol for Plant NBS Gene Validation
Functional Validation Pipeline for NBS Genes:
- Genome-Wide Identification: Identify NBS-domain-containing genes using PfamScan HMM search with NB-ARC domain (PF00931) at stringent e-value (1.1e-50) [6] [72]
- Expression Profiling: Perform RNA-seq analysis of resistant and susceptible cultivars under pathogen challenge; quantify with FPKM normalization [6]
- Genetic Variation Analysis: Identify unique variants in tolerant versus susceptible accessions through whole-genome sequencing [6]
- Functional Screening: Implement VIGS to silence candidate genes (e.g., GaNBS in cotton) and evaluate impact on disease resistance [6]
- Interaction Studies: Conduct protein-ligand and protein-protein interaction assays to validate molecular function [6]
This integrated approach mirrors the multi-modal validation used in human genomic screening to enhance predictive value while minimizing false positives in candidate gene identification.
Visualization of Enhanced Genomic Screening Workflows
Integrated Multi-Omic Screening Platform
BeginNGS Purifying Hyperselection Methodology
Improving PPV in genomic screening requires multi-modal approaches that integrate complementary technologies. The BeginNGS platform demonstrates that evolutionary filtering can virtually eliminate false positives, while integrated genomics-metabolomics with AI/ML maintains high sensitivity. These approaches directly inform functional validation of NBS genes in plant pathology, where distinguishing true resistance genes from genomic background is equally crucial. As genomic screening expands, continued refinement of these strategies will be essential for implementing accurate, scalable screening programs across diverse populations and applications. Future directions should focus on expanding reference databases, improving AI classification algorithms, and developing standardized frameworks for multi-omic data integration.
In the functional validation of Nucleotide-Binding Site-Leucine Rich Repeat (NBS-LRR) genes in susceptible versus tolerant cultivars, researchers face two persistent technical challenges: obtaining high-quality RNA from difficult-to-preserve tissues and maintaining consistent pathogen inoculation across experimental replicates. These methodological hurdles can significantly impact the reliability of gene expression data, particularly when studying plant-pathogen interactions through RNA sequencing and functional genomics approaches. This guide objectively compares current solutions and presents supporting experimental data to help researchers optimize their protocols for more robust and reproducible results in plant immunity research.
Section 1: Optimizing RNA Quality from Cryopreserved Tissues
RNA integrity is paramount for downstream applications in NBS-LRR gene validation, including RNA-seq and qRT-PCR. Extraction from cryopreserved tissues presents specific challenges that directly impact data quality.
Comparative Analysis of Preservation Strategies
Research systematically evaluating RNA preservation methods for frozen rabbit kidney tissues originally stored without preservatives identified several critical factors influencing RNA integrity [73]. The study examined thawing temperatures, preservative agents, processing delays, tissue aliquot sizes, and freeze-thaw cycles, with results validated in human and murine tissues.
Table 1: Impact of Preservation Methods on RNA Integrity (RIN)
| Preservation Condition | RNA Integrity Number (RIN) | Key Findings |
|---|---|---|
| Thawing on ice (with preservative) | Significantly higher (p<0.01) | Superior to room temperature thawing |
| RNALater treatment | RIN ≥ 8 | Best performance for maintaining quality |
| TRIzol treatment | Moderate quality | Effective but less than RNALater |
| RL Lysis Buffer | Moderate quality | Viable alternative |
| Processing delay: 120 min | 9.38 ± 0.10 | Minimal degradation |
| Processing delay: 7 days | 8.45 ± 0.44 | Significant degradation (p<0.05) |
Table 2: Tissue Aliquot Size Optimization
| Tissue Aliquot Size | Thawing Condition | RNA Integrity Number (RIN) | Recommendation |
|---|---|---|---|
| ≤ 30 mg | Ice or -20°C | RIN ≥ 8 | Ideal for commercial kits |
| 70-100 mg | Ice overnight | RIN ≥ 7 | Acceptable |
| 100-150 mg | Ice overnight | RIN ≥ 7 | Acceptable |
| 250-300 mg | Ice thawing | 5.25 ± 0.24 | Not recommended |
| 250-300 mg | -20°C thawing | 7.13 ± 0.69 | Preferred for large samples |
Detailed Methodology: RNA Preservation Protocol
Based on the optimal conditions identified [73], the following protocol is recommended for maintaining RNA quality in frozen tissues:
Sample Thawing and Preservation
- For tissue aliquots ≤100 mg, thaw on ice for 15 minutes
- For larger tissue aliquots (100-300 mg), thaw at -20°C overnight
- Immediately add RNALater stabilization solution (750 µL for 70-300 mg tissue)
- For long-term storage (up to 7 days) before processing, maintain samples at 4°C in RNALater
Critical Considerations
- Minimize freeze-thaw cycles (3-5 cycles cause significant degradation)
- Process tissues within 120 minutes when possible
- Use RNase-free tools for tissue handling
- For tissues ≤30 mg, maintain on ice with 300 µL RNALater for optimal results
Optimal RNA Preservation Pathway for Challenging Tissues
Section 2: Standardizing Inoculation for NBS Gene Validation
Consistent pathogen inoculation is critical for generating reliable expression data of NBS-LRR genes in resistant versus susceptible cultivars. Methodological variations can significantly impact the interpretation of gene function.
Comparative Inoculation Methods in Plant Research
Recent studies on plant-pathogen interactions provide insights into standardized inoculation protocols for functional gene validation.
Table 3: Inoculation Protocols for Plant-Pathogen Interaction Studies
| Plant System | Pathogen | Inoculation Method | Key Consistency Measures |
|---|---|---|---|
| Banana-Ralstonia [10] | Ralstonia syzygii subsp. celebesensis | Root wounding with 10⁸ CFU/mL, 10 mL/plant | Standardized cutter (18mm width, 100mm length), uniform depth (5cm) |
| Cotton-leaf curl virus [6] | Begomovirus | Whitefly transmission | Controlled insect vector populations, consistent infection timing |
| Banana-Fusarium [74] | Fusarium oxysporum f. sp. cubense | Soil inoculation | Standardized spore concentration, uniform soil conditions |
| Soybean-Phytophthora [71] | Phytophthora sojae | Hypocotyl inoculation | Uniform wound size, consistent zoospore concentration |
Detailed Methodology: Root Inoculation Protocol
The following protocol, adapted from banana blood disease resistance studies [10], provides a framework for consistent inoculation in root tissues:
Pathogen Preparation
- Culture Ralstonia syzigii subsp. celebesensis strain MY4101 in CPG medium at 28°C for three days
- Prepare suspended inoculum at concentration of 10⁸ colony-forming units per milliliter (CFU/mL)
- Standardize optical density measurements across preparations
- Use fresh inoculum prepared within 2 hours of application
Plant Inoculation
- Use consistent plant age (20-day old plantlets transplanted 7 days prior)
- Water plants one day before both mock and pathogen inoculations
- Use standardized cutter with blade width of 18mm and length of 100mm
- Press blade vertically into soil at 2cm from plant base, penetrating to depth of 5cm
- Repeat on opposite side of plant
- Apply 10mL inoculum per plant around wounded root area
- For mock inoculation, apply sterile water using identical method
Validation Measures
- Confirm inoculation success using susceptible control cultivar ('Hin' in banana studies)
- Monitor disease symptoms, severity scores, and disease severity index over 14 days
- Conduct triplicate biological replicates for phenotypic evaluation
- Sample tissues at consistent time points (12h, 24h, 7d) for transcriptomic analysis
Standardized Inoculation Workflow for Plant-Pathogen Studies
Section 3: Integrated Workflow for NBS-LRR Gene Validation
Combining optimized RNA preservation and standardized inoculation creates a robust pipeline for functional validation of NBS-LRR genes in resistant versus susceptible cultivars.
Case Study: NBS Gene Validation in Cotton
Research on cotton leaf curl disease (CLCuD) demonstrates this integrated approach [6]. The study identified 12,820 NBS-domain-containing genes across 34 plant species and validated their function through:
Expression Profiling
- RNA sequencing of susceptible (Coker 312) and tolerant (Mac7) Gossypium hirsutum accessions
- Identification of upregulated orthogroups (OG2, OG6, OG15) in different tissues under biotic stress
- Genetic variation analysis revealing 6,583 unique variants in Mac7 versus 5,173 in Coker312 NBS genes
Functional Validation
- Virus-induced gene silencing (VIGS) of GaNBS (OG2) in resistant cotton
- Demonstration of its putative role in virus tittering
- Protein-ligand and protein-protein interaction studies showing strong NBS protein interactions with ADP/ATP and core proteins of cotton leaf curl disease virus
Research Reagent Solutions for Technical Challenges
Table 4: Essential Research Reagents for NBS Gene Validation Studies
| Reagent/Category | Specific Examples | Function in Workflow |
|---|---|---|
| RNA Stabilizers | RNALater, TRIzol, RL Lysis Buffer | Preserve RNA integrity during sample collection and storage [73] |
| Extraction Kits | RNeasy Plant Kit, Hipure Total RNA Mini Kit | High-quality RNA extraction from plant tissues [10] |
| Pathogen Media | CPG Medium (Ralstonia), PDA (Fusarium) | Standardized pathogen culture for consistent inoculum [10] |
| Library Prep Kits | Illumina NovaSeq, Twist Bioscience | RNA-seq library preparation for transcriptome analysis [6] [34] |
| Validation Reagents | qRT-PCR kits, VIGS vectors | Functional validation of candidate NBS-LRR genes [6] [74] |
Addressing the technical challenges of RNA quality maintenance and inoculation consistency is fundamental to reliable functional validation of NBS-LRR genes in plant immunity research. The comparative data presented demonstrates that controlled thawing conditions, appropriate preservatives, and standardized aliquot sizes significantly improve RNA integrity from challenging tissues. Similarly, methodological consistency in pathogen inoculation—including standardized wounding techniques, uniform inoculum concentrations, and appropriate control treatments—ensures reproducible gene expression data. By implementing these optimized protocols and utilizing the recommended research reagents, scientists can enhance the reliability of their findings in comparative studies of susceptible and tolerant cultivars, ultimately accelerating the identification and validation of disease resistance genes for crop improvement.
The functional validation of Nucleotide-Binding Site-Leucine Rich Repeat (NBS-LRR) genes in susceptible versus tolerant cultivars represents a cornerstone of modern plant disease resistance research. These genes, which constitute one of the largest and most critical families of plant resistance (R) genes, encode proteins that detect pathogen effectors and initiate robust immune responses [6] [7]. However, a significant challenge persists in achieving equitable analysis across diverse genetic backgrounds, as the composition, copy number, and functional specificity of NBS-LRR genes can vary dramatically between even closely related species and cultivars [3] [17]. Disparities in genetic representation can lead to incomplete understanding of resistance mechanisms and hinder the development of broadly effective crop protection strategies.
Recent studies have highlighted the profound influence of evolutionary history on NBS-LRR gene profiles. Whole-genome duplication (WGD), tandem duplication, and gene loss events have been identified as major drivers of the expansion and contraction of this gene family across species [6] [7]. For instance, while Nicotiana tabacum possesses 603 NBS genes, its parental species N. sylvestris and N. tomentosiformis contain only 344 and 279 respectively, illustrating how polyploidization contributes to gene content variation [3]. Similarly, comparative analysis of resistant Vernicia montana and susceptible V. fordii revealed not only quantitative differences (149 versus 90 NBS-LRR genes) but also qualitative distinctions, including the absence of specific TIR domains and LRR types in the susceptible species [17]. These findings underscore the necessity of implementing comprehensive data integration and representation strategies that account for such genetic diversity when comparing resistant and susceptible genotypes.
Comparative Genomic Landscape of NBS-LRR Genes
Genomic Distribution and Architectural Diversity
The NBS-LRR gene family exhibits remarkable structural and compositional diversity across plant species, influenced by multiple evolutionary mechanisms. Table 1 summarizes the distribution of NBS-LRR genes across several recently studied species, highlighting the substantial variation in gene counts and architectural classes.
Table 1: Comparative Analysis of NBS-LRR Gene Family Across Plant Species
| Plant Species | Total NBS Genes | TNL | CNL | NL | TN | CN | N | Key Findings | Citation |
|---|---|---|---|---|---|---|---|---|---|
| Nicotiana benthamiana | 156 | 5 | 25 | 23 | 2 | 41 | 60 | Dominated by N-type genes; 0.25% of annotated genes | [9] |
| Nicotiana tabacum | 603 | 9 | 150 | 64 | - | - | 306 | Allotetraploid with combined parental contributions | [3] |
| Vernicia montana (resistant) | 149 | 3 | 9 | 12 | 7 | 87 | 29 | Contains TIR domains absent in susceptible counterpart | [17] |
| Vernicia fordii (susceptible) | 90 | 0 | 12 | 12 | 0 | 37 | 29 | Lacks TIR domains; specific LRR domain losses | [17] |
| Saccharum spontaneum (wild sugarcane) | 447* | - | - | - | - | - | - | Greater contribution to disease resistance in modern cultivars | [7] |
Note: *Value represents approximate count from comparative analysis; detailed architectural breakdown not provided in source.
The genomic distribution of these genes is typically non-random, with clustering observed on specific chromosomes. In V. montana, for instance, NBS-LRR genes are enriched on chromosomes 2, 7, and 11, while in V. fordii, they concentrate on chromosomes 2, 3, and 9 [17]. This clustered organization facilitates the evolution of resistance genes through tandem duplications of linked gene families, generating diversity for pathogen recognition [17]. The structural architecture of NBS-LRR proteins further contributes to their functional diversity, with different domain combinations conferring distinct pathogen recognition capabilities and signaling functions [9].
Evolutionary Mechanisms Driving Diversity
Whole-genome duplication (WGD) events have played a predominant role in the expansion of NBS-LRR gene families, particularly in polyploid species like sugarcane and tobacco [7] [3]. In sugarcane, researchers observed that "whole genome duplication is likely to be the main cause of the number of NBS-LRR genes" [7]. Beyond WGD, small-scale duplication events including tandem, segmental, and transposon-mediated duplications contribute significantly to gene family evolution [6]. These mechanisms often represent separate modes of expansion, as gene families evolving through WGDs seldom undergo small-scale duplication events [6].
The evolutionary trajectory of NBS-LRR genes is further shaped by selective pressures. Analysis of orthologous gene pairs between resistant and susceptible genotypes frequently reveals signatures of positive selection, particularly in the LRR domains responsible for pathogen recognition specificity [7] [17]. This positive selection drives rapid evolution of recognition specificities, enabling plants to keep pace with evolving pathogens. However, this rapid evolution also creates challenges for cross-species comparisons and pan-genomic analyses, as orthologous relationships can be obscured by sequence divergence and gene loss events.
Methodological Framework for Equitable Data Integration
Standardized Gene Identification and Classification
Robust identification and classification of NBS-LRR genes across diverse genetic backgrounds requires standardized computational workflows. The most widely adopted approach utilizes Hidden Markov Model (HMM) searches with the NB-ARC domain model (PF00931) from the Pfam database, typically implemented using HMMER software with stringent E-value cutoffs (e.g., < 1e-20) [3] [9] [17]. Following initial identification, candidate genes undergo comprehensive domain architecture analysis using complementary tools such as SMART, NCBI's Conserved Domain Database (CDD), and InterProScan [3] [9]. This multi-step verification ensures consistent annotation of N-terminal domains (TIR, CC, RPW8) and C-terminal LRR domains across species with varying genomic qualities.
Table 2: Essential Computational Tools for NBS-LRR Gene Identification and Analysis
| Tool Category | Specific Tools | Function | Key Parameters | Application Example |
|---|---|---|---|---|
| Gene Identification | HMMER v3.1b2 | HMM-based domain identification | E-value < 1e-20, PF00931 model | Identified 1226 NBS genes across three Nicotiana species [3] |
| Domain Annotation | SMART, CDD, InterProScan 5.48-83.0 | Domain architecture verification | E-value < 0.01 for domain confirmation | Classified genes into TNL, CNL, NL, TN, CN, N types [9] [17] |
| Phylogenetic Analysis | OrthoFinder v2.5.1, MEGA11, Clustal W | Orthogroup inference and phylogenetic tree construction | MCL algorithm, 1000 bootstrap replicates | Identified 168 architectural classes across 34 species [6] |
| Sequence Alignment | MAFFT v7.313, MUSCLE v3.8.31 | Multiple sequence alignment | Default parameters | Facilitated evolutionary analysis of conserved NBS-LRR genes [7] [3] |
| Synteny Analysis | MCScanX | Genome collinearity and duplication detection | E-value 10-5 for BLAST searches | Revealed WGD and tandem duplication events [7] [3] |
To address the challenge of comparing gene families across genetically diverse backgrounds, researchers have implemented orthology-based classification systems. The integration of OrthoFinder with phylogenetic reconstruction using maximum likelihood methods in MEGA11 or FastTreeMP enables the identification of core orthogroups that represent conserved NBS-LRR lineages across species, as well as species-specific expansions [6] [3]. This orthogroup framework facilitates meaningful comparisons between genotypes with different evolutionary histories and genome complexities, providing a phylogenetic context for functional studies.
Expression Analysis and Functional Validation
Transcriptomic profiling across multiple tissues, developmental stages, and stress conditions provides critical insights into the functional roles of NBS-LRR genes in resistant versus susceptible cultivars. Standardized RNA-seq processing pipelines—involving quality control with Trimmomatic, alignment with HISAT2, and expression quantification with Cufflinks—enable robust cross-genotype comparisons [3]. For functional validation, Virus-Induced Gene Silencing (VIGS) has emerged as a powerful tool for transient gene knockdown in both model and crop species [6] [17]. The experimental workflow for VIGS-based validation typically involves candidate gene selection, vector construction, plant transformation, pathogen challenge, and phenotypic assessment, providing direct evidence for gene function in disease resistance.
NBS Gene Functional Validation Workflow
Case Studies in Cross-Genotype NBS-LRR Analysis
Tung Tree: Susceptible vs. Resistant Genotype Comparison
The comparative analysis of resistant Vernicia montana and susceptible V. fordii provides a compelling case study in equitable genetic comparison. Researchers identified 149 NBS-LRR genes in the resistant genotype compared to only 90 in the susceptible one, with the resistant species possessing TIR-domain containing genes that were completely absent in the susceptible species [17]. Beyond quantitative differences, the study revealed important qualitative distinctions, including the presence of LRR1 and LRR4 domains exclusively in V. montana, suggesting domain loss events in V. fordii during evolution [17].
Critical functional insights emerged from the analysis of the orthologous gene pair Vf11G0978-Vm019719, which exhibited divergent expression patterns—downregulation in susceptible V. fordii versus upregulation in resistant V. montana following Fusarium wilt infection [17]. Through VIGS experiments, researchers demonstrated that silencing Vm019719 in resistant V. montana compromised resistance, directly validating its functional role in defense [17]. Further investigation revealed that this functional divergence stemmed from regulatory differences rather than coding sequence variation; specifically, a deletion in the promoter W-box element in the susceptible allele impaired WRKY transcription factor binding, highlighting how structural variants in regulatory regions contribute to resistance phenotypes [17].
Cotton and Soybean: Functional Validation of Specific NBS-LRR Genes
In cotton, researchers employed an integrated approach combining genetic variation analysis, protein-ligand interaction studies, and VIGS to characterize NBS genes associated with tolerance to cotton leaf curl disease (CLCuD). The study identified significantly more genetic variants in tolerant (Mac7; 6583 variants) versus susceptible (Coker 312; 5173 variants) accessions, with particular emphasis on orthogroups OG2, OG6, and OG15 that showed upregulated expression in tolerant plants under biotic stress [6]. Protein interaction simulations revealed strong binding between putative NBS proteins from these orthogroups and core proteins of the cotton leaf curl disease virus, while VIGS-mediated silencing of GaNBS (OG2) in resistant cotton demonstrated its essential role in limiting virus accumulation [6].
Similarly, in soybean, researchers identified a novel NBS-LRR gene (Glyma02g13380) in the resistant cultivar Kefeng-1 that conferred resistance to two different SMV strains (SC4 and SC20) [75]. This finding challenged the prevailing paradigm that single dominant genes typically confer resistance against single viral strains. The research combined traditional linkage mapping with association analysis to pinpoint the causal gene, followed by validation through qRT-PCR and VIGS, illustrating the power of integrated genomic and functional approaches [75].
Advanced Integration Strategies for Multi-Omics Data
Network-Based Integration Approaches
Network-based stratification (NBS) approaches, initially developed for cancer genomics, offer powerful frameworks for integrating heterogeneous genomic data in plant resistance gene studies. These methods map somatic mutation profiles or gene expression data onto biological networks and propagate signals across the network to create smoothed profiles that capture functional relationships [76]. Recent advances enable the integration of multiple data types—such as genetic variants and transcriptomic data—within the NBS framework, enhancing the identification of biologically meaningful subtypes or gene modules [76].
The mathematical foundation for such integration involves linearly combining normalized genetic and transcriptomic profiles:
[ Si = \beta \times pi + (1-\beta)\times q_i ]
Where (Si) represents the integrated profile for individual (i), (pi) is the genetic profile (e.g., mutation status), (q_i) is the normalized transcriptomic profile, and (\beta) is a tuning parameter that controls the relative contribution of each data type [76]. Network propagation then follows an iterative procedure:
[ F{t+1} = \alpha Ft A + (1-\alpha)F_0 ]
Where (F_0) is the initial patient-gene matrix, (A) is the symmetric adjacency matrix representing the gene interaction network, and (\alpha) is a diffusion parameter typically set to 0.7 based on benchmarking studies [76]. This approach effectively captures the influence of biological pathways across different omics data types, revealing subtype-specific tumor drivers and functional modules.
Correlated Meta-Analysis for Gene Prioritization
Correlated meta-analysis represents another sophisticated integration approach that accounts for dependencies between different association signals, such as SNP-transcript and transcript-phenotype associations. This method addresses the limitation of traditional meta-analysis that assumes statistical independence between tests, instead estimating the degree of correlation using tetrachoric correlation, which is less sensitive to contamination from alternative hypotheses [77].
In practice, for each SNP-transcript-phenotype triplet, the method estimates the covariance matrix (\Sigma) between the two association results ((Z{SNP} = \Phi^{-1}(P{SNP})) and (Z{BMI} = \Phi^{-1}(P{BMI}))), then computes:
[ Z{meta} = (Z{SNP} + Z_{BMI}) \sim N(0, \text{sum}(\Sigma)) ]
This approach maintains power for discovery while correcting for type I error inflation that would occur in traditional meta-analysis [77]. In obesity research, this method successfully identified seven genes (NT5C2, GSTM3, SNAPC3, SPNS1, TMEM245, YPEL3, and ZNF646) linking genetic variation at risk loci to biological mechanisms, with generalization across multiple tissues [77].
Correlated Meta-Analysis Approach
The Scientist's Toolkit: Essential Research Reagents and Solutions
Table 3: Essential Research Reagents and Solutions for NBS-LRR Gene Studies
| Category | Reagent/Resource | Specifications | Application | Considerations for Diverse Backgrounds |
|---|---|---|---|---|
| Genomic Resources | HMM Profile PF00931 | NB-ARC domain model, E-value < 1e-20 | Initial identification of NBS-encoding genes | Conservative approach for cross-species comparisons |
| Reference Genomes | Chromosome-scale assembly, annotation | Synteny analysis, gene model prediction | Quality impacts gene prediction completeness | |
| Software Tools | OrthoFinder v2.5.1 | MCL algorithm, DendroBLAST | Orthogroup inference across species | Handles variation in gene family size |
| MCScanX | E-value 10-5, collinearity detection | Tandem and segmental duplication analysis | Accounts for different evolutionary histories | |
| Experimental Validation | VIGS Vectors | TRV-based, gene-specific fragments | Transient gene silencing in plants | Optimization required for different genotypes |
| RNA-seq Libraries | Strand-specific, 150bp paired-end | Expression profiling under stress | Normalization across tissues and conditions | |
| Data Integration | PCNet | 2291 genes, 2.7M interactions | Network-based stratification | Species-specific networks may improve accuracy |
The integration of diverse genomic data for functional validation of NBS-LRR genes in susceptible versus tolerant cultivars requires meticulous attention to representation across genetic backgrounds. Disparities in gene content, domain architecture, and regulatory elements between resistant and susceptible genotypes can lead to biased conclusions if not properly accounted for in analytical frameworks. The methodologies and case studies presented here demonstrate that standardized identification pipelines, orthology-based classification, multi-omics integration, and functional validation across diverse genotypes are essential components of equitable genetic analysis.
Future advances in this field will likely depend on continued refinement of pan-genomic approaches that capture the full spectrum of genetic diversity within and between species, coupled with machine learning methods that can predict functional impacts of sequence variation across diverse genetic contexts. Such approaches will be crucial for dissecting the complex genetic architecture of disease resistance and deploying this knowledge in crop improvement programs that benefit from the rich diversity of plant genetic resources.
Direct Comparative Analysis: Validating Resistance Mechanisms and Breeding Applications
Nucleotide-binding site (NBS) domain genes constitute one of the largest superfamilies of plant disease resistance (R) genes, encoding proteins that play a critical role in effector-triggered immunity (ETI) against diverse pathogens [6]. These genes are characterized by a conserved NBS domain that facilitates nucleotide binding and hydrolysis, often coupled with C-terminal leucine-rich repeat (LRR) domains and variable N-terminal domains such as TIR (Toll/interleukin-1 receptor) or CC (coiled-coil) [8] [78]. The NBS-LRR family has dramatically expanded in flowering plants, with some species possessing thousands of members that enable recognition of rapidly evolving pathogen effectors [6]. Understanding the specific functions of individual NBS genes in plant immunity requires robust functional validation methods.
Virus-induced gene silencing (VIGS) has emerged as a powerful reverse genetics tool for rapid functional characterization of plant genes, including NBS genes. VIGS operates through a post-transcriptional gene silencing mechanism, utilizing modified viral vectors to trigger sequence-specific degradation of target mRNAs [79]. This technology enables researchers to circumvent the time-consuming process of stable genetic transformation, allowing for rapid assessment of gene function in a wide range of plant species [79]. The application of VIGS for validating NBS gene functions has proven particularly valuable for identifying specific resistance genes against devastating plant diseases, thereby accelerating crop improvement programs.
Comparative Analysis of VIGS Applications in NBS Gene Validation
VIGS Implementation Across Plant Systems
Table 1: VIGS-Mediated Functional Validation of NBS Genes in Various Crops
| Plant Species | Target Gene | VIGS Vector | Pathogen System | Functional Outcome | Reference |
|---|---|---|---|---|---|
| Gossypium hirsutum (Cotton) | GaNBS (OG2) | Not specified | Cotton leaf curl disease (Begomovirus) | Compromised resistance, increased virus titers | [6] |
| Gossypium barbadense (Cotton) | GbCNL130 | TRV-based | Verticillium wilt (Verticillium dahliae) | Silencing significantly compromised resistance | [80] |
| Vernicia montana (Tung tree) | Vm019719 | Not specified | Fusarium wilt (Fusarium oxysporum) | Silencing compromised resistance to Fusarium wilt | [78] |
| Glycine max (Soybean) | GmRpp6907, GmRPT4 | TRV-based | Soybean rust, general defense | Silencing altered disease response phenotypes | [79] |
| Nicotiana benthamiana (Tobacco) | Endogenous NBS-LRRs | TRV-based | Various viral pathogens | Established model system for NBS gene validation | [8] [9] |
The comparative data in Table 1 demonstrates the successful application of VIGS technology for functional validation of NBS genes across diverse plant-pathogen systems. In cotton, VIGS experiments revealed that silencing of specific NBS genes led to compromised resistance against important pathogens. The GaNBS (OG2) gene in cotton was shown to play a critical role in defense against cotton leaf curl disease, as silenced plants exhibited increased virus titers [6]. Similarly, silencing of GbCNL130 in Gossypium barbadense significantly reduced resistance to Verticillium wilt, establishing its essential function in defense against this soil-borne pathogen [80]. These findings highlight how VIGS enables rapid identification of key NBS genes involved in resistance to economically significant diseases.
In woody plants like Vernicia montana (tung tree), VIGS has proven valuable for comparing resistance mechanisms between susceptible and tolerant varieties. The orthologous gene pair Vf11G0978-Vm019719 exhibited distinct expression patterns in susceptible (V. fordii) and resistant (V. montana) varieties, with Vm019719 showing upregulated expression in the resistant variety [78]. VIGS-mediated silencing of Vm019719 in the resistant background compromised resistance to Fusarium wilt, demonstrating its critical role in defense. Interestingly, the allelic counterpart in the susceptible variety contained a promoter deletion that rendered it ineffective, highlighting how structural variations in NBS genes contribute to differential disease responses [78].
Technical Comparison of VIGS Vectors
Table 2: Comparison of VIGS Vector Systems for NBS Gene Validation
| Vector System | Infection Method | Key Advantages | Limitations | Silencing Efficiency | Optimal Plant Species |
|---|---|---|---|---|---|
| TRV (Tobacco rattle virus) | Agrobacterium-mediated cotyledon node infection | Mild viral symptoms, effective systemic silencing, high efficiency (65-95%) | Requires optimization for specific species | 65-95% | Soybean, tobacco, tomato, cotton [79] |
| BPMV (Bean pod mottle virus) | Particle bombardment or Agrobacterium | Well-established for legumes, stable silencing | May cause leaf symptoms, technical complexity | 70-90% | Soybean and other legumes [79] |
| ALSV (Apple latent spherical virus) | Inoculation or Agrobacterium | Mild symptoms, broad host range | Less established protocol | 60-85% | Diverse dicot species [79] |
The choice of VIGS vector significantly impacts experimental outcomes in NBS gene validation. As shown in Table 2, TRV-based vectors have gained prominence due to their mild symptom development and high silencing efficiency ranging from 65% to 95% [79]. The recent optimization of TRV-VIGS in soybean through Agrobacterium-mediated infection of cotyledon nodes represents a significant technical advancement, achieving effective systemic silencing of endogenous genes including the rust resistance gene GmRpp6907 and defense-related gene GmRPT4 [79]. This method demonstrated superior efficiency compared to conventional misting or injection techniques, which often show low infection rates due to the thick cuticle and dense trichomes on soybean leaves [79].
Experimental Protocols for VIGS-Mediated Validation of NBS Genes
TRV-VIGS Implementation for Soybean NBS Genes
The optimized TRV-VIGS protocol for soybean provides a robust framework for validating NBS gene functions [79]. The experimental workflow begins with the amplification of a 300-500 bp fragment from the target NBS gene using gene-specific primers with added restriction sites (e.g., EcoRI and XhoI). This fragment is then cloned into the pTRV2-GFP vector, and the recombinant plasmid is transformed into Agrobacterium tumefaciens GV3101. For infection, surface-sterilized soybean seeds are soaked in sterile water until swollen, then longitudinally bisected to obtain half-seed explants. These explants are immersed in Agrobacterium suspensions containing either pTRV1 or pTRV2-derived constructs for 20-30 minutes—identified as the optimal duration for efficient infection [79].
Following infection, the explants are cultured on solid medium for 3-4 days before transferring to soil. Successful infection is evaluated around day 4 post-infection by examining GFP fluorescence at the hypocotyl excision sites, with effective infectivity exceeding 80% and reaching up to 95% for certain cultivars like Tianlong 1 [79]. Silencing phenotypes typically emerge within 2-3 weeks post-inoculation, with molecular confirmation through qRT-PCR demonstrating significant reduction of target gene transcripts. This protocol has successfully validated the function of soybean NBS genes including GmRpp6907 for rust resistance and GmRPT4 for general defense responses [79].
Functional Assessment and Phenotypic Evaluation
Following successful VIGS-mediated silencing, comprehensive phenotypic evaluation is essential to establish the role of target NBS genes in disease resistance. In cotton systems, plants with silenced GbCNL130 showed significantly compromised resistance to Verticillium wilt, with increased disease severity and pathogen colonization compared to control plants [80]. Similarly, silencing of GaNBS (OG2) in resistant cotton led to elevated virus titers and typical disease symptoms when challenged with cotton leaf curl disease [6]. These phenotypic observations are complemented by molecular analyses to assess defense pathway activation, including measurement of reactive oxygen species (ROS) accumulation, expression of pathogenesis-related (PR) genes, and quantification of defense hormones such as salicylic acid [80].
The experimental workflow for VIGS-based validation of NBS genes can be visualized as follows:
Signaling Pathways Activated by Validated NBS Genes
Functional validation through VIGS has elucidated key signaling pathways activated by disease-resistant NBS genes. The cotton GbCNL130 gene, when silenced, revealed its essential role in activating salicylic acid (SA)-dependent defense responses [80]. Plants with functional GbCNL130 exhibited strong accumulation of reactive oxygen species and upregulation of pathogenesis-related (PR) genes following pathogen challenge. This SA-mediated defense pathway represents a crucial mechanism for resistance against biotrophic and hemibiotrophic pathogens like Verticillium dahliae [80]. The signaling cascade involves recognition of specific pathogen effectors by the LRR domain, leading to conformational changes in the NBS domain that facilitate nucleotide exchange (ADP to ATP) and activation of downstream defense components [8] [9].
The molecular architecture and signaling mechanisms of NBS-LRR proteins can be visualized as follows:
The NBS domain serves as a molecular switch in this signaling cascade, with conformational changes between ADP-bound (inactive) and ATP-bound (active) states regulating defense activation [8] [9]. Upon pathogen recognition, the NBS domain undergoes nucleotide exchange, activating the N-terminal signaling domain (TIR or CC) to initiate downstream signaling. This leads to the activation of multiple defense components, including the SA pathway, ROS production, and PR gene expression, culminating in hypersensitive response and restriction of pathogen spread [8] [80]. VIGS-based studies have been instrumental in connecting specific NBS genes to these defense signaling pathways, providing crucial insights for developing disease-resistant crop varieties.
Essential Research Tools for VIGS-Based NBS Gene Validation
Table 3: Research Reagent Solutions for VIGS-Based NBS Gene Studies
| Research Tool | Specific Application | Function in Experiment | Examples/References |
|---|---|---|---|
| TRV VIGS Vectors | Gene silencing in dicot plants | RNA virus-derived system for inducing target gene silencing | pTRV1, pTRV2-GFP [79] |
| Agrobacterium tumefaciens GV3101 | Plant transformation | Delivery of TRV constructs into plant cells | Soybean, tobacco transformation [79] |
| Pfam Database | Domain identification | Identification of NBS (NB-ARC) domains in candidate genes | PF00931 (NB-ARC domain) [6] [8] |
| HMMER Software | NBS gene identification | Hidden Markov Model-based identification of NBS domain genes | Genome-wide NBS identification [78] |
| OrthoFinder | Evolutionary analysis | Orthogroup analysis of NBS genes across species | Identification of core orthogroups [6] |
| PlantCARE Database | cis-element analysis | Identification of regulatory elements in NBS gene promoters | Analysis of stress-responsive elements [8] [9] |
The research tools summarized in Table 3 represent essential resources for conducting comprehensive VIGS-based validation of NBS genes. The TRV VIGS system, particularly the pTRV1 and pTRV2 vectors, provides the backbone for efficient gene silencing across multiple plant species [79]. When combined with Agrobacterium-mediated delivery, these tools enable researchers to effectively reduce target gene expression and assess resulting phenotypic changes. Bioinformatic resources such as the Pfam database and HMMER software are crucial for initial identification and annotation of NBS genes in plant genomes, utilizing the conserved NB-ARC domain (PF00931) as a signature [6] [8]. These computational tools have enabled genome-wide surveys of NBS genes, revealing significant diversity in domain architecture and species-specific structural patterns [6].
Evolutionary analysis tools like OrthoFinder facilitate the classification of NBS genes into orthogroups, enabling researchers to identify conserved versus lineage-specific resistance genes. Studies have revealed both core orthogroups (e.g., OG0, OG1, OG2) present across multiple species and unique orthogroups specific to particular species [6]. This evolutionary perspective helps prioritize candidate NBS genes for functional validation based on conservation patterns and duplication events. Additionally, databases like PlantCARE enable identification of regulatory elements in NBS gene promoters, providing insights into potential upstream regulators and expression patterns under different stress conditions [8] [9]. The integration of these bioinformatic tools with experimental VIGS validation creates a powerful pipeline for comprehensive characterization of NBS gene functions in plant immunity.
VIGS technology has established itself as an indispensable tool for functional validation of NBS genes, bridging the gap between genomic sequencing and mechanistic understanding of disease resistance. The comparative data presented in this review demonstrates the successful application of VIGS across diverse plant-pathogen systems, from cotton-Verticillium and cotton-virus interactions to soybean-fungal pathogen systems. The optimized protocols, particularly TRV-based VIGS with Agrobacterium delivery through cotyledon node infection, provide robust methodological frameworks for researchers investigating NBS gene functions. These approaches have revealed crucial aspects of NBS-mediated immunity, including their roles in activating SA-dependent defense pathways, generating ROS bursts, and upregulating PR gene expression.
The integration of VIGS with complementary approaches—including genome-wide identification of NBS genes, evolutionary analysis, and molecular characterization of defense responses—has significantly advanced our understanding of plant immunity mechanisms. As genomic technologies continue to identify expanding repertoires of NBS genes across crop species, VIGS will remain a critical technology for prioritizing candidate genes and validating their functions in disease resistance. This knowledge directly informs crop improvement programs, enabling the development of varieties with enhanced and durable resistance to devastating plant diseases through marker-assisted breeding and genetic engineering approaches.
Nucleotide-binding site (NBS) proteins, particularly those comprising the NBS-LRR (leucine-rich repeat) class, represent a critical frontier in understanding plant-pathogen interactions. These proteins function as specialized immune receptors that directly or indirectly detect pathogen effector molecules, initiating robust defense responses collectively termed effector-triggered immunity (ETI) [81] [6]. The functional validation of how specific NBS proteins interact with pathogen effectors and host proteins in susceptible versus tolerant cultivars forms a core investigative focus in plant immunity research. These interaction studies reveal not only fundamental mechanisms of disease resistance but also how pathogens subvert these mechanisms to promote virulence [82] [83]. This guide systematically compares experimental approaches and findings in NBS protein interaction studies, providing researchers with methodological frameworks and analytical perspectives for advancing this critical field.
NBS Protein Functions and Interaction Mechanisms: A Comparative Analysis
NBS-LRR proteins are modular intracellular immune receptors that typically consist of a variable N-terminal signaling domain (often coiled-coil CC or Toll/Interleukin-1 receptor TIR), a central nucleotide-binding adaptor shared by APAF-1, R proteins, and CED-4 (NB-ARC) domain, and a C-terminal leucine-rich repeat (LRR) domain [6] [84]. The NB-ARC domain binds ATP/GTP and is crucial for nucleotide-dependent activation cycling, while the LRR domain is primarily involved in specific ligand recognition [81] [84]. Plants deploy two principal mechanistic strategies for pathogen detection through NBS proteins: direct effector recognition and indirect surveillance of host protein modifications.
Table 1: Core Functional Domains of NBS-LRR Proteins
| Domain | Structural Features | Primary Functions | Role in Immunity |
|---|---|---|---|
| N-Terminal (CC/TIR) | Coiled-coil or TIR fold; protein interaction interface | Initiates downstream signaling cascades | Determines signaling pathway specificity; oligomerization |
| Central NB-ARC | Nucleotide-binding pocket; conserved kinase motifs | ADP/ATP binding and hydrolysis; molecular switch | Controls activation/inactivation cycling; energy transduction |
| C-Terminal LRR | Solenoid structure with parallel β-sheets; variable residues | Pathogen effector recognition; autoinhibition | Direct or indirect binding to pathogen effectors; specificity determination |
Direct Recognition Mechanisms
Direct recognition occurs when NBS proteins physically bind to pathogen effector proteins, providing straightforward ligand-receptor interactions that trigger defense activation. Key exemplars include:
- The rice R protein Pi-ta directly interacts with the effector AVR-Pita from the rice blast fungus Magnaporthe grisea through its LRR domain, establishing a gene-for-gene resistance relationship [81].
- Flax rust resistance proteins L5, L6, and L7 demonstrate direct physical interaction with corresponding AvrL567 effector variants from the flax rust fungus Melampsora lini in yeast two-hybrid systems, precisely mirroring in vivo specificity [81].
- The wheat CC-NBS-LRR protein Ym1 specifically recognizes and interacts with the wheat yellow mosaic virus (WYMV) coat protein, leading to nucleocytoplasmic redistribution and activation of hypersensitive responses [85].
Indirect Recognition Mechanisms (Guard Hypothesis)
Indirect recognition operates through the "guard" model, where NBS proteins monitor ("guard") host cellular components that are targeted and modified by pathogen effectors. Perturbation of these guarded host proteins triggers defense activation:
- In Arabidopsis thaliana, the RIN4 protein is guarded by multiple NBS-LRR proteins (RPM1 and RPS2). Bacterial effectors AvrRpm1 and AvrB induce RIN4 phosphorylation, while AvrRpt2 cleaves RIN4—each modification detected by the corresponding NBS-LRR guard [81].
- The Arabidopsis NBS-LRR protein RPS5 guards the host kinase PBS1, detecting its cleavage by the bacterial cysteine protease AvrPphB [81].
- The tomato NBS-LRR protein Prf guards the host kinase Pto, which directly binds bacterial effectors AvrPto and AvrPtoB, leading to Prf activation [81].
Table 2: Comparative Analysis of NBS Protein Recognition Mechanisms
| Recognition Type | Molecular Mechanism | Advantages | Limitations | Representative Examples |
|---|---|---|---|---|
| Direct Recognition | Physical binding between NBS-LRR and pathogen effector | High specificity; simple genetic relationship | Vulnerable to effector sequence variation | Pi-ta/Avr-Pita [81]; Ym1/WYMV CP [85] |
| Indirect Recognition | Surveillance of modified host proteins ("guardees") | Broad spectrum; durable resistance | Complex genetics; potential fitness costs | RPM1/RPS2-RIN4 [81]; RPS5-PBS1 [81] |
Experimental Methodologies for Protein Interaction Studies
Yeast Two-Hybrid (Y2H) Systems
The yeast two-hybrid system remains a foundational methodology for detecting direct protein-protein interactions, employing reconstitution of transcription factor activity through bait-prey fusion proteins.
Protocol Overview:
- Construct Generation: Clone NBS coding sequences into DNA-binding domain (DBD) vectors (bait) and effector/host protein sequences into activation domain (AD) vectors (prey)
- Yeast Transformation: Co-transform bait and prey constructs into appropriate yeast strains (e.g., AH109/Y187)
- Selection Screening: Plate transformants on selective media lacking specific nutrients (e.g., -Leu/-Trp) to confirm transformation
- Interaction Testing: Replica-plate onto higher-stringency media (e.g., -Leu/-Trp/-His/-Ade) with X-α-Gal to detect interactions
- Quantification: Assess interaction strength through β-galactosidase assays or growth rate measurements
Key Considerations: NBS proteins often exhibit autoactivation in Y2H systems, requiring truncated constructs or specialized systems. The split-ubiquitin system provides an alternative for membrane-associated proteins [81].
Bimolecular Fluorescence Complementation (BiFC)
BiFC enables visualization of protein interactions in plant cells by reconstituting fluorescent proteins when two interaction partners are brought into proximity.
Protocol Overview:
- Vector Construction: Fuse NBS proteins to N-terminal fragment of YFP and potential partners to C-terminal fragment
- Plant Transformation: Deliver constructs into plant cells via Agrobacterium-mediated transformation or protoplast transfection
- Confocal Microscopy: Visualize fluorescence complementation 24-72 hours post-transformation
- Controls: Include appropriate negative controls (non-interacting pairs) and localization markers
Application Example: BiFC validated the interaction between the wheat Ym1 CC-NBS-LRR and WYMV coat protein, demonstrating nucleocytoplasmic redistribution upon interaction [85].
Co-Immunoprecipitation (Co-IP) and Pull-Down Assays
These approaches confirm physical interactions in near-native conditions using antibody-based precipitation or affinity purification.
Protocol Overview:
- Protein Extraction: Prepare total protein extracts from plant tissues or heterologous expression systems in appropriate buffer with protease inhibitors
- Immunoprecipitation: Incubate extracts with specific antibodies against tagged NBS proteins or interaction partners
- Bead Capture: Add protein A/G beads to capture antibody-protein complexes
- Washing and Elution: Remove non-specifically bound proteins through sequential washing
- Detection: Analyze eluates by immunoblotting to detect co-precipitated partners
Technical Note: In vitro pull-down assays using recombinant proteins (GST, MBP, or His-tagged) can establish direct interactions without cellular context complexities.
Comparative Functional Validation in Susceptible vs. Tolerant Cultivars
Functional studies comparing NBS protein behavior across cultivars with differing disease responses provide critical insights for resistance breeding.
The Tsn1 Case: An NBS Protein Mediating Susceptibility
The wheat Tsn1 gene presents a fascinating paradigm where an NBS protein confers susceptibility rather than resistance. Tsn1 encodes a unique protein containing serine/threonine protein kinase (S/TPK), NBS, and LRR domains, with each domain required for sensitivity to the ToxA effector produced by necrotrophic fungi Pyrenophora tritici-repentis and Stagonospora nodorum [83].
Genetic Evidence:
- Ethylmethane sulfonate mutagenesis identified 13 independent ToxA-insensitive mutants, all harboring mutations in the S/TPK-NBS-LRR gene
- Domain-specific mutations (missense, nonsense, splice site) in S/TPK, NBS, or LRR domains all confer insensitivity
- Tsn1 is absent in ToxA-insensitive genotypes, indicating null alleles in resistant lines [83]
This case demonstrates that some NBS proteins can be exploited by pathogens to induce susceptibility (effector-triggered susceptibility), highlighting the importance of functional characterization in both resistant and susceptible backgrounds.
Expression Dynamics and Genetic Variation
Comparative analysis of NBS gene expression and sequence variation between susceptible and tolerant cultivars reveals key determinants of resistance:
- In cotton response to cotton leaf curl disease (CLCuD), transcriptomic profiling identified differential upregulation of specific NBS orthogroups (OG2, OG6, OG15) in tolerant versus susceptible accessions [6]
- Genetic variation analysis between susceptible (Coker 312) and tolerant (Mac7) Gossypium hirsutum accessions identified substantially more unique variants in NBS genes of the tolerant line (6,583 variants) compared to the susceptible line (5,173 variants) [6]
- Virus-induced gene silencing (VIGS) of GaNBS (OG2) in resistant cotton demonstrated its critical role in limiting viral accumulation [6]
Table 3: NBS Gene Expression and Variation in Cotton Cultivars with Differential CLCuD Response
| Parameter | Susceptible (Coker 312) | Tolerant (Mac7) | Functional Significance |
|---|---|---|---|
| Unique NBS Variants | 5,173 variants | 6,583 variants | Enhanced diversity potentially enables broader recognition |
| Key Orthogroups | OG2, OG6, OG15 | OG2, OG6, OG15 | Conservation of essential immune signaling modules |
| Expression Response | Moderate induction | Strong upregulation | Enhanced transcriptional activation in tolerant background |
| Functional Validation | N/A | VIGS of GaNBS increases susceptibility | Confirms essential role in resistance |
Salicylic Acid Responsiveness
Salicylic acid (SA) plays a central role in defense signaling, and SA-responsive NBS genes represent key components in resistance networks:
- Transcriptome analysis of Dendrobium officinale under SA treatment identified 1,677 differentially expressed genes, including six significantly upregulated NBS-LRR genes [86]
- Co-expression network analysis revealed that Dof020138, an SA-induced NBS-LRR gene, connects pathogen recognition pathways with MAPK signaling, plant hormone transduction, and energy metabolism [86]
- This integrated response suggests that specific NBS proteins function as nodes connecting pathogen recognition to comprehensive defense reprogramming
Pathway Visualization and Molecular Interactions
The Scientist's Toolkit: Essential Research Reagents and Solutions
Table 4: Key Research Reagents for NBS Protein Interaction Studies
| Reagent Category | Specific Examples | Research Applications | Technical Considerations |
|---|---|---|---|
| Yeast Two-Hybrid Systems | GAL4-based, LexA-based, split-ubiquitin | Initial interaction screening; domain mapping | Autoactivation common with full-length NBS proteins |
| Bimolecular Fluorescence Complementation | YFP, CFP fragments; expression vectors | Spatial visualization of interactions in plant cells | Limited by transformation efficiency; controls critical |
| Co-Immunoprecipitation Reagents | Protein A/G beads; tag-specific antibodies | Validation under near-physiological conditions | Requires specific antibodies; non-specific binding concerns |
| Heterologous Expression Systems | E. coli; baculovirus; wheat germ extract | Recombinant protein production for in vitro assays | Solubility challenges with full-length NBS proteins |
| Virus-Induced Gene Silencing | TRV-based vectors; specific gene fragments | Functional validation in plants | Partial silencing; off-target effects require controls |
| Plant Transformation Tools | Agrobacterium strains; protoplast systems | Stable or transient expression in plant tissues | Species-dependent efficiency; tissue culture requirements |
Protein interaction studies continue to unravel the sophisticated mechanisms through which NBS proteins perceive pathogens and activate immunity. The comparative analysis between susceptible and tolerant cultivars reveals that successful resistance often involves specific recognition capabilities, appropriate expression dynamics, and synergistic integration into broader defense networks. Future research directions should prioritize structural characterization of NBS-effector complexes, real-time monitoring of interaction dynamics in living plants, and exploration of the NBS protein interactions within condensates such as stress granules [82] [87]. The integration of interaction data with breeding programs promises to accelerate the development of durable disease resistance in crop species, potentially through pyramiding multiple recognition specificities or engineering guard systems for critical cellular targets.
Allopolyploidization, the hybridization event between different species that results in organisms with multiple sets of chromosomes, is a major evolutionary force in plants. This process merges distinct genomes into a single nucleus, creating opportunities for novel genetic interactions and evolutionary trajectories. A central question in polyploid genomics concerns the asymmetric contributions of the progenitor genomes to key biological functions in the newly formed allotetraploid. Among the most critical gene families for plant survival are the Nucleotide-Binding Site-Leucine Rich Repeat (NBS-LRR) genes, which constitute the largest class of plant disease resistance (R) genes. Understanding how these genes evolve after polyploidization is crucial for developing durable disease resistance in crops.
This review synthesizes recent genomic evidence from major allotetraploid crops—including tobacco (Nicotiana tabacum), cotton (Gossypium hirsutum), peanut (Arachis hypogaea), and oilseed rape (Brassica napus)—to demonstrate consistent patterns of asymmetric evolution in NBS genes. We examine how differential selection pressures, chromosomal rearrangements, and epigenetic modifications shape the retention, loss, and functional diversification of NBS genes following polyploidization. By comparing experimental methodologies and findings across systems, we provide a framework for predicting resistance gene evolution and inform strategies for breeding resilient crop varieties.
Comparative Genomics of NBS Genes in Allotetraploid Systems
Quantifying Asymmetric NBS Gene Inheritance and Evolution
Recent chromosome-scale genome assemblies have enabled precise tracking of NBS genes to their progenitor origins in several allotetraploid species. The data reveal consistent patterns of asymmetric contribution and evolution.
Table 1: NBS-LRR Gene Distribution in Allotetraploid Species and Their Progenitors
| Species (Genome) | Total NBS Genes | NBS Subtypes | Progenitor Origin | Genes from Progenitor | Evolutionary Pattern |
|---|---|---|---|---|---|
| Nicotiana tabacum (Tobacco) | 603 | CNL, TNL, NL, CN | N. sylvestris (S) | ~76.6% traceable to progenitors [3] | Biased genome downsizing toward T subgenome; homoeologous exchanges [88] |
| N. tomentosiformis (T) | |||||
| Brassica napus (Oilseed Rape) | 464 | TNL, CNL | B. rapa (An) | 191 genes (87.1% homologous) [89] | Greater diversification in C genome; purifying selection (Ka/Ks < 1) [89] |
| B. oleracea (Cn) | 273 genes (66.4% homologous) [89] | ||||
| Arachis hypogaea (Peanut) | 713 | CNL, TNL, TIR-CC-NBS | A. duranensis (A) | Asymmetric LRR domain loss [90] | Relaxed selection on NBS-LRR proteins; young NBS-LRRs important for disease resistance [90] |
| A. ipaensis (B) | |||||
| Gossypium hirsutum (Cotton) | Not quantified | CNL, TNL | G. arboreum (A) | New NBS-LRRs produced post-polyploidy [90] | Birth and death of NBS genes via non-homologous recombination [91] |
The Nicotiana tabacum system provides a particularly clear example of asymmetric evolution. This allotetraploid (2n=4x=48) resulted from hybridization between N. sylvestris (S subgenome) and N. tomentosiformis (T subgenome). Genome analysis reveals that 56.99% and 43.01% of the genome was partitioned to the S and T subgenomes, respectively, with 11 chromosome rearrangement events identified [88]. Of the 603 NBS genes identified in N. tabacum, approximately 76.6% could be directly traced to their parental genomes, demonstrating substantial retention of NBS genes from both progenitors [3].
In Brassica napus, formed from B. rapa (An subgenome) and B. oleracea (Cn subgenome), the asymmetry is particularly striking. While the An subgenome contains a similar number of NBS genes (191) to its progenitor B. rapa (202), the Cn subgenome contains many more genes (273) than its progenitor B. oleracea (146) [89]. Furthermore, a much higher percentage of B. rapa NBS genes (87.1%) are homologous to those in B. napus compared to only 66.4% from B. oleracea, suggesting greater diversification of NBS genes in the C genome following polyploidization [89].
Molecular Mechanisms Driving Asymmetric Evolution
Several interconnected molecular processes contribute to the observed asymmetries in NBS gene evolution in allotetraploids:
Homoeologous Chromosome Exchanges: In N. tabacum, comparative genomics revealed exchanges between homoeologous chromosomes from different subgenomes. For example, exchanges between N. sylvestris chromosome 18 and N. tomentosiformis chromosome 9 generated new chromosomal arrangements in the allotetraploid [88]. Such rearrangements can disrupt NBS gene clusters or create novel gene fusions.
Differential Transposable Element Load: The T subgenome of N. tabacum contains more repetitive sequences than the S subgenome, particularly on chromosomes 2, 17, and 21 [88]. These regions are enriched in retrotransposons, especially Gypsy elements, which can influence local mutation rates and gene expression.
Epigenetic Repatterning: Following polyploidization, changes in DNA methylation and chromatin modifications can silence or activate NBS genes from specific subgenomes. In N. tabacum, epigenetic modifications were associated with subgenome expression divergence, though the specific impact on NBS genes requires further investigation [88].
Relaxed Selection and Preferential Domain Loss: In peanut (A. hypogaea), researchers observed relaxed selection pressure on NBS-LRR proteins following tetraploidization, with preferential loss of LRR domains compared to its diploid progenitors [90]. This domain loss may partly explain the lower disease resistance observed in cultivated peanut.
Birth and Death of NBS Genes: In both Brassica napus and cotton, the "birth and death" model of NBS gene evolution appears active, with new genes created through duplication and recombination events, while others are pseudogenized or eliminated [89] [91].
Diagram 1: Molecular pathways driving asymmetric NBS gene evolution in allotetraploids. Key processes include genome fractionation, chromosomal rearrangements, differential transposable element loads, and epigenetic repatterning that collectively shape NBS gene content and function.
Experimental Approaches for Functional Validation
Genomic Identification and Phylogenetic Analysis of NBS Genes
Protocol 1: Genome-Wide Identification and Classification of NBS-LRR Genes
Data Acquisition: Obtain chromosome-scale genome assemblies and annotated protein sequences for both the allotetraploid and its progenitor species from public repositories (e.g., Zenodo, NCBI) [3].
HMMER Search: Perform hidden Markov model (HMM) searches using HMMER v3.1b2 with the PF00931 model from the PFAM database to identify NB-ARC domains [3].
Domain Annotation: Identify additional domains (TIR, CC, LRR) using PFAM domains (PF01582, PF00560, PF07723, PF07725, PF12779, PF13306, PF13516, PF13855, PF14580, PF03382, PF01030, PF05725) and the NCBI Conserved Domain Database (CDD) [3].
Classification: Categorize NBS genes into subfamilies (TNL, CNL, RNL, TN, CN, RN, N, NL) based on domain architecture [3] [89].
Phylogenetic Reconstruction: Perform multiple sequence alignment of NBS protein sequences using MUSCLE v3.8.31. Construct phylogenetic trees with MEGA11 using neighbor-joining method and 1000 bootstrap replicates [3].
Protocol 2: Evolutionary Analysis of NBS Genes in Allotetraploids
Synteny Analysis: Identify syntenic blocks across genomes through reciprocal BLASTP searches followed by MCScanX-based collinearity detection [3].
Selection Pressure Analysis: Calculate non-synonymous (Ka) and synonymous (Ks) substitution rates for homologous gene pairs using KaKs_Calculator 2.0 with Nei-Gojobori (NG) evolutionary model [3].
Gene Duplication Analysis: Identify whole-genome duplication, segmental duplication, and tandem duplication events using self-BLASTP and MCScanX [3].
Expression Analysis: Map RNA-seq reads to reference genomes using Hisat2. Perform transcript quantification and differential expression analysis with Cufflinks/Cuffdiff [3].
Functional Validation of NBS Genes in Disease Resistance
Protocol 3: Association of NBS Genes with Resistance Phenotypes
Phenotypic Screening: Inoculate diverse germplasm accessions with pathogens using consistent disease severity scales (e.g., 0-5 scale where 0=no symptoms, 5=large lesions >2mm) [92].
Genome-Wide Association Study (GWAS): Perform association analysis using genotypic data (SNPs) and phenotypic resistance scores. Both binomial (resistant/susceptible) and Gaussian (continuous severity scores) models can be applied [92].
Candidate Gene Identification: Overlap significant GWAS peaks with NBS gene physical positions. Prioritize candidates based on proximity to peak SNPs, expression patterns, and structural features [89] [92].
Transgenic Validation: Use CRISPR/Cas9-mediated gene editing to knockout candidate NBS genes in resistant lines or introduce specific alleles into susceptible lines [93]. Validate resistance spectrum against multiple pathogen isolates [92].
Table 2: Key Reagents and Resources for NBS Gene Functional Analysis
| Reagent/Resource | Specifications | Application | Example Use |
|---|---|---|---|
| Genome Assemblies | Chromosome-scale, with annotated genes | Synteny analysis, gene identification | N. tabacum (4.17 Gb), N. sylvestris (2.38 Gb), N. tomentosiformis (2.24 Gb) [88] |
| HMMER | v3.1b2 with PF00931 model | NBS domain identification | Identification of 1226 NBS genes across three Nicotiana species [3] |
| MCScanX | Default parameters | Gene duplication and synteny analysis | Detection of segmental and tandem duplications in Brassica NBS genes [3] [89] |
| KaKs_Calculator | 2.0 with NG model | Selection pressure analysis | Calculating Ka/Ks ratios for NBS homologs in B. napus and progenitors [3] |
| CRISPR/Cas9 | Cas9, Cas12a with specific guides | Gene knockout/editing | Creating novel alleles of resistance genes in rice [93] |
| RNA-seq Data | Hisat2 alignment, Cufflinks quantification | Expression analysis | Identifying NBS genes differentially expressed during pathogen infection [3] |
Case Studies in Major Allotetraploid Crops
Nicotiana tabacum: Subgenome Bias in Complex Trait Variation
The recent chromosome-scale assembly of the N. tabacum genome and its progenitors provides exceptional resolution for studying NBS gene evolution. Researchers identified 603 NBS genes in the allotetraploid, with the two subgenomes contributing unevenly to complex trait variation [88] [3]. Through genome-wide association analysis of 5,196 germplasms, the study connected 178 marker-trait associations to 39 morphological, developmental, and disease resistance traits [88].
Notably, epigenetic modifications were associated with subgenome expression divergence following polyploidization. The T subgenome, derived from N. tomentosiformis, showed greater repetitive element content and differential methylation patterns compared to the S subgenome [88]. These epigenetic differences likely contribute to the observed biased expression of NBS genes and their uneven contributions to disease resistance traits.
Brassica napus: Asymmetric NBS Gene Diversification
In B. napus, researchers identified 464 putatively functional NBS-encoding genes, unevenly distributed across the genome in several clusters [89]. The An subgenome contained 191 NBS genes—similar to its progenitor B. rapa (202 genes)—while the Cn subgenome contained 273 genes, substantially more than its progenitor B. oleracea (146 genes) [89].
Evolutionary analysis revealed that most homologous NBS gene pairs between B. napus and its progenitors had Ka/Ks values less than 1, indicating purifying selection during evolution [89]. However, the birth and death of several NBS-encoding genes was mediated by non-homologous recombination. Importantly, 204 NBS-encoding genes were located within 71 resistance QTL intervals against three major diseases (blackleg, clubroot, and Sclerotinia stem rot), with 47 genes co-located with QTLs against two diseases and 3 genes with QTLs against all three diseases [89].
Arachis hypogaea: LRR Domain Loss and Young NBS Genes
Peanut (A. hypogaea) provides intriguing insights into the structural evolution of NBS genes following polyploidization. Researchers identified 713 full-length NBS-LRR genes in the cultivated peanut cv. Tifrunner, with evidence of genetic exchange events both within and between subgenomes [90]. Relaxed selection was detected acting on NBS-LRR proteins and particularly on LRR domains.
Comparative analysis revealed that NBS-LRR proteins in cultivated peanut contained fewer LRR domains than those in its diploid progenitors (A. duranensis and A. ipaensis), potentially explaining the lower disease resistance observed in the cultivated species [90]. Through QTL analysis, researchers found 113 NBS-LRRs associated with response to late leaf spot, tomato spotted wilt virus, and bacterial wilt. These were classified as 75 young and 38 old NBS-LRRs, suggesting that young NBS-LRRs were particularly important for disease resistance after tetraploidization [90].
Diagram 2: Experimental workflow for functional validation of NBS genes in allotetraploids. Integrated approaches combining genomic identification, expression analysis, genetic mapping, and transgenic validation are required to establish comprehensive evolutionary models.
Implications for Crop Improvement
Understanding asymmetric NBS gene evolution in allotetraploids has profound implications for disease resistance breeding. The consistent pattern of subgenome bias across species suggests that one progenitor genome often contributes disproportionately to the resistance repertoire of the allotetraploid. This knowledge can guide more efficient selection of breeding parents and targeted introgression of resistance loci.
Emerging genome editing technologies, particularly CRISPR/Cas systems, offer unprecedented opportunities to create novel NBS alleles and engineer broad-spectrum resistance [93]. The ability to precisely modify existing resistance alleles or generate new ones in complex allotetraploid genomes represents a promising avenue for developing durable disease resistance. Furthermore, pangenome approaches capturing the full diversity of NBS genes across germplasm collections will facilitate the identification of non-reference alleles associated with superior resistance [94].
As genomic technologies advance, integration of multi-omics data—genomics, transcriptomics, epigenomics, and phenomics—will enable predictive models of NBS gene function and evolution. This systems-level approach will ultimately support the development of climate-resilient crops with enhanced and durable disease resistance, contributing to global food security.
Within the broader thesis on the functional validation of Nucleotide-Binding Site (NBS) genes, a critical first step involves a detailed comparison of their genomic architectures between disease-tolerant and susceptible crop cultivars. NBS genes, particularly those encoding NBS-Leucine-Rich Repeat (NBS-LRR) proteins, constitute the largest family of plant disease resistance (R) genes [95]. They are central to the plant immune system, initiating defense signaling cascades upon pathogen recognition [78]. The genomic landscape of these genes—including their number, structural diversity, and chromosomal distribution—is not static. It is shaped by evolutionary pressures and duplication events, and variations in this landscape are often correlated with divergent phenotypic resistance in modern cultivars [7]. This guide objectively compares the NBS gene architectures in tolerant and susceptible cultivars from various plant species, synthesizing experimental data to highlight key structural differences and their functional implications for disease resistance.
Comparative Genomic Analysis of NBS Genes
Diversity in NBS Gene Repertoire and Composition
A comprehensive analysis across 34 plant species identified 12,820 NBS-domain-containing genes, which were classified into 168 distinct classes based on their domain architecture [6]. This reveals significant architectural diversity, encompassing both classical patterns (e.g., NBS, NBS-LRR, TIR-NBS, TIR-NBS-LRR) and species-specific patterns (e.g., TIR-NBS-TIR-Cupin_1, TIR-NBS-Prenyltransf) [6].
Comparative studies of resistant and susceptible genotypes consistently show a positive correlation between a larger, more diverse NBS-LRR repertoire and enhanced disease resistance. The functional validation of these differences often involves orthogroup (OG) analysis, which groups evolutionarily related genes. For instance, expression profiling highlighted putative upregulation of specific orthogroups (OG2, OG6, OG15) in various tissues under biotic and abiotic stresses in cotton plants with contrasting responses to cotton leaf curl disease (CLCuD) [6].
Table 1: Comparative NBS-LRR Gene Repertoire in Resistant/Susceptible Cultivar Pairs
| Plant Species | Resistant/Tolerant Cultivar | NBS-LRR Count | Susceptible Cultivar | NBS-LRR Count | Key Structural Differences & Associated Disease | Citation |
|---|---|---|---|---|---|---|
| Tung Tree | Vernicia montana | 149 | Vernicia fordii | 90 | Presence of TNL-type genes; Greater LRR diversity; Fusarium wilt [78] | |
| Cotton | Mac7 (Tolerant) | --- | Coker 312 | --- | 6,583 unique genetic variants in NBS genes of Mac7; Cotton leaf curl disease [6] | |
| Sugarcane | Saccharum spontaneum (Wild) | Higher contribution | Saccharum officinarum | Lower contribution | More differentially expressed NBS-LRRs under disease in modern hybrids; Multiple diseases [7] |
Domain Architecture and Clustering Patterns
A detailed examination of the protein domains within NBS-LRR genes reveals further distinctions between resistant and susceptible lines. In pepper, 252 NBS-LRR genes were classified, with a dominant majority (248) belonging to the non-TIR (nTNL) subfamily and only 4 to the TIR-NBS-LRR (TNL) subfamily [95]. A striking 54% of these genes were found to be physically clustered into 47 distinct groups across the chromosomes, with chromosome 3 being a major hotspot [95].
This clustered distribution, driven by tandem duplications, is a common evolutionary mechanism for expanding the resistance gene repertoire. A similar non-random, clustered distribution was observed in the tung tree system [78]. Furthermore, specific domain losses have been documented in susceptible cultivars. For instance, the susceptible V. fordii lacks certain LRR domains (LRR1 and LRR4) that are present in its resistant counterpart, V. montana, suggesting that the loss of these protein-protein interaction domains could compromise pathogen recognition [78].
Table 2: NBS-LRR Gene Subfamily Classification in Different Species
| Species | Total NBS-LRR Genes | CNL / nTNL Genes | TNL Genes | Other/Truncated | Notes | Citation |
|---|---|---|---|---|---|---|
| Pepper | 252 | 248 | 4 | - | 2 genes were typical CNL; 200 lacked both CC & TIR [95] | |
| V. montana (Resistant) | 149 | 98 (65.8%) | 12 (8.1%) | 39 | 2 genes contained both CC and TIR domains [78] | |
| V. fordii (Susceptible) | 90 | 49 (54.4%) | 0 | 41 | Complete absence of TIR-domain-containing NBS-LRRs [78] | |
| Wheat | 2,406 | - | - | - | Categorized into N, CN, NL, and CNL structural classes [96] |
Functional Validation of NBS Gene Function
Key Experimental Protocols for Functional Validation
Identifying genomic differences is only the first step; proving the functional role of specific NBS genes is essential. The following are key methodologies cited in the literature.
1. Virus-Induced Gene Silencing (VIGS): This is a powerful reverse-genetics tool used to rapidly assess gene function. The protocol involves inserting a fragment of the target gene (e.g., an NBS-LRR gene) into a viral vector. This modified virus is then used to infect plants. As the virus spreads, it triggers a defense mechanism that silences the expression of the plant's own target gene.
- Application: In resistant cotton, silencing of a specific NBS gene (GaNBS from OG2) via VIGS demonstrated its critical role in reducing virus titers, thereby validating its function in conferring resistance to cotton leaf curl disease [6]. Similarly, VIGS was used in tung tree to confirm that Vm019719 mediates resistance against Fusarium wilt [78].
2. Expression Profiling (RNA-seq & qRT-PCR): This involves quantifying the transcript levels of NBS genes in resistant and susceptible lines before and after pathogen challenge.
- Protocol: Researchers collect tissue from inoculated and mock-treated plants at multiple time points. Total RNA is extracted, and libraries are prepared for sequencing (RNA-seq) or analyzed by quantitative reverse-transcription PCR (qRT-PCR) for specific genes.
- Application: A study in tomato comparing resistant and susceptible lines infected with Xanthomonas perforans used RNA-seq to identify thousands of differentially expressed genes, including NBS-LRRs and defense-related transcription factors, providing insights into the timing and magnitude of the defense response [97].
3. Protein Interaction Assays (Protein-Ligand & Y2H): These assays test the physical interaction between NBS proteins and other molecules.
- Protocol: For protein-ligand interaction, molecular docking simulations or biochemical assays can be used to validate the binding of NBS proteins to nucleotides like ADP/ATP. For protein-protein interaction, yeast-two-hybrid (Y2H) is commonly used to test for direct binding between an NBS protein and a pathogen effector or host protein.
- Application: Research on cotton NBS proteins showed strong interaction with ADP/ATP and with core proteins of the cotton leaf curl disease virus, indicating a direct role in pathogen recognition and signal transduction [6].
Signaling Pathways and Regulatory Mechanisms in Plant Immunity
NBS-LRR proteins are central components of Effector-Triggered Immunity (ETI). The following diagram illustrates the core signaling pathway and the key experimental workflow for its validation.
Diagram 1: NBS-LRR mediated immunity and functional validation workflow. This diagram illustrates the simplified signaling pathway in Effector-Triggered Immunity (ETI), where pathogen effector recognition by an NBS-LRR protein triggers a defense response. The surrounding workflow outlines the key experimental steps for functionally validating the role of a specific NBS gene, from identification to interaction studies.
A critical insight from functional studies is that resistance is not always determined by the mere presence or absence of an NBS gene. In the tung tree model, the orthologous gene pair Vf11G0978 (susceptible) and Vm019719 (resistant) exhibited distinct expression patterns. The resistance gene Vm019719 was activated by the transcription factor VmWRKY64. In the susceptible cultivar, the allelic counterpart had a non-functional promoter due to a deletion in the W-box element, preventing its upregulation during infection [78]. This highlights how regulatory variations, in addition to coding sequence differences, can underlie susceptibility.
The Scientist's Toolkit: Key Research Reagents and Solutions
The following table details essential materials and tools used in the featured experiments for NBS gene identification and validation.
Table 3: Essential Research Reagents for NBS Gene Analysis
| Reagent / Solution | Function / Application | Specific Examples from Literature |
|---|---|---|
| HMMER Software | Identification of NBS-domain-containing genes from whole-genome sequences using hidden Markov models. | Used to identify 239 NBS-LRR genes across two tung tree genomes [78]. |
| OrthoFinder | Phylogenetic orthology inference to group NBS genes into orthogroups (OGs) across species. | Used to identify 603 orthogroups in a 34-species analysis; revealed core and unique OGs [6]. |
| VIGS Vectors | Virus-induced gene silencing vectors for rapid functional characterization of candidate NBS genes. | Used to silence GaNBS in cotton and Vm019719 in tung tree, confirming their role in resistance [6] [78]. |
| RNA-seq Library Prep Kits | Preparation of cDNA libraries for transcriptome sequencing to profile gene expression under stress. | Used to analyze differentially expressed genes in tomato, wheat, and cotton upon pathogen infection [6] [97] [98]. |
| MEME Suite | Discovery of conserved motifs in nucleotide or protein sequences of NBS-LRR genes. | Used for motif analysis of conserved NBS-LRR genes in sugarcane and related grasses [7]. |
The deep genomic comparison between tolerant and susceptible cultivars consistently reveals that architectural features of NBS genes—including their copy number, structural subfamily, domain composition, and genomic clustering—are fundamental determinants of disease resistance. The expansion of specific NBS lineages through tandem duplication in resistant genotypes provides a broader arsenal for pathogen recognition. Furthermore, the functional validation of these genes through VIGS and expression analyses moves beyond correlation to causation, pinpointing individual NBS genes critical for defense. The emerging paradigm confirms that superior resistance in tolerant cultivars is often a quantitative and qualitative trait, underpinned by a more robust and responsive NBS gene repertoire. Future research and breeding efforts must therefore continue to leverage comparative genomics and functional tools to identify and deploy these critical genetic elements.
Plant immunity often relies on a sophisticated innate immune system where nucleotide-binding site-leucine-rich repeat (NBS-LRR) genes play a pivotal role in pathogen recognition and defense activation [99] [100]. These resistance (R) genes constitute one of the largest and most dynamic gene families in plant genomes, with their numbers varying dramatically between species—from dozens to over a thousand [101]. Understanding how these crucial genetic elements evolve and are maintained across related species is fundamental to breeding durable disease resistance in crops. Synteny and ortholog analysis provides a powerful comparative genomics framework to trace the evolutionary history of R genes across species by identifying conserved genomic regions and lineage-specific adaptations [48] [102]. This approach enables researchers to predict functional resistance genes in less-studied crops based on well-characterized models and to understand the dynamic evolutionary processes that shape plant immune systems over millions of years.
Methodological Framework: Approaches for Comparative Analysis of Resistance Loci
Identification and Classification of NBS-Encoding Genes
The foundation of any comparative analysis begins with the comprehensive identification of NBS-encoding genes across species. The standard methodological pipeline involves:
HMMER-based domain detection: Using Hidden Markov Model profiles (e.g., Pfam NB-ARC domain PF00931) to scan genome sequences with trusted cutoff values [99] [48] [100]. This initial step typically employs HMMER V3.0 programme with "trusted cutoff" as threshold.
Domain architecture characterization: Identifying associated protein domains through complementary approaches:
Manual curation and validation: Removing redundant hits and verifying domain integrity through manual inspection and cross-referencing with databases like PRGDB [103]. This step often eliminates false positives such as kinase domains that share partial similarity with NBS domains [100].
Synteny and Orthology Analysis
Identifying homologous relationships across species relies on several computational approaches:
OrthoFinder pipeline: Utilizing tools like DIAMOND for fast sequence similarity searches and MCL clustering algorithm for orthogroup prediction [101]. This approach efficiently handles large multi-genome datasets.
Synteny block identification: Using MCScanX or similar algorithms to detect collinear genomic regions across species, with parameters typically set to require a minimum of 5-10 homologous genes in a window [48].
Phylogenetic reconciliation: Constructing gene trees using Maximum Likelihood methods (e.g., FastTreeMP with 1000 bootstrap replicates) and reconciling them with species trees to infer duplication and loss events [101] [102].
Table 1: Key Bioinformatics Tools for Synteny and Ortholog Analysis
| Tool Category | Specific Tools | Key Function | Typical Parameters |
|---|---|---|---|
| Domain Identification | HMMER v3, PfamScan | NBS domain detection | E-value < 1×10⁻⁴ to 1×10⁻²⁰ |
| Motif Analysis | MEME Suite | Conserved motif discovery | Motif width: 6-50 aa; Count: 8-10 |
| Orthology Detection | OrthoFinder, DIAMOND | Orthogroup clustering | Default parameters with MCL inflation 1.5-3.0 |
| Synteny Analysis | MCScanX, JCVI | Collinear block identification | Minimum 5 genes, E-value < 1×10⁻¹⁰ |
| Phylogenetics | FastTreeMP, MEGA6 | Evolutionary relationship inference | Bootstrap: 1000; WAG/GTR model |
Figure 1: Experimental workflow for comparative analysis of resistance loci across species
Comparative Genomic Analyses: Evolutionary Patterns of NBS Genes
Dynamic Evolutionary Patterns Across Plant Families
Comparative genomics has revealed that NBS gene families follow distinct evolutionary trajectories in different plant lineages, influenced by both whole genome duplications (WGD) and small-scale duplications:
Solanaceae species exhibit divergent evolutionary patterns: potato shows "consistent expansion," tomato demonstrates "first expansion and then contraction," while pepper presents a "shrinking" pattern [102]. This variation occurs despite their relatively recent common ancestry.
Brassica species experienced significant gene loss following whole genome triplication, with NBS-encoding homologous gene pairs on triplicated regions being rapidly deleted or lost [48]. However, species-specific tandem duplications subsequently contributed to gene family expansion.
Cucurbitaceae species display frequent gene losses and limited gene duplications, resulting in relatively small NBS gene complements (<100 genes), with Citrullus lanatus (watermelon) possessing only 45 NBS-encoding genes [102].
Table 2: Evolutionary Patterns of NBS Genes Across Plant Families
| Plant Family | Representative Species | NBS Gene Count | Dominant Subclass | Evolutionary Pattern | Main Driver |
|---|---|---|---|---|---|
| Solanaceae | Potato (S. tuberosum) | 447 | CNL | Consistent expansion | Tandem duplication |
| Tomato (S. lycopersicum) | 255 | CNL | Expansion then contraction | Tandem duplication | |
| Pepper (C. annuum) | 306 | CNL | Shrinking | Gene loss | |
| Brassicaceae | A. thaliana | 167 | Mixed | Expansion/contraction | WGD + tandem duplication |
| B. oleracea | 157 | Mixed | Post-WGT loss | Whole genome triplication | |
| B. rapa | 206 | Mixed | Species-specific expansion | Tandem duplication | |
| Musaceae | M. acuminata (A genome) | 116 | CNL | Moderate expansion | Tandem duplication |
| M. balbisiana (B genome) | 43 | CNL | Limited expansion | Tandem duplication | |
| Cucurbitaceae | C. sativus (cucumber) | <100 | CNL | Frequent gene loss | Limited duplications |
Genomic Distribution and Cluster Organization
NBS genes typically display non-random chromosomal distributions with significant functional implications:
Clustered organization: In cassava, 63% of 327 NBS-LRR genes occur in 39 clusters across chromosomes, with most clusters being homogeneous (containing genes from a recent common ancestor) [100]. Similar clustering patterns are observed in Akebia trifoliata, where 41 of 64 mapped NBS genes are located in clusters, predominantly at chromosome ends [99].
Hotspots of resistance loci: Studies in rice have identified chromosomes 6, 11, and 12 as harboring over 64% of quantitative trait loci (QTLs) associated with blast resistance, indicating non-random distribution of functionally important resistance regions [103].
Tandem duplication prevalence: Across multiple plant families, species-specific tandem duplications represent the primary mechanism for NBS gene expansion and cluster formation [99] [102]. For example, in Akebia trifoliata, tandem and dispersed duplications produced 33 and 29 NBS genes respectively [99].
Case Studies: Synteny-Based Discovery of Orthologous Resistance Regions
Cross-Species Translation of Blast Resistance in Cereals
A compelling application of synteny analysis involves predicting orthologous resistance gene analogs (RGAs) across cereal species affected by Magnaporthe oryzae, the causal agent of blast disease:
Rice-to-cereal orthology prediction: Researchers used 21 rice R-QTLs and 4 meta-QTLs associated with blast resistance as queries to identify syntenic orthologs across Poaceae species [103]. This approach predicted 89 RGA orthologs of 74 rice R genes and RGAs from diverse cereal genomes including sorghum, maize, finger millet, wheat, and barley.
Expression validation: A selected set of rice RGA orthologs showed expression in blast-infected tissues of finger millet, supporting functional conservation despite species divergence [103].
Chromosomal conservation: Multiple R-QTLs and R-MQTLs were predicted on rice chromosomes 1, 6, and 11, with syntenic regions identified across cereal genomes, enabling cross-species resistance gene prediction [103].
Evolutionary History of NBS Genes in Solanaceae
Through phylogenetic analysis of NBS-encoding genes from potato, tomato, and pepper, researchers have reconstructed the evolutionary history of this gene family:
Ancestral gene reconstruction: Analysis indicates that present-day NBS-encoding genes in these three species were derived from approximately 150 CNL, 22 TNL, and 4 RNL ancestral genes in their common ancestor [102].
Independent evolutionary paths: After speciation, each lineage underwent independent gene loss and duplication events, giving rise to the discrepant gene numbers observed today [102].
Subclass-specific patterns: The earlier expansion of CNLs in the common ancestor led to the dominance of this subclass in gene numbers, while RNLs remained at low copy numbers, potentially due to their specialized functions in signaling rather than pathogen recognition [102].
Figure 2: Evolutionary divergence of NBS genes in Solanaceae species from a common ancestor
Table 3: Key Research Reagent Solutions for Synteny and Ortholog Analysis
| Reagent/Resource | Specific Examples | Function/Application | Key Features |
|---|---|---|---|
| Genome Databases | Phytozome, BRAD, Bolbase, NCBI Genome | Source of genomic sequences and annotations | Multi-species comparability, standardized formats |
| Domain Databases | Pfam, SMART, CDD | Protein domain identification and classification | Curated HMM profiles, evolutionary annotations |
| Orthology Tools | OrthoFinder, InParanoid, OrthoMCL | Orthogroup prediction and visualization | Handles large datasets, graphical output |
| Synteny Platforms | CoGE, PGDD, SynFind | Syntenic region identification | User-friendly interfaces, pre-computed analyses |
| Expression Databases | IPF, CottonFGD, Cottongen | Expression data for validation | Tissue/stress-specific profiles, FPKM values |
| Validation Tools | VIGS vectors, RNAi constructs | Functional validation of candidate genes | Transient silencing, phenotype confirmation |
Implications for Disease Resistance Breeding and Functional Validation
The insights gained from synteny and ortholog analysis have profound implications for resistance breeding programs and functional characterization of NBS genes:
Accelerated gene discovery: Synteny-based approaches enable researchers to rapidly identify candidate resistance genes in crop species by leveraging knowledge from well-characterized model plants. For example, orthologs of rice RGAs have been successfully predicted in wheat, maize, rye, and finger millet [103].
Durable resistance strategies: Understanding the evolutionary dynamics of NBS genes helps breeders design more durable resistance strategies by selecting for genes in stable genomic regions or creating pyramids with diverse evolutionary histories [103].
Cross-species resistance transfer: Studies in cereal blast pathosystems provide evidence that NBS-LRR genes from the same ancestor often retain similar functions between species, enabling informed transfer of resistance across taxonomic boundaries [103].
Expression-guided candidate prioritization: Transcriptome analyses reveal significant differences in NBS gene expression between resistant and susceptible cultivars facing various pathogens, providing valuable criteria for selecting candidate genes for functional validation [101] [104]. For instance, specific orthogroups (OG2, OG6, OG15) show upregulated expression in tolerant cotton accessions under cotton leaf curl disease pressure [101].
The integration of synteny analysis with functional validation approaches like virus-induced gene silencing (VIGS) creates a powerful framework for moving from genomic predictions to confirmed resistance function, ultimately contributing to more resilient crop varieties.
Conclusion
The functional validation of NBS-LRR genes is a critical pathway to unlocking durable disease resistance in crops. This synthesis demonstrates that a multi-faceted approach—combining evolutionary genomics, time-series transcriptomics, advanced machine learning, and robust functional tools like VIGS—is essential for moving from candidate gene lists to mechanistically understood resistance determinants. The consistent finding that resistant cultivars often possess a distinct NBS gene arsenal, particularly an enrichment of specific types like TNLs, provides a clear genetic basis for tolerance. Future research must prioritize the development of standardized validation pipelines and address the challenge of translating these discoveries from model systems to a wider range of agriculturally important crops, ultimately empowering the design of next-generation cultivars with built-in resilience to evolving pathogens.
References
- 1. Genome-Wide Characterization and Expression Pattern ... [https://www.mdpi.com/1422-0067/26/18/9063]
- 2. from nucleotide-binding leucine-rich repeat receptor functional ... [https://phytopatholres.biomedcentral.com/articles/10.1186/s42483-025-00387-5]
- 3. Genome-Wide Identification of NBS-LRR Family in Three ... [https://pmc.ncbi.nlm.nih.gov/articles/PMC12192410/]
- 4. Computational Strategies for Elucidating Plant Disease ... [https://www.sciencedirect.com/science/article/abs/pii/S0885576525003790]
- 5. Genome-wide analysis of NBS-LRR genes in Rosaceae ... [https://pmc.ncbi.nlm.nih.gov/articles/PMC9685399/]
- 6. Comparative analysis, diversification, and functional ... [https://www.nature.com/articles/s41598-024-62876-5]
- 7. Genome-wide analysis of NBS-LRR genes revealed ... [https://www.frontiersin.org/journals/plant-science/articles/10.3389/fpls.2023.1091567/full]
- 8. Genome-wide identification and characterization of NBS ... [https://pmc.ncbi.nlm.nih.gov/articles/PMC12125187/]
- 9. Genome-wide identification and characterization of NBS ... [https://www.nature.com/articles/s41598-025-03507-5]
- 10. Transcriptome analysis reveals key defense genes associated ... [https://bmcgenomics.biomedcentral.com/articles/10.1186/s12864-025-12056-0]
- 11. HMMER [https://grokipedia.com/page/HMMER]
- 12. Fast, sensitive detection of protein homologs using deep ... [https://pmc.ncbi.nlm.nih.gov/articles/PMC12167706/]
- 13. Plant Nucleotide Binding Site–Leucine-Rich Repeat (NBS ... [https://pmc.ncbi.nlm.nih.gov/articles/PMC3645687/]
- 14. Different patterns of gene structure divergence following gene ... [https://bmcgenomics.biomedcentral.com/articles/10.1186/1471-2164-14-652]
- 15. Genome-wide mapping of NBS-LRR genes and their ... [https://bmcplantbiol.biomedcentral.com/articles/10.1186/1471-2229-12-139]
- 16. Lineage-specific duplications of NBS-LRR genes occurring ... [https://pmc.ncbi.nlm.nih.gov/articles/PMC5806312/]
- 17. Functional characterization of NBS-LRR genes reveals an ... [https://bmcbiol.biomedcentral.com/articles/10.1186/s12915-024-01836-x]
- 18. Genetic variation at transcription factor binding sites largely ... [https://www.nature.com/articles/s41588-025-02246-7]
- 19. Natural variation in SBRR1 shows high potential for sheath ... [https://pmc.ncbi.nlm.nih.gov/articles/PMC12339379/]
- 20. Comparative genomics and bioinformatics approaches ... [https://pmc.ncbi.nlm.nih.gov/articles/PMC10929019/]
- 21. Genome-wide comparative analysis of NBS-encoding genes ... [https://bmcgenomics.biomedcentral.com/articles/10.1186/s12864-017-3682-x]
- 22. Genome-Wide In Silico Analysis of Leucine-Rich Repeat R ... [https://pmc.ncbi.nlm.nih.gov/articles/PMC11855831/]
- 23. Genome-wide comparative analysis of NBS-encoding ... [https://www.omicsdi.org/dataset/biostudies-literature/S-EPMC5388996]
- 24. Integrative GWAS and transcriptomics reveal GhAMT2 as a ... [https://www.frontiersin.org/journals/plant-science/articles/10.3389/fpls.2025.1563466/full]
- 25. Comparative single-cell transcriptomic map reveals ... [https://www.sciencedirect.com/science/article/pii/S2090123225002565]
- 26. Comparative analysis, diversification, and functional ... [https://pubmed.ncbi.nlm.nih.gov/38789717/]
- 27. Genome-Wide Analysis of the NBS-LRR Gene Family and ... [https://www.mdpi.com/2311-7524/10/12/1293]
- 28. Solanum pan-genetics reveals paralogues as ... [https://www.nature.com/articles/s41586-025-08619-6]
- 29. RNA Sequencing | BioRender Science Templates [https://www.biorender.com/template/rna-sequencing]
- 30. Comparative Transcriptome Profiling of Resistant and ... [https://pmc.ncbi.nlm.nih.gov/articles/PMC6940782/]
- 31. Comparative Transcriptome Analyses of Gene Expression ... [https://www.frontiersin.org/journals/plant-science/articles/10.3389/fpls.2017.01422/full]
- 32. Comparative RNA-seq analysis of resistant and ... [https://www.nature.com/articles/s41598-023-45937-z]
- 33. Comparative transcriptome profiling of resistant and ... [https://bmcplantbiol.biomedcentral.com/articles/10.1186/s12870-022-03963-5]
- 34. Analytical Validation of a Genomic Newborn Screening ... [https://pmc.ncbi.nlm.nih.gov/articles/PMC12551001/]
- 35. Genetic Variants Detection Based on Weighted Sparse Group ... [https://pmc.ncbi.nlm.nih.gov/articles/PMC7063084/]
- 36. A review of big data and medical research - PMC [https://pmc.ncbi.nlm.nih.gov/articles/PMC7323266/]
- 37. Lasso algorithm and support vector machine strategy to ... [https://pubmed.ncbi.nlm.nih.gov/36253715/]
- 38. Comparison of LASSO and random forest models for ... [https://bmcmedinformdecismak.biomedcentral.com/articles/10.1186/s12911-023-02407-w]
- 39. a comparative study of resistant and susceptible cultivars [https://bmcplantbiol.biomedcentral.com/articles/10.1186/s12870-023-04633-w]
- 40. A clinical knowledge graph-based framework to prioritize ... [https://bmcbioinformatics.biomedcentral.com/articles/10.1186/s12859-025-06096-2]
- 41. Identification of Hub Genes Using Co-Expression Network ... [https://pmc.ncbi.nlm.nih.gov/articles/PMC6886326/]
- 42. Weighted gene co-expression network analysis identifies ... [https://www.frontiersin.org/journals/genetics/articles/10.3389/fgene.2023.1009462/full]
- 43. Weighted gene co-expression network analysis identifies ... [https://www.nature.com/articles/s41598-021-81888-z]
- 44. A Protocol for Weighted Gene Co-expression Network ... [https://pmc.ncbi.nlm.nih.gov/articles/PMC12457846/]
- 45. Use of a graph neural network to the weighted gene co ... [https://www.nature.com/articles/s41598-022-13796-9]
- 46. Hypergraph-based analysis of weighted gene co- ... [https://www.frontiersin.org/journals/genetics/articles/10.3389/fgene.2025.1560841/full]
- 47. Weighted gene co-expression network analysis reveals hub ... [https://bmcplantbiol.biomedcentral.com/articles/10.1186/s12870-024-05145-x]
- 48. Genome-wide comparative analysis of NBS-encoding genes ... [https://bmcgenomics.biomedcentral.com/articles/10.1186/1471-2164-15-3]
- 49. The landscape of sequence variations between resistant and ... [https://bmcplantbiol.biomedcentral.com/articles/10.1186/s12870-024-05742-w]
- 50. Large-scale SNP screenings identify markers linked with ... [https://www.nature.com/articles/s41598-017-01338-7]
- 51. Genome-wide SNP and InDel mutations in Mycobacterium ... [https://pmc.ncbi.nlm.nih.gov/articles/PMC6962771/]
- 52. Multiparametric and accurate functional analysis of genetic ... [https://www.nature.com/articles/s41588-022-01224-7]
- 53. Integrating genetic and gene expression data in network ... [https://pmc.ncbi.nlm.nih.gov/articles/PMC12070578/]
- 54. Efficient and easy gene expression and genetic variation ... [https://www.nature.com/articles/s41598-025-93067-5]
- 55. GRLGRN: graph representation-based learning to infer gene ... [https://bmcbioinformatics.biomedcentral.com/articles/10.1186/s12859-025-06116-1]
- 56. An updated comparison of microarray and RNA-seq for ... [https://pmc.ncbi.nlm.nih.gov/articles/PMC12016467/]
- 57. The Role of Microarray in Modern Sequencing [https://www.mdpi.com/2673-6284/14/3/55]
- 58. Pathway Analysis for Genome-wide Genetic Variation Data [https://pmc.ncbi.nlm.nih.gov/articles/PMC8286309/]
- 59. A Review of Pathway-Based Analysis Tools That Visualize ... [https://www.frontiersin.org/journals/genetics/articles/10.3389/fgene.2017.00174/full]
- 60. functional validation of genetic variants - PMC - PubMed Central [https://pmc.ncbi.nlm.nih.gov/articles/PMC5959958/]
- 61. Development of Strategies to Decrease False Positive ... [https://pmc.ncbi.nlm.nih.gov/articles/PMC7712114/]
- 62. Machine Learning Methods Improve Specificity in Newborn ... [https://www.mdpi.com/2218-1989/13/2/304]
- 63. Bioinformatic-Based Approaches for Disease-Resistance ... [https://www.mdpi.com/2073-4395/11/11/2259]
- 64. Cloning and Functional Validation of the Candidate Gene ... [https://www.mdpi.com/2077-0472/15/14/1561]
- 65. Identification and functional validation of a new gene ... [https://pmc.ncbi.nlm.nih.gov/articles/PMC11811538/]
- 66. Comprehensive Analysis and Functional Verification of the ... [https://www.mdpi.com/1422-0067/24/3/1812]
- 67. Clinical utility and cost-effectiveness of BeginNGS newborn ... [https://pmc.ncbi.nlm.nih.gov/articles/PMC12625857/]
- 68. BeginNGS® Newborn Screening by Genome Sequencing ... [https://radygenomics.org/2024/beginngs-newborn-screening-by-genome-sequencing-shown-to-be-safe-and-effective-in-two-clinical-studies/]
- 69. Improving newborn screening accuracy through genome ... [https://pmc.ncbi.nlm.nih.gov/articles/PMC12628566/]
- 70. Population-based, first-tier genomic newborn screening in ... [https://www.nature.com/articles/s41591-024-03465-x]
- 71. Identification and genetic analysis of candidate genes for ... [https://www.frontiersin.org/journals/plant-science/articles/10.3389/fpls.2025.1520999/full]
- 72. Genome-Wide Identification of NBS-LRR Family in Three ... [https://www.mdpi.com/2073-4425/16/6/680]
- 73. Optimizing RNA quality in cryopreserved tissues without ... [https://pmc.ncbi.nlm.nih.gov/articles/PMC12584263/]
- 74. NBS-LRR genes of Musa acuminata is involved in disease ... [https://www.sciencedirect.com/science/article/abs/pii/S0304423824005181]
- 75. Frontiers | Identification and functional validation of a new gene conferring resistance to Soybean Mosaic Virus strains SC4 and SC20 in soybean [https://www.frontiersin.org/journals/plant-science/articles/10.3389/fpls.2024.1518829/full]
- 76. Integrating genetic and gene expression data in network ... [https://bmcbioinformatics.biomedcentral.com/articles/10.1186/s12859-025-06143-y]
- 77. Integrating genetic and transcriptomic data to identify ... [https://www.nature.com/articles/s41366-025-01898-z]
- 78. Functional characterization of NBS-LRR genes reveals an ... [https://pmc.ncbi.nlm.nih.gov/articles/PMC10898138/]
- 79. Efficient Virus-Induced Gene Silencing (VIGS) Method for ... [https://pmc.ncbi.nlm.nih.gov/articles/PMC12115190/]
- 80. Cotton CC-NBS-LRR Gene GbCNL130 Confers ... [https://www.frontiersin.org/journals/plant-science/articles/10.3389/fpls.2021.695691/full]
- 81. Plant NBS-LRR proteins in pathogen sensing and host defense [https://pmc.ncbi.nlm.nih.gov/articles/PMC1973153/]
- 82. RNA‐binding proteins orchestrating immunity in plants - PMC [https://pmc.ncbi.nlm.nih.gov/articles/PMC12425495/]
- 83. A unique wheat disease resistance-like gene governs ... [https://pmc.ncbi.nlm.nih.gov/articles/PMC2922177/]
- 84. The Shape and Structure of Proteins - NCBI - NIH [https://www.ncbi.nlm.nih.gov/books/NBK26830/]
- 85. A wheat CC-NBS-LRR protein Ym1 confers WYMV ... [https://www.nature.com/articles/s41467-025-58816-0]
- 86. Evolution patterns of NBS genes in the genus Dendrobium ... [https://bmcplantbiol.biomedcentral.com/articles/10.1186/s12870-022-03904-2]
- 87. Participation of host cell proteins in inclusion bodies of non ... [https://virologyj.biomedcentral.com/articles/10.1186/s12985-025-02784-w]
- 88. The genome and GeneBank genomics of allotetraploid ... [https://pmc.ncbi.nlm.nih.gov/articles/PMC11985347/]
- 89. NBS-Encoding Genes in Brassica napus Evolved Rapidly ... [https://www.frontiersin.org/journals/plant-science/articles/10.3389/fpls.2019.00026/full]
- 90. Evolutionary balance between LRR domain loss and young ... [https://bmcgenomics.biomedcentral.com/articles/10.1186/s12864-019-6212-1]
- 91. Genomic insights into divergence and dual domestication of ... [https://genomebiology.biomedcentral.com/articles/10.1186/s13059-017-1167-5]
- 92. Genome-wide association analysis uncovers rice blast ... [https://www.nature.com/articles/s42003-024-06244-z]
- 93. The potential of genome editing to create novel alleles of ... [https://pmc.ncbi.nlm.nih.gov/articles/PMC11201548/]
- 94. Integrative Genomics and Precision Breeding for Stress ... [https://www.mdpi.com/2073-4395/15/10/2393]
- 95. Phylogenetic, Structural, and Evolutionary Insights into ... [https://www.mdpi.com/1422-0067/26/5/1828]
- 96. Genome-Wide Analysis of TaNBS Resistance Genes and ... [https://zwxb.chinacrops.org/EN/10.3724/SP.J.1006.2016.00795]
- 97. Comparative Transcriptome Analysis of Resistant and ... [https://www.frontiersin.org/journals/plant-science/articles/10.3389/fpls.2015.01173/full]
- 98. Comparative transcriptomes reveal insights into different host ... [https://bmcplantbiol.biomedcentral.com/articles/10.1186/s12870-025-06553-3]
- 99. Identification and Characterization of NBS Resistance ... [https://pmc.ncbi.nlm.nih.gov/articles/PMC8585750/]
- 100. Identification and distribution of the NBS -LRR gene family in the... [https://bmcgenomics.biomedcentral.com/articles/10.1186/s12864-015-1554-9]
- 101. analysis, diversification, and Comparative of... functional validation [https://www.nature.com/articles/s41598-024-62876-5?error=cookies_not_supported&code=95da165c-75ff-42d2-9bbb-aa8142196912]
- 102. Distinct Patterns of Gene Gain and Loss [https://pmc.ncbi.nlm.nih.gov/articles/PMC5427506/]
- 103. Functional genomic regions associated with blast disease ... [https://www.sciencedirect.com/science/article/abs/pii/S0885576524001280]
- 104. -wide identification, characterization, and evolutionary analysis... Genome [https://link.springer.com/article/10.1007/s10142-022-00925-w]