Ensuring Robustness in High-Throughput Screening: A Comprehensive Guide for Reliable Phenotyping and Drug Discovery
This article provides a comprehensive framework for establishing robust high-throughput screening (HTS) protocols in biomedical research and drug development.
Ensuring Robustness in High-Throughput Screening: A Comprehensive Guide for Reliable Phenotyping and Drug Discovery
Abstract
This article provides a comprehensive framework for establishing robust high-throughput screening (HTS) protocols in biomedical research and drug development. It explores the foundational principles of HTS, detailing key methodological approaches including biochemical, cell-based, and phenotypic assays. The content delivers practical strategies for troubleshooting common pitfalls, optimizing assay performance through metrics like Z'-factor, and implementing rigorous validation and comparative statistical analyses. Aimed at researchers and drug development professionals, this guide synthesizes current best practices to enhance the reliability, efficiency, and predictive power of high-throughput phenotyping campaigns, ultimately accelerating the journey from hit identification to viable lead compounds.
The Pillars of Robust High-Throughput Screening: Core Principles and Evolving Landscape
In the field of modern drug discovery and phenotyping research, screening methodologies form the cornerstone of initial candidate identification. High-Throughput Screening (HTS) is an automated, robotic assay process that rapidly conducts hundreds to thousands of biochemical or cell-based tests to identify active compounds, or "hits," from extensive chemical libraries [1]. It serves as a critical jump-start to the discovery pipeline, allowing researchers to quickly narrow thousands of possibilities down to a manageable number of promising leads for further investigation [1]. The evolution of this technology has given rise to Ultra-High-Throughput Screening (uHTS), which pushes the boundaries of scale and speed, enabling the screening of millions of compounds to exhaustively explore chemical space and significantly increase the probability of discovering novel therapeutic candidates [2] [3].
The drive toward uHTS is fueled by the increasing complexity of drug targets and the desire to screen ever-larger libraries. This is particularly relevant in high-throughput phenotyping robustness screening, where the goal is not only to identify hits but also to ensure that the screening process itself is reproducible, reliable, and generates physiologically relevant data. The core distinction lies in the throughput capacity, level of miniaturization, and the sophistication of the integrated automation and data analysis systems required.
Comparative Analysis: HTS vs. uHTS
The quantitative and qualitative differences between HTS and uHTS can be summarized in terms of throughput, technological requirements, and data output. The table below provides a structured comparison of their key attributes.
Table 1: Key Characteristics of HTS and uHTS
| Attribute | High-Throughput Screening (HTS) | Ultra-High-Throughput Screening (uHTS) |
|---|---|---|
| Throughput Range | Up to 100,000 compounds per day [4] | Over 300,000, potentially millions, of compounds per day [2] [4] |
| Typical Assay Format | 96-well, 384-well, and 1536-well microplates [5] [4] | 1536-well plates and higher-density formats; microfluidic droplets and chips [5] [6] |
| Screening Volume | Low microliter (µL) range | Nanoliter (nL) to low microliter (µL) range [4] |
| Primary Goal | Rapid identification of active compounds ("hits") from large libraries [1] | Comprehensive exploration of massive chemical libraries; genome-wide studies [2] [7] |
| Automation Level | Robotic automation for liquid handling and detection [1] | Highly sophisticated, integrated automated systems with minimal manual intervention [3] |
| Cost & Infrastructure | High initial investment in equipment and maintenance [2] | Significantly greater complexity and cost, requiring specialized infrastructure [4] |
The progression from HTS to uHTS is not merely a linear increase in speed but a fundamental shift in approach, facilitated by advances in miniaturization and fluid handling. While HTS is a powerful tool for many discovery campaigns, uHTS becomes essential when the chemical or genetic library is so vast that a lower-throughput method would be impractical or too time-consuming.
Quantitative Market and Technology Outlook
The adoption and development of screening technologies are reflected in the market's growth and segment analysis. The global HTS market, valued at an estimated $26.12 billion in 2025, is projected to grow at a compound annual growth rate (CAGR) of 10.7%, reaching $53.21 billion by 2032 [7]. Another analysis estimates the market will grow from $32.0 billion in 2025 to $82.9 billion by 2035 [2]. This robust growth is underpinned by continuous technological innovation and rising R&D investments in the pharmaceutical and biotechnology sectors [2] [8].
Within this expanding market, specific segments demonstrate particularly strong growth potential, indicating future trends. The following table summarizes the forecasted growth for key technologies and applications.
Table 2: High-Growth Segments in the Screening Market (2025-2035 Forecast)
| Segment | Category | Projected CAGR | Key Driver |
|---|---|---|---|
| Technology | Ultra-High-Throughput Screening | 12% [2] | Unprecedented ability to screen millions of compounds quickly for comprehensive exploration [2]. |
| Technology | Cell-Based Assays | Leading segment with 39.4% share in 2025 [2] | Demand for physiologically relevant data that more accurately replicates complex biological systems [2] [7]. |
| Application | Target Identification | 12% [2] | Capacity to rapidly assess large chemical libraries against diverse biological targets, accelerating early discovery [2]. |
| Application | Primary Screening | Leading segment with 42.7% share in 2025 [2] | Essential role in identifying active compounds from large libraries in the initial drug discovery phase [2]. |
Experimental Protocol: A Typical uHTS Workflow for Drug Discovery
The following protocol details a standard uHTS workflow for primary screening in drug discovery, which can be adapted for various phenotyping applications.
The diagram below illustrates the key stages of a uHTS campaign, from library preparation to hit confirmation.
Detailed Protocol Steps
Step 1: Library and Assay Preparation
- Compound Library Management: uHTS begins with the preparation of a diverse chemical library stored in high-density microplates (e.g., 384 or 1536-well format). Compound management systems use highly automated procedures for retrieval, nanoliter liquid dispensing, and quality control [4] [9]. Libraries can contain hundreds of thousands to millions of compounds.
- Assay Design and Miniaturization: The biological assay must be robust, reproducible, and miniaturized for 1536-well plates or microfluidic volumes (1-2 µL) to conserve reagents [4] [5]. Assays are fully validated for their pharmacological relevance and statistical robustness (e.g., calculating Z'-factor > 0.5) before the primary screen [4].
- Reagent Dispensing: Using non-contact acoustic or solenoid-based liquid handlers, nanoliter volumes of compounds are transferred to assay plates. Subsequently, assay reagents, buffers, and cells (for cell-based assays) are dispensed automatically [4].
Step 2: Primary Ultra-High-Throughput Screening
- Automated Incubation and Processing: The assay plates are incubated under controlled conditions (e.g., temperature, CO₂) using robotic arms that shuttle plates between incubators and detectors. The entire process is managed by scheduling software to maintain assay timing consistency [3].
- Signal Detection and Readout: After incubation, plates are moved to high-speed detectors. Common detection methods include:
- Fluorescence/Luminescence Intensity: Highly sensitive and adaptable for enzymatic and cell-based assays [4].
- High-Content Imaging: Provides multiparametric data on cellular morphology and subcellular localization [8].
- Label-Free Technologies: Such as mass spectrometry, which is increasingly used for unlabeled biomolecules [4].
Step 3: Hit Identification and Data Analysis
- Raw Data Processing: Automated data analysis pipelines process the raw signal data, normalizing it against positive and negative controls on each plate to account for inter-plate variability.
- Hit Selection: "Hits" are identified based on a pre-defined activity threshold, commonly set using statistical measures like a percentage of control activity or a certain number of standard deviations from the mean of negative controls [4].
- Data Triage and cheminformatics: Advanced analysis is critical due to the high potential for false positives from assay interference (e.g., chemical reactivity, autofluorescence, colloidal aggregation) [4]. Machine learning models and expert-rule-based filters are applied to triage the output, ranking compounds by their probability of being true positives [4].
Step 4: Hit Confirmation
- Compound Re-testing: The primary "hit" compounds are re-tested, often in dose-response curves, to confirm their activity from the original screening samples.
- Counter-Screening: Confirmed hits are tested against unrelated targets or assays to evaluate their specificity and rule out promiscuous or non-selective compounds [3] [4]. This step is crucial for ensuring the robustness of the screening outcomes before committing resources to secondary screening.
The Scientist's Toolkit: Essential Research Reagents and Materials
The successful execution of an HTS/uHTS campaign relies on a suite of specialized reagents, instruments, and consumables.
Table 3: Essential Research Reagent Solutions for HTS/uHTS
| Item | Function/Description | Application Note |
|---|---|---|
| Liquid Handling Systems | Automated robots for precise, non-contact dispensing of nanoliter to microliter volumes of samples and reagents [7] [4]. | Essential for assay miniaturization and reproducibility. Systems like the firefly platform use positive displacement for high-density pipetting [7]. |
| HTS-Optimized Assay Kits | Ready-to-use, validated reagent kits (e.g., reporter assays, viability assays) that simplify setup and ensure consistency [2]. | The reagents and kits segment holds a leading 36.5% market share due to demand for reliability and reproducibility [2]. |
| High-Density Microplates | Microplates with 384, 1536, or even 3456 wells, designed for low-volume assays and compatible with automation [5] [1]. | The foundation of assay miniaturization; 1536-well plates are standard for uHTS to enable screening of >300,000 compounds per day [4]. |
| Cell Lines for Phenotypic Screening | Engineered or disease-relevant cell lines (e.g., iPSCs) used in cell-based assays to provide physiologically relevant data [5] [7]. | Cell-based assays are the leading technology segment; 3D cell cultures and organoids are gaining traction for better mimicking in vivo conditions [8] [5]. |
| Detection Reagents & Probes | Fluorescent, luminescent, or label-free probes that generate a measurable signal upon biological activity (e.g., substrate cleavage, ion flux) [4]. | Fluorescence-based methods are most common due to sensitivity and ease of use. Mass spectrometry is an emerging label-free alternative [4]. |
Advanced Applications and Future Perspectives
The application of HTS and uHTS has expanded far beyond conventional small-molecule drug discovery, becoming pivotal in advanced research domains. In functional genomics, HTS is combined with CRISPR-Cas9 or RNAi technologies for genome-wide screens to study gene function and identify novel therapeutic targets [10] [7]. In toxicology, initiatives like the Tox21 program use HTS with in vitro assays in a high-throughput, concentration-responsive manner to predict chemical toxicity and reduce reliance on animal studies [4]. Furthermore, HTS is instrumental in protein engineering, facilitating the directed evolution of enzymes with enhanced properties or novel functions through ultrahigh-throughput screening toolkits like fluorescence-activated cell sorting (FACS) and microfluidics-based droplet sorting [6].
The future of screening is being shaped by several key technological integrations. The use of 3D cell models, such as organoids and spheroids, in HTS platforms is rapidly advancing to provide more physiologically relevant data that can bridge the gap between in vitro models and in vivo situations [5] [8] [1]. The integration of Artificial Intelligence (AI) and Machine Learning is reshaping the market by enhancing data analysis, predicting molecular interactions, optimizing compound libraries, and streamlining assay design, thereby reducing time and costs [2] [7]. Finally, microfluidic and droplet-based technologies are enabling unprecedented miniaturization and speed, allowing for single-cell analysis and the screening of vast libraries with minimal reagent consumption [5] [6]. These innovations collectively ensure that HTS and uHTS will remain at the forefront of accelerating scientific discovery and therapeutic development.
The Strategic Shift from Manual to Automated, Miniaturized Systems
The field of biological screening is undergoing a profound transformation, marked by a strategic shift from manual, low-throughput methods to automated, miniaturized, and data-rich systems. This evolution is particularly critical in high-throughput phenotyping robustness screening, where the ability to maintain stable performance across diverse conditions is essential for advancing drug discovery and basic research. High-throughput phenotyping enables the comprehensive assessment of complex traits—including development, growth, resistance, and physiology—across vast numbers of biological samples [11]. The move toward automation addresses a significant bottleneck in research, as traditional phenotyping is often costly, laborious, and destructive, limiting the scale and precision of experimental outcomes [11].
Robustness, defined as a system's ability to maintain stable performance despite internal or external challenges, has emerged as a crucial phenotypic property [12]. In the context of high-throughput screening, robustness ensures that results are reproducible and reliable across different perturbation spaces—sets of relevant environmental or experimental conditions [12]. Quantifying robustness provides researchers with valuable insights into the genetic and metabolic mechanisms underlying stable performance, enabling the development of more predictable and effective therapeutic interventions [12].
The Evolution of Screening Methodologies
Quantitative Comparison of Screening Approaches
Table 1: Evolution from Manual to Automated, Miniaturized Screening Systems
| Screening Characteristic | Traditional Manual Methods | Modern Automated Systems |
|---|---|---|
| Throughput Capacity | Low (3-8 plants per treatment, full day for harvest) [13] | High (hundreds of genotypes, thousands of plants) [13] |
| Data Points per Experiment | Limited by human capacity | Extensive, automated data collection |
| Measurement Standardization | Prone to operator variability | Highly standardized through automation |
| Temporal Resolution | Limited by labor constraints | Frequent, non-destructive monitoring [13] |
| Financial Investment | Lower initial cost | High initial investment ($250M market in 2025) [14] |
| Operational Costs | High labor requirements | Reduced labor, higher maintenance |
| Data Complexity | Simple, manageable datasets | Complex, requires advanced analytics [14] |
Key Drivers for the Strategic Shift
The transition to automated systems is propelled by multiple converging factors. The phenotyping bottleneck has become particularly pronounced in plant sciences and drug discovery, where molecular tools have advanced rapidly while phenotypic characterization lagged behind [13]. Technological advancements in sensor technology, robotics, and data analytics have created enabling infrastructures for automation [13]. Additionally, the growing demand for improved crop yields and climate-resilient crops in agriculture, alongside the need for accelerated drug development timelines in pharmaceuticals, has increased the value proposition of high-throughput approaches [14] [15].
The integration of artificial intelligence and machine learning has been particularly transformative, allowing researchers to extract meaningful patterns from massive datasets generated by automated systems [11]. These technologies enable automated image analysis, predictive modeling, and the identification of subtle phenotypic patterns that would be imperceptible through manual observation [11].
Core Technologies Enabling the Transition
Automated Phenotyping Platforms
Various automated platforms have been developed to address specific research needs across biological domains. In plant phenotyping, systems like "PHENOPSIS" automate the assessment of plant responses to soil water stress, while "LemnaTec 3D Scanalyzer" systems enable non-invasive screening of salinity tolerance traits in rice [11]. For microbial studies, automated cultivation systems facilitate the high-throughput quantification of robustness across different perturbation spaces [12].
These platforms typically incorporate multiple sensor technologies, including digital RGB cameras, hyperspectral imagers, thermal cameras, and fluorescence imaging systems [13] [11]. The combination of diverse sensing modalities provides comprehensive phenotypic profiles that capture various aspects of biological response to environmental challenges.
Miniaturization and Experimental Standardization
Miniaturization represents a critical component of the strategic shift, enabling researchers to increase throughput while reducing resource consumption. The development of methods for creating multi-assay stock plates containing standardized inocula of multiple isolates has demonstrated how miniaturization can be achieved without sacrificing data quality [16]. This approach utilizes cultures grown to mid-log phase, aliquoted in set patterns into multi-well plates containing cryoprotectants like 50% glycerol, and stored at -80°C for future use [16].
Standardization protocols are essential for ensuring the robustness of miniaturized systems. Including control strains on each plate controls for intra-assay variability, while standardizing optical densities and growth conditions ensures reproducible starting points across experiments [16]. These methodological advances enable researchers to predict realistic standard deviations for multiple isolates in phenotypic assays and generate data for performance of power calculations for genotyping [16].
Application Notes: Experimental Protocols for Robustness Screening
Protocol 1: High-Throughput Phenotypic Screening for Microbial Robustness
Objective: To quantify robustness of microbial strains across multiple perturbation spaces.
Materials and Reagents:
- Microbial strains (wild-type and mutants)
- Multi-well culture plates (96 or 384-well)
- Liquid growth media appropriate for strains
- Chemical perturbagens or stress conditions
- Plate reader with temperature and shaking control
- Automated liquid handling system
Procedure:
- Strain Preparation: Grow overnight cultures of all strains to stationary phase in appropriate media.
- Inoculum Standardization: Dilute cultures to standardized optical density (OD600 = 0.1) using automated liquid handling.
- Plate Setup: Dispense 100 μL of standardized inoculum into each well of multi-well plates.
- Perturbation Application: Add chemical perturbagens or apply environmental stresses (temperature, pH, osmotic) using concentration gradients.
- Cultivation and Monitoring: Incubate plates with continuous shaking and monitor growth kinetics through OD measurements every 15-60 minutes.
- Data Collection: Record growth curves for 24-48 hours or until stationary phase is reached.
- Robustness Calculation: Quantify robustness using the Fano factor method, which is dimensionless, frequency-independent, and free from arbitrary controls [12].
Data Analysis:
- Calculate maximum growth rate and yield for each strain under each condition.
- Compute robustness as R = σ²/μ, where σ² is the variance of the phenotype across perturbations and μ is the mean phenotype across the same perturbations [12].
- Compare robustness scores across strains to identify genetic determinants of stable performance.
Protocol 2: Automated Plant Phenotyping for Stress Response
Objective: To non-invasively phenotype plant growth and stress responses under controlled conditions.
Materials and Reagents:
- Plant genotypes (wild-type and variants)
- Soil or hydroponic growth systems
- Automated phenotyping platform (e.g., LemnaTec, WIWAM, PhenoBox)
- RGB, fluorescence, and hyperspectral imaging sensors
- Automated watering and weighing systems
- Environmental control chambers
Procedure:
- Experimental Design: Randomize plant positions to account for micro-environmental variation.
- Plant Growth: Grow plants under controlled conditions with standardized light, temperature, and humidity.
- Automated Imaging: Program regular intervals for automated imaging using multiple sensor types.
- Stress Application: Implement controlled drought, salinity, or nutrient stress through automated environmental control.
- Data Acquisition: Collect images and sensor data automatically throughout the experiment.
- Image Analysis: Extract phenotypic traits using machine learning algorithms for image segmentation and analysis.
- Calibration: Establish calibration curves between digital biomass estimates and destructive measurements [13].
Data Analysis:
- Extract time-series data for growth-related traits (projected leaf area, digital biomass).
- Calculate stress response indices based on temporal changes in physiological traits.
- Account for diurnal variations in leaf angle and other periodic phenomena [13].
- Develop genotype-phenotype associations through genome-wide association studies.
The Scientist's Toolkit: Essential Research Reagent Solutions
Table 2: Key Research Reagents and Materials for High-Throughput Phenotyping
| Reagent/Material | Function | Application Notes |
|---|---|---|
| Multi-well Plates (96/384-well) | Miniaturized cultivation platform | Enable high-throughput screening; black walls with clear bottoms ideal for imaging [16] |
| Standardized Glycerol Stocks (50%) | Cryopreservation of standardized inocula | Ensure reproducible starting material across experiments [16] |
| Crystal Violet Stain | Biofilm quantification | Used in high-throughput biofilm assays; requires washing steps [16] |
| Fluorescent Dyes (e.g., FRET probes) | Molecular interaction reporting | Enable target-based screening; require specific filter sets [17] |
| Chemical Perturbagen Libraries | Induction of phenotypic diversity | Used to create perturbation spaces for robustness screening [12] |
| Sensor Solutions (e.g., pH, O₂ probes) | Environmental monitoring | Integrated into automated systems for real-time condition assessment |
| Cell Culture Media Formulations | Support of diverse microbial growth | Must be optimized for specific strains and conditions [12] |
Quantifying and Analyzing Robustness
Robustness Quantification Methodologies
The Fano factor-based robustness metric (R = σ²/μ) provides a powerful approach for quantifying phenotypic stability [12]. This method offers several advantages over traditional approaches: it is dimensionless, allowing comparison across different phenotypic measures; frequency-independent, making it suitable for diverse experimental designs; and free from arbitrary controls, as it doesn't require designation of a reference condition [12].
Application of this method to a dataset of Saccharomyces cerevisiae mutants identified 67 strains with maximal robustness (R = 0), including seven with mutations in temperature-sensitive alleles and 60 with non-essential gene deletions [12]. Further analysis revealed that genes associated with increased robustness were primarily linked to "cell polarity," "mitosis," or "unknown" functional regions, providing insights into the genetic architecture of robust performance [12].
Data Analysis and Integration Challenges
The shift to automated, high-throughput systems generates massive datasets that present significant analytical challenges. Machine learning and deep learning approaches have become essential tools for extracting meaningful biological insights from these complex data streams [11]. Convolutional neural networks (CNNs) now achieve state-of-the-art performance for image classification, object recognition, and image segmentation tasks in phenotypic analysis [11].
A critical consideration in data analysis is the need for appropriate calibration curves between proxy measurements and actual biological traits. For example, studies have demonstrated curvilinear relationships between projected leaf area and total leaf area in plants, where neglecting this non-linearity can result in significant errors despite high coefficients of determination [13]. Similarly, diurnal changes in leaf angle can cause deviations of more than 20% in plant size estimates from top-view cameras over the course of a day [13].
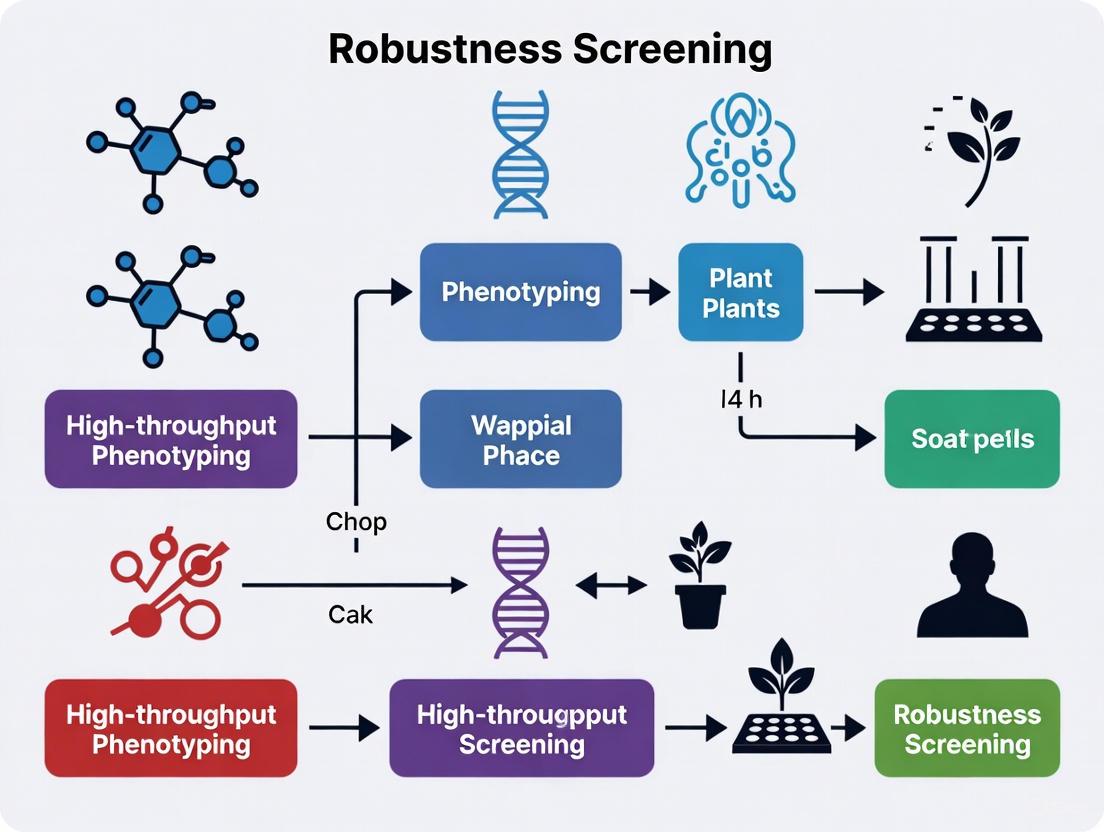
Visualization of High-Throughput Robustness Screening Workflows
Workflow for Microbial Robustness Screening
Diagram 1: Microbial robustness screening workflow for identifying genetic determinants of stable performance across perturbation spaces.
Automated Plant Phenotyping Data Pipeline
Diagram 2: Automated plant phenotyping data pipeline from image acquisition to genetic association studies.
The strategic shift from manual to automated, miniaturized systems represents a fundamental transformation in biological research methodology. This transition enables unprecedented scale in phenotypic characterization while introducing new capabilities for quantifying robustness—a critical phenotypic property that had been challenging to assess systematically. The integration of advanced sensor technologies, robotics, and computational analytics has created a new paradigm where researchers can simultaneously screen thousands of biological entities across multiple environmental conditions, generating rich datasets that reveal both performance and stability characteristics.
Future advancements in this field will likely focus on several key areas. The integration of artificial intelligence will continue to evolve, with deep learning approaches becoming increasingly sophisticated in their ability to extract subtle phenotypic patterns from complex data streams [11]. The development of more accessible systems will address current barriers to adoption, particularly for smaller research institutions and agricultural operations in developing economies [14] [18]. Additionally, the standardization of robustness metrics across different biological domains will facilitate comparative analyses and meta-studies, potentially revealing universal principles of biological stability [12].
As these technologies mature, they will progressively transform from specialized tools used in advanced research facilities to mainstream methodologies employed across diverse biological disciplines. This democratization of high-throughput phenotyping capabilities will accelerate discoveries in basic research while enabling practical applications in drug development, agricultural improvement, and environmental sustainability. The ongoing strategic shift toward automated, miniaturized systems thus represents not merely a methodological improvement, but a fundamental reimagining of how biological research is conducted in the pursuit of understanding and harnessing living systems.
High-Throughput Screening (HTS) is a foundational methodology in modern scientific research and drug discovery, enabling the rapid and efficient testing of thousands of chemical compounds or genetic constructs. By automating experimental processes, HTS accelerates the identification of "hits" – compounds or conditions that produce a desired biological effect. In the context of robustness screening for high-throughput phenotyping, these systems provide the scale and precision necessary to dissect complex biological mechanisms and identify potential therapeutic interventions [19]. The core value of HTS lies in its ability to transform a needle-in-a-haystack search into a manageable, data-driven discovery process, thereby bridging critical gaps in genomics and functional analysis [11].
A robust HTS framework integrates three synergistic components: automation for standardized sample handling, robotics for precise physical manipulation, and advanced detection systems for quantitative phenotypic measurement. This integration allows researchers to conduct large-scale screens with minimal human intervention, reducing labor-intensive processes and increasing experimental reproducibility. For phenotyping applications, this means tracking subtle morphological and physiological changes in response to genetic or chemical perturbations, providing insights into gene function, metabolic pathways, and disease mechanisms [20] [11].
Core Component 1: Automation Systems and Workflow Integration
Automation forms the backbone of any HTS operation, encompassing the hardware and software that standardize and expedite experimental procedures. The primary objective of automation is to enable the parallel processing of vast numbers of samples while minimizing variability and human error.
Liquid Handling and Microplate Platforms
Modern HTS relies on miniaturized assay formats to maximize throughput and minimize reagent consumption. Automated liquid handling systems manage the transfer of nanoliter to microliter volumes of samples and reagents across standardized microplate formats [19]. These systems are programmable for diverse protocols, including serial dilutions, reagent additions, and compound library management.
Table 1: Standard Microplate Formats in HTS
| Well Format | Typical Working Volume | Primary Applications | Throughput Consideration |
|---|---|---|---|
| 96-well | 50-200 µL | Assay development, secondary screening | Moderate |
| 384-well | 10-50 µL | Primary compound screening | High |
| 1536-well | 5-10 µL | Large-library primary screening | Very High |
| 3456-well | < 5 µL | Ultra-High-Throughput Screening (uHTS) | Ultra High |
Integrated Workflow Automation
Beyond liquid handling, a fully automated HTS platform may include plate hotels for sample storage, robotic arms for plate transfer between stations, incubators for controlling environmental conditions, and plate readers for endpoint detection. This integration creates a continuous workflow from sample preparation to data acquisition. Software orchestration is critical, linking the various hardware components and scheduling their operations to maximize efficiency and prevent bottlenecks. This level of automation is essential for phenotypic screens that require temporal monitoring of plant or cell growth over days or weeks [20] [21].
Core Component 2: Robotic Systems for Phenotyping and Manipulation
Robotics provide the physical interface between the automated system and the biological samples, enabling precise manipulation and non-destructive phenotyping over time. In contrast to simple automation, robotic systems incorporate sensing and decision-making capabilities for adaptive interactions.
Mobile Robotic Platforms for Phenotyping
Autonomous ground vehicles are increasingly deployed for high-throughput phenotyping, particularly in agricultural and plant biology research. These mobile robots are equipped with multi-sensor suites to navigate field or greenhouse environments and collect phenotypic data from large plant populations non-invasively [22] [23]. Key advantages include the ability to monitor dynamic changes in plant growth and architecture throughout the development cycle, providing richer datasets than single time-point measurements [23] [11].
Table 2: Robotic Platforms for High-Throughput Phenotyping
| Platform Type | Key Features | Advantages | Common Applications |
|---|---|---|---|
| Autonomous Ground Robots | Self-navigating, multi-sensor suites (cameras, LiDAR, hyperspectral imagers) | High-resolution data, capable of operating in dense canopies | Field-based plant phenotyping, morphological trait measurement [22] [23] |
| Gantry Systems | Fixed infrastructure, sensor arrays mounted on moving gantries | Highly precise positional control, repeatable measurements | Controlled environment phenotyping, high-resolution imaging of small plots [22] |
| Collaborative Robots (Cobots) | Power and force limiting, hand-guiding, safety-rated monitored stop | Safe human-robot interaction, flexible deployment | Laboratory automation, sample processing, intricate manipulations [24] [25] |
Robotic Manipulators and End-Effectors
For more intricate operations, robotic manipulators (arms) with specialized end-effectors are used. These systems can perform tasks such as seed planting, leaf sampling, or tissue harvesting with sub-millimeter precision. In drug discovery, robotic arms are integral to compound management systems, where they retrieve and store chemical library plates from high-density archives. The emergence of collaborative robots (cobots) that can work safely alongside human technicians has further expanded applications, particularly in sample preparation and quality control workflows [25]. Modern robotic safety standards, such as ANSI/A3 R15.06-2025, now emphasize the safety of the collaborative application rather than categorizing the robot itself as collaborative, reflecting a more nuanced approach to human-robot interaction [24].
Core Component 3: Detection and Imaging Systems
Detection systems are the sensory organs of HTS platforms, converting biological responses into quantifiable data. The selection of appropriate detection technologies is critical for capturing relevant phenotypic information with sufficient sensitivity and specificity.
Sensor and Imaging Modalities
A diverse array of sensors is available for phenotyping applications, each capturing different aspects of biological samples:
- 2D and 3D Vision Systems: High-resolution cameras capture morphological information. 3D vision systems have become particularly valuable, offering up to 25% greater accuracy in tasks like part-picking and inspection compared to traditional 2D systems [26].
- Hyperspectral and Multispectral Imaging: These sensors capture data across numerous wavelength bands, providing information on plant health, pigment composition, and water status that is not visible to the naked eye [11].
- Fluorescence Imaging: Used to monitor physiological processes such as photosynthetic efficiency, gene expression, or protein localization [11].
- Thermal Imaging: Measures canopy temperature as an indicator of stomatal conductance and water stress [11].
Performance Metrics for Detection Systems
The quality of an HTS detection system is quantified using several key performance metrics that ensure data reliability and robustness:
- Z'-factor: A statistical measure of assay quality that accounts for both the dynamic range of the signal and the data variation. A Z'-factor between 0.5 and 1.0 indicates an excellent assay robust enough for HTS [21] [19].
- Signal-to-Noise Ratio (S/N): Measures the strength of the desired signal relative to background noise.
- Signal Window: The separation between positive and negative controls, with values >2 generally considered robust [21].
- Coefficient of Variation (CV): Measures well-to-well and plate-to-plate reproducibility, with lower values indicating higher consistency.
Machine vision systems have demonstrated remarkable efficiency improvements, reducing inspection errors by over 90% and lowering defect rates by up to 80% compared to manual inspection [26].
Integrated Experimental Protocol: A Differential Growth Chemical Screen
The following detailed protocol exemplifies the integration of automation, robotics, and detection systems in a high-throughput differential chemical genetic screen, as adapted from a study identifying genotype-specific chemical regulators of plant growth [20].
Experimental Workflow
Materials and Reagents
Table 3: Essential Research Reagent Solutions
| Reagent/Item | Function/Application | Specifications |
|---|---|---|
| Prestwick Chemical Library | FDA-approved drug library for repurposing screens | 2320 compounds, known safety profiles [20] |
| Arabidopsis Seeds | Plant model for differential screening | Wild-type (WT) and mus81 DNA repair mutant [20] |
| Microtiter Plates | Sample housing and processing | 24-well format optimal for seedling growth and imaging [20] |
| Liquid Growth Medium | Support plant growth under controlled conditions | Optimized for robust phenotypic expression [20] |
| Mitomycin C (MMC) | Genotoxic agent for positive control | Induces altered growth in mus81 mutant [20] |
| DMSO | Solvent control for normal growth phenotype | Standardized concentration [20] |
Step-by-Step Procedure
Assay Development and Optimization (2-3 weeks)
- Systematically test growth condition parameters including medium composition (solid vs. liquid), seed density, and plate format (96-well vs. 24-well).
- Select 24-well plates with liquid medium based on superior growth (3.6 true leaves/plant vs. 2.2 in 96-well) and facilitated imaging.
- Establish optimal positive (MMC) and negative (DMSO) control conditions that robustly differentiate mutant and wild-type phenotypes.
Plant Material Preparation and Compound Dispensing (1 day)
- Surface-sterilize Arabidopsis seeds (wild-type and mus81 mutant).
- Using automated liquid handlers, dispense compounds from the Prestwick library into 24-well microtiter plates, including appropriate controls.
- Add optimized liquid growth medium to all wells.
Seed Sowing and Growth Conditions (10 days)
- Sow three seeds per well to ensure biological replicates while accounting for low germination rates.
- Seal plates and transfer to controlled environment growth chambers with standardized light, temperature, and humidity conditions.
- Grow for 10 days, allowing development beyond cotyledon stage to true leaf formation.
Automated Imaging and Data Acquisition (1 day)
- Using robotic systems, transport plates to imaging station with light macroscope.
- Capture high-resolution images of each well at consistent focal points to ensure root and leaf visibility.
- Automate image naming and storage with metadata linking to plate coordinates and treatment conditions.
Machine Learning-Based Image Analysis (1-2 days)
- Process images using two complementary convolutional neural network (CNN) approaches:
- Image Classification: Employ a Residual Neural Network (ResNet) architecture trained to classify seedling images as "normal" or "altered" growth with probability scoring.
- Image Segmentation: Segment images into background, leaf, and root pixels for quantitative measurement of tissue-specific growth parameters.
- Train models using datasets of 240 images (equally distributed between DMSO and MMC treatments) split into training (80%), validation (10%), and testing (10%) sets.
- Validate model robustness across different plate arrangements to ensure predictions are not based on positional artifacts.
- Process images using two complementary convolutional neural network (CNN) approaches:
Hit Identification and Data Analysis (2-3 days)
- Compare growth patterns between wild-type and mus81 mutant for each compound.
- Identify "hits" as compounds that selectively affect mus81 growth while showing minimal effect on wild-type.
- Apply statistical thresholds (e.g., ≥3-fold growth effect in mutant specifically) to prioritize candidates.
- In the referenced study, approximately 10% of molecules caused altered growth in both genotypes (general toxicity), while three compounds specifically affected mus81.
Hit Validation (1-2 weeks)
- Conduct confirmation assays with hit compounds using dose-response experiments.
- Validate dose-dependent effects, with promising compounds (e.g., "Compound 21" in original study) showing doubled activity at 100-250μM compared to untreated controls.
- Perform secondary assays to elucidate mechanism of action, potentially including molecular docking studies to predict compound binding to target proteins.
Critical Performance Parameters
- Assay Robustness: Achieve Z'-factor >0.4 and signal window >2 during validation [21].
- Model Accuracy: CNN models should achieve >95% accuracy in classifying normal vs. altered growth phenotypes [20].
- Throughput: The protocol enables screening of 2320 compounds with dual genotypes in a time-efficient manner.
- Data Quality: Segmentation algorithms must accurately delineate roots and aerial structures for precise quantification.
Advanced Applications and Future Directions
The integration of automation, robotics, and detection systems continues to evolve, enabling increasingly sophisticated phenotyping applications. Emerging trends include the incorporation of artificial intelligence for real-time decision making, the development of more complex 3D tissue and organoid models, and the implementation of edge computing to process data closer to the source [27]. In plant phenotyping, autonomous robotic systems are poised to make significant advances, moving from mere data collection platforms to intelligent systems that can interpret and respond to phenotypic information in real-time [23].
The future of HTS lies in the seamless integration of these core components with advanced data analytics, particularly deep learning approaches that can extract subtle phenotypic patterns from complex image data [11]. As these technologies mature, they will further accelerate the pace of discovery in both basic research and drug development, enabling more comprehensive robustness screening across diverse biological systems.
The Critical Link between HTS Robustness and Accelerated Drug Discovery Timelines
High-Throughput Screening (HTS) has established itself as a cornerstone of modern drug discovery, enabling the rapid evaluation of thousands to millions of chemical or biological compounds for therapeutic potential [28]. The primary value proposition of HTS lies in its ability to accelerate the early stages of drug discovery by providing massive amounts of screening data in a condensed timeframe. However, the mere speed of screening provides little advantage if the generated data lacks reliability or biological relevance. Robustness—defined as the assay's consistency, reproducibility, and reliability under normal operating conditions—serves as the critical bridge between rapid screening and truly accelerated drug discovery timelines. A robust HTS campaign minimizes false positives and negatives, enhances reproducibility between batches and sites, and provides high-quality data that enables confident decision-making, thereby reducing costly cycles of re-testing and validation [28]. The industry is now shifting from a focus on sheer throughput to a more practical emphasis on data quality, integration, and biological relevance, recognizing that robust assays are fundamental to shortening the overall path from target identification to clinical candidate [29].
Quantifying Robustness: Key Metrics and Their Impact
The robustness of a cell-based HTS assay is not a qualitative trait but can be quantitatively measured using specific statistical parameters. These metrics allow researchers to objectively evaluate assay performance before committing to a full-scale screen, thereby de-risking the campaign.
Essential Statistical Parameters for Assay Quality
The following table summarizes the key metrics used to quantify and assure HTS assay robustness:
Table 1: Key Metrics for Quantifying HTS Assay Robustness
| Metric | Calculation/Definition | Optimal Value | Interpretation and Impact on Drug Discovery | ||
|---|---|---|---|---|---|
| Z'-Factor | ( Z' = 1 - \frac{3(\sigma{p} + \sigma{n})}{ | \mu{p} - \mu{n} | } )σ = standard deviation; μ = mean; p = positive control; n = negative control. | ( Z' \geq 0.5 ) | A Z'-Factor ≥ 0.5 indicates an excellent assay with a large signal window. This robust separation between positive and negative controls minimizes misclassification of compounds, directly reducing the number of false leads that require downstream follow-up, thus saving time and resources [28]. |
| Signal-to-Noise Ratio (S/N) | ( S/N = \frac{ | \mu{p} - \mu{n} | }{\sqrt{\sigma{p}^2 + \sigma{n}^2}} ) | ( > 10 ) | A high S/N ratio indicates that the measured signal (the biological response) is strong relative to the background noise of the assay system. This ensures that observed compound effects are real and not artifacts, increasing confidence in hit selection [28]. |
| Signal Window (SW) | ( SW = \frac{ | \mu{p} - \mu{n} | }{3\sqrt{\sigma{p}^2 + \sigma{n}^2}} ) | ( > 2 ) | Similar to Z'-Factor, this provides a measure of the assay's dynamic range. A larger window allows for better discrimination between active and inactive compounds. |
| Coefficient of Variation (CV) | ( CV = \frac{\sigma}{\mu} \times 100\% ) | ( < 10\% ) | The CV measures the precision of the assay signal across replicates (e.g., across a plate or between plates). A low CV indicates high reproducibility, which is essential for comparing data from screens run over multiple days or by different operators [28]. |
The application of robust statistical analysis is critical for interpreting HTS data. Methods that account for heteroscedasticity (variance that changes with dose) and outliers, such as M-estimation procedures, have been shown to provide better control of false discovery rates (FDR) while maintaining statistical power, which is paramount when making decisions on thousands of compounds simultaneously [30].
A Practical Protocol for Developing a Robust Cell Viability HTS Assay
This protocol outlines the development of a robust, ATP-based cell viability assay suitable for HTS, detailing the steps to ensure reproducibility and physiological relevance.
Protocol: Development of a Robust, ATP-based Cell Viability Assay for HTS
Principle: This assay quantifies cellular ATP levels, a direct indicator of metabolically active cells, using luciferase-based detection. The generation of light is proportional to the ATP concentration, providing a sensitive, homogeneous (no-wash) readout amenable to automation [28].
Key Reagent Solutions:
- Cell Titer-Glo Reagent: Luminescent substrate for ATP quantification.
- Cell Line: Choose a disease-relevant cell line (e.g., HepG2 for liver toxicity).
- Cell Culture Media: Standard media (e.g., DMEM) supplemented with FBS and antibiotics.
- Compound Library: e.g., Prestwick library of off-patent drugs [31].
- Controls: Positive Control (e.g., 10µM Staurosporine for cytotoxicity), Negative Control (e.g., 0.1% DMSO vehicle).
- Automation Equipment: Automated liquid handlers, multichannel pipettors, robotic dispensers, and a luminescence microplate reader [29] [28].
Procedure:
- Plate Selection: Use tissue culture-treated, multi-well plates (384-well or 1536-well) compatible with your automation systems and plate readers.
- Cell Seeding Optimization:
- Harvest cells in the logarithmic growth phase and resuspend in complete medium.
- Critical Step: Titrate the cell seeding density to determine the optimal density that provides a linear ATP signal response after the desired incubation period (e.g., 48-72 hours) without causing over-confluence. A common starting range is 1,000-5,000 cells per well for a 384-well plate.
- Use an automated liquid handler or a multichannel pipettor to dispense the cell suspension uniformly across the assay plate.
- Incubate plates at 37°C, 5% CO₂ for 24 hours to allow cell adhesion and recovery.
- Compound Addition:
- Prepare compound library plates via serial dilution in DMSO, then further dilute in medium immediately before use to ensure the final DMSO concentration is non-cytotoxic (e.g., ≤0.5%).
- Using a robotic liquid handler or acoustic dispenser, transfer a precise volume of each compound from the library source plate to the assay plates. Include positive and negative control wells on every plate.
- Incubation: Incubate the compound-treated plates for the predetermined optimal duration (e.g., 48 hours) at 37°C, 5% CO₂.
- Viability Measurement:
- Equilibrate Cell Titer-Glo Reagent to room temperature.
- Add an equal volume of reagent to each well of the assay plate using an automated dispenser.
- Shake the plate on an orbital shaker for 2 minutes to induce cell lysis.
- Incubate the plate at room temperature for 10 minutes to stabilize the luminescent signal.
- Detection:
- Read luminescence using a microplate reader integrated with robotic plate handling for high-throughput processing.
- Data Analysis:
- Normalize raw data: % Viability = (Compound Signal - Positive Control Signal) / (Negative Control Signal - Positive Control Signal) * 100.
- Calculate assay robustness metrics (Z'-factor, CV) for each plate. Plates failing quality control (e.g., Z' < 0.5) should be flagged or repeated.
- Apply robust statistical methods, such as preliminary test estimation (PTE) or M-estimation, to fit dose-response curves (e.g., Hill model) and classify compounds as active, inactive, or inconclusive, controlling for false discovery rates [30].
Troubleshooting Notes:
- Poor Z'-Factor: Re-optimize cell seeding density or positive control concentration. Check liquid handler precision for consistent dispensing.
- High CV Across Replicates: Confirm cell suspension is homogeneous during dispensing. Check for contamination or edge effects in plates; consider using edge-well reservoirs.
- Weak Signal: Ensure reagent is fresh and has been properly equilibrated. Confirm cell viability is high at time of seeding.
The workflow for this protocol, from cell preparation to hit identification, is visualized below.
Diagram 1: HTS viability assay workflow with quality control.
Advanced Applications: Enhancing Robustness through Integration and AI
Beyond foundational wet-lab techniques, robustness is increasingly achieved through the integration of advanced technologies that reduce human variability and enhance data quality.
Automation and Human-Relevant Biology
Modern automation extends beyond mere speed. Ergonomic and accessible automation systems, such as flexible liquid handlers, empower scientists to use automation confidently, saving time for analysis rather than manual pipetting [29]. This "automation of process" enhances reproducibility. Furthermore, robustness is bolstered by using more physiologically relevant models. Automated platforms like the MO:BOT standardize 3D cell culture (organoids), producing consistent, human-derived tissue models that provide more predictive safety and efficacy data, thereby building regulatory confidence and shortening development timelines [29].
The Role of AI and Data Integration
Artificial Intelligence (AI) is transforming HTS by improving the robustness of data analysis and experimental design. A major challenge in HTS is fragmented, siloed data with inconsistent metadata, which prevents automation and AI from delivering full value [29]. Solving this data foundation is a prerequisite for robust AI application. When built on quality data, AI can:
- Improve Hit Identification: Apply robust statistical models to analyze dose-response curves, effectively controlling false discovery rates (FDR) while maintaining power to identify true actives [30].
- Enable Phenotypic Screening: Use convolutional neural networks (CNN) for high-throughput image analysis of plant or cell phenotypes, allowing for accurate quantification of complex traits like growth in a genotype-specific manner [31].
- Generate Predictive Insights: Foundation models can extract features from complex imaging data (e.g., histopathology slides) to identify new biomarkers and link them to clinical outcomes, making AI-driven decisions more explainable and reproducible [29].
The synergy between robust data generation, structured data management, and intelligent analysis creates a virtuous cycle that accelerates discovery.
The critical link between HTS robustness and accelerated drug discovery timelines is undeniable. Robustness, quantified by rigorous metrics and achieved through careful assay optimization, advanced automation, and human-relevant models, is the key to generating high-quality, reliable data. This reliability, in turn, enables confident decision-making, reduces the costly repetition of experiments, and increases the translational potential of early-stage hits. As the industry moves towards a more integrated and AI-driven future, the focus on building robustness into every step of the HTS process—from assay design to data analysis—will remain the most critical factor in shortening the path from the lab to life-saving medicines.
The convergence of artificial intelligence (AI), three-dimensional (3D) cell cultures, and organoid models is fundamentally transforming high-throughput phenotyping in biomedical research. This integration addresses critical limitations of traditional two-dimensional (2D) cultures and animal models, which often fail to accurately predict human physiological responses [32] [33]. High-throughput screening (HTS) has evolved from simple compound screening to sophisticated systems capable of evaluating complex phenotypes at single-cell resolution within physiologically relevant environments [32] [34]. The emerging paradigm leverages AI-driven image analysis to interpret massive, multi-parametric datasets generated from 3D models, enabling unprecedented accuracy in predicting drug efficacy, toxicity, and patient-specific treatment responses [35] [36]. This technological synergy is particularly crucial for robustness screening, where reproducibility and physiological relevance are paramount for successful translation of preclinical findings. These advanced platforms now provide the necessary tools to incorporate human biological diversity into the earliest stages of drug development, potentially reducing the high attrition rates that have long plagued the pharmaceutical industry [37] [38].
Quantitative Comparison of Advanced Screening Platforms
The table below summarizes key performance metrics for cutting-edge screening platforms that integrate AI, 3D cultures, and organoid technologies.
Table 1: Performance Metrics of Advanced High-Throughput Screening Platforms
| Platform Name | Core Technology | Throughput Capacity | Key Applications | Spatial Resolution | Notable Advantages |
|---|---|---|---|---|---|
| HCS-3DX [36] | AI-driven micromanipulator, LSFM, FEP foil multiwell plates | 384-well format | Tumor biology, drug discovery, personalized medicine | Single-cell level within 3D structures | Automated selection of morphologically homogeneous 3D-oids; Reduced operator-induced variability |
| Digital Colony Picker (DCP) [34] | Microfluidic chip (16,000 chambers), AI-image analysis, Laser-induced bubble export | 16,000 picoliter-scale microchambers | Microbial cell factory development, functional gene discovery | Single-cell resolution | Contact-free clone export; Dynamic medium exchange capability; Spatiotemporal monitoring |
| Automated 3D HCS Platform [39] | Robotic liquid handling, confocal imaging | 384-well format | Organoid phenotyping, drug response assessment | Organoid-level (phenotypic changes) | More consistent than manual pipetting; Non-destructive imaging; Compatible with downstream analysis |
Table 2: Analysis of 3D Model Variability and AI Classification Performance
| Parameter | Monoculture Spheroids (Expert 1 vs. 2 vs. 3) | Co-culture Spheroids (Expert 1 vs. 2 vs. 3) | AI Classification Accuracy (ResNet) |
|---|---|---|---|
| Size/Area | Significant differences (Expert 1 generated larger spheroids) | Increased variability compared to monocultures | 100% (n=24) for both WT and mus81 genotypes [20] |
| Shape/Circularity | No significant differences between experts and batches | Twice as many seeding cells, more compact spheroids | Robust to different plate arrangements (100% correct classification) [20] |
| Correlation (Circularity vs. Diameter) | -0.69 (60.5% most similar samples) | -0.54 (55.1% most similar samples) | Training set: 80% of images; Validation: 10%; Testing: 10% [20] |
Application Notes: Integrated AI-3D Screening Systems
HCS-3DX: A Next-Generation AI-Driven Screening System
The HCS-3DX platform represents a comprehensive solution for single-cell phenotyping within 3D microenvironments, addressing critical bottlenecks in standardization and analysis [36]. The system integrates three innovative components: (1) an AI-driven SpheroidPicker for automated selection and transfer of morphologically homogeneous 3D-oids, which substantially reduces operator-induced variability; (2) custom Fluorinated Ethylene Propylene (FEP) foil multiwell plates optimized for high-resolution light-sheet fluorescence microscopy (LSFM), enabling exceptional imaging penetration with minimal phototoxicity; and (3) a dedicated AI-based image analysis workflow implemented in Biology Image Analysis Software (BIAS) for quantitative single-cell data extraction from complex 3D structures [36]. This integrated approach demonstrates particular utility in cancer research, where it enables precise quantification of tissue composition in both monoculture and co-culture tumor models, providing unprecedented resolution for drug screening applications.
Digital Colony Picker: AI-Powered Microbial Phenotyping
The Digital Colony Picker (DCP) platform revolutionizes phenotype-based screening of microbial cell factories through an addressed static droplet system that eliminates the need for agar or physical contact [34]. Its core innovation lies in a microfluidic chip containing 16,000 addressable picoliter-scale microchambers that enable single-cell compartmentalization, dynamic monitoring, and AI-guided export via laser-induced bubble technique. When applied to Zymomonas mobilis for lactate tolerance screening, the DCP platform identified a mutant with 19.7% increased lactate production and 77.0% enhanced growth under lactate stress [34]. This system enables multi-modal phenotyping with spatiotemporal precision, offering a generalizable strategy for accelerated strain engineering and functional gene discovery in synthetic biology applications.
Automated Organoid Screening Platforms
Fully automated screening platforms specifically designed for organoid models are bridging the gap between physiological relevance and screening robustness. These systems incorporate robotic liquid handling that demonstrates superior consistency compared to manual pipetting, with automated randomization capabilities that enhance experimental reproducibility [39]. Integrated confocal imaging systems provide greater sensitivity for detecting phenotypic changes within organoid cultures compared to traditional biochemical viability assays, enabling more nuanced assessment of drug responses [39]. Furthermore, these platforms facilitate single-well co-cultures of organoids derived from primary human biopsies and patient-derived xenograft (PDX) models, allowing for complex disease modeling while maintaining compatibility with high-content screening workflows [39].
Experimental Protocols
Protocol: AI-Driven 3D Spheroid Screening Using HCS-3DX
Objective: To perform high-content drug screening on 3D tumor spheroids with single-cell resolution using the HCS-3DX system.
Materials:
- HCS-3DX system (SpheroidPicker, LSFM, FEP foil multiwell plates)
- BIAS image analysis software
- HeLa Kyoto human cervical cancer cells
- MRC-5 human fibroblast cells (for co-cultures)
- 384-well U-bottom cell-repellent plates
- Test compounds
Procedure:
- Spheroid Generation: Seed 100 HeLa Kyoto cells per well in 384-well U-bottom cell-repellent plate for monocultures. For co-cultures, seed 40 HeLa Kyoto cells first, then add 160 MRC-5 human fibroblast cells after 24 hours.
- Incubation: Incubate plates for 48 hours (monocultures) or 24+24 hours (co-cultures) to allow spheroid formation.
- Spheroid Selection: Use the AI-driven SpheroidPicker to automatically select and transfer morphologically homogeneous spheroids to FEP foil multiwell plates based on predefined size and circularity parameters.
- Compound Treatment: Apply test compounds using robotic liquid handling systems to ensure precision and reproducibility.
- High-Content Imaging: Acquire images using LSFM with 20x objective for optimal resolution (adjust to 5x or 10x for faster screening where appropriate).
- AI-Based Analysis: Process images through the BIAS software for single-cell segmentation, classification, and feature extraction.
- Data Quantification: Extract 2D and 3D morphological features (Diameter, Perimeter, Area, Circularity, Sphericity, Convexity) for statistical analysis and hit identification.
Validation: The platform achieves single-cell resolution within 3D structures and reliably quantifies tissue composition in mono- and co-culture tumor models [36].
Protocol: Single-Cell Microbial Phenotyping Using Digital Colony Picker
Objective: To identify microbial mutants with enhanced stress tolerance and metabolite production using the AI-powered Digital Colony Picker.
Materials:
- DCP platform (microfluidic chip, optical module, droplet location module, export/collection module)
- Zymomonas mobilis cell suspension (1 × 10⁶ cells/mL)
- PDMS mold layer microfluidic chips with ITO film
- Culture media with stressor (e.g., 30 g/L lactate)
- 96-well collection plates
Procedure:
- Chip Preparation: Pre-vacuum the microfluidic chip to remove air from microchambers.
- Single-Cell Loading: Introduce cell suspension (1 × 10⁶ cells/mL) into microchannels allowing passive loading into 16,000 microchambers via vacuum assistance.
- Incubation: Place chip in water-filled centrifuge tube (10% filled) to maintain humidified environment and incubate at controlled temperature.
- Dynamic Monitoring: Use AI-driven image analysis to track single-cell morphology, proliferation, and metabolic activities over time.
- Liquid Replacement (Optional): Exchange culture media through chip inlet as needed using gas gaps between microchambers.
- Target Identification: Apply AI algorithms to identify microchambers containing clones with desired phenotypic signatures.
- Clone Export: Generate microbubbles via laser-induced bubble technique to propel selected single-clone droplets toward outlet.
- Collection: Transfer exported clones to 96-well collection plates using cross-surface microfluidic printing method.
- Validation: Culture selected clones for further phenotypic validation (e.g., lactate production assay).
Validation: The protocol successfully identified a Zymomonas mobilis mutant with 19.7% increased lactate production and 77.0% enhanced growth under lactate stress [34].
Workflow Visualization
Diagram 1: HCS-3DX Screening Workflow
Diagram 2: Digital Colony Picker Workflow
The Scientist's Toolkit: Essential Research Reagents and Materials
Table 3: Essential Research Reagents and Materials for AI-Integrated 3D Screening
| Item | Function/Application | Specific Examples/Notes |
|---|---|---|
| FEP Foil Multiwell Plates [36] | Optimized for high-resolution LSFM imaging of 3D models | Provides exceptional optical clarity for deep tissue imaging; Minimal autofluorescence |
| Microfluidic Chips with ITO Film [34] | Picoliter-scale single-cell cultivation and manipulation | 16,000 addressable microchambers; Enables laser-induced bubble export |
| Cell-Repellent U-Bottom Plates [36] | Standardized spheroid formation | Promotes consistent 3D aggregation; 384-well format for HTS |
| BIAS Analysis Software [36] | AI-powered 3D image analysis | Enables single-cell segmentation and feature extraction in complex 3D structures |
| SpheroidPicker [36] | Automated selection of homogeneous 3D-oids | AI-driven micromanipulator; Reduces operator-induced variability |
| Patient-Derived Organoids [33] | Personalized disease modeling and drug testing | Retains original tumor genetics and heterogeneity; Predictive of clinical response |
HTS Assay Platforms in Action: From Design to Hit Identification
High-throughput screening (HTS) serves as a foundational pillar in modern drug discovery and biological research, enabling the rapid evaluation of thousands to millions of chemical compounds or genetic modifiers. The selection of an appropriate screening strategy is paramount to the success of any campaign aimed at identifying novel therapeutic agents or probing biological mechanisms. This choice fundamentally hinges on the research question: whether to target a specific, isolated protein; to observe effects within a living cellular environment; or to discover new biology through observable changes in cell or organism phenotype. Within the context of high-throughput phenotyping and robustness screening, each paradigm—biochemical, cell-based, and phenotypic—offers distinct advantages, limitations, and technical considerations. This application note delineates these three primary screening approaches, providing structured comparisons, detailed protocols, and strategic guidance to empower researchers in selecting and implementing the optimal assay for their specific investigative goals.
The following table summarizes the core characteristics, advantages, and challenges of the three primary screening platforms.
Table 1: Comparison of High-Throughput Screening Platforms
| Feature | Biochemical Screening | Cell-Based Screening (Target-Based) | Phenotypic Screening |
|---|---|---|---|
| System Complexity | Simplified, purified components (e.g., enzymes, substrates) [40] | Living cells, often engineered with specific reporters or targets [41] [42] | Living cells or organisms, un-engineered or disease-model contexts [43] [44] |
| Primary Readout | Molecular interaction or enzymatic activity (e.g., binding, inhibition) [40] [42] | Pathway activity, reporter signal, or cellular response [45] [41] | Macroscopic or morphological phenotype (e.g., growth, shape, differentiation) [20] [43] |
| Key Advantage | High target specificity; controlled conditions; high throughput [42] | Cellular context; assesses membrane permeability; measures pathway modulation [45] [40] | Biologically unbiased; discovers novel mechanisms of action (nMoA); clinically relevant models [43] [45] |
| Main Challenge | Lack of biological context; may identify non-cell-permeable compounds [45] [46] | Can be complex to develop and interpret; false positives from cytotoxicity [45] | Target identification (deconvolution) can be challenging and time-consuming [43] |
| Throughput | Very High [42] | High [45] | Moderate to High [20] |
| Hit-to-Lead Focus | Potency, selectivity, structure-activity relationships (SAR) [40] | Cellular efficacy, permeability, cytotoxicity [40] | Efficacy in disease-relevant models, novel biology [43] |
The decision-making workflow for selecting an appropriate screening method based on the research objective can be visualized as follows:
Biochemical Screening
Biochemical screening utilizes purified target proteins in a well-defined in vitro system to directly measure compound binding or inhibition of enzymatic activity [40] [42]. This approach is ideal when the molecular target is known and can be isolated.
Key Experimental Protocol: Fluorescence Polarization (FP) Assay for Kinase Inhibition
This protocol is adapted for a 384-well plate format to screen for inhibitors of a recombinant kinase enzyme [40] [42].
Workflow:
Reagent Preparation:
- Prepare assay buffer (e.g., 50 mM HEPES pH 7.5, 10 mM MgCl₂, 1 mM DTT, 0.01% Tween-20).
- Dilute the recombinant kinase to a working concentration in assay buffer.
- Prepare a fluorescently-labeled peptide substrate.
- Prepare ATP solution at a concentration near its Km value.
- Dilute compound library in DMSO, then further in assay buffer (typical final DMSO concentration 1%).
Assay Assembly (384-well plate):
- Step 1: Transfer 5 µL of compound solution (or buffer/DMSO for controls) to each well.
- Step 2: Add 10 µL of kinase/substrate mixture to all wells.
- Step 3: Initiate the reaction by adding 5 µL of ATP solution.
- Controls: Include positive controls (no inhibitor) and negative controls (no enzyme or with a known potent inhibitor).
Incubation and Reading:
- Incubate the plate at room temperature for 60 minutes.
- Stop the reaction if necessary (e.g., with EDTA).
- Read fluorescence polarization (in mP units) using a plate reader equipped with appropriate FP optics.
Data Analysis:
- Calculate % inhibition for each compound:
(1 - (mP_compound - mP_negative_control) / (mP_positive_control - mP_negative_control)) * 100. - Fit dose-response curves for hit compounds to determine IC₅₀ values.
- Calculate % inhibition for each compound:
Research Reagent Solutions for Biochemical Screening
Table 2: Essential Reagents for Biochemical Assays
| Item | Function | Example Application |
|---|---|---|
| Purified Target Protein | The isolated protein of interest (e.g., kinase, protease, receptor). | Source of enzymatic activity or binding for the assay [42]. |
| Fluorescent Tracer | A fluorescently-labeled ligand or substrate whose properties change upon binding or conversion. | FP and TR-FRET assays; displacement indicates compound binding [40]. |
| Co-factors / Substrates | Essential molecules for the target's function (e.g., ATP for kinases). | Provides necessary components for a functional enzymatic reaction [46]. |
| HTS-Optimized Buffer | A chemically defined buffer to maintain protein stability and function. | Creates a consistent and reproducible in vitro environment [42]. |
| Microtiter Plates (384-well) | Miniaturized assay vessels for high-throughput processing. | Standard format for HTS, balancing volume, throughput, and cost [42]. |
Cell-Based Screening
Cell-based assays use live cells to measure a compound's effect in a more physiologically relevant context than biochemical assays [45] [41]. They can be target-based, focusing on a specific pathway, or phenotypic.
Key Experimental Protocol: Reporter Gene Assay in a 96-Well Format
This protocol is used to identify compounds that modulate the activity of a specific signaling pathway or transcription factor [42].
Workflow:
Cell Culture and Plating:
- Culture reporter cells (e.g., HEK-293T engineered with a luciferase gene under a response element of interest).
- Harvest cells during logarithmic growth and seed in a 96-well tissue culture-treated plate at a density of 10,000-20,000 cells per well in 100 µL of complete growth medium.
- Incubate plates for 18-24 hours at 37°C, 5% CO₂ to allow cells to adhere and stabilize.
Compound Treatment:
- Prepare serial dilutions of test compounds in culture medium.
- Remove the old medium from the cell plate and add 100 µL of compound-containing medium to each well. Include vehicle (DMSO) and controls for maximal and minimal pathway activation.
Incubation and Assay:
- Incubate the plate for a predetermined time (e.g., 6-24 hours) at 37°C, 5% CO₂.
- Equilibrate the plate and a luciferase assay reagent to room temperature.
- Add the luciferase reagent to each well according to the manufacturer's instructions (e.g., 50 µL per well).
- Measure luminescence signal immediately using a plate reader.
Data Analysis:
- Normalize raw luminescence values to vehicle and control wells.
- Calculate % activation or inhibition and generate dose-response curves to determine EC₅₀ or IC₅₀ values.
The interconnected workflow for cell-based and phenotypic screening, from cell culture to data analysis, is outlined below:
Phenotypic Screening
Phenotypic screening involves testing compounds for their ability to produce a desired change in cell or organism phenotype without a preconceived molecular target [43]. This approach is powerful for discovering novel mechanisms of action (nMoA).
Key Experimental Protocol: Image-Based Screening for Altered Plant Seedling Growth
This protocol, based on a high-throughput screen in Arabidopsis thaliana, uses convolutional neural networks (CNNs) to quantify genotype-specific chemical effects [20].
Workflow:
Biological System Setup:
- Plant Materials: Use wild-type Arabidopsis and a DNA repair mutant (mus81).
- Growth Conditions: Surface-sterilize seeds and sow them separately in liquid medium within 24-well microtiter plates (3 seedlings per well). Incorporate positive (e.g., Mitomycin C) and negative (DMSO) controls.
Chemical Treatment and Growth:
- Add small molecules from the screening library (e.g., Prestwick library) to the respective wells.
- Incubate the plates under controlled light and temperature conditions for 10 days.
Image Acquisition:
- Capture high-resolution images of seedlings in each well using a light macroscope. Ensure consistent lighting and focal plane across all wells.
Machine Learning-Based Image Analysis:
- Training: Train a Residual Neural Network (ResNet) CNN model using images of control seedlings (DMSO for normal growth, MMC for altered growth). Use 80% of images for training, 10% for validation, and 10% for testing [20].
- Classification: Use the trained model to classify seedling images from the screen as "normal growth" or "altered growth," outputting a probability score.
- Segmentation (Complementary): Use a second CNN to segment images into background, leaves, and roots. Quantify the size of each tissue for detailed phenotypic profiling [20].
Hit Identification:
- Identify "hits" as molecules that induce a significant alteration in the mutant (mus81) growth phenotype while showing minimal effect on the wild-type.
Research Reagent Solutions for Phenotypic Screening
Table 3: Essential Reagents for Phenotypic Screens
| Item | Function | Example Application |
|---|---|---|
| Disease-Relevant Cell Model | Primary cells, stem cell-derived lineages, or engineered organoids that mimic human disease. | Provides a physiologically relevant context for observing phenotypic changes [43] [41]. |
| Viability/Cytotoxicity Dyes | Fluorescent probes that distinguish live/dead cells (e.g., propidium iodide, calcein-AM). | A basic phenotypic readout for compound toxicity or selective cell death [41]. |
| High-Content Imaging Reagents | Fluorescent dyes or antibodies for labeling cellular structures (nuclei, cytoskeleton, organelles). | Enables multiparametric analysis of complex phenotypes like morphology and protein localization [42]. |
| 3D Culture Matrices | Hydrogels (e.g., Matrigel, synthetic alternatives) to support three-dimensional cell growth. | Creates in vivo-like architecture and cell-cell interactions for more predictive screening [41]. |
| Label-Free Detection Kits | Reagents for measuring metabolic activity or confluence without fluorescent labels. | Reduces assay artifacts and simplifies workflow for certain phenotypic endpoints [45]. |
Mechanism of Action Deconvolution
A significant challenge following a phenotypic screen is identifying the molecular target of hit compounds—a process known as target deconvolution or mechanism of action (MoA) studies [43]. The following diagram illustrates the primary methodologies employed.
The main strategies include:
- Affinity Chromatography: The hit compound is immobilized on a solid support and used as bait to pull down direct binding proteins from cell lysates, which are then identified by mass spectrometry [43] [45].
- Genetic Modifier Screening: Genome-wide CRISPR knockout or RNAi screens are used to identify genes whose loss-of-function either enhances or suppresses the activity of the hit compound [43] [42].
- Gene Expression Profiling: Comparing the global gene expression signature (e.g., by RNA-Seq) induced by the hit compound to databases of signatures from compounds with known MoA can infer the pathway or target involved [43].
- Resistance Mutation Selection: Treating cells with low doses of the compound to select for resistant clones, followed by sequencing to identify the acquired mutations that confer resistance, can pinpoint the drug target [43].
The strategic selection of a screening platform is a critical first step in any high-throughput research endeavor. Biochemical assays offer precision and high throughput for targeted interrogation of molecular function. Cell-based assays provide a crucial layer of biological context, informing on cellular permeability and pathway activity. Phenotypic screening embraces biological complexity, offering the powerful potential to uncover novel biology and first-in-class therapeutics, albeit with the subsequent challenge of target deconvolution. The chosen approach must align precisely with the fundamental research question. By understanding the strengths, applications, and practical requirements of each paradigm, as detailed in this note, researchers can make an informed decision that robustly supports their discovery goals within the framework of high-throughput phenotyping.
The evolution of the microtiter plate, first conceived in the 1950s with 72 wells, has fundamentally transformed biological testing and drug discovery [47]. The standardization of the 96-well plate in the 1990s enabled the rise of High-Throughput Screening (HTS), with subsequent miniaturization to 384-well and 1536-well formats addressing the growing needs for efficiency and scalability in biomedical research [47]. The global 384-well microplate market, valued at $1.2 billion in 2024 and projected to reach $2.5 billion by 2033, reflects the critical importance of these tools in modern life sciences [48]. Within high-throughput phenotyping robustness screening, selecting the appropriate assay format is paramount, as the choice of microplate directly influences data quality, reagent consumption, and the successful identification of biologically relevant hits [47]. This guide provides a detailed framework for selecting and implementing 96-, 384-, and 1536-well plates, complete with application notes and protocols tailored for robust phenotyping research.
Technical Specifications and Selection Criteria
Comparative Analysis of Microplate Formats
The selection of an optimal microplate format requires a careful balance of throughput, reagent cost, and technical feasibility. The following table summarizes the key specifications for standard well plates, providing a foundation for decision-making.
Table 1: Technical Specifications and Application Profile for Standard Microplate Formats
| Parameter | 96-Well Plate | 384-Well Plate | 1536-Well Plate |
|---|---|---|---|
| Standard Well Volume | 60-200 µL [49] | 15-60 µL [49] | 2.5-15 µL [49] |
| Common Assay Working Volume | ~100-200 µL [50] | ~20-50 µL | ~5-10 µL [51] |
| Throughput (Relative to 96-well) | 1x | ~4x | ~16x |
| Primary Application Drivers | Lower-complexity assays, cell culture, initial optimization [50] | Mainstream HTS, drug discovery, genomics [48] [52] | Ultra-HTS, primary screening with precious reagents [51] |
| Key Considerations | Ease of liquid handling, robust signal | Balance of throughput and miniaturization; requires capable liquid handlers | Specialized equipment required; susceptible to edge effects and evaporation [51] |
| Approximate Cost per Plate | ~$7 (Corning assay plates) [49] | ~$10-$25 [49] | >$50 [47] |
A Strategic Framework for Microplate Selection
Choosing the correct microplate is a critical, multi-faceted decision in assay development. The following workflow outlines a systematic path for selection, emphasizing the initial choice between cell-based and cell-free assays, which is a primary branching point [47].
For cell-based assays in phenotyping, plates are typically tissue-culture treated, sterilized, and may require clear bottoms for imaging [47]. The detection mode then critically determines the optimal plate color and bottom type, as detailed in the scientist's toolkit below.
The Scientist's Toolkit: Microplate Properties and Reagents
Successful assay design depends on harmonizing microplate properties with reagent choices. This table lists key materials and their functions, with a focus on optical properties dictated by detection mode.
Table 2: Essential Research Reagent Solutions and Microplate Properties
| Item | Function/Description | Application Note |
|---|---|---|
| Black-Wall, Clear-Bottom Plate | Minimizes background fluorescence (black walls) while allowing for microscopic observation or bottom-reading (clear bottom) [49]. | Essential for fluorescence-based cell viability assays (e.g., alamarBlue) and high-content imaging [49] [50]. |
| White-Wall, Clear-Bottom Plate | Reflects light to maximize signal capture; clear bottom allows for microscopic observation [49]. | Ideal for luminescence assays and for assays where microscopic confirmation is needed alongside luminescent readout [49]. |
| Clear Plate (UV-Transparent) | Allows for absorbance readings in the UV range [49]. | Required for assays measuring DNA/RNA concentration or using substrates with absorbance below 400 nm (e.g., MTT) [49] [50]. |
| Tissue Culture (TC)-Treated Plate | Surface is chemically treated to be hydrophilic and negatively charged, promoting cell attachment and growth [47]. | Standard for most adherent cell cultures in 2D and 3D models [50] [47]. |
| Metabolic Assay Dyes (e.g., MTT, MTS, alamarBlue) | Indicators of cell viability and proliferation based on metabolic activity [50]. | MTT produces an insoluble formazan product, while MTS and alamarBlue produce soluble products, simplifying the workflow [50]. |
| Echo-Compatible LDV Plates | Low-dead volume plates made of cyclic olefin copolymer (COC) for acoustic droplet ejection [49]. | Critical for non-contact, high-speed nanoliter transfers in 384- and 1536-well formats for compound library management [49]. |
Application Notes and Protocols
Protocol 1: 2D Cell Viability and Cytotoxicity Screening in 96-Well Format
This foundational protocol is adapted for robustness screening using metabolic dyes to quantify cell viability in a 2D culture system, ideal for lower-throughput compound validation.
3.1.1 Materials
- Cells: Adherent cell line (e.g., HepG2, MCF-7) [50].
- Microplate: 96-well, tissue-culture treated, clear flat-bottom plate (for absorbance) or black-walled, clear-bottom (for fluorescence) [49] [50].
- Reagents: Culture medium, PBS, MTT reagent (Sigma M5655) or alamarBlue (AbD Serotec BUF012B), acidified isopropanol (for MTT) [50].
3.1.2 Workflow The following graph illustrates the multi-day workflow for a cell viability assay, highlighting the parallel paths for different metabolic dyes.
3.1.3 Detailed Method
- Cell Seeding: Harvest cells using standard subculture methods. Seed cells in a 100 µL volume per well at a density optimized for linear signal response (e.g., 10,000-30,000 cells/well for HepG2 over 24 hours) [50]. Include background control wells (medium only).
- Compound Treatment & Incubation: After 24 hours, aspirate medium and add fresh medium containing test compounds. Incubate for desired exposure period (e.g., 24-72 hours) in a humidified incubator at 37°C with 5% CO₂.
- Viability Staining:
- MTT Method: Prepare MTT at 1 mg/mL in phenol-red-free medium and filter sterilize. Aspirate treatment medium from the plate, add 200 µL of MTT solution per well, and incubate for 1-4 hours. Carefully aspirate the MTT solution and add 200 µL of acidified isopropanol (1 µL HCl per 1 mL isopropanol) to solubilize the formazan crystals. Pipette up and down to ensure complete solubilization [50].
- alamarBlue Method: Directly add alamarBlue reagent to existing culture medium (10% v/v). Incubate for 1-4 hours protected from light [50].
- Signal Detection:
Protocol 2: 3D Cell Culture and Drug Response in 96-Well Format
3D culture models like the Alvetex Scaffold provide a more physiologically relevant environment for phenotyping and robustness screening, bridging the gap between 2D assays and in vivo models [50].
3.2.1 Materials
- Microplate: Alvetex Scaffold 96-well plate (AVP009), black with clear plastic base [50].
- Reagents: 70% ethanol, appropriate culture medium, PBS, cell viability assay reagents (e.g., MTS, alamarBlue).
3.2.2 Detailed Method
- Scaffold Preparation: Inside a sterile environment, add 100 µL of 70% ethanol to each well of the Alvetex plate to wet the scaffold. Immediately aspirate the ethanol and add 200 µL of culture medium or PBS to wash. Aspirate and replace with a final wash of seeding medium. Aspirate completely just before adding cells [50].
- Cell Seeding in 3D: Prepare a single-cell suspension. Seed cells in a 200 µL volume per well. The optimal density must be determined for each cell type; a range of 5,000-100,000 cells/well is a starting point, with 10,000-30,000 often suitable [50]. A 1-hour incubation at room temperature prior to moving to the 37°C incubator may improve seeding uniformity.
- Long-Term 3D Culture: Culture cells for up to 5 days or as required. Change media every 1-2 days, as 3D cultures consume nutrients faster. Take care to minimize temperature fluctuations during media changes [50].
- Drug Treatment and Viability Assessment: Apply drug treatments in fresh medium. Assess cell viability using a soluble formazan assay (e.g., MTS) or alamarBlue. The method is similar to the 2D protocol, but note that the scaffold structure requires the product to be soluble and released into the medium; insoluble assays like MTT are not suitable [50].
Protocol 3: Miniaturized 1536-Well Cell-Based Screening
Adapting complex cell-based assays to 1536-well format enables ultra-high-throughput phenotyping but introduces significant technical challenges in liquid handling and assay quality.
3.3.1 Key Challenges and Mitigation Strategies
- Liquid Handling: Precise nanoliter dispensing is essential. Use non-contact dispensers or acoustic droplet ejection (e.g., Echo) to transfer compounds and reagents [49] [51].
- Assay Miniaturization: Reagent concentrations and incubation times often require re-optimization from 384-well format to maintain signal-to-background ratios in the sub-10 µL volume range [51].
- Edge Effects: Evaporation in outer wells can cause significant variability. Use specially designed lid and plate systems, incubate in humidified environments, and employ centrifugal plate washing to ensure uniform liquid distribution across the plate [51].
3.3.2 Centrifugal Plate Washing Protocol for 1536-Well Format This technique is critical for robust cell-based assays requiring washing steps (e.g., immunofluorescence, secondary messenger assays) in 1536-well plates [51].
- Post-Stimulation Aspiration: After the desired stimulation period, use a 1536-well compatible aspiration head to remove the majority of the liquid from all wells simultaneously.
- PBS Addition: Gently dispense a precise volume of PBS (e.g., 5 µL) into each well using a non-contact dispenser to minimize cell disruption.
- Centrifugal Washing: Place the plate into a centrifugal plate washer. Centrifuge the plate briefly (e.g., 500 rpm for 1 minute) to ensure all liquid is pulled through the cell layer and evenly pooled at the bottom of the well.
- Aspiration: Immediately following centrifugation, aspirate the PBS wash from all wells.
- Repeat: Perform a total of 2-3 wash cycles to ensure complete removal of the stimulus or unbound reagents. This method significantly improves data quality and reduces well-to-well variability compared to traditional aspiration methods [51].
The strategic miniaturization from 96-well to 384-well and 1536-well formats is a cornerstone of efficient and scalable high-throughput phenotyping. The 384-well plate has established itself as the workhorse for mainstream HTS, offering an optimal balance of throughput, reagent savings, and data quality [48] [52]. The future of microplate-based screening is being shaped by several key trends. The integration of artificial intelligence is optimizing assay design and enhancing data analysis from complex phenotypic readouts [48]. Furthermore, the demand for more physiologically relevant models is driving the development of advanced 3D cell culture-compatible plates and complex co-culture systems [50] [52]. Finally, innovation in advanced materials, such as novel polymers and nano-coatings, continues to improve optical clarity, chemical resistance, and surface properties, thereby enhancing assay performance and reliability [47] [52]. By understanding the principles and protocols outlined in this guide, researchers can make informed decisions to robustly implement assay formats that accelerate discovery in phenotyping and drug development.
In high-throughput screening (HTS) and high-throughput phenotyping (HTP), the reliability of data is paramount for successful drug discovery and biological research. The quality of an assay—its ability to robustly discriminate between positive and negative controls—directly impacts the identification of true hits and the overall research outcomes. Three statistical parameters have emerged as cornerstone metrics for assessing and ensuring assay quality: the Z'-factor, Signal-to-Noise Ratio (S/N), and Coefficient of Variation (CV). These metrics provide researchers with quantitative tools to monitor assay performance, optimize experimental conditions, and validate screening robustness before committing to large-scale production runs. Their proper application is especially critical in complex, multiparametric screening technologies such as high-content screening, flow cytometry, and modern plant phenotyping platforms, where rich, information-dense datasets are generated [53] [54].
The integration of these metrics throughout the assay development and screening lifecycle forms the foundation of robust HTS. As highlighted by BellBrook Labs, a successful HTS assay must balance sensitivity, reproducibility, and scalability, with these key parameters providing the necessary benchmarks for evaluation [54]. This document provides detailed application notes and protocols for the calculation, interpretation, and implementation of these critical performance metrics within the context of high-throughput phenotyping robustness screening research.
Metric Definitions and Quantitative Summaries
Core Definitions and Calculations
Z'-Factor: The Z'-factor is a dimensionless statistical parameter that assesses the quality of a bioassay by accounting for both the dynamic range between the positive and negative controls and the data variation associated with these controls. It is calculated using the formula: Z' = 1 - [3(σₚ + σₙ) / |μₚ - μₙ|] where μₚ and μₙ are the means of the positive (p) and negative (n) control signals, and σₚ and σₙ are their standard deviations [54] [55]. A robust version of the Z'-factor can be calculated using the median and median absolute deviation (MAD) instead of mean and standard deviation, making it less sensitive to outliers, which is particularly beneficial for complex cell-based assays [56].
Signal-to-Noise Ratio (S/N): This metric compares the magnitude of a desired signal (e.g., the difference between positive and negative controls) to the level of background noise. It is a fundamental measure of detectability in an assay. While specific formulas can vary, a common calculation is: S/N = (μₚ - μₙ) / σₙ where μₚ and μₙ are the means of the positive and negative controls, and σₙ is the standard deviation of the negative control [54] [55].
Coefficient of Variation (CV): The CV represents the ratio of the standard deviation to the mean, expressed as a percentage. It is a standardized measure of dispersion or variability of data, independent of the unit of measurement. It is calculated as: CV = (σ / μ) × 100% where σ is the standard deviation and μ is the mean of the replicate measurements (e.g., of a control) [54]. It is crucial for assessing the precision and reproducibility of an assay across wells and plates.
Interpretation and Benchmarking of Metrics
The following table summarizes the standard benchmarks for interpreting these key metrics in an HTS context, guiding researchers on the acceptability of their assay performance.
Table 1: Interpretation and Benchmark Values for Key HTS Performance Metrics
| Metric | Calculation | Excellent Assay | Acceptable Assay | Unacceptable/Weak Assay | Primary Assessment Function |
|---|---|---|---|---|---|
| Z'-Factor | 1 - [3(σₚ + σₙ) / |μₚ - μₙ|] | 0.5 to 1.0 [54] [56] | 0.3 to 0.5 [57] | < 0.3 [57] | Assay robustness and suitability for HTS; measures separation band between controls. |
| Signal-to-Noise (S/N) | (μₚ - μₙ) / σₙ | > 10 (Highly robust) | > 5 (Adequate for screening) | < 5 (Insufficient dynamic range) | Assay dynamic range and detectability of hits above background. |
| Coefficient of Variation (CV) | (σ / μ) × 100% | < 10% [57] | 10% - 20% | > 20% | Intra-plate and inter-plate precision and reproducibility. |
Beyond these core metrics, the Strictly Standardized Mean Difference (SSMD) is another powerful measure for quality control and hit detection. It is defined as: SSMD = (μ₁ - μ₂) / √(σ₁² + σ₂²) where μ₁ and μ₂ are the means and σ₁ and σ₂ the standard deviations of two populations (e.g., positive and negative controls). An SSMD > 3 indicates excellent separation, meaning the mean difference is at least three times the standard deviation of the difference, with a high probability that a value from the first population is larger than one from the second [55].
Experimental Protocols for Metric Assessment
Comprehensive Assay Validation Workflow
The following diagram illustrates the key stages of an assay validation workflow, from initial setup to production screening, highlighting where quality metrics are critical.
Protocol 1: Plate Uniformity and Control Validation
This protocol is designed to assess positional biases and establish the foundational dynamic range of the assay.
- Objective: To identify and quantify edge effects or signal drift across a microtiter plate, and to perform an initial calculation of the Z'-factor using positive and negative controls.
- Materials:
- Microtiter plates (96, 384, or 1536-well)
- Assay reagents and cells (if cell-based)
- Positive control compound (e.g., known agonist/antagonist)
- Negative control (e.g., vehicle like DMSO, wild-type cells, untreated control)
- Liquid handling automation or multichannel pipettes
- Plate reader or imager
- Procedure:
- Plate Layout: Design a plate map where the positive and negative controls are dispersed across the plate, including the outer rows/columns and the interior, to effectively capture spatial biases. For a 384-well plate, it is standard to leave the outer row and columns empty of test compounds to minimize edge effects [57].
- Assay Execution: Run the complete assay protocol on the prepared plate(s) using the validated liquid handling methods.
- Data Acquisition: Read the plates using the appropriate detector (e.g., fluorescence, luminescence, absorbance imager).
- Analysis:
- Visual Inspection: Plot the raw signal values by well position to visually identify patterns of drift (e.g., left-to-right gradient) or edge effects (strong signal on perimeter).
- Z'-Factor Calculation: Calculate the Z'-factor using the data from all positive and negative control wells, regardless of position.
- B-Score Normalization (Optional): If significant positional effects are detected, apply the B-score method to mitigate this bias. The B-score uses Tukey's two-way median polish to estimate and correct for row and column specific effects, resulting in a corrected signal estimate:
rijp = xijp - μp - Ri - Cj, whereμpis the plate average,Riis the row effect, andCjis the column effect. This corrected value is then divided by the plate's MAD [55].
- Acceptance Criteria: Drift or edge effects should be less than 20% of the overall signal. The Z'-factor should be a minimum of 0.3 to proceed to the next validation stage, with a target of >0.5 for an excellent assay [57] [54].
Protocol 2: Replicate Experiment for Precision Assessment
This protocol evaluates the reproducibility and precision of the assay over time and across multiple plates.
- Objective: To determine the inter-plate and intra-plate Coefficient of Variation (CV) and confirm the robustness of the Z'-factor over multiple experimental runs.
- Materials: (Same as Protocol 1, with sufficient reagents for multiple plates)
- Procedure:
- Replicate Design: Perform a minimum of two replicate experiments over different days to capture biological and technical reproducibility [57].
- Plate Layout: Use identical plate layouts for each replicate, including the same arrangement of positive and negative controls.
- Assay Execution: Run the complete assay protocol independently for each replicate.
- Data Analysis:
- Intra-Plate CV: For each replicate plate, calculate the CV for the negative control wells and the positive control wells.
- Inter-Plate CV: Calculate the overall mean and standard deviation for the negative controls across all replicate plates, then compute the CV.
- Z'-Factor Consistency: Calculate the Z'-factor for each individual replicate plate and for the combined data from all replicates.
- Acceptance Criteria: The intra-plate and inter-plate CV for control wells should typically fall within 10% [57]. The Z'-factor should remain consistently above 0.3 across all replicates.
Advanced Applications and Methodological Considerations
Adaptation for Complex Biological Systems
Standard metrics often require adaptation for sophisticated screening paradigms. In high-content, multiparametric screens that generate multiple readouts, relying on a Z'-factor from a single readout is suboptimal. A proposed extension involves using linear projections to condense multiple readouts into a single parameter, upon which a unified Z'-factor is calculated, providing a more holistic view of assay quality [53].
Similarly, for cell-based assays with complex readouts, such as extracellular electrophysiological recordings from neurons, the standard Z'-factor can be inadequate. A robust Z'-factor based on the median and Median Absolute Deviation (MAD) of log-transformed data has been successfully applied, yielding excellent Z'-factor values (e.g., 0.61) and ensuring insensitivity to data variation and non-normal distributions [56].
Hit Identification and Data Normalization
The ultimate goal of HTS is the accurate identification of "hits." While thresholds based on a multiple of standard deviations (e.g., mean ± 3 SD) or MAD are common, the Strictly Standardized Mean Difference (SSMD) is a statistically powerful alternative for both quality control and hit detection. It is particularly useful for controlling the false discovery rate in primary screens [55].
Effective hit detection is wholly dependent on proper data normalization to remove technical artifacts like plate, batch, and positional biases. Beyond the Percentage of Control (POC) and Normalized Percentage Inhibition (NPI) methods, plate-based normalization methods like the Z-Score and Robust Z-Score are critical. The Robust Z-Score, using median and MAD, is less sensitive to outliers: Robust Z-Score = (xi - Medianₚ) / MADₚ [55]. Combining replication with randomization (assigning compounds to random well locations across replicates) and spatial bias correction during normalization significantly improves the detection of rare biological events and the reliability of hits [58].
The Scientist's Toolkit: Essential Research Reagent Solutions
Table 2: Key Reagents and Platforms for High-Throughput Phenotyping and Screening
| Item / Platform Name | Type / Category | Key Function / Application | Example Use Case |
|---|---|---|---|
| Transcreener Platform [54] | Biochemical HTS Assay | Universal, homogeneous immunoassay for detecting nucleotide products (ADP, GDP, cAMP). | Screening inhibitors for diverse enzyme classes (kinases, GTPases, PARPs). |
| 3i Platform [59] | Immunophenotyping Platform | High-density, high-throughput infection and immunity phenotyping via flow cytometry and challenge assays. | Systematic analysis of immune system variation in knockout mouse models. |
| PhenoLab [60] | Plant Phenotyping Platform | Automated, multispectral imaging platform for non-destructive measurement of biomass and stress responses. | Detecting drought symptoms and powdery mildew in crop plants. |
| LemnaTec Systems [11] | Plant Phenotyping Platform | Automated, image-based systems for non-invasive screening of traits in controlled environments. | Quantifying salinity tolerance traits in rice. |
| Microelectrode Arrays (MEAs) [56] | Electrophysiology Tool | Extracellular recording of spontaneous and evoked activity in neuronal networks for compound screening. | Identifying analgesic compounds affecting dorsal root ganglion neuron activity. |
| NU-Spidercam [61] | Field HTPP System | Field-based high-throughput phenotyping platform using multispectral, thermal, and LiDAR sensors. | Estimating plot-scale evapotranspiration (ET) for drought response evaluation. |
Integrated Workflow for HTPP Data and Metric Calculation
The analysis of data from complex phenotyping platforms involves a multi-stage workflow to transform raw data into reliable hits and biological insights, as shown in the following diagram for a Field HTPP system.
High-Throughput Screening (HTS) represents a foundational methodology in modern drug discovery and biomedical research, enabling the rapid testing of thousands to millions of chemical or biological compounds for activity against biological targets. Within the specific context of high-throughput phenotyping robustness screening research, HTS workflows are meticulously designed to identify chemical probes that can reliably modulate phenotypic responses in complex biological systems, thereby establishing robust cause-effect relationships between molecular targets and phenotypic outcomes. This application note delineates a standardized, robust HTS protocol from compound library management through primary screening, with particular emphasis on statistical robustness and assay quality control to ensure reproducible and biologically relevant hit identification.
The integration of quantitative HTS (qHTS) approaches, where compounds are screened at multiple concentrations to generate concentration-response profiles, has significantly enhanced the robustness of screening campaigns by providing immediate confirmation of dose-dependent activity and improving the fidelity of hit identification [30] [62]. This is particularly critical in phenotyping screens where subtle phenotypic changes must be distinguished from background biological noise and systematic assay artifacts.
Compound Library Management
Library Composition and Design
The foundation of any HTS campaign is a well-curated compound library designed to maximize chemical diversity and target coverage while minimizing compounds with undesirable properties. For phenotypic screening, libraries are often enriched for compounds with known bioactivity or target class specificity to facilitate downstream target deconvolution.
Table 1: Representative Compound Library Compositions for Phenotypic Screening
| Library Type | Example Sources | Compound Count | Key Characteristics | Application in Phenotypic Screening |
|---|---|---|---|---|
| Diverse Collections | Vanderbilt Discovery Collection [63] | ~100,000-150,000 | Lead-like motifs, maximum diversity, minimal pan-assay interference | Primary screening for novel phenotype modulators |
| Focused/Directed Libraries | Kinase Inhibitor Library [63] | ~400-7,000 | Target class-specific (e.g., kinases, ion channels, GPCRs) | Hypothesis-driven screening for phenotypes associated with specific target classes |
| Known Bioactives & FDA-Approved | FDA-Approved Drugs [63] | ~1,000 | Clinically relevant compounds with established safety profiles | Drug repurposing and mechanism identification |
| Natural Product-Inspired | Prism Library [64] | ~48,000 | Novel scaffolds, high chirality and FSP³ | Identifying compounds with complex bioactivity profiles |
| Fragment Libraries | Fesik Fragment Library [63] | ~15,000 | Low molecular weight (<300 Da) | Fragment-based phenotypic screening |
Compound Storage and Management
Robust compound management is essential for maintaining compound integrity and ensuring screening reproducibility. Key considerations include:
- Storage Conditions: HTS libraries should be stored in a custom-built facility with controlled low humidity and ambient temperature to ensure compound integrity [64].
- Automated Tracking: Implementation of integrated informatics platforms, such as Titian Mosaic SampleBank software linked with automated storage systems, enables precise compound tracking and efficient ordering of assay plates [64].
- Quality Control: Regular quality control (QC) checks using Liquid Chromatography-Mass Spectrometry (LCMS) to analyze samples from HTS library source plates maintains the highest quality of compounds throughout screening campaigns [64].
For quantitative HTS approaches, compound management systems must accommodate preparation of inter-plate dilution series to enable concentration-response screening [62]. This vertical dilution approach, where each plate in a series contains a different concentration of the same compound set, allows for efficient testing of full concentration ranges across the entire library.
Experimental Protocols for HTS Workflow Implementation
Protocol 1: Assay Development and Validation for Phenotypic Screening
Objective: To develop and validate a robust assay system suitable for high-throughput phenotypic screening.
Materials:
- Cell line or biological system of interest
- Assay reagents and probes appropriate for the phenotypic endpoint
- 384-well or 1536-well microplates
- Liquid handling automation
- Appropriate detection instrumentation (e.g., plate reader, imaging system)
Methodology:
- Assay Optimization: Systematically vary key assay parameters (e.g., cell density, reagent concentrations, incubation times) to establish optimal signal-to-background ratios and robust Z' factors.
- Miniaturization and Automation Adaptation: Transition assay from manual low-throughput format to automated HTS-compatible format, ensuring consistent performance with automated liquid handling.
- Robustness Validation:
- Perform intra-plate and inter-plate controls to assess uniformity and reproducibility.
- Calculate Z' factor using the formula: Z' = 1 - (3σ₊ + 3σ₋) / |μ₊ - μ₋|, where σ₊ and σ₋ are the standard deviations of positive and negative controls, and μ₊ and μ₋ are their means [65].
- Assays with Z' > 0.4 are considered robust for HTS; values > 0.5 are excellent [65].
- Pilot Screening: Conduct a pilot screen with a small, diverse compound subset (1,000-5,000 compounds) to validate assay performance and estimate initial hit rates.
Protocol 2: Primary Screening and Hit Identification
Objective: To execute a full-scale primary screen and identify initial hit compounds with acceptable statistical confidence.
Materials:
- Validated assay system
- Compound library in assay-ready format
- HTS automation system with acoustic dispensing (e.g., Echo technology) [64]
- Data analysis software (e.g., Genedata Screener) [64]
Methodology:
- Screen Execution:
- Program automated screening workflow using dynamic scheduling software (e.g., Cellario) to ensure uniform treatment across assays [64].
- Perform primary screen testing single concentration per compound (typically 1-10 μM) from selected libraries.
- Include appropriate controls (positive, negative, vehicle) distributed throughout plates to monitor assay performance.
- Data Processing:
- Normalize raw data using vehicle and positive controls to calculate percent activity [30].
- For cell viability assays, normalize relative to vehicle control (0%) and positive control (-100%) using the formula: y = (y₀ - N) / (I - N) × (-100), where y is percent activity, y₀ is raw data value, N is the median of vehicle control, and I is the median of positive control [30].
- Hit Identification:
- Apply robust statistical methods to account for heteroscedasticity and outliers in HTS data [30].
- Use plate-wise normalization to correct for systematic inter-plate and intra-plate variations.
- Apply hit thresholds based on statistical significance (e.g., >3 standard deviations from mean activity) and/or potency (e.g., >50% inhibition or activation).
Protocol 3: Robust Statistical Analysis for Hit Confirmation
Objective: To implement robust statistical methods for reliable hit identification in HTS data analysis.
Materials:
- Primary screening data
- Statistical software with robust estimation capabilities
- Computational resources for large dataset analysis
Methodology:
- Variance Structure Assessment:
- Perform preliminary analysis to determine variance structure (homoscedastic vs. heteroscedastic) in dose-response data.
- For heteroscedastic data, implement iterated weighted least squares (IWLS) methodology by modeling variance as a function of dose [30].
- Robust Curve Fitting:
- Fit dose-response data using the Hill model: f(x,θ) = θ₀ + (θ₁ × θ₃^θ₂) / (x^θ₂ + θ₃^θ₂), where x denotes dose, θ₀ is the lower asymptote, θ₁ is the efficacy, θ₂ is the slope parameter, and θ₃ is the ED₅₀ [30].
- Employ M-estimation procedures with Huber-score function to mitigate influence of outliers [30].
- Compound Classification:
Workflow Visualization and Data Analysis
HTS Workflow Diagram
Robust Statistical Analysis in HTS
The analysis of HTS data requires specialized statistical approaches to handle large datasets with inherent variability and potential outliers. The following table summarizes robust statistical methods applicable to HTS data analysis:
Table 2: Robust Statistical Methods for HTS Data Analysis
| Method | Key Characteristics | Efficiency | Breakdown Point | Application in HTS |
|---|---|---|---|---|
| Algorithm A (Huber M-estimator) [66] | Modifies deviant observations; sensitive to minor modes | ~97% | ~25% | Suitable for datasets with <20% outliers |
| Q/Hampel Method [66] | Combines Q-method for SD estimation with Hampel's M-estimator | ~96% | 50% | Handles moderate proportions of outliers; resistant to minor modes |
| NDA Method [66] | Uses probability density functions; attributes normal distribution to each data point | ~78% | 50% | Highest robustness to asymmetry; particularly effective for small samples |
| Preliminary Test Estimation (PTE) [30] | Robust to variance structure and outliers | Varies | Varies | Better control of FDR while maintaining power in qHTS |
The Scientist's Toolkit: Essential Research Reagent Solutions
Table 3: Essential Research Reagents and Materials for HTS Implementation
| Reagent/Material | Function | Application Notes |
|---|---|---|
| Echo Acoustic Dispenser [64] | Non-contact compound transfer with high accuracy | Enables nanoliter-scale compound dispensing with high precision; essential for qHTS |
| Genedata Screener [64] | HTS data analysis and management | Processes large, complex datasets; integrates plate barcodes with sample ID for data fidelity |
| Glycerol Stock Libraries | Long-term compound storage | Maintains compound integrity at -80°C; enables reproducible screening over time |
| LC-MS Systems [64] | Compound quality control | Verifies compound identity and purity in source plates; critical for QC |
| Cellario Dynamic Scheduler [64] | Automation scheduling | Ensures uniform treatment across assays; enables extended continuous operation (20-30 hours) |
| pCA Detection Reagents [65] | Product detection in enzyme assays | Enables spectrophotometric quantification of reaction products at 310 nm; used in TAL activity screening |
| HTS-Compatible Assay Kits | Specific detection of phenotypic endpoints | Optimized for miniaturized formats; include positive/negative controls for normalization |
| Robust Statistical Software [30] [66] | Data analysis and hit identification | Implements M-estimation procedures and handles heteroscedastic data structures |
This application note has detailed a comprehensive HTS workflow from compound library management through primary screening, with particular emphasis on protocols and methodologies essential for robust phenotyping screening research. The integration of quality control measures throughout the workflow, combined with robust statistical analysis methods, ensures the identification of high-quality hits with confirmed phenotypic activity. The implementation of quantitative HTS approaches further enhances screening robustness by providing immediate concentration-response information, facilitating more reliable hit selection and prioritization for downstream phenotypic characterization.
Developing a new therapeutic is a complex process that can take 12–15 years and cost over $1 billion [67]. A significant reason for clinical failure is a lack of efficacy or unforeseen safety issues [67]. This application note details an integrated strategy employing high-throughput phenotypic screening for robust target validation and comprehensive toxicity assessment. This methodology, framed within broader research on high-throughput phenotyping robustness, aims to de-risk drug discovery projects early by simultaneously establishing therapeutic potential and identifying mechanism-based safety concerns. We demonstrate this approach through a case study on a novel ion channel target for pain management, utilizing the extensive compound libraries and automated screening capabilities of the Tox21 program [68] [69].
Experimental Design and Workflow
The overall experimental strategy is a sequential, integrated workflow that moves from initial phenotypic observation to detailed mechanistic and safety evaluation.
Diagram 1: Experimental workflow for integrated target validation and toxicity assessment.
Target Identification and Validation Strategies
Target identification originated from a phenotypic screen using a phage-display antibody library to isolate human monoclonal antibodies (mAbs) that preferentially bound to specific cell types [67]. This approach mirrors an elegant experiment where 21 distinct antigens highly expressed on several carcinomas were identified from 2,114 mAbs with unique sequences [67]. Following identification, a multi-validation approach significantly increases confidence in the observed outcome [67]. Table 1 summarizes the key techniques employed for target validation, each with distinct advantages and limitations.
Table 1: Key Target Validation Methodologies and Their Applications
| Methodology | Key Principle | Application in Validation | Critical Considerations |
|---|---|---|---|
| Antisense Technology [67] | Chemically modified oligonucleotides bind target mRNA, blocking protein synthesis. | Demonstrated anti-hyperalgesic activity of P2X3 receptor inhibition in chronic inflammatory pain models. | Effects are reversible; limited bioavailability and potential toxicity require careful dosing. |
| Transgenic Animals [67] | Gene knockouts or knock-ins to observe phenotypic endpoints. | P2X7 knockout mice showed complete absence of inflammatory and neuropathic hypersensitivity. | Can be time-consuming and expensive; embryonic lethality may require tissue-restricted/inducible systems. |
| siRNA [67] | Double-stranded RNA activates RNAi pathway, leading to cleavage of target mRNA. | Systemic application for gene silencing in vivo. | Delivery to the target cell remains a major challenge; viral and non-viral delivery systems are under investigation. |
| Monoclonal Antibodies [67] | High-affinity, specific binding to unique epitopes on target proteins. | Function-neutralizing anti-TrkA antibody MNAC13 reduced neuropathic pain and inflammatory hypersensitivity. | Excellent specificity but generally restricted to cell surface and secreted proteins due to inability to cross cell membranes. |
| Chemical Genomics [67] | Systemic application of tool molecules to study genomic responses. | Uses diversity-oriented chemical libraries and high-content cellular assays to evaluate cellular function. | Aims to provide chemical tools against every protein in the genome to assess function prior to major investment. |
High-Throughput Screening (HTS) and Toxicity Assessment
Quantitative High-Throughput Screening (qHTS) Protocol
Objective: To identify active compounds from a large chemical library against the validated target in a concentration-responsive manner. Materials:
- Compound Library: Tox21 10K library (~10,000 compounds) in 15-point concentration format, dissolved in DMSO [68].
- Assay Plates: 1,536-well plates [68].
- Automation: Integrated robotic system (e.g., Staubli arm) with liquid handlers (BioRAPTR 2.0, Pintool station), plate washers, incubators, and readers (ViewLux, EnVision, FDSS 7000EX, Operetta CLS) [68].
- Reagents: Cell-based or biochemical assay components specific to the target.
Procedure:
- Assay Development: Optimize the assay for a miniaturized 1,536-well format. Validate using performance metrics such as Z'-factor (target >0.5), signal-to-noise ratio, and dynamic range [70].
- Plate Preparation: Using acoustic dispensers (e.g., Labcyte Echo), transfer compounds from the library to create assay-ready plates [68].
- Compound Addition: Employ a pintool or liquid handler to transfer nanoliter volumes of compounds to the assay plates [68].
- Cell/Reagent Addition: Dispense cells or biochemical reagents using a non-contact liquid handler to initiate the reaction.
- Incubation: Incubate plates under controlled conditions (e.g., 37°C, 5% CO₂) for the required time.
- Signal Detection: Read plates using appropriate detectors (luminescence, fluorescence, absorbance, or high-content imaging) [68].
- Data Processing: Analyze raw data to generate concentration-response curves for each compound. Identify "hits" based on efficacy and potency (e.g., IC₅₀) [68] [70].
In Vitro Toxicology Screening Protocol
Objective: To profile hits from the primary screen for potential toxicological effects using a battery of mechanism-based assays. Materials:
- Platform: Tox21 robotic screening system [68] [69].
- Assays: A battery of cell-based and biochemical assays covering key toxicity pathways:
Procedure:
- Hit Triage: Select confirmed hits from the primary qHTS for toxicological profiling.
- Multiplexed Screening: Screen hits against the Tox21 assay battery in a high-throughput, concentration-responsive manner. Many assays are multiplexed to measure cytotoxicity alongside the primary readout, helping to distinguish true target modulation from general cytotoxic effects [68].
- Data Integration: Compile bioactivity data across all assays to create a toxicity profile for each compound.
- Hazard Characterization: Use computational modeling and the integrated data to prioritize compounds with the most favorable efficacy and safety profiles for further development [68] [69].
Key Performance Data and Reagents
The success of HTS campaigns relies on robust assay performance and high-quality chemical libraries. Table 2 outlines critical performance metrics, while Table 3 lists essential research reagents.
Table 2: HTS Performance and Quality Control Metrics (based on Tox21 10K Library) [68] [70]
| Parameter | Specification | Purpose & Impact |
|---|---|---|
| Assay Robustness (Z'-factor) | 0.5 - 1.0 (Excellent) [70] | Measures the quality and suitability of an HTS assay. A high Z'-factor indicates a robust and reproducible assay. |
| Compound Library Size | ~10,000 chemicals (Tox21 10K) [68] | Provides a broad representation of environmental chemicals and drugs for comprehensive screening. |
| Concentration Format | 15-point concentration response, in triplicate [68] | Yields comprehensive and robust bioactivity data, reducing false positives/negatives. |
| Quality Control (QC) | LC-MS, GC-MS, NMR spectroscopy [68] | Ensures chemical identity, purity, and concentration. Poor QC leads to misinterpretation of screening data. |
| Throughput | Thousands of compounds per day [68] [70] | Enables rapid evaluation of large chemical libraries against multiple targets/toxicity pathways. |
Table 3: Essential Research Reagent Solutions
| Reagent / Solution | Function in Experiment |
|---|---|
| qHTS Compound Library [68] | A collection of thousands of chemicals formatted for high-throughput screening to identify active molecules. |
| Cell-Based Assays [70] | Used in phenotypic screening and toxicity assessment to measure effects in a biologically relevant system. |
| Biochemical Assays [70] | Used for target-based screening to measure direct interactions with purified proteins (e.g., enzyme inhibition). |
| Monoclonal Antibodies (mAbs) [67] | Used as a highly specific target validation tool and as potential therapeutic agents (e.g., MNAC13). |
| siRNA/Oligonucleotides [67] | Used for gene silencing in target validation studies to observe phenotypic consequences of reduced target expression. |
Results and Data Analysis
The integrated workflow produces multidimensional data that must be synthesized to make informed decisions. The signaling pathways interrogated during toxicity assessment provide a mechanistic understanding of potential adverse outcomes.
Diagram 2: Key toxicity pathways identified in high-throughput screening.
The application of this workflow in our case study successfully identified several hit compounds with desired activity against the ion channel target. Subsequent toxicity profiling within the Tox21 assay battery provided a comparative safety index, allowing for the rational prioritization of lead candidates. For instance, compounds showing desirable potency but concomitant activation of the NF-κB pathway or significant hERG channel inhibition were deprioritized in favor of compounds with a cleaner ancillary profile. This approach exemplifies the power of high-throughput phenotyping in building a comprehensive view of a compound's biological activity early in the discovery process, thereby increasing the likelihood of clinical success [68] [69].
Hit identification (Hit ID) represents the initial critical decision point in small-molecule discovery, focusing on the identification of chemical matter that measurably modulates a biological target or phenotype and possesses suitable characteristics for optimization [71]. In practice, Hit ID narrows very large chemical collections to a small, structurally diverse set of validated "hits" [71]. This document outlines advanced strategies for the post-primary screening phase, where initial actives are rigorously triaged and validated to ensure only high-quality hits progress to lead optimization. Within high-throughput phenotyping robustness screening research, this phase is particularly crucial for eliminating false positives and confirming biologically relevant activity in complex phenotypic models.
A "hit" is formally defined as a compound with confirmed, reproducible activity and tractable chemistry, whereas a "lead" compound must meet stricter thresholds for potency, selectivity, preliminary ADME/DMPK, and chemical developability [71]. The post-primary phase serves as the bridge between these stages, applying stringent validation to ensure research resources are invested in the most promising chemical series.
Defining Hit Identification Criteria and Metrics
Establishing clear, target-aware hit identification criteria before commencing screening is fundamental to successful post-primary analysis. Analysis of published virtual screening results between 2007-2011 revealed that only approximately 30% of studies reported a clear, predefined hit cutoff, with no clear consensus on selection criteria [72]. Both concentration-response endpoints (IC₅₀, EC₅₀, Kᵢ, or Kd) and single concentration percentage inhibition serve as biological metrics [72].
Quantitative Hit Criteria
Table 1: Established Hit Identification Criteria for Different Screening Modalities
| Screening Method | Typical Potency Range | Primary Metrics | Ligand Efficiency (LE) Requirements |
|---|---|---|---|
| High-Throughput Screening (HTS) | Low micromolar (μM) | IC₅₀, EC₅₀, % Inhibition | Not typically applied initially [72] |
| Virtual Screening (VS) | 1-100 μM [72] | Ki, IC₅₀, % Inhibition | Rarely used as hit criterion; size-targeted LE recommended [72] |
| Fragment-Based Screening (FBS) | High micromolar to millimolar | Kd, IC₅₀ | LE ≥ 0.3 kcal/mol/heavy atom [71] |
| Phenotypic Screening | Variable | EC₅₀, % Effect vs. Control | Not typically applied initially |
Analysis of historical virtual screening data indicates that activity cutoffs are most frequently set in the low to mid-micromolar range (1-25 μM), with some studies employing cutoffs as high as 100-500 μM to improve structural diversity or when screening novel targets without known actives [72]. For phenotypic screening in high-throughput robustness research, hit thresholds must be established relative to control compounds and statistical significance from background variation.
Comprehensive Hit Quality Assessment
Beyond pure potency, high-quality hits must satisfy multiple orthogonal criteria [71]:
- Confirmed Activity: Reproducible concentration-response in the primary assay, typically with hits in the μM range (exact thresholds are target/assay dependent) [71]
- Selectivity Profile: Clean in counter-screens against close homologs/anti-targets; exclusion of PAINS motifs, non-aggregating behavior, and appropriate redox/fluorescence interference profiles [71]
- Chemical Tractability: Synthetic accessibility with clear points for analogue design and freedom-to-operate or IP novelty [71]
- Early ADME Flags: Solubility and stability compatible with follow-up assays with acceptable basic physicochemical properties [71]
- Verified Identity & Purity: Confirmation via resynthesis, particularly critical for DNA-Encoded Library (DEL) hits which must be resynthesized off-DNA for validation [71]
Experimental Protocols for Hit Validation
The following section provides detailed methodologies for key experiments in the post-primary screening phase, with particular emphasis on applications within high-throughput phenotyping research.
Protocol 1: Concentration-Response Curve Analysis
Purpose: To confirm primary screening activity and determine compound potency (IC₅₀/EC₅₀) with high accuracy.
Materials:
- Compound hits from primary screen (10 mM DMSO stocks)
- Assay reagents for primary phenotypic readout
- 384-well or 1536-well assay plates
- Liquid handling automation (e.g., acoustic dispensers)
- Plate reader appropriate for detection method
Procedure:
- Prepare 1:3 serial dilutions of compound stocks in DMSO across 10 concentration points, typically from 10 μM to 0.5 nM final concentration.
- Transfer compounds to assay plates using non-contact dispensing, maintaining DMSO concentration ≤0.5%.
- Add assay reagents according to established primary screening protocol.
- Incubate plates under conditions matching primary screen (time, temperature, atmospheric conditions).
- Measure assay signal using validated readout system.
- Include controls on each plate: vehicle (DMSO) for 100% response, reference control for 0% response.
- Perform data normalization: % Response = [(Test Well - Median 100% Control) / (Median 0% Control - Median 100% Control)] × 100.
- Fit normalized data to four-parameter logistic Hill equation using specialized software (e.g., GraphPad Prism).
- Criteria for confirmation: IC₅₀/EC₅₀ within 3-fold of primary screening result and curve R² > 0.90.
Protocol 2: Orthogonal Assay Validation for Phenotypic Screens
Purpose: To confirm target engagement or mechanism of action using an independent methodological approach.
Materials:
- Validated hits from concentration-response analysis
- Reagents for orthogonal assay method (e.g., biophysical binding, cellular imaging)
- Counter-screen assay components
Procedure:
- Cellular Thermal Shift Assay (CETSA):
- Treat cells with hit compounds (10 μM) or DMSO control for 2 hours.
- Heat cells at different temperatures (e.g., 45-65°C) for 3 minutes.
- Lyse cells and isolate soluble protein fraction.
- Quantify target protein levels by immunoblotting or MS-based proteomics.
- Calculate melting temperature (Tm) shifts; significant shifts (ΔTm
High-Content Imaging Analysis:
- Seed cells expressing fluorescently tagged target protein in 96-well imaging plates.
- Treat with hit compounds at IC₅₀ concentration for determined time period.
- Fix, stain with appropriate dyes (e.g., DAPI, phalloidin), and image using high-content microscope.
- Quantify morphological changes, protein translocation, or phenotypic endpoints using automated image analysis.
- Apply machine learning-based classification, such as convolutional neural networks (CNNs) for phenotypic discrimination, as demonstrated in plant chemical genomics [20].
Counter-Screening:
- Test hits against related but undesired targets (e.g., kinase panel for kinase targets).
- Assess activity in reporter gene assays to rule out non-specific pathway activation.
- Minimum selectivity requirement: >10-fold selectivity over anti-targets.
Protocol 3: Specificity and Artifact Assessment
Purpose: To eliminate compounds acting through non-specific mechanisms.
Materials:
- Hit compounds from confirmation assays
- Detergents (e.g., Triton X-100, CHAPS)
- Reducing agents (e.g., DTT)
- Enzymes for compound degradation (e.g., horseradish peroxidase)
Procedure:
- Aggregation Testing:
- Repeat concentration-response assays in presence of 0.01% Triton X-100.
- Right-shift or complete loss of activity indicates aggregation-based mechanism.
- Discard compounds showing significant detergent sensitivity.
Redox Cycling Assessment:
- Incubate compounds with horseradish peroxidase and H₂O₂.
- Measure hydrogen peroxide production using Amplex Red fluorescence.
- Compounds generating >3-fold increase in signal over background are considered redox cyclers.
Covalent Modifier Screening:
- Pre-incubate compounds with 1 mM DTT for 2 hours.
- Test activity in standard concentration-response assay.
- Significant potency reduction indicates electrophilic reactivity.
Cytotoxicity Counter-Screen:
- Treat relevant cell lines with compounds at 10× IC₅₀ concentration.
- Measure cell viability after 24-72 hours using ATP-based or resazurin assays.
- Discard compounds showing >50% reduction in viability at tested concentration.
Data Analysis and Hit Triage Workflow
The hit triage process involves sequential application of filters to prioritize the most promising chemical matter for lead optimization.
Diagram 1: Hit Triage Workflow. This flowchart illustrates the sequential filtering process for prioritizing high-quality hits from primary screening outputs.
Statistical Analysis for High-Throughput Phenotyping
In high-throughput phenotyping robustness screening, rigorous statistical analysis is essential for distinguishing true hits from background variation:
Z'-Factor Calculation: For each plate, calculate Z' factor using positive and negative controls: Z' = 1 - [3×(σp + σn) / |μp - μn|], where σp and σn are standard deviations of positive and negative controls, and μp and μn are their means. Plates with Z' < 0.5 should be repeated.
Normalization Methods:
- Plate-based normalization: % Activity = [(Value - Plate Median) / (Positive Control Median - Plate Median)] × 100
- B-score normalization: Apply two-way median polish to remove row and column effects in high-throughput screens.
Hit Threshold Determination:
- Standard Deviation Method: Threshold = Mean + 3×SD of entire compound library
- Percentage Method: Threshold = 30-50% inhibition/activation based on biological relevance
- False Discovery Rate (FDR): Use Benjamini-Hochberg procedure to control FDR at 5%
The Scientist's Toolkit: Essential Research Reagents and Materials
Table 2: Key Research Reagent Solutions for Post-Primary Hit Identification
| Reagent/Material | Function | Application Notes |
|---|---|---|
| Multi-Assay Stock Plates | Standardized inoculum of exponentially growing cells for phenotypic consistency [16] | Enables identical batch usage across multiple assays; critical for genotyping-phenotyping correlation studies [16] |
| DNA-Encoded Libraries (DELs) | Affinity selection of DNA-barcoded small molecules against targets [71] | Screening of billions of compounds; requires off-DNA resynthesis for hit validation [71] |
| cBTE Technology | Cellular Binder Trap Enrichment for screening DELs inside living cells [71] | Enables screening against membrane proteins and intracellular targets in physiological environment [71] |
| Convolutional Neural Networks (CNNs) | Image classification and segmentation for phenotypic analysis [20] | Residual Neural Network (ResNet) architecture accurately classifies normal vs. altered growth phenotypes [20] |
| Liquid Handling Automation | Automated compound transfer and assay assembly | Essential for concentration-response testing; maintains DMSO concentration ≤0.5% |
| Crystal Violet Staining Solution | Quantification of biofilm formation in phenotypic screens [16] | Applied in high-throughput format for bacterial phenotype assessment [16] |
Advanced Applications in High-Throughput Phenotyping
Implementation of robust post-primary screening strategies is particularly critical in high-throughput phenotyping research, where complex phenotypic outputs require sophisticated analytical approaches.
Diagram 2: Phenotypic Analysis Workflow. This diagram outlines the integrated computational-experimental pipeline for high-content phenotypic screening, incorporating machine learning for image analysis.
Machine Learning-Enhanced Phenotypic Analysis
Recent advances in phenotypic screening have leveraged deep learning approaches for enhanced hit identification:
Image Classification: Convolutional Neural Networks (CNNs) can be trained to classify images of growing samples into normal versus altered growth categories with high accuracy, as demonstrated in plant chemical genomics screens [20]. The residual neural network (ResNet) architecture has shown particular utility for this application [20].
Image Segmentation: Pixel-level segmentation enables quantitative analysis of specific morphological features, such as root versus aerial part quantification in plant systems, providing multidimensional phenotypic profiling [20].
Differential Phenotype Scoring: Comparison of two genotypes in primary screening allows identification of genotype-specific chemical regulators, improving efficiency when screening large chemical libraries [20].
Quality Control in High-Throughput Phenotyping
Implementation of rigorous quality control measures is essential for robust hit identification:
Plate Pattern Controls: Systematic arrangement of positive (e.g., MMC for DNA repair mutants) and negative controls (DMSO) across plates controls for positional effects [20].
Multi-Assay Stock Standardization: Production of identical batches of each biological isolate from mid-log phase growth ensures phenotypic consistency across assays [16].
Liquid Culture Optimization: Selection of appropriate media and vessel formats (e.g., 24-well vs. 96-well plates) significantly impacts phenotypic resolution and should be optimized for each system [20].
Effective post-primary screening analysis requires integrated application of rigorous hit identification criteria, orthogonal validation methodologies, and sophisticated data analysis techniques. Within high-throughput phenotyping research, the incorporation of machine learning-based image analysis and standardized biological reagents significantly enhances the robustness of hit identification. By implementing the structured protocols and quality control measures outlined in this document, researchers can ensure efficient triage of primary screening outputs to identify high-quality hits with the greatest potential for successful lead optimization. The strategic integration of computational and experimental approaches detailed herein provides a robust framework for advancing chemical biology and drug discovery research.
Navigating HTS Challenges: Strategies to Minimize Errors and Maximize Data Quality
High-throughput screening (HTS) and high-throughput phenotypic profiling (HTPP) represent cornerstone methodologies in modern drug discovery and biological research, enabling the rapid evaluation of thousands of chemical or genetic perturbations [73]. However, the reliability of data generated from these automated platforms is frequently compromised by three persistent technical challenges: edge effects, assay drift, and liquid handling inconsistencies. These pitfalls can introduce significant systematic error, reducing data quality and potentially leading to both false positive and false negative results [57] [74]. Within the context of high-throughput phenotyping robustness screening, addressing these artifacts is not merely a procedural formality but a fundamental requirement for generating biologically meaningful and reproducible data. This application note details the origins, detection methods, and mitigation strategies for these common pitfalls, providing researchers with structured protocols to enhance the robustness of their screening workflows.
Defining the Pitfalls and Their Impact on Data Quality
Edge Effects
Edge effects refer to systematic discrepancies in assay performance between the outer perimeter wells and the interior wells of a microtiter plate. These effects are primarily driven by increased evaporation rates in edge wells, leading to higher reagent concentrations and subsequent changes in reaction kinetics or cell viability [57] [74]. The impact is particularly pronounced in assays requiring long incubation periods or those run in miniaturized formats (e.g., 384-well or 1536-well plates) where the surface-area-to-volume ratio is high [74]. Consequently, data from edge wells can skew normalized results and lead to misinterpretation of compound efficacy or toxicity if not properly accounted for.
Assay Drift
Assay drift describes a temporal gradient in assay signal or background that occurs across the duration of a screening run [57]. This phenomenon can manifest as a systematic change in the positive or negative control values from the beginning to the end of a plate, or across multiple plates processed in a single batch. Drift is often attributable to gradual reagent degradation, temperature fluctuations within incubators or plate readers, or settling of cells or particles during the reading process [74]. Left uncorrected, assay drift can cause the same compound to exhibit different apparent activities depending on its position in the screening queue, confounding dose-response relationships and hit identification.
Liquid Handling Inconsistencies
Liquid handling inconsistencies encompass inaccuracies and imprecision in the dispensing of reagents, compounds, or cell suspensions. These inconsistencies can arise from clogged tips, faulty valves, improper calibration, or hydrodynamic issues related to fluid viscosity [74]. In high-throughput systems, even minor volumetric errors are magnified when working with microliter or nanoliter volumes, leading to poor well-to-well reproducibility and increased coefficients of variation (CV) [74]. This pitfall directly compromises the fundamental integrity of the assay data, as the observed biological effect may be conflated with variations in the quantity of material dispensed.
Detection and Quantitative Assessment
Robust detection and quantification are critical for diagnosing these pitfalls. The following protocols and metrics enable researchers to objectively assess the health of their screening campaigns.
Table 1: Key Quality Control Metrics for Assessing HTS Pitfalls
| Pitfall | Primary Detection Method | Key Quantitative Metrics | Acceptance Criteria |
|---|---|---|---|
| Edge Effects | Plate uniformity assessment; Visual inspection of plate heat maps [57]. | Signal comparison (e.g., CV, Z'-factor) between inner vs. outer wells [74]. | Signal variation < 20% [57]; Stable Z'-factor across plate zones. |
| Assay Drift | Control trajectory analysis across plate sequence; Time-course analysis of control wells [57]. | Z'-factor calculated per plate over time; Trend analysis of control values [75]. | Z'-factor > 0.3 for cell-based HTS [57]; No significant temporal trend (p > 0.05). |
| Liquid Handling Inconsistencies | Liquid handling validation with dyes; Inter-well and intra-plate CV assessment [57]. | Coefficient of Variation (CV) across replicate wells; Z'-factor [73] [57]. | CV < 10% for assay replicates; Z'-factor between 0.5 and 1.0 indicates an excellent assay [73]. |
Experimental Protocol: Plate Uniformity and Edge Effect Assessment
This protocol is designed to diagnose edge effects and plate-based artifacts prior to a full-scale production screen [57].
- Assay Setup: Prepare a test plate (96, 384, or 1536-well format) where all wells contain identical reagents and the same concentration of a control compound (e.g., a DMSO vehicle control for a negative control, or a known agonist/antagonist for a positive control). Use a homogeneous assay format with a clear readout (e.g., absorbance, fluorescence).
- Plate Processing: Run the complete assay protocol on the test plate as intended for the production screen, including all incubation, liquid handling, and reading steps.
- Data Analysis: Generate a heat map of the raw signal from the entire plate. Visually inspect for patterns, such as elevated or suppressed signals in the outer rows and columns.
- Quantitative Analysis: Segment the plate data into "edge wells" (the outermost row and column) and "inner wells" (all remaining wells). Calculate the mean signal and CV for each group. A difference of more than 20% suggests significant edge effects [57]. Additionally, calculate the Z'-factor for the entire plate to confirm overall assay robustness [75].
Experimental Protocol: Monitoring for Assay Drift
This protocol identifies temporal shifts in assay performance during a screening run [57].
- Plate Layout Design: Incorporate both positive and negative control wells distributed throughout the screening plate. For instance, use a checkerboard pattern or place controls in the first and last columns of the plate to track changes from start to finish [75].
- Data Collection: Process a sequence of plates as per the screening workflow, ensuring control data is captured for each plate.
- Trend Analysis: Plot the values of the positive and negative controls (e.g., mean signal, Z'-factor) as a function of plate number or time of reading. Perform a linear regression analysis on the control values. A statistically significant slope (p < 0.05) indicates the presence of assay drift.
Experimental Protocol: Liquid Handling Validation
This procedure verifies the accuracy and precision of liquid dispensing systems [57].
- Dye Solution Preparation: Prepare a solution of a colored or fluorescent dye in the primary solvent used in the assay (e.g., water, buffer).
- Liquid Transfer: Using the automated liquid handler, transfer the dye solution into a clear or optically compatible microtiter plate according to the planned assay protocol and volumes.
- Volume Measurement: Quantify the dispensed volumes either spectrophotometrically (if using a colored dye) or fluorometrically (if using a fluorescent dye) by comparing signals to a standard curve of known volumes.
- Data Analysis: Calculate the accuracy (mean measured volume vs. target volume) and precision (CV across all replicate wells) for each dispensing head or tip. An acceptable CV is typically less than 10% for assay replicates [57].
Mitigation Strategies and Robust Experimental Design
Once identified, these pitfalls can be effectively managed through careful experimental design and procedural adjustments.
Strategies to Mitigate Edge Effects
- Plate Sealing: Use of high-quality, optically clear plate seals after all liquid handling steps to minimize evaporation [74].
- Plate Layout: Leaving the outer row and column of a 384-well plate empty of test compounds and using them instead for controls, blanks, or buffer. This is a standard practice to sacrifice a small number of wells for greater overall data integrity [57] [75].
- Environmental Equilibration: Pre-incubating assay plates at room temperature after seeding to allow for thermal equilibration across the entire plate before placing them in a 37°C incubator [74].
- Statistical Correction: Employing intra-plate normalization algorithms that use control well data to correct for spatial biases during data analysis [75].
Strategies to Mitigate Assay Drift
- Randomization: Where feasible, randomizing the order of compound addition or plate reading to break the correlation between time and a specific treatment group [75].
- Batch Control: For multi-day or multi-plate screens, using a master plate of frozen control aliquots that are thawed and used a few at a time throughout the screen. This helps to identify and control for batch-specific variation or long-term drift [75].
- Robust Assay Conditions: Selecting reagents with extended stability and ensuring environmental controls (e.g., incubator CO₂, temperature) are rigorously maintained to minimize the root causes of drift [74].
Strategies to Mitigate Liquid Handling Inconsistencies
- Regular Calibration: Implementing a strict schedule for the preventive maintenance and calibration of all automated liquid handling equipment [74].
- Liquid Class Optimization: Ensuring the liquid class parameters (e.g., aspiration and dispense speeds, offsets) are optimized for the specific viscosity and surface tension of the reagents being dispensed.
- Technology Adoption: Utilizing non-contact liquid handling technologies, such as acoustic droplet ejection (ADE), which offer rapid, precise transfer of nanoliter volumes without the risk of carry-over contamination or tip-related inconsistencies [74].
- Quality Control Checks: Incorporating routine liquid handling validation checks with dyes, as described in Section 3.3, as part of the standard screening workflow.
Workflow for a Robust High-Throughput Screening Campaign
The following diagram integrates the detection and mitigation strategies into a coherent workflow for ensuring screening robustness.
The Scientist's Toolkit: Essential Research Reagent Solutions
The following table lists key reagents, tools, and materials critical for implementing the protocols described in this note and for general HTS robustness.
Table 2: Essential Research Reagent Solutions for HTS Robustness
| Item | Function/Application | Key Characteristics |
|---|---|---|
| Microtiter Plates | The physical platform for HTS assays [73]. | Available in 96-, 384-, and 1536-well formats; material (e.g., PS, TC-treated) suited to assay type (biochemical vs. cell-based). |
| High-Quality Plate Seals | Minimizes evaporation, a primary cause of edge effects [74]. | Optically clear for reading; airtight seal; adhesive or heat-sealed. |
| Control Compounds | Serves as positive and negative controls for assay QC and normalization [75]. | Well-characterized, pharmacologically relevant ligands for the target; vehicle controls (e.g., DMSO). |
| Fluorescent/Colorimetric Dyes | For liquid handling validation and homogeneous assay readouts [73] [57]. | Stable, bright, and compatible with detection instrumentation (e.g., plate readers). |
| Cell Viability Assay Kits | For cell-based screens to assess cytotoxicity and proliferation [57]. | Robust, homogeneous "mix-and-read" formats (e.g., Resazurin, ATP-based luminescence). |
| Stable Cell Lines | For consistent, reproducible cell-based phenotypic screening [57]. | Certified mycoplasma-free; consistent expression of target or reporter; well-defined passage protocol. |
| Z'-Factor Calculation | A key statistical parameter for assessing assay robustness and quality [73] [75]. | Calculated from positive and negative control data; values >0.5 are excellent [73]. |
Edge effects, assay drift, and liquid handling inconsistencies are inherent challenges in high-throughput phenotyping that, if unaddressed, can severely compromise data integrity. By implementing the systematic detection protocols and mitigation strategies outlined in this application note—including rigorous plate layout design, continuous quality control monitoring, and robust liquid handling practices—researchers can significantly enhance the reliability and reproducibility of their screening data. A proactive approach to managing these technical pitfalls is fundamental to the successful identification of genuine hits and the acceleration of robust drug discovery and biological research.
In high-throughput phenotyping and drug discovery, the reliability of screening results is paramount. False positives (incorrectly identifying an inactive compound as active) and false negatives (failing to identify a truly active compound) can significantly derail research, wasting valuable time and resources. The integration of orthogonal assays provides a powerful strategy to mitigate these risks by verifying results through independent measurement mechanisms.
An orthogonal measurement is defined as one that uses "different physical principles to measure the same property of the same sample with the goal of minimizing method-specific biases and interferences" [76]. This approach differs from complementary measurements, which "corroborate each other to support the same decision" but may not target the same specific attribute [77]. In practice, orthogonal strategies cross-reference antibody-based results with data from non-antibody-based methods, such as mass spectrometry or transcriptomics data, to confirm experimental findings [78].
The Critical Need for Orthogonal Verification
Consequences of Assay Artifacts
In high-throughput screening (HTS), false findings often arise from method-specific interferences. For example, in small molecule screening, compounds may exhibit auto-fluorescence or exhibit promiscuous behavior (so-called PAINS), leading to false positive signals [79]. Similarly, in genomic newborn screening, variants of uncertain significance can create interpretive challenges that resemble false positives without orthogonal confirmation through additional testing modalities [80].
Theoretical Framework for Orthogonal Verification
The theoretical foundation for orthogonal verification rests on reducing measurement uncertainty and bias. According to the National Institute of Standards and Technology (NIST), combining orthogonal analytical techniques is recommended to reduce both "the risk of measurement bias and the uncertainty in decision-making during product development" [76]. This approach is particularly valuable for complex measurement problems in pharmaceutical development and biological research, where single-method approaches may contain unrecognized systematic errors.
Implementing Orthogonal Strategies: Key Applications
Antibody Validation
In protein detection research, orthogonal validation has become a cornerstone of rigorous antibody validation. The approach involves comparing antibody-based results with data generated through antibody-independent methods [78].
Case Example: Nectin-2/CD112 Antibody Validation
- Primary Method: Western blot analysis using Nectin-2/CD112 (D8D3F) antibody
- Orthogonal Corroboration: RNA expression data from Human Protein Atlas
- Implementation: Researchers selected cell lines with high (RT4, MCF7) and low (HDLM-2, MOLT-4) Nectin-2 RNA expression based on the orthogonal database, then confirmed that western blot results consistently matched the RNA expression patterns [78]
- Outcome: Specificity of the antibody for western blot was confirmed, demonstrating how orthogonal data guides experimental design and validation
Viral Vector Characterization for Gene Therapy
Characterization of adeno-associated virus (AAV) vectors for gene therapy represents a sophisticated application of orthogonal methodologies. Different analytical techniques provide varying resolution of full, partial, and empty capsids, which directly impacts therapeutic efficacy [81].
Table 1: Orthogonal Methods for AAV Vector Characterization
| Method | Measurement Principle | Key Output | Strengths |
|---|---|---|---|
| Quantitative TEM (QuTEM) [81] | Electron microscopy with internal density measurement | Direct visualization and quantification of capsid populations | Preserves structural integrity; superior granularity |
| Sedimentation Velocity Analytical Ultracentrifugation (SV-AUC) [81] | Separation by sedimentation coefficients | Quantification based on size, shape, and density | Label-free; provides quantitative purity data |
| Mass Photometry (MP) [81] | Light displacement by individual particles | Real-time size and mass measurements | Label-free; requires minimal sample preparation |
| SEC-HPLC [81] | Size-based separation | Retention time profiles of different capsid types | High throughput; compatible with standard HPLC systems |
Genomic Newborn Screening
The Early Check genomic newborn screening program demonstrates orthogonal verification in a clinical context. In this program, genomic sequencing identified potentially pathogenic variants in newborns, which required confirmation through additional testing modalities [80].
Workflow Example:
- Primary Screening: Genome sequencing of 169 high-actionability genes from dried blood spots
- Orthogonal Confirmation: Follow-up molecular testing and clinical examinations
- Findings: Of 50 screen-positive newborns, additional testing confirmed true positives and identified phenotypic false positives, such as an MITF variant associated with melanoma risk that was initially detected due to its association with a different condition [80]
High-Throughput Phenotyping in Plant Research
A phenotype-directed chemical screening in Arabidopsis thaliana employed orthogonal image analysis approaches to quantify seedling growth differences between wild-type and DNA repair mutant (mus81) plants [20].
Dual Orthogonal Analysis Strategy:
- Approach 1: Convolutional neural network (CNN)-based image classification into normal or altered growth categories
- Approach 2: Image segmentation and pixel-level quantification of roots and aerial plant structures
- Implementation: Both approaches were applied to the same image sets, providing independent verification of chemical effects on plant growth [20]
- Result: Enabled accurate identification of genotype-specific chemical effects while minimizing false positives from single-method approaches
Detailed Experimental Protocols
Protocol: Orthogonal Antibody Validation for Western Blot
This protocol outlines the procedure for validating antibody specificity in western blot using orthogonal RNA expression data [78].
Materials:
- Candidate antibody for validation
- Cell lines with documented RNA expression levels (from public databases such as Human Protein Atlas)
- Western blot equipment and reagents
- RNA extraction and qPCR reagents (optional)
Procedure:
- Consult Orthogonal Data Source: Access the Human Protein Atlas or similar database to identify cell lines with high and low expression of your target gene at the RNA level
- Select Binary Model System: Choose at least two cell lines with high RNA expression and two with low/no RNA expression of your target
- Prepare Protein Extracts: Culture selected cell lines and prepare protein extracts using standard lysis protocols
- Perform Western Blot: Run western blot according to standard protocols using your candidate antibody
- Compare Results: Assess whether protein detection patterns match RNA expression patterns:
- Strong signal in high RNA expression cell lines
- Weak/absent signal in low RNA expression cell lines
- Interpret Results: Consistent correlation between RNA and protein detection validates antibody specificity for western blot
Troubleshooting Notes:
- If results don't correlate, investigate potential post-transcriptional regulation or consider alternative validation methods
- Application-specific validation is crucial—validation for western blot does not guarantee performance in other applications like immunohistochemistry
Protocol: Bacterial HTS Assay with Orthogonal Validation for Pharmacological Chaperone Screening
This protocol describes a robust high-throughput screening assay for identifying pharmacological chaperones targeting mutant enzymes, with built-in orthogonal validation metrics [21].
Materials:
- Escherichia coli BL21(DE3) expression system
- Human HGD gene variants (e.g., HGDG161R)
- 96-well or 384-well microtiter plates
- Homogentisic acid substrate
- Spectrophotometer or plate reader capable of measuring 330nm
- Compound library for screening
Procedure: Part A: Primary Enzyme Activity Screening
- Expression Optimization: Express human HGD variants in E. coli under optimized conditions
- Enzyme Reaction Setup: In 96-well plates, combine:
- Cell lysates containing expressed HGD variants
- Homogentisic acid substrate (1mM final concentration)
- Test compounds from screening library
- Reaction Monitoring: Incubate at 37°C and monitor formation of maleylacetoacetate product by absorbance at 330nm
- Initial Hit Selection: Identify compounds showing at least 3-fold increase in catalytic activity compared to untreated controls
Part B: Orthogonal Validation of Hits
- Dose-Response Analysis: For initial hits, repeat activity measurements across a concentration series (e.g., 0-250μM)
- Structural Confirmation: Perform molecular docking studies to confirm binding at proposed stabilization sites
- Counter-Screening: Test compounds against unrelated enzyme targets to exclude non-specific activators
- Cellular Validation: Move validated hits to cell-based assays to confirm activity in physiological environments
Quality Control Metrics:
- Z'-factor: Calculate using positive and negative controls; values >0.4 indicate robust assay [21]
- Signal Window: Should exceed 2 for reliable discrimination between active and inactive compounds
- Reproducibility: Coefficient of variation should be <10% across replicate wells
Protocol: Orthogonal Assessment of AAV Capsid Populations
This protocol details the orthogonal characterization of adeno-associated virus (AAV) vector preparations using multiple analytical techniques [81].
Materials:
- Purified AAV vector preparations
- Transmission electron microscope with negative staining capability
- Analytical ultracentrifugation system
- Mass photometry instrument
- SEC-HPLC system with appropriate columns
Procedure: Part A: Quantitative Transmission Electron Microscopy (QuTEM)
- Sample Preparation: Apply AAV samples to glow-discharged grids and negative stain
- Image Acquisition: Collect micrographs at appropriate magnification to visualize individual capsids
- Particle Analysis:
- Use ellipse detection algorithms to identify capsids
- Measure internal grayscales of each particle
- Normalize background to correct for ice thickness variations
- Population Quantification: Classify particles as full, partial, or empty based on internal density measurements
Part B: Orthogonal Method Comparison
- Sedimentation Velocity Analytical Ultracentrifugation (SV-AUC):
- Load samples into centerpiece cells
- Run at appropriate speed and temperature
- Monitor sedimentation using absorbance or interference optics
- Analyze data to resolve different capsid populations based on sedimentation coefficients
Mass Photometry:
- Dilute samples to appropriate concentration for single-particle analysis
- Measure light displacement as particles diffuse through laser beam
- Correlate signal with molecular mass to distinguish capsid types
Data Integration: Compare population distributions obtained from all methods to generate comprehensive capsid composition profile
Validation Criteria:
- High concordance (>80%) between QuTEM and orthogonal methods
- Clear resolution of full, partial, and empty capsid populations
- Reproducible results across multiple production batches
The Scientist's Toolkit: Essential Research Reagents and Solutions
Table 2: Key Research Reagents for Orthogonal Assay Development
| Reagent/Technology | Function in Orthogonal Assays | Example Applications |
|---|---|---|
| Convolutional Neural Networks (CNNs) [20] | Machine learning-based image analysis for phenotypic quantification | High-throughput plant phenotyping; automated image classification and segmentation |
| Mass Spectrometry [78] | Antibody-independent protein identification and quantification | Orthogonal antibody validation; proteomic correlation with immunohistochemistry |
| RNA Expression Databases (e.g., Human Protein Atlas) [78] | Provide independent gene expression data for correlation studies | Binary validation models for antibody specificity; cell line selection for assay development |
| Sedimentation Velocity Analytical Ultracentrifugation [81] | Separation of biomolecules based on hydrodynamic properties | AAV capsid characterization; protein complex analysis |
| Quantitative TEM [81] | Direct visualization and quantification of nanoparticle structures | Viral vector quality control; nanopharmaceutical characterization |
| Transcreener ADP² Assay [79] | Universal biochemical detection for multiple enzyme classes | Kinase, ATPase, GTPase inhibitor screening; target engagement studies |
Data Analysis and Interpretation
Quantitative Metrics for Assay Quality Assessment
Robust orthogonal verification requires rigorous quality metrics to ensure both primary and secondary assays meet quality standards:
Table 3: Key Quality Metrics for Orthogonal Assay Validation
| Metric | Calculation | Target Value | Interpretation |
|---|---|---|---|
| Z'-factor [21] [79] | 1 - (3σpositive + 3σnegative)/|μpositive - μnegative| | 0.5 - 1.0 | Excellent assay robustness and reproducibility |
| Signal-to-Noise Ratio [79] | SignalMean / NoiseStandardDeviation | >2 | Sufficient discrimination between positive and negative controls |
| Coefficient of Variation [79] | (Standard Deviation / Mean) × 100 | <10% | Acceptable well-to-well variability |
| Dynamic Range [79] | Ratio between maximum and minimum reliable signals | As large as possible | Ability to distinguish active from inactive compounds |
Statistical Approaches for Orthogonal Data Integration
Effective integration of orthogonal data requires appropriate statistical methods:
- Correlation Analysis: Calculate Pearson or Spearman correlation coefficients between results from different methods
- Bland-Altman Analysis: Assess agreement between two quantitative measurement methods
- ROC Curve Analysis: Evaluate the ability of orthogonal methods to classify true positives versus false positives
- Multivariate Modeling: Incorporate data from multiple orthogonal methods to build predictive models of compound efficacy or toxicity
Orthogonal assays represent a fundamental component of rigorous scientific research, particularly in high-throughput phenotyping and drug discovery where the consequences of false results are substantial. By implementing the protocols and frameworks outlined in this application note, researchers can significantly enhance the reliability of their findings, minimize both false positives and false negatives, and accelerate the development of robust therapeutic candidates.
The future of orthogonal verification will likely see increased integration of artificial intelligence and machine learning approaches, with algorithms capable of designing optimal orthogonal strategies based on target characteristics and potential interference patterns [20]. Additionally, as novel therapeutic modalities continue to emerge—from cell therapies to complex nanopharmaceuticals—the development of new orthogonal methods will be essential to address evolving characterization challenges [76] [77].
By adopting a systematic approach to orthogonal verification, researchers can navigate the complexities of modern biological screening with greater confidence, ultimately delivering more reliable and reproducible scientific outcomes.
In high-throughput phenotyping robustness screening, the reliability of experimental outcomes hinges on two fundamental pillars: the appropriate selection of cell lines and the meticulous management of reagent stability. Assay development represents a critical process in biopharmaceutical development, encompassing the creation of stable, high-quality systems used for manufacturing therapeutic proteins and functional analysis [82]. When designing cell-based High-Throughput Screening (HTS) for drug discovery, researchers must balance scalability with biological relevance to enable rapid screening of large compound libraries while providing valuable information on cell viability, gene expression, and protein activity [83]. This application note details best practices framed within the context of a broader thesis on high-throughput phenotyping robustness screening research, providing detailed methodologies and structured data to enhance assay reproducibility and predictive value.
Core Principles of Cell Line Selection
Choosing the appropriate cellular model is arguably the most critical decision in assay development, as it fundamentally determines the biological relevance and translational potential of your screening data.
Cell Model Categories and Applications
Table 1: Cell Model Selection Guide for Phenotypic Screening
| Cell Model | Key Characteristics | Best Applications | Stability Considerations | Throughput Compatibility |
|---|---|---|---|---|
| Primary Cells | Best for reflecting physiological states; significant batch-to-batch variability [83] | Target validation, translational research; immune, epithelial, pulmonary studies [84] | Limited availability; significant batch variability [83] | Medium; requires careful experimental design to manage variability |
| Cell Lines | Offer stability but may undergo genotypic/phenotypic drift over time [83] | Primary screening, mechanism of action studies [83] | Require careful documentation of passage number and culture conditions [84] | High; consistent performance across large screens |
| Engineered Reporter Lines | Use reporter systems for real-time monitoring; require verification for no mutations or off-target effects [83] [85] | Pathway-specific screening, mechanism of action classification [85] | Require validation to ensure reporter stability and genetic integrity | High; enable multiplexed readouts in live-cell formats |
Systematic Approach to Cell Line Selection
The process of selecting optimal reporter cell lines for annotating compound libraries (ORACLs) involves analytical criteria to identify reporters whose phenotypic profiles most accurately classify training drugs across multiple drug classes [85]. This systematic approach ensures the selected cell line provides maximum discriminatory power for your specific screening goals.
Experience is key in developing optimal cell-based assays. Researchers must know their cells and follow their appearance during culture, as each cell line and cell type is unique [84]. Appropriate media, supplements and serum selection for each cell line/primary cell type must be taken into account, along with growth rate and passage number [84]. Documentation of cell line history, including source, purity, cell banking, passage number and culture conditions, is essential for ensuring excellent data quality and reproducibility [84].
Reagent Stability and Assay Optimization
Reagent stability directly impacts assay performance metrics and must be systematically managed throughout the screening workflow.
Key Stability Parameters and Quality Control
Table 2: Reagent Stability Considerations and Quality Control Measures
| Reagent Category | Key Stability Factors | Optimal Handling Practices | QC Assessment Methods |
|---|---|---|---|
| Cell Culture Media | Formulation, shelf life, storage conditions, light sensitivity [84] | Select growth-appropriate media; consistent sourcing; proper storage [83] [84] | pH monitoring, performance validation with control cells |
| Serum & Supplements | Lot-to-lot variability, freeze-thaw cycles, bacterial contamination [84] | Human, bovine, or serum-free selection based on cell type; aliquoting to minimize freeze-thaw [84] | Growth promotion testing, mycoplasma screening [84] |
| Detection Reagents | Fluorescent dye photostability, enzyme substrate integrity, conjugate stability [83] | Protection from light, proper aliquoting, adherence to storage temperature | Signal-to-noise validation, Z'-factor monitoring [83] |
| Compound Libraries | Solvent compatibility, DMSO concentration, freeze-thaw stability [83] | DMSO cytotoxicity control; proper storage temperature; limited freeze-thaw cycles [83] | Regular re-testing of control compounds, precipitation checks |
Quantitative Assessment of Assay Performance
Robust assay development requires quantitative metrics to ensure reliability and reproducibility throughout the screening process.
Table 3: Key Performance Metrics for High-Throughput Screening Assays
| Performance Metric | Calculation/Definition | Optimal Range | Application in Quality Control |
|---|---|---|---|
| Z'-factor | Z' = 1 - (3σ₊ + 3σ₋)/|μ₊ - μ₋| [83] | 0.5-1.0 (excellent assay) [86] | Assesses assay robustness and suitability for HTS [83] |
| Signal-to-Noise Ratio | S/N = (μₛ - μₙ)/σₙ | >3:1 | Measures assay sensitivity and detection window |
| Coefficient of Variation (CV) | CV = (σ/μ) × 100% | <10-15% | Evaluates well-to-well and plate-to-plate consistency [86] |
| Dynamic Range | DR = μₘₐₓ - μₘᵢₙ | 5-10 fold | Determines ability to distinguish active vs. inactive compounds [86] |
Experimental Protocols for Robustness Assessment
Protocol: Comprehensive Cell-Based Assay Development
Objective: Establish a robust, reproducible cell-based assay system for high-throughput phenotypic screening.
Materials:
- Cell lines: Selected based on Table 1 guidelines
- Culture media: Optimized for specific cell type [84]
- Microplates: 96-, 384-, or 1536-well plates appropriate for throughput needs [83]
- Detection reagents: Validated for stability and performance [83]
- Compound libraries: Properly stored and validated [86]
Procedure:
- Cell Culture Optimization
- Systematically examine growth condition parameters including choice of culture medium, seed density per well, and type of microtiter plate [20].
- For adherent cells, ensure 75-80% confluence in T75 cm² tissue culture flasks using appropriate media [87].
- Document cell line history, including source, purity, cell banking, and passage number [84].
Assay Plate Preparation
- Select appropriate plate format based on throughput requirements and imaging needs. For high-content screening, clear-bottom plates are recommended [83].
- Optimize cell seeding density to ensure consistent and uniform number of cells across wells, reducing data variability [83].
- Include appropriate controls: positive (e.g., MMC for growth alteration), negative (e.g., DMSO), and blank controls evenly distributed across the plate [20].
Compound Treatment and Incubation
Detection and Signal Measurement
- Add detection reagents specific for screening purpose (fluorescent, luminescent or colorimetric substrates) [83].
- Use detection instruments for high-throughput screening (multi-mode plate readers, plate-based imaging systems, high-content analyzers) [83].
- For high-content imaging, capture multiple fields per well and extract multiparametric data [85].
Data Analysis and Quality Control
- Normalize raw data and calculate Z'-factor for quality control of the assay [83].
- Identify preliminary active compounds ("hits") through statistical analysis [83].
- Perform hit confirmation through replicate experiments or secondary screening to confirm activity and specificity, eliminating false positives [83].
Protocol: Reagent Stability Validation
Objective: Systematically evaluate and validate reagent stability to ensure assay reproducibility.
Materials:
- Test reagents: Media, serum, detection compounds, critical assay components
- QC cells: Stable control cell line with consistent response
- Detection systems: Appropriate plate readers or imagers
Procedure:
- Baseline Establishment
- Prepare fresh reagents and test using QC cells to establish baseline performance.
- Calculate initial Z'-factor, signal-to-noise ratio, and dynamic range [86].
Stability Monitoring
- Store reagents under recommended conditions and test at predetermined intervals (e.g., 0, 7, 14, 30 days).
- Compare performance metrics to baseline values.
- Establish acceptance criteria for each reagent type (e.g., <20% signal degradation).
Stress Testing
- Expose reagents to suboptimal conditions (temperature fluctuations, multiple freeze-thaw cycles, extended light exposure) to establish stability boundaries.
- Document failure points to inform handling procedures.
Documentation and Lot Tracking
- Maintain detailed records of reagent lots, storage conditions, and expiration dates.
- Establish a system for qualifying new reagent lots before use in screening.
Visualization of Experimental Workflows
High-Throughput Screening Workflow
Cell Line Selection Decision Pathway
The Scientist's Toolkit: Essential Research Reagents
Table 4: Key Research Reagent Solutions for Robust Phenotypic Screening
| Reagent Category | Specific Examples | Function | Stability Considerations |
|---|---|---|---|
| Cell Culture Media | RPMI 1640, DMEM, Hams F-12, MEM, McCoys, IMDM, Leibovitz's L-15 [84] | Provide nutrients and environment for cell growth and maintenance | Select growth-appropriate media; ensure reagent stability [83] |
| Serum & Supplements | Fetal Bovine Serum, Human Serum, Serum-Free Formulations [84] | Supply growth factors, hormones, and attachment factors | Control lot-to-lot variability; implement rigorous QC testing [84] |
| Detection Reagents | Cell Titer Blue, MTT, Calcein-AM, Propidium Iodide, BFC [88] [87] | Measure cell viability, apoptosis, and metabolic activity | Protect from light; aliquot to avoid freeze-thaw cycles; validate stability [83] |
| Compound Solvents | DMSO, Ethanol, Buffer Solutions [83] | Dissolve and deliver screening compounds | Control DMSO cytotoxicity; ensure proper concentration [83] |
| Fixation & Staining | Paraformaldehyde, Methanol, Fluorescent Antibodies [85] | Preserve cellular structures and enable detection | Optimize concentration and storage conditions; validate signal preservation |
| Reporter System Components | pSeg plasmid, CD-tagged constructs, Fluorescent proteins [85] | Enable live-cell imaging and pathway monitoring | Verify genetic stability; monitor reporter expression over passages [85] |
Implementing systematic approaches to cell line selection and reagent stability management is fundamental to successful high-throughput phenotyping robustness screening. By adhering to the detailed protocols, quantitative assessment metrics, and validation procedures outlined in this application note, researchers can significantly enhance the reliability, reproducibility, and predictive power of their screening campaigns. The integration of robust experimental design with rigorous quality control measures provides a solid foundation for advancing drug discovery through more physiologically relevant and technically sound screening approaches.
The robustness of high-throughput phenotyping (HTP) in drug development and agricultural research hinges on the precise optimization of fundamental experimental parameters. Incubation time, temperature, and detection parameters form the critical triad that dictates the success of phenotypic screenings, influencing everything from assay sensitivity to data reproducibility. Within high-throughput phenotyping robustness screening research, controlling these variables is paramount for accurately distinguishing subtle phenotypic differences, such as disease resistance in plants or drug response in cancer models [89] [90]. This protocol outlines detailed methodologies and application notes for optimizing these core conditions, leveraging insights from recent advances in statistical modeling and automated phenotyping platforms to enhance screening accuracy and efficiency.
The following tables consolidate key quantitative findings and parameters from recent studies relevant to optimizing high-throughput phenotyping assays.
Table 1: Optimized Experimental Parameters from Recent Phenotyping Studies
| Study Focus | Optimal Incubation Time | Optimal Temperature | Key Detection Parameters | Reported Performance/Accuracy |
|---|---|---|---|---|
| Plant Hypersensitive Reaction Detection [89] | Monitoring until cotyledon loss (temporal frame rate not specified) | Not specified | Sensor: Low-cost depth imaging; Feature: Spatial drop in depth | Accuracy: 97%; Throughput: 30x faster than human annotation |
| Barley Harvest Trait Prediction [90] | Daily phenotyping from planting until maturity (126 DAT); Early-stage data (stem elongation) sufficient for prediction | Growth: 22 ± 3 °C (Day) / 17 ± 2 °C (Night) | Sensors: RGB, Thermal IR, Chlorophyll Fluorescence, Hyperspectral; Key Traits: Canopy temperature, RGB plant size | Prediction R²: 0.97 (Biomass), 0.93 (Spike weight); Classification Accuracy: ≥0.97 (Drought) |
| IO Drug Screening (TumorGraft3D) [91] | Not specified | Not specified | Technology: High-throughput flow cytometry; Markers: CD69, PD-1, TIM-3, CTLA-4, apoptosis markers | Reliable detection of phenotypic profiles and T-cell activation |
Table 2: Design of Experiments (DoE) for Systematic Optimization
| Aspect | Recommended DoE Approach | Application Example | Reported Benefit |
|---|---|---|---|
| Initial Screening | Fractional Factorial Design | Enzyme Assay Optimization (e.g., Human Rhinovirus-3C Protease) [92] | Identifies significant factors from many variables rapidly. |
| Response Optimization | Response Surface Methodology (RSM) | Enzyme Assay Optimization [92] | Maps the relationship between factors and responses to find optimum conditions. |
| Iterative Refinement | Interactive DoE (IDoE) with Deep Learning Inversion [93] | Cooling System Optimization | Guides iterative optimization focusing on regions of interest in parameter space. |
Detailed Experimental Protocols
Protocol for High-Throughput Detection of a Hypersensitive Reaction in Plants
This protocol uses low-cost depth imaging sensors to automate the detection of a hypersensitive reaction involving cotyledon loss, a key robustness screen for disease resistance [89].
1. Plant Material and Growth Conditions:
- Prepare batches of plants segregating for resistance and susceptibility.
- Maintain plants under controlled environmental conditions (light, temperature, humidity) appropriate for the species until the assay.
2. Pathogen Inoculation:
- Inoculate batches of plants with the pathogen of interest using a standardized method (e.g., spray, injection).
- Include appropriate control batches (e.g., mock-inoculated).
3. Incubation and Image Acquisition:
- Incubation Conditions: Incubate plants under conditions conducive to disease development and the hypersensitive response. The specific time, temperature, and humidity are pathosystem-dependent.
- Image Acquisition Setup: Position a low-cost depth imaging sensor (e.g., Intel RealSense, Microsoft Kinect) above or to the side of the plant batches.
- Data Collection: Acquire depth images at a high temporal frame rate for the duration of the experiment, which spans from inoculation until after the expected time of cotyledon loss.
4. Feature Extraction and Analysis:
- Data Processing: Process the spatiotemporal depth image data to extract features. The key feature is a spatial drop in depth values indicating cotyledon abscission.
- Feature Space: Construct a simple spatiotemporal feature space as described [89].
- Classification: Use a pre-trained classification model (e.g., a machine learning classifier) to discriminate between resistant (cotyledon loss) and susceptible (no loss) batches based on the extracted features.
Protocol for Multi-Sensor High-Throughput Phenotyping for Drought Resilience
This protocol details the use of multi-sensor imaging to predict harvest-related traits in barley under drought stress, a key robustness screen for abiotic stress tolerance [90].
1. Plant Material and Growth Conditions:
- Plant Lines: Select genetically distinct lines, including elite cultivars and population-derived lines.
- Experimental Design: Employ a split-plot or randomized complete block design. Use a sufficient number of biological replicates (e.g., 9-20 per line and treatment).
- Growth Environment: Grow plants in a greenhouse with controlled day/night temperatures (e.g., 22/17 °C) and relative humidity (e.g., 51/62%). Use a long photoperiod (e.g., 16 hours).
2. Drought Stress Treatment:
- Watering Regime: For the control group, maintain soil relative water content (SRWC) at optimal levels (e.g., well-watered). For the drought stress group, impose progressive drought by reducing watering at a specific developmental stage (e.g., tillering, 24 DAT) and maintaining a low SRWC (e.g., 25%, then 20% post-flowering).
3. High-Throughput Phenotyping Data Acquisition:
- Incubation and Scheduling: Phenotype plants daily throughout their life cycle using an automated platform (e.g., PlantScreen). Randomize plant positions daily to minimize environmental bias.
- Sensor Suite and Parameters:
- RGB Imaging: Capture morphological traits (e.g., plant area, projected leaf area).
- Thermal Infrared Imaging: Measure canopy temperature to calculate canopy temperature depression (CTD).
- Chlorophyll Fluorescence Imaging: Assess photosynthetic performance. Implement multiple protocols (e.g., morning light-adapted QY under high and low light; evening dark-adapted kinetics under high and conditional light).
- Hyperspectral Imaging: Capture spectral signatures related to physiological and biochemical status.
4. Data Analysis and Model Building:
- Trait Extraction: Extract temporal traits from all sensor data for each plant.
- Classification Model: Use a machine learning model (e.g., Random Forest) to classify plants as drought-stressed or well-watered, using features like early-stage CTD and late-stage plant size.
- Regression Model: Use a regression model (e.g., LASSO, Random Forest) to predict harvest-related traits (e.g., total biomass dry weight, spike weight) from the temporal phenomic data.
Protocol for Optimization Using Design of Experiments (DoE)
This general protocol can be applied to optimize assay conditions, such as those for enzyme activity, where multiple factors (e.g., buffer, pH, ion concentration, enzyme/substrate concentration, time, temperature) interact [92].
1. Define Objective and Factors:
- Clearly state the optimization goal (e.g., maximize enzyme velocity, minimize background).
- Select the factors (variables) to be investigated and their respective high and low levels.
2. Initial Screening with Fractional Factorial Design:
- Design: Use a fractional factorial design (e.g., a resolution IV design) to screen a large number of factors with a minimal number of experimental runs. This identifies which factors have significant effects on the response.
- Execution: Perform the experiments according to the design matrix.
- Analysis: Analyze the data using statistical software to identify significant main effects and interactions.
3. Response Optimization with Response Surface Methodology (RSM):
- Design: For the significant factors (typically 2-4), design a RSM experiment (e.g., Central Composite Design) to model the curved response surface.
- Execution: Perform the experiments according to the RSM design.
- Analysis: Fit a quadratic model to the data and locate the optimum conditions (maximum, minimum, or target) using contour plots and numerical optimization.
4. Verification:
- Conduct verification experiments at the predicted optimum conditions to confirm the model's accuracy.
The Scientist's Toolkit: Research Reagent Solutions
Table 3: Essential Materials for High-Throughput Phenotyping Robustness Screening
| Item / Reagent | Function / Application | Specific Examples / Notes |
|---|---|---|
| Low-Cost Depth Sensor | Automated, non-destructive 3D monitoring of morphological changes like cotyledon loss. | Intel RealSense, Microsoft Kinect; used for hypersensitive reaction detection [89]. |
| Multi-Sensor Phenotyping Platform | Integrated acquisition of morphological, physiological, and spectral data. | PlantScreen system with RGB, Thermal IR, Chlorophyll Fluorescence, and Hyperspectral imagers [90]. |
| High-Throughput Flow Cytometry | Multiparametric cell phenotyping and drug screening in co-culture systems. | Used in TumorGraft3D platforms to detect surface/intracellular markers (CD69, PD-1) and apoptosis [91]. |
| Laplacian-P-Splines (LPS) Software | Flexible Bayesian semiparametric estimation of distributions from coarse data (e.g., interval-censored incubation times). | Implemented in R packages like EpiLPS; alternative to classic parametric methods [94]. |
| Design of Experiments (DoE) Software | Statistical planning and analysis of optimization experiments to efficiently map multi-factor parameter spaces. | JMP, Minitab, R; used for fractional factorial and response surface methodology designs [92]. |
In high-throughput phenotyping robustness screening, the integrity of experimental data is paramount. A well-designed plate layout is not merely an organizational tool; it is a critical foundation for controlling experimental variability, ensuring accurate hit identification, and validating screening outcomes. Proper placement of controls and systematic arrangement of samples mitigate confounding factors such as edge effects and spatial drift, which are common challenges in high-throughput screening (HTS) platforms [95]. This application note details the principles and protocols for optimizing plate layouts to enhance data quality and reliability in high-content phenotypic screens, providing researchers with actionable methodologies to strengthen their experimental designs.
The Critical Role of Controls and Plate Design
Fundamental Principles of Control Placement
Controls serve as the benchmark for interpreting assay performance and identifying biologically significant hits. Their strategic placement across the plate is crucial for normalizing data and accounting for spatial variations. In a differential chemical genetic screen on Arabidopsis thaliana, the plate layout incorporated internal positive (e.g., Mitomycin C) and negative controls (e.g., DMSO) to mimic altered growth and healthy seedling phenotypes, respectively [20]. These controls were systematically arranged to facilitate a robust comparison between wild-type and DNA repair mutant (mus81) genotypes, enabling the identification of genotype-specific chemical regulators [20].
Understanding and Mitigating Spatial Variability
Spatial variability in microtiter plates can manifest as edge effects (systematic differences in outer wells) and drift (gradual changes across the plate), often caused by uneven evaporation, temperature gradients, or reagent settling [95]. A Plate Uniformity Assessment is specifically designed to address these sources of variation. The general acceptance criterion for such effects is typically less than 20% deviation, which is considered acceptable for most HTS applications [95]. Beyond this threshold, experimental adjustments are necessary to ensure data validity.
Quantitative Assessment of Plate Quality
Robust HTS assays require quantitative metrics to evaluate performance. The table below summarizes key quality parameters used to validate plate-based screens, drawing from concrete examples in the literature.
Table 1: Key Quality Assessment Parameters for High-Throughput Screens
| Parameter | Description | Acceptance Criterion | Reported Value |
|---|---|---|---|
| Z' Factor [96] [95] | Assesses the assay's dynamic range and data variation; critical for hit detection. | Z' > 0.5 indicates an excellent assay [95]. | Z' > 0.4 was the minimum acceptance criterion in an HGD enzyme activity screen; specific screens achieved Z' > 0.5 [96] [95]. |
| Single Window Value [96] | Another metric for assay quality and hit detection capability. | Single Window > 2 [96]. | Passed the minimum acceptance criterion of > 2 in an HGD enzyme activity screen [96]. |
| Plate Uniformity [95] | Evaluates drift and edge effects across the plate. | Drift or Edge Effects < 20% are considered acceptable [95]. | A screen for HGD missense variants investigated and optimized signal and spatial uniformity [96]. |
| Signal Variability [96] | Measures consistency of the readout across the plate. | Low variability is required for a robust screen. | Optimized in a bacterial HTS system for evaluating HGD SNPs [96]. |
Experimental Protocols for Plate Layout Validation
Protocol: Plate Uniformity Assessment
This protocol is designed to diagnose spatial artifacts and is a prerequisite before any production screen [95].
- Plate Setup: Seed cells or prepare the assay reaction across one or multiple entire plates using a homogeneous control sample (e.g., negative control cells or a standardized reagent mixture).
- Assay Execution: Process and develop the plates according to the standard assay protocol.
- Data Analysis: Measure the primary readout (e.g., fluorescence, absorbance, cell count) for every well.
- Visualization and Calculation: Create a heat map of the raw data to visually inspect for patterns (e.g., gradients, strong edge effects). Calculate the percentage of drift or edge effect using the formula:
((Max Signal - Min Signal) / Average Signal) * 100%. - Interpretation: A result of < 20% is generally acceptable. If the value exceeds this threshold, consider countermeasures such as using only interior wells, adjusting incubation conditions, or modifying liquid handling procedures [95].
Protocol: Replicate Experiment for Final Assay Validation
This "dry run" validates the entire HTS procedure immediately before the production screen [95].
- Plate Design: Prepare a set of plates that include all intended controls, such as positive controls (e.g., a known inhibitor or cells with a defined phenotype) and negative controls (e.g., non-targeting siRNA or DMSO-treated cells). These controls should be replicated across the plate in a predefined layout.
- Screen Execution: Run the assay using the fully automated HTS protocol.
- Z' Factor Calculation: For each plate, calculate the Z' factor using the positive and negative control wells with the formula:
Z' = 1 - [3*(σp + σn) / |μp - μn|]whereσpandσnare the standard deviations of the positive and negative controls, andμpandμnare their respective means [95]. - Decision Point: A Z' Factor > 0.5 indicates a robust assay with a sufficient dynamic range for hit identification. The screen should not proceed to production until this threshold is met [95].
Advanced Strategy: The Virtual Plate Concept
High-content screens are prone to technical failures in individual wells or entire plates due to factors like reagent handling errors or instrument malfunction. The Virtual Plate concept provides an automated solution for data rescue and analysis [97]. This method involves collating selected wells (e.g., compound wells that passed quality checks) from different physical plates into a new, unified virtual plate. This allows researchers to salvage valuable data from otherwise failed runs and to consolidate all putative hit wells into a single plate for easier downstream analysis and visualization, significantly improving the efficiency of hit selection [97].
The Scientist's Toolkit: Essential Research Reagent Solutions
The following table lists key materials and reagents critical for successful high-throughput screening, as evidenced by the reviewed studies.
Table 2: Key Research Reagent Solutions for High-Throughput Screening
| Item | Function/Application |
|---|---|
| Microtiter Plates (24-well) | Used in a phenotype-directed chemical screen in plants; chosen over 96-well format for improved seedling growth and easier image acquisition [20]. |
| Liquid Handling Robot (e.g., Janus) | Automates precise liquid transfers (e.g., reagents, siRNAs) in 96- or 384-well formats, ensuring consistency and reproducibility in large-scale screens [95]. |
| Validated siRNA Library | A core reagent for loss-of-function (LOF) and synthetic lethal RNAi screens to identify genes involved in specific disease pathways [95]. |
| Validated Small-Molecule Library (e.g., Prestwick) | Used in chemical genetic screens to identify compounds that induce specific phenotypes, such as genotype-specific growth effects [20]. |
| Control Reagents (DMSO, MMC) | Dimethyl sulfoxide (DMSO) serves as a vehicle/negative control. Mitomycin C (MMC) is a genotoxic agent used as a positive control for inducing altered growth in DNA repair mutants [20]. |
| Optimized Transfection Reagent | Critical for achieving high knock-down efficiency in RNAi screens; requires careful optimization for each cell line to minimize toxicity and maximize efficacy [95]. |
| Cell Viability Assay Kits | Used to measure phenotypic changes in uniform well readouts and to confirm the absence of significant non-specific toxicity from control siRNAs (<20% reduction in viability) [95]. |
Workflow and Logical Relationships
The following diagram illustrates the key decision points and workflow for establishing a robust plate layout, integrating the concepts and protocols discussed in this note.
Diagram 1: Workflow for robust plate layout validation.
Compound interference poses a significant challenge in high-throughput screening (HTS) and high-content screening (HCS), potentially compromising data quality and leading to false positive or negative results [98]. These interference mechanisms can be broadly categorized into technology-related artifacts, such as autofluorescence and quenching, and non-technology-related biological effects, primarily cytotoxicity and altered cell morphology [98]. Within the context of high-throughput phenotyping robustness screening, distinguishing true biological activity from these confounding artifacts is paramount for identifying valid chemical probes and therapeutic candidates. This application note provides a structured framework for detecting, quantifying, and mitigating compound interference, with a specific focus on solubility and cytotoxicity issues, to enhance the reliability of screening data.
Understanding Compound Interference
Technology-Related Interference
Technology-related interference occurs when compounds directly interfere with the detection technology independent of any biological effect. The major types include:
- Autofluorescence: Compounds that naturally fluoresce can elevate background signals or produce false positive readouts, particularly in fluorescent-based assays [98]. This interference is highly dependent on the spectral overlap between the compound and the detection probes.
- Fluorescence Quenching: Some compounds can absorb emission light or otherwise quench the fluorescence of detection dyes, leading to false negative results by suppressing legitimate signals [98].
- Optical Interference: Colored (pigmented) compounds, insoluble precipitates, and compounds that alter light transmission or reflection can physically interfere with image acquisition and analysis in HCS [98].
Biology-Related Interference (Cytotoxicity)
Non-technology-related interference often manifests as unintended cytotoxicity or dramatic changes in cell morphology that confound the interpretation of targeted phenotypic readouts [98]. Compound-mediated cytotoxicity can obscure genuine activity at the target of interest and may be misinterpreted as a positive hit in certain assay configurations. Undesirable mechanisms driving cytotoxicity include nonspecific chemical reactivity, colloidal aggregation, redox-cycling, and pathway-specific toxins affecting organelles such as lysosomes, mitochondria, or the cytoskeleton [98]. In high-throughput phenotyping screens, distinguishing targeted phenotype modulation from generalized cell death is essential for accurate data interpretation.
Detection and Quantification of Interference
Statistical Identification of Interference
Statistical analysis of screening data serves as the first line of defense for identifying compound interference. Compounds exhibiting autofluorescence, quenching, or cytotoxicity often produce measurement values that are statistical outliers relative to the distribution of values from control wells or optically inert compounds [98]. Key parameters to monitor include:
- Fluorescence Intensity: Significant deviations from the population distribution may indicate autofluorescence or quenching.
- Nuclear Counts: Substantial reduction in cell number relative to controls is a primary indicator of cytotoxicity or compound-induced cell loss [98].
- Morphological Parameters: Dramatic alterations in cell shape, spreading, or attachment can be quantified through multiparameter image analysis and flagged as potential interference [98].
The robustness of multiparameter data in HCS is highly dependent on the number of cells analyzed. A significant reduction in cell count due to cytotoxicity can increase coefficients of variation (CVs) and degrade the Z-factor, a measure of assay signal window quality [98].
Orthogonal Assays for Hit Confirmation
Orthogonal assays, which utilize fundamentally different detection technologies to measure the same biological endpoint, are critical for confirming that compound activity is genuine and not an artifact of interference [98]. For example, a hit identified in a fluorescence-based viability assay should be confirmed using a luminescence-based ATP detection assay. This approach validates the biological relevance of the observed activity.
Table 1: Key Assays for Profiling Compound Interference and Cytotoxicity
| Assay Category | Specific Assay | Measured Parameter | Primary Interference Detected |
|---|---|---|---|
| Membrane Integrity | Trypan Blue Exclusion [99] | Dye permeability through compromised membranes | Necrotic cell death, false positives from debris |
| Propidium Iodide (PI) / 7-AAD Staining [99] | Nucleic acid staining in membrane-compromised cells | Necrotic cell death; more sensitive than Trypan Blue | |
| Lactate Dehydrogenase (LDH) Release [99] | Cytoplasmic enzyme leakage into supernatant | Membrane disruption and necrotic death | |
| Metabolic Activity | MTT/XTT/WST Assays [99] | Cellular reductase activity | General metabolic compromise; prone to redox interference |
| ATP Quantification (Luminometric) [99] | intracellular ATP levels | Early metabolic stress and loss of viability | |
| Apoptosis | Annexin V Staining [99] | Phosphatidylserine exposure on outer membrane | Early-stage apoptotic cell death |
| Caspase Activation Assays [99] | Protease activity of executioner caspases | Activation of programmed cell death pathways | |
| Proliferation & Biomass | CFSE Tracking [99] | Cell division rates | Cytostatic vs. cytotoxic effects |
Experimental Workflows
The following diagrams illustrate the logical workflow for identifying and mitigating compound interference in a high-throughput screening campaign.
Diagram 1: Overall workflow for addressing compound interference, showing the sequential process from primary screening to hit validation.
Diagram 2: Cytotoxicity triage workflow, outlining the decision-making process for compounds suspected of causing nonspecific cell death.
Detailed Experimental Protocols
Protocol: Multiparametric Cytotoxicity Assessment
This protocol uses a combination of membrane integrity and metabolic activity assays to accurately distinguish true cytotoxicity from technology-based interference [99] [98].
Key Research Reagent Solutions:
- Propidium Iodide (PI): Membrane-impermeant nucleic acid stain for identifying necrotic cells [99].
- Annexin V-Fluorophore Conjugate: Binds to phosphatidylserine exposed on the surface of apoptotic cells [99].
- CellTiter-Glo Reagent: Luminescent assay for quantifying cellular ATP levels as a measure of metabolic health [99].
- HCS-Compatible Nuclear Stain (e.g., Hoechst 33342): For automated cell counting and segmentation in image-based assays [98].
Procedure:
- Cell Seeding and Compound Treatment: Seed cells in a 96-well or 384-well microplate at an optimized density (e.g., 5,000-10,000 cells per well for a 384-well plate) [98]. Adherence and density are critical for a robust assay. After 24 hours, treat cells with test compounds across a range of concentrations (e.g., 1 nM - 100 µM) and include appropriate controls (vehicle, cytotoxic positive, healthy negative).
- Incubation: Incubate compound-treated cells for the desired exposure time (typically 24-72 hours) at 37°C and 5% CO₂.
- Staining for Flow Cytometry or HCS:
- Add Annexin V-fluorophore conjugate and PI to the culture medium according to manufacturer's instructions.
- Incubate for 15-20 minutes at room temperature protected from light.
- Analysis by Flow Cytometry:
- Acquire data on a flow cytometer equipped with appropriate lasers and filters.
- Analyze populations: Viable (Annexin V⁻/PI⁻), Early Apoptotic (Annexin V⁺/PI⁻), Late Apoptotic/Necrotic (Annexin V⁺/PI⁺).
- Parallel Metabolic Assay:
- In a separate plate, treat cells identically as in step 1.
- At the endpoint, add an equal volume of CellTiter-Glo Reagent to each well.
- Shake the plate for 2 minutes and incubate for 10 minutes to stabilize the luminescent signal.
- Record luminescence using a plate reader.
- Data Integration: Compare the dose-response curves and IC₅₀ values obtained from the apoptosis/necrosis analysis and the ATP quantification. A true cytotoxic compound will show concordance across these orthogonal readouts.
Protocol: Counter-Screen for Technology-Based Interference
This protocol outlines steps to identify compounds that interfere with fluorescence-based detection, a common issue in HCS [98].
Procedure:
- Compound-Only Control Plate:
- Prepare a plate containing culture medium and test compounds at the screening concentration, but without cells.
- Add the fluorescent probes or dyes used in the primary HCS assay.
- Incubate and read the plate using the same imaging settings as the primary screen.
- Data Analysis:
- Compounds that generate a fluorescence signal significantly above (autofluorescence) or below (quenching) the vehicle control baseline in the absence of cells are flagged as interferers.
- Image Analysis Verification:
- For compounds that are hits in the primary HCS, manually review the acquired images for signs of interference, such as:
- Unusual fluorescent precipitates.
- Altered background fluorescence.
- Saturated signal from dead cells with concentrated dye [98].
- For compounds that are hits in the primary HCS, manually review the acquired images for signs of interference, such as:
- Hit Triage: Compounds flagged by the counter-screen should be deprioritized or pursued only with confirmation from an orthogonal, non-fluorescence-based assay.
The Scientist's Toolkit: Research Reagent Solutions
Table 2: Essential Reagents for Profiling Compound Interference and Cytotoxicity
| Reagent / Assay | Function in Interference Testing | Key Considerations |
|---|---|---|
| Propidium Iodide (PI) | Nucleic acid stain for identifying membrane-compromised (necrotic) cells [99]. | Membrane-impermeant; use with flow cytometry or HCS. |
| Annexin V Conjugates | Detects phosphatidylserine exposure during early apoptosis [99]. | Requires calcium-containing buffer; often used with PI for staging. |
| CellTiter-Glo | Luminescent assay to quantify ATP levels as a measure of metabolic activity [99]. | Highly sensitive; less prone to chemical interference than colorimetric assays. |
| MTT/XTT/WST Dyes | Colorimetric assays measuring cellular reductase activity [99]. | Prone to interference from redox-active compounds [99]. |
| LDH Assay Kits | Colorimetric assay measuring lactate dehydrogenase release from cytosol upon membrane damage [99]. | Can be adapted for high-throughput; background from serum LDH can be an issue. |
| HCS Nuclear Stains | Enable automated cell counting and segmentation in image-based assays [98]. | Critical for normalizing signals and identifying cell loss. |
| CRISPR Screening Libraries | High-throughput genetic screens to identify genes that modulate sensitivity or resistance to compound-induced cytotoxicity [100]. | Enables discovery of novel mechanisms underlying compound toxicity. |
Vigilant assessment of compound interference is not merely a quality control step but an integral component of a robust high-throughput phenotyping research strategy. By implementing the systematic approaches and detailed protocols outlined in this document—including statistical flagging, orthogonal assay confirmation, and specific counter-screens for solubility and cytotoxicity—researchers can significantly enhance the fidelity of their screening data. This rigorous practice ensures that resources are focused on compounds with genuine biological activity, thereby accelerating the discovery of more reliable chemical probes and therapeutic candidates.
Beyond Correlation: Rigorous Validation and Statistical Frameworks for HTS Data
Why Pearson's Correlation is Misleading for Method Comparison
In high-throughput phenotyping (HTP) and drug discovery research, robust statistical validation of new methodologies is paramount. For decades, Pearson's correlation coefficient (r) has been widely used as a default metric for comparing measurement methods. However, evidence from statistical research and applied scientific studies demonstrates that this approach is fundamentally flawed for method comparison studies. This application note details the statistical limitations of Pearson's r, provides validated alternative protocols for robust method comparison, and presents quantitative frameworks to enhance the rigor of HTP validation in plant science and pharmaceutical research.
The Statistical Limitations of Pearson's Correlation Coefficient
Fundamental Misapplication in Method Comparison
Pearson's correlation coefficient (r) measures the strength of a linear relationship between two variables but provides no information about agreement between methods [101]. This critical distinction means that two methods can be perfectly correlated while consistently yielding different measurements. Correlation assesses whether two techniques measure the same thing, but does not determine whether either method measures that thing well [102]. Consequently, a high r value can validate a less accurate method or erroneously discount a more precise one, creating false confidence in methodological comparisons.
Specific Statistical Pitfalls
The table below summarizes key limitations that make Pearson's r inappropriate for method comparison studies:
Table 1: Statistical Pitfalls of Using Pearson's Correlation for Method Comparison
| Pitfall | Description | Impact on Method Validation |
|---|---|---|
| Sensitivity to Range | r increases with wider data range, independent of actual agreement [101] | Inflated confidence in methods when testing across broad value ranges |
| Insensitivity to Bias | Does not detect consistent additive or multiplicative differences [102] | Methods with significant systematic bias can show high correlation |
| Non-Robust to Outliers | Single outliers can dramatically influence r value [103] | Unstable estimates of method performance |
| Linear Assumption | Only captures linear relationships, misses non-linear agreement [103] [101] | Fails to detect consistent but non-linear measurement patterns |
| No Precision Information | Does not quantify which method is more or less variable [102] | Cannot determine relative precision of compared methods |
Recommended Statistical Frameworks for Method Comparison
Variance Comparison with F-Test
Protocol Principle: Direct comparison of method precision through variance quantification.
Experimental Requirements: Repeated measurements of identical subjects using both methods.
Statistical Procedure:
- Calculate variance estimates ((σ^2)) for each method from repeated measurements
- Compute variance ratio: (F = \frac{σ^2A}{σ^2B})
- Test significance using two-tailed F-test
- Interpret results: Significant difference indicates one method is more precise [102]
Advantages: Determines which method is inherently more variable, requires standard statistical software, provides intuitive interpretation of precision differences.
Bias Assessment with T-Tests
Protocol Principle: Quantification of systematic differences between methods.
Experimental Requirements: Paired measurements across representative sample range.
Statistical Procedure:
- Calculate mean difference between methods ((b̂_{AB}))
- Perform two-sample, two-tailed t-test for significant difference from zero
- Report confidence intervals for mean difference
- Visualize with appropriate plotting techniques [102]
Advantages: Detects consistent over- or under-estimation, provides magnitude and direction of bias, facilitates calibration adjustments.
Comprehensive Alternative Metrics
Table 2: Alternative Statistical Approaches for Method Comparison
| Metric | Application Context | Interpretation | Limitations |
|---|---|---|---|
| Limits of Agreement (LOA) | Clinical measurement comparison [101] | Estimated range containing 95% of differences between methods | Does not identify which method is more variable [102] |
| Intraclass Correlation (ICC) | Reliability assessment [101] | Proportion of variance explained by subject differences | Complex interpretation for non-statisticians |
| Variance Comparison | Precision quantification [102] | Direct test of relative method precision | Requires repeated measurements |
| Root Mean Square Error (RMSE) | Model prediction accuracy | Overall measure of difference magnitude | Conflates variance and bias information |
Experimental Design for High-Throughput Phenotyping Validation
Essential Experimental Components
Sample Selection: Include subjects representing the entire measurement range expected in actual applications. Avoid restricted ranges that artificially deflate correlation measures [101].
Replication Strategy: Incorporate sufficient repeated measurements of identical subjects to estimate method-specific variance components. This is a critical requirement for precision comparison [102].
Reference Standards: When available, include ground truth measurements or certified reference materials to quantify absolute accuracy in addition to relative agreement.
High-Throughput Screening Implementation
In pharmaceutical HTS applications, robust validation metrics are particularly crucial. The following approaches enhance method comparison:
Z'-Factor Validation: For HTS assays, calculate Z'-factor (0.5-1.0 indicates excellent assay) to quantify assay robustness separately from method agreement [104].
Cross-Platform Correlation: When comparing phenotypic screening methods (e.g., imaging vs. biochemical assays), employ variance partitioning to distinguish methodological variability from biological signal [20] [105].
Case Study: Plant Phenotyping Method Validation
Application in Canopy Height Measurement
A recent study compared LiDAR-based canopy height measurement against manual field measurements in sorghum. While Pearson's correlation was high (r = 0.89), variance comparison revealed the LiDAR method was significantly more precise (F-test, p < 0.01) with no significant bias (t-test, p = 0.34) [102]. This demonstrates how exclusive reliance on r would have obscured the superior precision of the new method.
In Silico Validation Approaches
Emerging methodologies use 3D simulation and digital phenotyping to validate HTP protocols computationally before field deployment [106] [107]. These approaches enable controlled variance assessment without physical measurement constraints.
Implementation Workflow for Robust Method Comparison
The following diagram illustrates a comprehensive workflow for method comparison studies that avoids the pitfalls of Pearson's correlation:
Essential Research Reagent Solutions
Table 3: Key Research Tools for High-Throughput Method Validation
| Reagent/Technology | Primary Function | Application Context |
|---|---|---|
| LiDAR Scanners | 3D plant architecture measurement [102] | Field-based phenotyping |
| Hyperspectral Imaging | Non-destructive biochemical trait estimation [102] | Photosynthetic capacity assessment |
| Transcreener Assays | Biochemical HTS with FP/TR-FRET detection [104] | Drug discovery screening |
| Tierpsy Tracker | Behavioral feature extraction [105] | C. elegans phenotypic screening |
| Convolutional Neural Networks | Image classification and segmentation [20] [108] | Automated phenotyping analysis |
| 3D Simulation Platforms | In silico protocol validation [106] [107] | Experimental design optimization |
The validation of new high-throughput phenotyping and drug discovery methodologies requires statistical approaches that directly address the practical questions of method performance. Pearson's correlation coefficient fails to provide the necessary information about relative precision and systematic bias, potentially leading to incorrect conclusions about method quality. The alternative frameworks presented herein—focusing on variance comparison, bias assessment, and comprehensive agreement metrics—provide robust statistical foundations for method validation that will accelerate the adoption of reliable HTP technologies in both plant science and pharmaceutical research.
In high-throughput phenotyping (HTP), the rapid acquisition of plant trait data creates a critical need for robust statistical validation of the methods themselves [102]. The gap between genomic capabilities and phenotypic assessment is narrowing, but its progress is often hampered by improper statistical comparison of phenotyping methods [102]. Many technological reviews and comparisons fail to provide objective assessments of methodological quality, limiting their utility for cross-study comparisons and decision-making [102]. Commonly used statistics like Pearson’s correlation coefficient (r) or Limits of Agreement (LOA) are often misleading for this purpose, as they cannot determine which of two methods is more precise and can lead to incorrect conclusions about method quality [102]. This article outlines a rigorous statistical framework focused on testing bias and variance, providing application notes and protocols to enhance the robustness of high-throughput phenotyping research.
The Statistical Framework: Beyond Correlation
The Pitfalls of Common Methods
The reliance on Pearson’s correlation coefficient (r) is a prevalent issue in method comparison. A high r value indicates a strong linear relationship between two methods but does not confirm that either method is accurate or precise [102]. Two methods can be perfectly correlated yet have significantly different measurement scales or offsets. Similarly, the Limits of Agreement (LOA) method, while popular, fails to provide a statistical test to determine which method is more variable and relies on potentially arbitrary pre-determined thresholds, risking the erroneous rejection of superior methods [102].
Core Concepts: Accuracy and Precision
A robust comparison differentiates between two key concepts:
- Accuracy (Bias): The degree to which a measurement approximates a true value (µ). When µ is known, bias (𝑏̂ ) is quantified directly. When µ is unknown, the bias between a new method (A) and a reference method (B) (𝑏̂ 𝐴𝐵) is calculated. A low bias indicates high accuracy.
- Precision (Variance): The variability in repeated measurements of an identical subject (e.g., the same leaf or plot), quantified as variance (σ²). A low variance signifies high precision [102].
Critically, estimating variance requires a experimental design that includes repeated measurements of the same subject, a feature often overlooked in phenotyping studies [102].
Application Notes: Experimental Design and Protocol
The following protocol provides a step-by-step guide for comparing a new high-throughput phenotyping method against an established reference.
Materials and Reagents
Table 1: Essential Research Reagent Solutions for HTP Method Validation
| Item | Function/Description |
|---|---|
| Phenotyping Platform | The system housing the sensors (e.g., robotic gantry, unmanned aerial vehicle, stationary imaging system) [109] [11]. |
| Primary Sensor(s) | The instrument(s) acquiring data (e.g., lidar scanner, RGB camera, hyperspectral imager, thermal sensor) [102] [110]. |
| Reference Method Equipment | The equipment for the "gold-standard" measurement (e.g., manual ruler, LAI-2200 plant canopy analyzer, gas exchange instrument) [102]. |
| Plant Subjects | A population of plants representing a range of the trait of interest (e.g., different genotypes, growth stages, or stress treatments). |
| Data Processing Software | Software for statistical analysis (e.g., R, Python with SciPy/StatsModels) and, if applicable, for processing raw sensor data into traits (e.g., machine learning models) [11]. |
Experimental Procedure
- Subject Selection: Select a set of
nsubjects (e.g., individual plants, specific leaves, plots). The subjects should encompass the expected range of the trait being measured (e.g., from short to tall plants, from low to high leaf area index) [102]. - Repeated Measurements: For each subject, perform
krepeated measurements (k ≥ 2) using both the new method (A) and the reference method (B). The order of measurement should be randomized to avoid systematic bias. It is crucial that the subject remains unchanged between these replicate measurements [102]. - Data Collection: Record all measurements in a structured table, ensuring each data point is linked to its specific subject and replicate number.
- Data Analysis: Conduct the following statistical tests using standard software packages.
Statistical Analysis Workflow
The logical flow for the statistical comparison is outlined below.
Step 1: Comparing Precision (Variance)
- Objective: To determine if the new method (A) has significantly different precision compared to the reference method (B).
- Hypotheses:
- H₀: σ²ₐ = σ²բ (The variances of the two methods are equal).
- H₁: σ²ₐ ≠ σ²բ (The variances of the two methods are not equal).
- Test: A two-tailed F-test is used to compare the ratio of the sample variances (𝑠²ₐ / 𝑠²բ) [102].
- Calculation: For each subject with repeated measurements, calculate the variance. Then compute the F-statistic as the ratio of the variances from the two methods. Compare this F-statistic to the critical value from the F-distribution with degrees of freedom based on the sample sizes.
- Interpretation: A significant result (e.g., p-value < 0.05) leads to the rejection of H₀, indicating a statistically significant difference in precision between the two methods. The method with the smaller variance is more precise.
Step 2: Comparing Accuracy (Bias)
- Objective: To determine if there is a significant systematic difference (bias) between the measurements from the two methods.
- Hypotheses:
- H₀: 𝑏̂ 𝐴𝐵 = 0 (There is no bias between the methods).
- H₁: 𝑏̂ 𝐴𝐵 ≠ 0 (There is a bias between the methods).
- Test: A two-tailed, two-sample t-test on the mean difference between the methods [102].
- Calculation: For each subject, use the mean of its repeated measurements. Calculate the difference between the mean from method A and the mean from method B for all subjects. Perform a t-test to assess whether the mean of these differences is significantly different from zero.
- Interpretation: A significant result (e.g., p-value < 0.05) indicates the presence of a consistent bias between the two methods.
Decision Matrix
The results from the bias and variance tests must be interpreted together to make a valid conclusion about the new method's quality.
Table 2: Interpretation Guide for Bias and Variance Test Results
| Variance Comparison | Bias Comparison | Interpretation | Recommendation |
|---|---|---|---|
| Not Significant | Not Significant | Methods are statistically equivalent. | New method can replace the old. |
| Not Significant | Significant | Methods agree on precision but new method has a consistent offset. | New method may be used with a calibration correction. |
| Significant (New is less variable) | Not Significant | New method is more precise and equally accurate. | New method is superior; should replace the old. |
| Significant (New is less variable) | Significant | New method is more precise but has a consistent offset. | New method is superior but requires calibration. |
| Significant (New is more variable) | Not Significant | New method is less precise but equally accurate. | New method is inferior; reject. |
| Significant (New is more variable) | Significant | New method is less precise and has an offset. | New method is inferior; reject. |
Case Study: Validating a Phenotyping Robot
To illustrate this framework, consider a study validating a gantry-style phenotyping robot equipped with multi-sensor imaging against handheld instruments [109].
- Experimental Setup: The robot's sensor gimbal and a researcher with a handheld device measured the same traits (e.g., vegetation indices) on a population of wheat plants.
- Data Collection: Multiple measurements were taken by both systems across different plant growth stages.
- Statistical Application:
- Variance Comparison (F-test): The variances of the repeated measurements from the robotic gimbal and the handheld instrument were compared. A non-significant F-test result would indicate comparable precision.
- Bias Comparison (t-test): The mean values reported by the robot and the handheld instrument were compared. A non-significant t-test result would indicate no systematic bias.
- Reported Outcome: The study reported a strong correlation (r² > 0.90) between the platforms [109]. Applying the bias-variance framework would provide a more rigorous foundation for this claim, explicitly testing whether the robot's measurements are statistically equivalent or superior to the handheld standard.
Integration with Predictive Modeling
A common goal in HTP is to predict a hard-to-measure "ground-truth" trait (e.g., photosynthetic capacity from a gas exchange instrument) using an easy-to-measure proxy from a new method (e.g., hyperspectral reflectance) [102]. This often involves building regression or machine learning models.
- Model Statistics (RMSE, etc.): Statistics like Root Mean Square Error (RMSE) are essential for evaluating model fit but are insufficient for method comparison. A low RMSE indicates good model prediction but conflates the variances of both methods. It cannot determine if the new method is more precise than the old one [102].
- Complementary, Not Replacement: These model evaluation metrics are necessary but must be complemented with the direct bias and variance tests on the raw measurements to fully understand the value and limitations of the new phenotyping method.
High-Throughput Screening (HTS) has become a cornerstone methodology in modern biological research and drug discovery, enabling the rapid assaying of large numbers of potential biological modulators against defined targets [111]. The power of HTS lies in its integration of liquid handling robotics, automated plate readers, and advanced data analysis, which together facilitate the generation of complex, content-rich datasets in relatively short timeframes [111]. However, this capacity for rapid data generation introduces a critical challenge: ensuring that the identified "active hits" represent genuine biological effects rather than methodological artifacts. This application note establishes a comprehensive validation protocol centered on replicate experiments and pilot screens, framed within the context of high-throughput phenotyping robustness screening research.
The transition from initial assay development to production-scale screening represents a vulnerable phase where unaccounted-for variability can compromise data integrity and lead to costly false positives or negatives. A rigorously designed validation protocol serves as a crucial quality gateway, systematically addressing sources of variation before committing to full-scale screening efforts. For researchers in both pharmaceutical development and agricultural phenotyping, implementing such protocols significantly enhances the reliability of screening outcomes and ensures efficient resource allocation [111] [112].
Core Validation Framework
The validation framework presented herein transforms the conceptual HTS process into a standardized, quality-controlled pipeline. This systematic approach ensures that assays are not only functionally robust but also generate reproducible data across multiple dimensions of variation.
Multi-Stage Validation Protocol
The complete validation pathway comprises sequential stages that progressively challenge the assay system under conditions approximating full production screening [111]:
Initial Consultation - This foundational stage involves comprehensive discussion between researchers and HTS facility managers to optimize assay concept, design, and implementation strategy. Early consultation provides critical guidance on reagent selection, phenotype optimization, logistics, and projected costs, potentially avoiding costly redesigns later in the process [111].
Stability and Process Study - This phase characterizes the temporal stability of all assay components and processes, establishing expiration windows for critical reagents and identifying potential degradation patterns that could introduce systematic error into screening data.
Liquid Handling Validation - Automated liquid handling systems are calibrated and verified for precision and accuracy across the entire working range, with particular attention to miniaturized formats where volumetric errors become magnified in their impact on results [113].
Plate Uniformity Assessment - This critical step evaluates positional effects across multi-well plates, identifying potential edge effects, temperature gradients, or other spatial anomalies that could introduce bias into screening data independent of biological variables.
Control Validation and Statistical Assessment - This phase establishes robust positive and negative controls and calculates the Z'-factor, a statistical parameter that quantifies assay quality and separation between controls. The Z' calculation incorporates both the means and standard deviations of positive and negative controls to provide a reliable metric for assay robustness [111]. Additionally, this stage assesses drift within the screen body and further evaluates edge effects to ensure consistent performance throughout the entire screening run.
Replicate Experiments - The protocol mandates a minimum of two replicate studies conducted over different days to establish biological reproducibility and robustness, addressing both technical and biological sources of variation [111].
Pilot Screen - A small-scale screening run incorporating compounds with varied pharmacological activity alongside established controls provides a final validation step before committing to full production [111].
Production Runs - Following successful completion of all validation stages, the assay progresses to full-scale screening with established quality control checkpoints throughout the production process [111].
Workflow Visualization
The following diagram illustrates the sequential relationship between these validation components:
Implementing Critical Validation Components
Replicate Experiments: Establishing Biological Reproducibility
The requirement for replicate experiments represents a fundamental principle in HTS validation, addressing the critical distinction between technical precision and biological reproducibility. As explicitly specified in established HTS protocols, researchers must conduct "as a minimum a 2 replicate study over 2 different days for biological reproducibility and robustness" [111]. This temporal separation between experimental replicates is essential for capturing day-to-day variations in environmental conditions, reagent performance, and cellular responses that would otherwise remain undetected in technically replicated runs conducted simultaneously.
In practical implementation, this validation component requires independent assay executions with freshly prepared reagents and biological materials on separate days. For cell-based assays, this includes using different cell passages prepared from frozen stocks; for biochemical assays, it involves independent reagent preparations. The resulting data enables quantification of both intra-assay precision (within plate variation) and inter-assay reproducibility (between day variation), providing a comprehensive assessment of assay robustness under realistic screening conditions [112]. Statistical analysis of replicate concordance typically includes correlation coefficients, coefficient of variation calculations, and mean difference assessments to establish acceptable performance thresholds before proceeding to pilot screening.
Pilot Screens: Bridging Validation and Production
The pilot screen serves as the final proving ground before full resource commitment to production-scale screening. This validation component involves running "a small number of plates containing compounds of varied pharmacological activity and the chosen controls" [111]. The strategic selection of test compounds with known biological activities creates a benchmark system for evaluating whether the assay can reliably detect and quantify expected effects amid the screening environment.
The pilot screen operates as a microcosm of the full production run, exposing the assay system to the complete workflow from compound management through data analysis while maintaining manageable scale. This includes testing the entire data processing pipeline, from raw data acquisition through normalization and hit identification algorithms. For cell-based phenotypic screens, which are "generally more susceptible to batch-to-batch or day-to-day variability when compared to target-based assays" [112], the pilot screen provides critical verification that the normalization strategies effectively control for these variations. Successful performance in the pilot phase, demonstrated by accurate classification of control compounds and stable background distribution, provides the final confidence metric for proceeding to full production.
Quantitative Assessment Parameters
Robust validation requires quantitative metrics to objectively assess assay performance and establish go/no-go decision points for progression through the validation pipeline.
Table 1: Key Quantitative Parameters for HTS Validation
| Parameter | Target Value | Measurement Purpose | Calculation Method | ||
|---|---|---|---|---|---|
| Z'-Factor | >0.5 | Assay quality and separation between controls | 1 - [3×(σₚ + σₙ) / | μₚ - μₙ | ] where σ=std dev, μ=mean, p=positive, n=negative controls [111] |
| Coefficient of Variation (CV) | <10% | Plate uniformity and liquid handling precision | (Standard Deviation / Mean) × 100% | ||
| Signal-to-Noise Ratio | >5 | Assay window robustness | Mean Signal - Mean Background | / Standard Deviation of Background | |
| Replicate Concordance | R² > 0.8 | Inter-assay reproducibility | Pearson correlation coefficient between replicate experiments | ||
| Hit Confirmation Rate | >70% | Pilot screen predictive value | (Confirmed Hits / Initial Hits) × 100% |
These quantitative parameters should be tracked throughout the validation process, with established thresholds for progression to subsequent stages. The Z'-factor deserves particular attention as it incorporates both the dynamic range of the assay and the data variation associated with both positive and negative controls, providing a robust metric that is more informative than simple signal-to-background ratios [111].
Advanced Normalization Strategies
Effective validation requires sophisticated data normalization approaches that accommodate the particular challenges of HTS systems, especially for complex phenotypic assays. Conventional normalization methods that scale data to plate-based positive and negative controls often prove insufficient for multi-screen integration or for assays with non-linear response characteristics.
Biological Standard Curve Normalization
For assays quantifying a measurable biological response, incorporating a standard curve on each plate enables conversion of raw signal values to biologically meaningful units. This approach was effectively demonstrated in an interferon signaling enhancer screen where "inclusion of a per-plate, per-quadrant IFN dose-response standard curve enabled conversion of ISRE activity to effective IFN concentrations" [112]. This normalization strategy transformed raw luminescence data into standardized biological response units (effective IFN-β concentration), enabling direct quantitative comparison across multiple screens conducted at different times.
The implementation involves including a dilution series of a known activator or inhibitor on each screening plate, typically in designated control wells. The dose-response relationship is then fitted using a four-parameter logistic curve (Y=Bottom+(Top-Bottom)/(1+10^((LogEC50-X)*HillSlope))) [112]. Test compound responses are interpolated onto this curve, converting raw signals to equivalent biological effect units. This approach effectively controls for inter-plate and inter-batch variation in assay responsiveness, a common challenge in cell-based systems where biological materials inevitably vary between preparations.
Data Analysis Workflow
The following diagram illustrates the complete data processing pathway incorporating advanced normalization:
The Scientist's Toolkit: Essential Research Reagents and Materials
Successful implementation of robust validation protocols depends on appropriate selection and quality control of key research reagents and materials.
Table 2: Essential Research Reagent Solutions for HTS Validation
| Reagent/Material | Function in Validation | Quality Control Requirements |
|---|---|---|
| Reference Agonists/Antagonists | Positive controls for Z' calculation and standard curves | >95% purity; documented EC₅₀/IC₅₀ in assay system |
| Cell Lines | Biological response system for phenotypic screens | Regular authentication; mycoplasma testing; consistent passage range |
| Assay Plates | Miniaturized reaction vessels | Lot consistency testing; surface treatment validation |
| Detection Reagents | Signal generation for quantitative readouts | Batch testing against reference standards; stability mapping |
| CRISPR Libraries | Genetic perturbation for mechanistic screens | Guide RNA validation; coverage confirmation [111] |
Specific reagent requirements vary by screening platform. For CRISPR screening applications, multiple library options are available, including the Toronto KnockOut library (12 gRNAs per gene, 176,500 total gRNAs) for loss-of-function studies and the SAM activation library (3 gRNAs per gene, 70,290 total gRNAs) for gain-of-function studies [111]. Regardless of the specific screening technology, consistent reagent quality across validation and production phases is essential for generating comparable data.
Application in High-Throughput Phenotyping
The validation principles described herein find particular relevance in high-throughput phenotyping, where complex phenotypic measurements introduce additional layers of variability. Modern plant phenotyping platforms "facilitate simultaneous data acquisition for multiple traits in large populations and dynamic observation of plants at different growth stages" [114], creating validation challenges similar to those in drug discovery HTS.
The integration of multispectral imaging systems capable of measuring within 365–970 nm wavelengths enables quantitative detection of abiotic and biotic stress responses [60]. However, these advanced sensing technologies require rigorous validation to ensure that observed phenotypic differences reflect genuine biological variation rather than technical artifacts. The replicate experiment requirement is particularly critical in phenotyping applications, where environmental fluctuations and developmental asynchrony can significantly impact results.
Validation protocols for image-based phenotyping must address additional parameters including camera calibration, illumination consistency, and image analysis algorithm validation. The emergence of machine learning and deep learning approaches for phenotypic data analysis further underscores the need for robust validation, as these models are particularly susceptible to bias from technical artifacts in training data [11] [114].
The establishment of a robust validation protocol incorporating replicate experiments and pilot screens represents an indispensable foundation for reliable high-throughput screening outcomes. By systematically addressing sources of variation before full production commitment, researchers can significantly enhance screening efficiency and success rates. The quantitative framework presented herein, coupled with appropriate normalization strategies and quality-controlled research reagents, provides a standardized approach to HTS validation applicable across diverse screening paradigms from drug discovery to plant phenotyping.
As HTS technologies continue to evolve toward increasingly complex phenotypic readouts and higher degrees of miniaturization, the principles of rigorous validation will remain essential for transforming high-throughput data into high-confidence biological insights.
From Hit to Lead: The Role of Secondary Confirmation Screens and IC50 Determination
This application note details a standardized workflow for transitioning from initial screening hits to validated lead candidates in high-throughput screening (HTS) campaigns. Within the context of robust phenotyping screening research, we emphasize the critical importance of secondary confirmation screens and accurate IC₅₀ determination to eliminate false positives, verify mechanism of action, and establish reliable structure-activity relationships. The protocols outlined provide a systematic approach for confirming hit activity through dose-response curves, orthogonal assay methodologies, and counter-screens that collectively enhance the identification of high-quality leads with improved potential for successful therapeutic development. Implementation of this comprehensive confirmation cascade significantly reduces attrition rates in downstream drug discovery phases by ensuring only compounds with verified biological activity and favorable properties advance to lead optimization.
In high-throughput drug discovery, the initial identification of "hits" – compounds showing activity in a primary screen – represents merely the starting point of a rigorous triage process. The transition from hit to lead requires extensive validation to ensure these initial actives represent genuine biological effects rather than assay artifacts or promiscuous binders [115]. Statistical analyses indicate that without proper confirmation, a significant proportion of primary screening hits may prove to be false positives, wasting valuable resources during subsequent optimization phases [72] [71].
The establishment of a robust screening cascade is therefore paramount for distinguishing true hits from compounds exhibiting assay interference or non-specific activity [116]. This process typically involves confirmatory testing in the primary assay, determination of potency through dose-response curves (IC₅₀/EC₅₀), orthogonal testing using alternative technologies, and counter-screening to assess selectivity and rule out undesirable mechanisms [117] [115]. The integration of these approaches within a systematic framework provides multiple lines of evidence for hit validation, significantly increasing confidence in the resulting lead compounds.
This application note presents a standardized experimental workflow for secondary confirmation and IC₅₀ determination, specifically contextualized within high-throughput phenotyping robustness screening research. The protocols are designed to be readily adaptable to diverse targets and screening methodologies, enabling researchers to efficiently prioritize the most promising chemical matter for lead optimization campaigns.
Experimental Design and Workflow
A systematic, multi-tiered approach to hit confirmation ensures comprehensive evaluation of compound activity and specificity. The following workflow integrates established confirmation methodologies with advanced phenotyping principles to maximize the identification of high-quality leads.
Workflow Visualization
Key Experimental Considerations
- Assay Quality Metrics: Implement rigorous statistical assessment during assay development, including Z'-factor >0.5, signal-to-background ratio >3, and coefficient of variation <10% to ensure robust assay performance [28].
- Compound Handling: Prepare intermediate dilutions in DMSO not exceeding 1% final concentration in assay buffers to maintain compound solubility and prevent solvent-mediated effects [116].
- Control Strategy: Include reference controls (both positive and negative) on every plate to normalize for inter-plate variability and enable day-to-day comparison of results [115] [28].
- Data Normalization: Normalize all response data to plate controls (100% inhibition = positive control; 0% inhibition = negative control) to minimize systematic error and facilitate cross-experiment comparison [72].
Materials and Reagents
The successful implementation of confirmation assays requires careful selection of reagents and materials to ensure reproducibility and physiological relevance.
Research Reagent Solutions
Table 1: Essential Research Reagents for Hit Confirmation Assays
| Reagent/Material | Function/Purpose | Application Examples |
|---|---|---|
| Cell-Based Assay Kits (ATP-based viability, Caspase activation) | Measure cellular viability, proliferation, and cytotoxicity mechanisms; provide homogeneous, HTS-compatible formats [28]. | Primary hit confirmation, cytotoxicity counter-screening, IC₅₀ determination in phenotypic assays. |
| Biochemical Assay Reagents (Substrates, Cofactors) | Enable target-specific activity measurement in purified systems; confirm direct target engagement [115]. | Enzyme activity assays, direct binding studies, mechanistic follow-up. |
| Secondary Antibodies & Detection Reagents | Facilitate signal amplification in immunoassays; enable detection of specific protein expression or modification changes [115]. | Western blotting, ELISA, high-content imaging assays. |
| Orthogonal Detection Reagents (Fluorescent dyes, SPR chips) | Provide alternative detection mechanisms to primary screen; minimize technology-specific artifacts [115]. | Fluorescence polarization, surface plasmon resonance, thermal shift assays. |
| Positive/Negative Control Compounds | Establish assay performance benchmarks; validate experimental conditions across replicates [28]. | Plate controls, assay validation, calculation of normalized response. |
Protocols
This section provides detailed methodologies for key experiments in the hit confirmation cascade.
Protocol 1: Hit Confirmation and Dose-Response (IC₅₀) Determination
This protocol validates primary screen actives and quantifies compound potency through concentration-response analysis [117] [115].
Materials:
- Compound plates (initial hits in DMSO)
- Assay-specific reagents (as optimized in primary screen)
- 384-well assay plates (e.g., Corning, Greiner)
- Automated liquid handling system (e.g., Multidrop, Biomek)
- Plate reader appropriate for detection method (e.g., PerkinElmer EnVision)
Procedure:
Compound Dilution Series Preparation:
- Using an acoustic liquid handler or pin tool, prepare 1:3 serial dilutions of test compounds in DMSO across 10 points, typically from 10 mM to sub-micromolar concentrations.
- Transfer 50 nL of each dilution to designated wells in 384-well assay plates using an acoustic dispenser or pintool.
Assay Assembly:
- Dispense 15 µL of assay buffer to all wells containing compound using an automated liquid handler.
- Incubate plates for 15 minutes at room temperature to pre-mix compounds with buffer.
- Add 10 µL of enzyme/substrate/cell suspension to initiate reaction (final volume: 25 µL/well).
- Centrifuge plates at 1000 × g for 1 minute to eliminate bubbles and ensure proper mixing.
Reaction Incubation:
- Incubate plates under appropriate conditions (time, temperature) as established in primary assay development.
- For cell-based assays, incubate for 48-72 hours to ensure adequate response generation.
Signal Detection:
- Develop plate according to assay methodology (add detection reagent, stop solution).
- Read plates using appropriate instrumentation (luminescence, fluorescence, or absorbance).
Data Analysis:
- Calculate percent inhibition relative to controls for each concentration: % Inhibition = 1 - (Signalcompound - Signalpositive)/(Signalnegative - Signalpositive) × 100
- Fit normalized data to four-parameter logistic curve: Y = Bottom + (Top - Bottom)/(1 + 10^(X - LogIC₅₀) × HillSlope)
- Report IC₅₀ values with 95% confidence intervals from at least three independent experiments.
Protocol 2: Orthogonal Assay for Mechanism Verification
This protocol confirms compound activity using a different detection technology or assay format to minimize false positives from technology-specific interference [115].
Materials:
- Biophysical instrumentation (SPR, ITC, or TSA capable system)
- Purified target protein (>95% purity)
- Assay-specific buffers and consumables
Procedure:
Surface Plasmon Resonance (SPR) Analysis:
- Immobilize target protein on CMS sensor chip using standard amine coupling chemistry.
- Establish running buffer flow rate (typically 30 µL/min).
- Inject compound dilutions (5 concentrations in running buffer + 0.5% DMSO) for 60-second association time.
- Monitor dissociation for 120 seconds.
- Calculate binding kinetics (kₐ, kḍ) and equilibrium dissociation constant (Kḍ) using appropriate fitting models.
Thermal Shift Assay (TSA):
- Prepare protein solution (1-5 µM) in appropriate buffer with compound (10-100 µM) or DMSO control.
- Add fluorescent dye (e.g., SYPRO Orange) according to manufacturer's recommendation.
- Perform thermal denaturation ramp from 25°C to 95°C with 1°C increments.
- Monitor fluorescence intensity throughout the temperature ramp.
- Calculate ΔTₘ (shift in melting temperature) between compound and DMSO control.
Protocol 3: Specificity Counter-Screening
This protocol identifies and eliminates compounds with non-specific activity or undesired mechanisms [115] [71].
Materials:
- Related and unrelated target enzymes/cell lines
- Pan-assay interference compounds (PAINS) filters [115]
- Assay reagents for counter-targets
Procedure:
Selectivity Profiling:
- Test compound dilutions against closely related target isoforms (e.g., kinase family members).
- Include phylogenetically distant targets to assess general compound selectivity.
- Calculate selectivity index (SI = IC₅₀ counter-target / IC₅₀ primary target).
Interference Compound Screening:
- Test compounds in assay formats detecting common interference mechanisms:
- Redox cycling (e.g., DTT addition)
- Aggregation (e.g., detergent addition)
- Fluorescence/quenching (e.g., inner filter effect testing)
- Apply computational filters to identify PAINS and reactive compounds.
- Eliminate compounds showing interference in ≥2 interference assays.
- Test compounds in assay formats detecting common interference mechanisms:
Results and Data Interpretation
Proper interpretation of confirmation screen data is essential for making informed decisions about compound progression.
Hit Qualification Criteria
Table 2: Quantitative Criteria for Hit Progression Decisions
| Parameter | Threshold for Progression | Interpretation & Implications |
|---|---|---|
| IC₅₀/EC₅₀ | < 10 µM (dependent on target class) | Compound displays sufficient potency for initial chemical exploration; lower thresholds (<1 µM) preferred for fragment-based approaches [72]. |
| Ligand Efficiency (LE) | ≥ 0.3 kcal/mol/HA (for MW >250) | Compound efficiency per heavy atom is acceptable; values below this threshold suggest inadequate binding interactions for molecular size [72]. |
| Selectivity Index | ≥ 10-fold vs. related targets | Sufficient selectivity to minimize off-target effects; target-dependent thresholds may apply (e.g., kinases require >100-fold) [71]. |
| Dose-Response Curve Fit (R²) | ≥ 0.90 | High confidence in potency measurement; lower values suggest poor curve fit or potential assay interference. |
| Orthogonal Assay Confirmation | Consistent activity (≤3-fold shift in potency) | Mechanism of action is not assay-specific; large potency shifts suggest technology-specific artifacts [115]. |
| Cellular Activity | ≤10-fold shift from biochemical assay | Good correlation between biochemical and cellular activity suggests favorable cell permeability and target engagement in cells. |
Data Visualization and Decision Framework
Discussion
The implementation of a rigorous, multi-parameter confirmation cascade substantially enhances the quality of chemical matter advancing to lead optimization. By employing orthogonal assay technologies and comprehensive counter-screening, researchers can significantly reduce the incidence of false positives that frequently plague high-throughput screening campaigns [115]. The quantitative framework presented here provides a standardized approach for evaluating hit compounds across multiple dimensions, facilitating objective comparison of diverse chemical series.
The critical importance of dose-response analysis extends beyond simple potency determination. Careful examination of curve morphology, Hill slopes, and maximal response can reveal valuable insights into compound mechanism, including allosteric effects, partial agonism, or time-dependent inhibition [72]. Furthermore, the integration of ligand efficiency metrics during hit confirmation encourages prioritization of compounds with favorable binding efficiency relative to molecular size, increasing the likelihood of successful optimization during subsequent lead expansion [72] [71].
In the context of high-throughput phenotyping robustness screening, these confirmation protocols provide a essential framework for distinguishing genuine phenotype-modifying compounds from those producing artifactual responses. The application of orthogonal approaches is particularly valuable in complex phenotypic systems where multiple mechanisms can produce similar observable outcomes [20]. By implementing this comprehensive confirmation strategy, researchers can build greater confidence in their screening results and allocate medicinal chemistry resources more efficiently toward series with the highest probability of ultimate success.
This application note outlines a comprehensive experimental framework for transitioning from initial screening hits to qualified lead candidates through systematic secondary confirmation and IC₅₀ determination. The integrated approach of confirmatory screening, orthogonal mechanism verification, and specificity profiling significantly enhances the robustness of hit identification while minimizing the propagation of false positives and promiscuous inhibitors. The standardized protocols and quantitative decision criteria presented enable objective comparison of diverse chemical series, facilitating data-driven compound progression decisions. Implementation of this confirmation cascade within high-throughput phenotyping research ensures that only compounds with verified biological activity and favorable properties advance to resource-intensive lead optimization, ultimately increasing the efficiency of the overall drug discovery process.
Within high-throughput phenotyping (HTP) robustness screening research, identifying a singular "gold standard" methodology remains challenging due to the context-dependent nature of phenotypic analysis. High-throughput phenotyping technologies have emerged as transformative tools for non-destructive, efficient trait measurement, yet their validation requires rigorous comparison against established benchmarks [11]. This protocol examines the comparative effectiveness of various phenotyping methods across plant research contexts, addressing a critical bottleneck in the precise selection and breeding of superior genetic resources [118]. We provide a structured framework for evaluating method robustness, with particular emphasis on applications in drug development and chemical genetics where accurate phenotypic assessment is crucial for identifying biologically active compounds. The analytical approaches detailed herein enable researchers to select context-appropriate phenotyping strategies by quantifying their performance against established reference methods across multiple validation parameters.
Comparative Performance Analysis of Phenotyping Platforms
Table 1 summarizes quantitative performance metrics across diverse phenotyping platforms, highlighting their respective advantages and limitations for specific research applications.
Table 1: Comparative Performance Metrics of Phenotyping Platforms
| Platform/Method | Application Context | Key Measured Parameters | Throughput Capacity | Concordance with Reference Method | Key Limitations |
|---|---|---|---|---|---|
| Head Infection Assay [119] | Fusarium head blight resistance in wheat | Disease severity, mycotoxin contamination | Low (labor-intensive) | Reference standard | Subject to environmental variability, low throughput |
| Coleoptile Assay [119] | Fungal virulence screening | Disease symptoms, resistance differentiation | High | Strong concordance with head assay | Tissue-specific responses may not fully replicate head infections |
| Seedling Assay [119] | Early-stage resistance screening | Disease progression, growth parameters | High | Strong concordance with head assay | Developmental stage may influence resistance expression |
| Detached Leaf Assay [119] | Pathogen response screening | Lesion development, hypersensitive response | Medium | Limited genotype differentiation | Absence of whole-plant systemic responses |
| LemnaTec 3D Scanalyzer [11] | Salinity tolerance traits in rice | Architectural features, biomass estimation | High | Not quantified | High equipment costs, complex data management |
| PHENOPSIS [11] | Soil water stress responses in Arabidopsis | Growth rates, water use efficiency | Medium | Not quantified | Limited to controlled environment applications |
| GROWSCREEN FLUORO [11] | Abiotic stress tolerance | Leaf growth, chlorophyll fluorescence | Medium-high | Not quantified | Requires specialized fluorescence imaging capabilities |
| Convolutional Neural Networks [20] | Chemical genetic screens | Seedling growth classification, root and leaf quantification | Very high | 100% accuracy for positive/negative controls | Requires extensive training datasets |
Experimental Protocols for Method Validation
Differential Growth Chemical Screening Protocol
This protocol enables identification of genotype-specific chemical effects using Arabidopsis thaliana, with applications in drug discovery and mode of action studies [20].
Materials and Reagents
- Plant Materials: Arabidopsis thaliana wild-type (Col-0) and mutant genotypes (e.g., mus81 DNA repair mutant)
- Chemical Libraries: Prestwick Chemical Library (1,120 off-patent drugs) or other compound collections
- Growth Media: Half-strength Murashige and Skoog (MS) liquid medium, pH 5.7
- Equipment: 24-well microtiter plates, light macroscope for imaging, controlled environment growth chambers
- Controls: Mitomycin C (10 μg/mL) for genotoxic stress positive control, DMSO (0.1%) for negative control
Procedure
Seed Surface Sterilization
- Sterilize Arabidopsis seeds using 70% ethanol for 5 minutes, followed by 50% commercial bleach with 0.1% Triton X-100 for 10 minutes
- Rinse seeds 5 times with sterile distilled water
Plate Setup and Inoculation
- Dispense 1 mL of liquid MS medium into each well of 24-well plates
- Add chemical compounds from library to appropriate wells (final DMSO concentration 0.1%)
- Include positive controls (Mitomycin C) and negative controls (DMSO alone) in each plate
- Sow 3 surface-sterilized seeds per well using sterile pipette tips
- Seal plates with gas-permeable membrane to maintain sterility
Growth Conditions
- Incubate plates under continuous light (80-100 μmol/m²/s) at 22°C for 10 days
- Maintain constant humidity at 60-70%
Image Acquisition
- Capture high-resolution images of each well at day 10 using light macroscope
- Maintain consistent focal distance and lighting conditions across all acquisitions
- Include scale reference in imaging setup
Image Analysis Using Convolutional Neural Networks
- Implement two complementary CNN approaches:
- ResNet Architecture for classification of normal vs. altered growth
- U-Net Architecture for segmentation of roots and aerial parts
- Train models on dataset of 240 seedling images (equal distribution of WT and mutant, DMSO and MMC treatments)
- Split data: 80% training, 10% validation, 10% testing
- Apply trained models to quantify treatment effects
- Implement two complementary CNN approaches:
Hit Identification
- Calculate growth inhibition metrics for each genotype
- Identify compounds showing statistically significant differential effects (p<0.01) between genotypes
- Apply false discovery rate correction for multiple comparisons
Fusarium Head Blight Resistance Screening Protocol
This protocol compares traditional and high-throughput methods for assessing disease resistance in wheat [119].
Materials and Reagents
- Plant Materials: Near-isogenic wheat lines differing in FHB resistance loci (e.g., 3B5A [resistant] and bbaa [susceptible])
- Fungal Isolates: Fusarium graminearum (PH1), F. culmorum, F. avenaceum, F. poae
- Growth Media: Potato dextrose agar (PDA), mung bean broth
- Equipment: Growth chambers, stereomicroscope, humidity chambers
Coleoptile Assay Procedure
Seed Preparation
- Surface-sterilize wheat seeds as described in 3.1.2
- Germinate seeds on moist filter paper in Petri dishes for 3-4 days until coleoptiles emerge
Inoculum Preparation
- Culture Fusarium isolates on PDA for 3-4 days at 25°C
- Prepare macroconidia in liquid mung bean broth, incubate at 25°C with shaking (220 rpm) for 7 days
- Filter through sterile Miracloth, adjust concentration to 1×10⁶ spores/mL
Inoculation and Incubation
- Place individual coleoptiles into inoculation blocks with 10μL spore suspension
- Incubate in humidity chambers at 25°C with 12h photoperiod
- Assess disease symptoms after 7 days using standardized scoring system
Data Collection
- Measure lesion size using digital calipers or image analysis
- Record disease severity on 0-5 scale (0=no symptoms, 5=complete necrosis)
Research Reagent Solutions
Table 2 presents essential research reagents and their applications in high-throughput phenotyping studies.
Table 2: Key Research Reagent Solutions for High-Throughput Phenotyping
| Reagent/Resource | Function/Application | Specific Examples | Critical Parameters |
|---|---|---|---|
| Prestwick Chemical Library [20] | Identification of genotype-specific chemical effects | 1,120 off-patent drugs screened for differential growth effects | Low cytotoxicity, known bioavailability, structural diversity |
| Fusarium Species Complex [119] | Pathogen virulence assessment | F. graminearum, F. culmorum, F. avenaceum, F. poae for FHB resistance screening | Spore concentration (1×10⁶/mL), species-specific virulence patterns |
| Near-Isogenic Lines [119] | Genetic analysis of resistance mechanisms | Wheat NILs with/without Fhb1 and Qfhs.ifa-5A resistance loci | Defined genetic differences, minimal background variation |
| Mitomycin C [20] | Genotoxic stress inducer for DNA repair mutants | Positive control for mus81 Arabidopsis mutant phenotypes | Concentration optimization (10μg/mL for robust differential effects) |
| Convolutional Neural Networks [20] | Automated image analysis and classification | ResNet for growth classification, U-Net for tissue segmentation | Training set size (>200 images), validation on independent datasets |
| Arabidopsis DNA Repair Mutants [20] | Sensitized background for chemical genetics | mus81 mutant for identification of genotoxic compounds | Hypersensitivity validation against known genotoxins |
Workflow Visualization
HTP Method Validation Workflow
Chemical Genetics Screening Pipeline
This comparative analysis demonstrates that the identification of a true "gold standard" in phenotyping methodology is highly context-dependent, varying with research objectives, biological systems, and practical constraints. Traditional reference methods like head infection assays for FHB resistance provide ecological relevance but suffer from limitations in throughput and standardization [119]. Conversely, high-throughput alternatives such as coleoptile and seedling assays offer superior scalability while maintaining strong concordance with reference methods, positioning them as robust screening tools for early-stage investigations [119]. In chemical genetics, integrated approaches combining multi-genotype screening with machine learning-based image analysis establish new standards for efficiency and accuracy in identifying genotype-specific chemical effects [20]. The protocols and analytical frameworks presented here provide researchers with validated methodologies for selecting context-appropriate phenotyping strategies, ultimately accelerating discovery in plant sciences and drug development.
In high-throughput phenotyping robustness screening research, the adoption of statistically sound method comparison practices is fundamental to accelerating scientific discovery. The narrowing gap between genomics and phenomics is being slowed by improper statistical comparison of methods, potentially leading to numerous incorrect conclusions about method quality [102] [120]. While high-throughput technologies have advanced significantly—including phone apps, automated lab equipment, RGB and hyperspectral imaging technologies, and lidar scanners—a persistent gap in robust statistical design continues to hamper the adoption of newer, better, and more cost-effective technologies [120]. This protocol outlines a rigorous statistical framework that moves beyond commonly misused metrics to provide researchers with reliable tools for method validation.
The prevalent issue in current methodological comparisons lies in the failure to properly account for variance. Pearson's correlation coefficient (r) remains commonly used but represents a misleading statistic for method comparison as it measures only the strength of linear relationship without quantifying variability within each method [102] [121]. Similarly, the Limits of Agreement (LOA) approach, while popular, fails to identify which instrument is more or less variable and can lead to incorrect conclusions about method quality through its binary judgment based on predetermined thresholds [102]. These limitations necessitate a more robust framework that properly compares both bias and variance, which has been the statistical standard for decades but remains underutilized in high-throughput phenotyping applications [120].
Theoretical Foundations: Key Statistical Concepts
Defining Accuracy, Precision, and Agreement
In method comparison studies, precise terminology is crucial for proper experimental design and interpretation:
Accuracy refers to the degree to which a measurement approximates the true value (µ). When µ is known, it is quantified as bias (b̂), where low bias indicates high accuracy. When µ is unknown, bias between two methods (b̂AB) is calculated instead, with low values suggesting comparable results [120].
Precision reflects variability in repeated measurements of an identical subject (e.g., specific plot, plant, or leaf). This is quantified as variance, representing the sum of squared differences between individual measurements and a method's mean estimate. Low variance signifies high precision [120].
Limits of Agreement (LOA) represent roughly a 95% prediction interval for differences between two measurement methods, typically calculated as bias ± 2 × standard deviation of differences [122].
Statistical Tests for Method Comparison
Proper methodological comparison requires specific statistical tests to evaluate different aspects of performance:
Bias Comparison: A significant difference in bias between two methods is indicated if b̂AB is significantly different from zero as determined by a two-tailed, two-sample t-test [120].
Variance Comparison: Variances are considered different if the ratio of the estimated variances (σ̂A²/σ̂B²) is significantly different from one as indicated by a two-tailed F-test [120].
LOA Calculation: For study j with individuals i = 1... nj, the difference Dij = Yij - Xij is modeled, where δj = E(Dij|j) is the bias, and σj = √V(Dij|j) is the standard deviation of differences. The 95% prediction interval is estimated using Dj ± 1.96Sj [122].
Experimental Design and Protocols
Protocol 1: Direct Method Comparison with Repeated Measures
Objective: To compare a new phenotyping method against an established gold-standard method through simultaneous measurement of identical subjects.
Materials and Equipment:
- Gold-standard measurement instrument
- New phenotyping method/instrument to be validated
- Biological samples or subjects for phenotyping (minimum n=30 recommended)
- Data recording system
Procedure:
- Subject Selection: Select a representative range of subjects that cover the expected measurement range of interest [120].
- Randomization: Randomize the order of measurement for both methods to avoid systematic bias.
- Repeated Measurements: For each subject, take multiple measurements (minimum 3 repeats recommended) with each method under identical conditions [120].
- Data Collection: Record all measurements with appropriate identifiers for subject, method, replicate, and operator.
- Statistical Analysis:
- Calculate mean values for each subject-method combination
- Perform paired t-test for bias assessment
- Conduct F-test for variance comparison
- Compute LOA using appropriate formulae
Troubleshooting Tip: If methods demonstrate proportional bias across the measurement range, consider implementing regression-based approaches to LOA rather than standard calculations.
Protocol 2: Meta-Analysis of Multiple Bland-Altman Studies
Objective: To pool results from multiple independent method comparison studies for enhanced generalizability.
Materials:
- Multiple published or unpublished Bland-Altman studies comparing the same methods
- Statistical software capable of random-effects meta-analysis
Procedure:
- Study Identification: Systematically identify relevant method comparison studies through database searching [122].
- Data Extraction: Extract estimates of bias (Dj) and standard deviation (Sj) from each study, along with sample sizes [122].
- Model Specification: Apply random-effects models that account for both within-study and between-study variation:
- Overall bias: δ = E(Dij)
- Total standard deviation: √V(Dij) = √(σ² + τ²), where σ² represents average within-study variation and τ² represents between-study variation in biases [122]
- Pooled LOA Calculation: Compute population LOA as δ ± 2√(σ² + τ²) [122].
- Heterogeneity Assessment: Evaluate variability between studies using appropriate metrics (I², Q-statistic).
Note: This approach generates LOA that are typically wider than those reported in individual studies but more accurately represent the population of interest [122].
Data Analysis and Interpretation Framework
Quantitative Comparison of Statistical Approaches
Table 1: Comparison of Statistical Methods for Phenotyping Method Validation
| Statistical Method | What It Quantifies | Appropriate Use Cases | Limitations |
|---|---|---|---|
| Pearson's r | Strength of linear relationship between two methods | Preliminary assessment of whether methods measure the same underlying trait | Does not indicate agreement; cannot assess precision; misleading in method comparison [102] [120] |
| Limits of Agreement (LOA) | 95% prediction interval for differences between methods | Determining if new method can replace gold-standard in clinical/decision contexts | Does not test which method is more variable; potentially misleading binary judgment [102] |
| Variance Comparison (F-test) | Ratio of variances between two methods | Determining which method is more precise; essential for method validation [120] | Requires repeated measurements of same subject; often neglected in experimental designs [120] |
| Bias Comparison (t-test) | Systematic difference between method means | Assessing whether methods yield comparable average results | Does not provide information about precision or agreement [120] |
Decision Framework for Method Selection
Table 2: Interpretation Guidelines for Method Comparison Studies
| Statistical Outcome | Interpretation | Recommended Action |
|---|---|---|
| Non-significant bias, Non-significant variance difference | Methods are equivalent in both accuracy and precision | New method can replace old method outright |
| Significant bias, Non-significant variance difference | Methods have different accuracy but similar precision | New method can be used with correction factor (calibration) |
| Non-significant bias, Significant variance difference | Methods equally accurate but differ in precision | Adopt more precise method; reject less precise method |
| Significant bias, Significant variance difference | Methods differ in both accuracy and precision | Comprehensive evaluation needed; may require method rejection |
Visualization of Experimental Workflows
Method Comparison Statistical Pathway
Statistical Analysis Pathway: This workflow illustrates the parallel assessment of bias, variance, and limits of agreement for comprehensive method evaluation.
High-Throughput Phenotyping Screening Pipeline
Phenotyping Screening Pipeline: Integrated workflow from sample preparation through statistical validation for robust phenotyping method development.
Research Reagent Solutions for High-Throughput Phenotyping
Table 3: Essential Materials and Reagents for Phenotyping Method Validation
| Reagent/Technology | Function | Example Applications |
|---|---|---|
| Lidar Scanner | Non-contact distance measurement using laser pulses | Canopy height measurement, plant architecture quantification [102] [120] |
| Hyperspectral Imaging Systems | Capture spectral data across multiple wavelengths | Predicting photosynthetic capacity from leaf scans [120] |
| Tierpsy Tracker Software | Automated feature extraction from video data | C. elegans behavioral phenotyping, movement analysis [105] |
| Flow Cytometry Platform | Multiparametric single-cell analysis | Tumor cell phenotyping, immune cell profiling in co-culture systems [91] |
| CNN-Transformer Models | Deep learning-based video analysis | C. elegans behavioral classification, subtle phenotype detection [105] |
The integration of proper statistical comparisons using variance tests and LOA represents a critical advancement for high-throughput phenotyping robustness screening. By moving beyond correlation-based approaches that have potentially led to numerous incorrect conclusions about method quality, researchers can make more informed decisions about method adoption [102] [120]. The protocols outlined herein provide a standardized framework for generating reliable, reproducible conclusions in method comparison studies.
Implementation of these approaches requires careful experimental design, particularly ensuring repeated measurements of the same subjects to enable variance comparison [120]. Additionally, researchers should recognize that LOA and variance comparisons provide complementary information—while LOA helps determine whether a new method can replace an old one for decision-making purposes, variance comparison directly tests which method is more precise, arguably the most important component of method validation [102] [120]. Adoption of these statistical techniques will help accelerate the adoption of new high-throughput phenotyping techniques by providing clear criteria for when to reject a new method, outright replace an old method, or conditionally use a new method with appropriate calibration.
Conclusion
Robust high-throughput screening is not merely a matter of throughput but of rigorous, validated methodology. By integrating foundational principles with optimized assay design, proactive troubleshooting, and sophisticated statistical validation, researchers can significantly enhance the reliability of their phenotyping data. The future of HTS lies in the deeper integration of AI and machine learning for data analysis and predictive modeling, the increased use of more physiologically relevant models like organoids, and the adoption of standardized statistical frameworks that allow for meaningful cross-study comparisons. These advancements will be pivotal in closing the current gap between high-volume screening and high-confidence lead generation, ultimately delivering safer and more effective therapeutics to the clinic faster.
References
- 1. What Is High Throughput Screening? [https://www.corning.com/worldwide/en/products/life-sciences/resources/stories/at-the-bench/what-is-high-throughput-screening-and-how-is-it-evolving.html]
- 2. High Throughput Screening Market [https://www.futuremarketinsights.com/reports/high-throughput-screening-market]
- 3. Ultra High Throughput Screening (uHTS) Applications [https://lifesciences.danaher.com/us/en/application/high-throughput-screening-drug-discovery.html]
- 4. High-Throughput Screening - Drug Discovery [https://www.technologynetworks.com/drug-discovery/articles/high-throughput-screening-principles-applications-and-advancements-405121]
- 5. Application and prospects of high-throughput screening for in ... [https://pmc.ncbi.nlm.nih.gov/articles/PMC9244953/]
- 6. Advances in ultrahigh-throughput screening technologies ... [https://www.sciencedirect.com/science/article/abs/pii/S0167779923000914]
- 7. High Throughput Screening Market Forecast, 2025-2032 [https://www.coherentmarketinsights.com/industry-reports/high-throughput-screening-market]
- 8. High-Throughput Screening Market: Transforming Drug ... [https://blog.bccresearch.com/high-throughput-screening-market-transforming-drug-discovery]
- 9. United States High-Throughput Screening (HTS) Market ... [https://www.openpr.com/news/4251173/united-states-high-throughput-screening-hts-market-2025]
- 10. What are the applications of high-throughput screening? [https://synapse.patsnap.com/article/what-are-the-applications-of-high-throughput-screening]
- 11. A Comprehensive Review of High Throughput ... [https://pmc.ncbi.nlm.nih.gov/articles/PMC9590503/]
- 12. Robustness quantification of a mutant library screen ... [https://pmc.ncbi.nlm.nih.gov/articles/PMC11298085/]
- 13. Pitfalls and potential of high-throughput plant phenotyping ... [https://pmc.ncbi.nlm.nih.gov/articles/PMC10481964/]
- 14. plant phenotyping systems Analysis 2025 and Forecasts ... [https://www.archivemarketresearch.com/reports/plant-phenotyping-systems-579640]
- 15. Robotics in Drug Discovery Market Emerging Trends by 2034 [https://www.towardshealthcare.com/insights/robotics-in-drug-discovery-market-sizing]
- 16. Development of a robust and quantitative high-throughput ... [https://www.sciencedirect.com/science/article/pii/S2215016123000948]
- 17. Challenges and the Advancement in High-Throughput ... [https://www.preprints.org/manuscript/202310.1708]
- 18. Plant Phenotyping Systems Market Trends by Region 2025 ... [https://www.linkedin.com/pulse/plant-phenotyping-systems-market-trends-xhpyc/]
- 19. High Throughput Screening Assays for Drug Discovery [https://bellbrooklabs.com/high-throughput-screening-assays-drug-discovery/?srsltid=AfmBOoppBFn70aS5intqNF3ve4ioqRrRD9Ax0ipYZ_AB4EfNFE0vdpbI]
- 20. A high-throughput differential chemical genetic screen ... [https://pmc.ncbi.nlm.nih.gov/articles/PMC12032938/]
- 21. A robust bacterial high-throughput screening assay to ... [https://www.sciencedirect.com/science/article/abs/pii/S0014299925008027]
- 22. A Review of High-Throughput Field Phenotyping Systems [https://www.sciencedirect.com/science/article/pii/S2643651524000979]
- 23. Robotic Technologies for High-Throughput Plant ... [https://www.frontiersin.org/journals/plant-science/articles/10.3389/fpls.2021.611940/full]
- 24. What's New in the ANSI/A3 R15.06-2025 Robot Safety ... [https://blog.ansi.org/ansi/ansi-a3-r15-06-2025-robot-safety/]
- 25. Robotic assembly: An updated 2025 guide to automation [https://standardbots.com/blog/how-to-successfully-introduce-robotic-assembly-to-your-production-line]
- 26. Understanding Robotic Guidance Machine Vision Systems ... [https://www.unitxlabs.com/resources/robotic-guidance-machine-vision-2025/]
- 27. Robot Communication Protocols: A Comprehensive Guide [https://thinkrobotics.com/blogs/learn/robot-communication-protocols-a-comprehensive-guide?srsltid=AfmBOopzM4zseOo8AP72__ZY0l96PlAlpwiCA8eCRYt5iFXrvQpfAA0p]
- 28. Developing Robust In Vitro Cell-Based Assays for High ... [https://www.marinbio.com/developing-robust-in-vitro-cell-based-assays-for-high-throughput-screening-hts/]
- 29. Inside ELRIG's Drug Discovery 2025 [https://www.drugtargetreview.com/article/190237/inside-elrigs-drug-discovery-2025/]
- 30. Robust Analysis of High Throughput Screening (HTS) Assay ... [https://pmc.ncbi.nlm.nih.gov/articles/PMC3727440/]
- 31. A high-throughput differential chemical genetic screen ... [https://www.sciencedirect.com/science/article/pii/S2589004225006364]
- 32. High-Throughput Screening Meets AI and 3D Models [https://www.technologynetworks.com/drug-discovery/articles/how-high-throughput-screening-is-transforming-modern-drug-discovery-405922]
- 33. Stem Cells and Organoids: A Paradigm Shift in Preclinical ... [https://pmc.ncbi.nlm.nih.gov/articles/PMC12299584/]
- 34. AI-powered high-throughput digital colony picker platform ... [https://www.nature.com/articles/s41467-025-63929-7]
- 35. Integrating artificial intelligence and high-throughput ... [https://www.sciencedirect.com/science/article/pii/S2095311923003611]
- 36. HCS-3DX, a next-generation AI-driven automated 3D-oid ... [https://www.nature.com/articles/s41467-025-63955-5]
- 37. Beyond animal models: how organoids could transform ... [https://www.nature.com/articles/d42473-025-00219-2]
- 38. 2025 Trends: Organoids [https://www.genengnews.com/topics/genome-editing/2025-trends-organoids/]
- 39. Development of an automated 3D high content cell ... [https://www.sciencedirect.com/science/article/pii/S2472555224000443]
- 40. High Throughput Screening Assays for Drug Discovery [https://bellbrooklabs.com/high-throughput-screening-assays-drug-discovery/?srsltid=AfmBOor71X4AU6U_-o_v0Av-k6g_qOLiCeFPFS7FzbmrX1b6jfXto8I4]
- 41. The Complete Guide to Cell-Based Assays [https://www.sptlabtech.com/the-complete-guide-to-cell-based-assays]
- 42. High-Throughput Screening: today's biochemical and cell- ... [https://www.sciencedirect.com/science/article/abs/pii/S1359644620303056]
- 43. The power of sophisticated phenotypic screening and ... [https://pmc.ncbi.nlm.nih.gov/articles/PMC4779180/]
- 44. Phenotypic Screening: Methods and Protocols [https://link.springer.com/book/10.1007/978-1-4939-7847-2]
- 45. A review for cell-based screening methods in drug discovery [https://pmc.ncbi.nlm.nih.gov/articles/PMC10210057/]
- 46. Biochemical Screening - an overview [https://www.sciencedirect.com/topics/biochemistry-genetics-and-molecular-biology/biochemical-screening]
- 47. Microplate Selection and Recommended Practices in High ... [https://www.ncbi.nlm.nih.gov/books/NBK558077/]
- 48. 384-Well Microplate Market Trends 2025: Growth and Risk ... [https://www.linkedin.com/pulse/384-well-microplate-market-trends-2025-growth-risk-t5bwc/]
- 49. Choosing a Microplate [https://csc.ucsc.edu/plates/]
- 50. Alvetex Scaffold Protocol: 96 Well Plate – Instructions [https://www.reprocell.com/resources/protocols/alvetex-scaffold/d003-96-well-plate-instructions-example-applications]
- 51. Enabling 1536-Well High-Throughput Cell-Based ... [https://www.sciencedirect.com/science/article/pii/S2472555222069921]
- 52. Innovation Trends in 384-Well Microplates: Market Outlook 2025- ... [https://www.datainsightsmarket.com/reports/384-well-microplates-1729151]
- 53. Integration of Multiple Readouts into the Z′ Factor for ... [https://www.sciencedirect.com/science/article/pii/S2472555222078662]
- 54. High Throughput Screening Assays for Drug Discovery [https://bellbrooklabs.com/high-throughput-screening-assays-drug-discovery/?srsltid=AfmBOoobb_699OG5ImO26KEA-Oj3bP1lrcjsO8dQAgfmIm-FHRm5hcOL]
- 55. Comprehensive analysis of high-throughput screens with ... [https://pmc.ncbi.nlm.nih.gov/articles/PMC5001608/]
- 56. Adaptation of robust Z' factor for assay quality assessment in ... [https://pubmed.ncbi.nlm.nih.gov/32224158/]
- 57. Small Compound Screening Overview [https://www.tdi.ox.ac.uk/research/research/cellular-high-throughput-screening-hts/cellular-hts/small-compound-screening-overview]
- 58. Improving Detection of Rare Biological Events in High- ... [https://www.sciencedirect.com/science/article/pii/S2472555222071854]
- 59. High-throughput phenotyping reveals expansive genetic and ... [https://pmc.ncbi.nlm.nih.gov/articles/PMC7338221/]
- 60. The PhenoLab – an automated, high-throughput ... [https://www.sciencedirect.com/science/article/pii/S2772375525000784]
- 61. High-throughput physiological phenotyping of crop ... [https://www.sciencedirect.com/science/article/pii/S0378429024002600]
- 62. Compound Management for Quantitative High-Throughput ... [https://www.sciencedirect.com/science/article/pii/S1535553507003541]
- 63. Screening | VICB - Vanderbilt School of Medicine [https://medschool.vanderbilt.edu/vicb/hts/services-copy/]
- 64. High Throughput Screening [https://www.sygnaturediscovery.com/drug-discovery/bioscience/screening/high-throughput-screening-hts-2/]
- 65. A robust high-throughput screening system to assess ... [https://www.nature.com/articles/s41598-024-72360-9]
- 66. Robustness comparison of three statistical methods ... [https://link.springer.com/article/10.1007/s00769-025-01669-3]
- 67. Principles of early drug discovery - PMC - PubMed Central [https://pmc.ncbi.nlm.nih.gov/articles/PMC3058157/]
- 68. High-Throughput Screening to Advance In Vitro Toxicology [https://pmc.ncbi.nlm.nih.gov/articles/PMC10822017/]
- 69. High-Throughput Toxicology [https://www.epa.gov/chemical-research/high-throughput-toxicology]
- 70. High Throughput Screening Assays for Drug Discovery [https://bellbrooklabs.com/high-throughput-screening-assays-drug-discovery/?srsltid=AfmBOopnld6EmCu5n72mHAUhsqEBALc2IzUHzE44igWW_uI6qHlSOs4G]
- 71. Hit Identification in Drug Discovery [https://www.vipergen.com/hit-identification-in-drug-discovery/]
- 72. Hit Identification and Optimization in Virtual Screening [https://pmc.ncbi.nlm.nih.gov/articles/PMC3772997/]
- 73. High Throughput Screening Assays for Drug Discovery [https://bellbrooklabs.com/high-throughput-screening-assays-drug-discovery/?srsltid=AfmBOop_RlrlSQVL1kLCr55PHDmIel96L2JpIGBH9cDwIbFfECCa8NiL]
- 74. A Researcher's Guide to Optimizing High-throughput ... [https://www.ranomics.com/navigating-the-hurdles-a-researchers-guide-to-optimizing-high-throughput-screens-library-design-and-protein-engineering]
- 75. Advanced Assay Development Guidelines for Image-Based ... [https://www.ncbi.nlm.nih.gov/books/NBK126174/]
- 76. Orthogonal Measurements | NIST [https://www.nist.gov/programs-projects/orthogonal-measurements]
- 77. Orthogonal and complementary measurements of ... [https://www.sciencedirect.com/science/article/pii/S016836592200863X]
- 78. Antibody Validation Essentials: Orthogonal Strategy - CST Blog [https://blog.cellsignal.com/hallmarks-of-validation-orthogonal-strategy]
- 79. High Throughput Screening Assays for Drug Discovery [https://bellbrooklabs.com/high-throughput-screening-assays-drug-discovery/?srsltid=AfmBOopfhGCT_UuDH9V_C0Bo3cI_bsZF8U4IB5mldGI0N3xvZ7r3oRF2]
- 80. Feasibility and clinical utility of expanded genomic ... [https://www.nature.com/articles/s41591-025-03945-8]
- 81. Orthogonal approaches to AAV vector characterization [https://pmc.ncbi.nlm.nih.gov/articles/PMC12329248/]
- 82. for optimizing Best processes practices Cell Line Development [https://spherebio.com/resource/best-practices-for-optimizing-cell-line-development-processes/]
- 83. How to Maximize Efficiency in Cell-Based High-Throughput ... [https://www.creative-bioarray.com/how-to-maximize-efficiency-in-cellbased-highthroughput-screening.htm]
- 84. Expert Cell Culture Techniques for Bioanalytical Assays | MarinBio [https://www.marinbio.com/services/art-of-cell-culture-key-considerations/]
- 85. Improving drug discovery with high-content phenotypic ... [https://pmc.ncbi.nlm.nih.gov/articles/PMC4844861/]
- 86. High Throughput Screening Assays for Drug Discovery [https://bellbrooklabs.com/high-throughput-screening-assays-drug-discovery/?srsltid=AfmBOoo01r-kd2lShCk3j0HT9ect7G0jM_Ipui2PRYRBlRIKrMSjrwVM]
- 87. Comparison of Three Different Methods for Determining ... [https://pmc.ncbi.nlm.nih.gov/articles/PMC5091975/]
- 88. Comparison of cell-based assays to quantify treatment ... [https://www.nature.com/articles/s41598-018-34696-x]
- 89. Affordable Phenotyping at the Edge for High-Throughput ... [https://www.sciencedirect.com/science/article/pii/S2643651524002486]
- 90. Prediction of harvest-related traits in barley using high- ... [https://www.frontiersin.org/journals/plant-science/articles/10.3389/fpls.2025.1686506/full]
- 91. High throughput phenotyping | Cancer Drug Screening [https://www.championsoncology.com/2025aacr-high-throughput-phenotyping-and-drug-discovery-using-the-tumorgraft3d-co-culture-platform-and-flow-cytometry]
- 92. A General Guide for the Optimization of Enzyme Assay ... [https://www.sciencedirect.com/science/article/pii/S247255522206779X]
- 93. Interactive Design-of-Experiments: Optimizing a Cooling ... [https://arxiv.org/html/2408.12607v1]
- 94. Flexible Bayesian estimation of incubation times - PMC [https://pmc.ncbi.nlm.nih.gov/articles/PMC11815507/]
- 95. siRNA Screening Overview - Target Discovery Institute [https://www.tdi.ox.ac.uk/research/research/cellular-high-throughput-screening-hts/cellular-hts/sirna-screening-overview]
- 96. A robust bacterial high-throughput screening system to ... [https://www.nature.com/articles/s41598-022-23702-y]
- 97. Virtual plates: Getting the best out of high content screens [https://www.sciencedirect.com/science/article/pii/S2472555223000825]
- 98. Interference and Artifacts in High-content Screening - NCBI - NIH [https://www.ncbi.nlm.nih.gov/books/NBK615088/]
- 99. From dye exclusion to high-throughput screening: A review ... [https://www.sciencedirect.com/science/article/pii/S0734975025002502]
- 100. High-throughput screening for optimizing adoptive T cell ... [https://ehoonline.biomedcentral.com/articles/10.1186/s40164-024-00580-w]
- 101. Conducting correlation analysis: important limitations and pitfalls... [https://pmc.ncbi.nlm.nih.gov/articles/PMC8572982/]
- 102. To have value, comparisons of high-throughput ... [https://www.frontiersin.org/journals/plant-science/articles/10.3389/fpls.2023.1325221/full]
- 103. : Methodology, Pearson ... | Medium correlation Limitations [https://medium.com/@anthony.demeusy/pearson-correlation-methodology-limitations-alternatives-part-2-limitations-63c20b21e53b]
- 104. High Throughput Screening Assays for Drug Discovery [https://bellbrooklabs.com/high-throughput-screening-assays-drug-discovery/?srsltid=AfmBOoqQTA2ZNH6iYSFN5e3DygZfDgzv5_x4psaDpqkB_cEDIXsXJBZ_]
- 105. High-throughput behavioral screening in Caenorhabditis ... [https://www.nature.com/articles/s41598-025-10370-x]
- 106. A novel way to validate UAS-based high-throughput ... [https://pubmed.ncbi.nlm.nih.gov/33216217/]
- 107. A novel way to validate UAS-based high-throughput ... [https://link.springer.com/article/10.1007/s00122-020-03726-6]
- 108. A High-Throughput Phenotyping Pipeline for Image ... [https://www.sciencedirect.com/science/article/pii/S2643651524000396]
- 109. Design and implementation of a high-throughput field ... [https://www.sciencedirect.com/science/article/pii/S2643651525000202]
- 110. High Throughput Plant Phenotyping: Advanced Approach [https://www.plant-ditech.com/high-throughput-plant-phenotyping/]
- 111. High Throughput Screening - Centre for Medicines Discovery [https://www.cmd.ox.ac.uk/platforms/high-throughput-screening]
- 112. High-Throughput Screening Normalized To Biological ... [https://pmc.ncbi.nlm.nih.gov/articles/PMC3867592/]
- 113. Adaptation of High-Throughput Screening in Drug Discovery ... [https://pmc.ncbi.nlm.nih.gov/articles/PMC3269696/]
- 114. Advanced high-throughput plant phenotyping techniques ... [https://pmc.ncbi.nlm.nih.gov/articles/PMC8721248/]
- 115. Hit-to-Lead: Hit Validation and Assessment [https://www.sciencedirect.com/science/article/abs/pii/S0076687918303859]
- 116. High Throughput Screening (HTS) Services [https://www.evotec.com/solutions/drug-discovery-preclinical-development/discovery/hit-identification-services/high-throughput-screening-hts-services]
- 117. Hit to lead [https://en.wikipedia.org/wiki/Hit_to_lead]
- 118. High-throughput phenotyping techniques for forage [https://www.sciencedirect.com/science/article/pii/S2589721725000029]
- 119. Comparative analysis of distinct phenotyping methods for ... [https://plantmethods.biomedcentral.com/articles/10.1186/s13007-025-01402-8]
- 120. To have value, comparisons of high-throughput phenotyping ... [https://pmc.ncbi.nlm.nih.gov/articles/PMC10835710/]
- 121. To have value, comparisons of high-throughput ... [https://pubmed.ncbi.nlm.nih.gov/38312358/]
- 122. A Framework for the Meta-Analysis of Bland-Altman ... [https://pmc.ncbi.nlm.nih.gov/articles/PMC5585060/]