Energy Consumption Analysis: Deep Water Culture vs. Nutrient Film Technique for Controlled Environment Agriculture
This article provides a comprehensive, evidence-based analysis of the energy consumption profiles of Deep Water Culture (DWC) and Nutrient Film Technique (NFT) hydroponic systems.
Energy Consumption Analysis: Deep Water Culture vs. Nutrient Film Technique for Controlled Environment Agriculture
Abstract
This article provides a comprehensive, evidence-based analysis of the energy consumption profiles of Deep Water Culture (DWC) and Nutrient Film Technique (NFT) hydroponic systems. Tailored for researchers and agricultural scientists, it explores the foundational principles, operational methodologies, and key performance indicators such as Energy Use Efficiency (EUE). The content delves into troubleshooting common energy-related failures and presents comparative data on yield, resource efficiency, and environmental impact, including findings from systems integrated with renewable energy. The analysis aims to guide the selection and optimization of hydroponic systems for sustainable, energy-resilient agricultural research and development.
Understanding System Fundamentals and Core Energy Drivers in DWC and NFT
Deep Water Culture (DWC) is a hydroponic method characterized by suspending plant roots in a continuously oxygenated, nutrient-rich water solution [1] [2]. Unlike traditional soil-based agriculture or other hydroponic systems, DWC provides direct access to water, nutrients, and oxygen, which are the three critical elements for plant growth [2]. This system is renowned for its simplicity and efficiency, making it a valuable tool for both commercial food production and scientific research where controlled plant growth is required [3]. In the context of energy consumption research, understanding DWC's operational principles is fundamental for comparing its performance against other systems like the Nutrient Film Technique (NFT) and for identifying key areas for energy optimization [1] [4].
The core principle of DWC is the maintenance of a deep reservoir of nutrient solution, which provides a stable root zone environment and a large buffer for nutrients and pH [1]. This stability is a key differentiator from other hydroponic systems and has direct implications for both energy use and management intensity. The following sections will dissect the system's operation, its energy-consuming components, and present experimental data comparing its performance with NFT.
Principles of System Operation
A Deep Water Culture system operates on a straightforward principle: plant roots are fully submerged in a nutrient solution that is kept sufficiently oxygenated to prevent suffocation and promote healthy growth [1] [2]. The system's design and operation can be broken down into several key components and processes.
Core System Components and Workflow
The fundamental workflow of a DWC system involves a coordinated operation of its physical components to maintain the optimal root zone environment. The diagram below illustrates the logical relationship and flow of energy and materials within a standard DWC setup.
Detailed Functional Description
The Reservoir: This is a large tank or pond that holds a substantial volume of nutrient solution [1]. The depth and volume of this reservoir are what define "Deep" Water Culture. A large water volume provides high thermal mass, which stabilizes the root zone temperature against ambient fluctuations [1]. It also acts as a buffer, diluting any rapid changes in nutrient concentration or pH, which reduces the frequency of managerial adjustments [1].
Plant Support Structure: Plants are held above the reservoir, typically by a floating raft (e.g., Styrofoam) or a lid, with their roots extending down into the solution through net pots [1]. This setup ensures that the crown of the plant (where the stem meets the roots) remains dry to prevent rot, while the root system has full access to the water below.
The Aeration System: This is the most critical operational component. It consists of one or more air pumps connected via tubing to air stones placed at the bottom of the reservoir [1] [2]. The air pumps force atmospheric air through the stones, which break the air into fine bubbles. These bubbles rise through the water column, dissolving oxygen into the solution. This constant oxygenation is vital for root respiration; without it, the roots would quickly deplete the dissolved oxygen and drown, leading to root rot and plant death [1] [2].
The operation is largely passive for the plant, which directs its energy into growth rather than searching for water or nutrients. However, the system requires active mechanical components, primarily the aeration system, to maintain this ideal environment, which directly translates to energy consumption.
Primary Energy-Consuming Components
The energy consumption in a DWC system is predominantly tied to its electromechanical components, which are essential for maintaining the life-supporting conditions for the plants. The primary energy draw comes from the systems responsible for oxygenating the water and, in many controlled environments, managing the temperature of the nutrient solution.
Aeration System: The Primary Energy Load
The air pump is the heart of the DWC system and its most consistent energy consumer [1] [2]. It must run continuously, 24 hours a day, to ensure a constant supply of oxygen to the submerged roots. The energy consumption of the air pump is a direct function of its power rating (Watts) and the runtime. While individual air pumps for a small system may consume relatively little power (e.g., 3-10 Watts), commercial-scale operations require large, powerful air pumps or multiple distributed pumps to oxygenate vast volumes of water, leading to a significant cumulative energy load [1].
Water Temperature Control Systems
Although not always mandatory, temperature control is often a major secondary energy consumer, especially in non-ideal climates. The large volume of water in a DWC system is slow to change temperature, which is a benefit in mild environments [1]. However, if the solution becomes too warm, it holds less dissolved oxygen and can promote pathogenic growth. Conversely, cold water can slow plant metabolism. Therefore, commercial installations often use water chillers or heaters to maintain an optimal root zone temperature (typically 18-22°C) [1]. These devices are highly energy-intensive, and their consumption can easily surpass that of the air pumps, particularly in larger reservoirs or extreme climates.
Supporting Systems in Controlled Environments
In indoor plant factories or greenhouses, the energy for the DWC system itself must be considered alongside the facility's overall energy footprint. This includes LED grow lights [4], which can have a high photon output (e.g., PPF of 200 µmol·s⁻¹) and long photoperiods (e.g., 16-18 hours daily), water circulation pumps for Recirculating Deep Water Culture (RDWC) systems, and environmental control systems (HVAC) [1] [3]. While not exclusive to DWC, these components constitute the largest share of energy use in a controlled environment agriculture facility and are critical for an accurate energy comparison between hydroponic systems.
Comparative Experimental Data: DWC vs. NFT
Direct experimental comparisons between DWC and NFT provide critical, data-driven insights into their performance, particularly regarding energy efficiency and growth metrics. The following tables summarize key quantitative findings from recent scientific studies.
Table 1: Growth and Yield Parameters of Lettuce in DWC vs. NFT (Greenhouse Study) This data is sourced from a peer-reviewed study comparing DWC and NFT in a greenhouse setting [5].
| Parameter | DWC | NFT | Difference (NFT relative to DWC) |
|---|---|---|---|
| Leaf Area | Baseline | Higher | +13.0% |
| Fresh Yield | Baseline | Higher | +22.8% |
| Dry Yield | Baseline | Higher | +27.7% |
| Total Chlorophyll | Baseline | Lower | -5.2% |
| Total Carotenoids | Baseline | Lower | -41.0% |
| Total Water Consumption | Baseline | Higher | +9.6% |
Table 2: Energy-Use Efficiency (EUE) in a Controlled Environment Plant Factory This data comes from a controlled study using artificial lighting, measuring EUE in grams of fresh weight per kilowatt-hour (g/kWh) [4].
| System | Energy-Use Efficiency (EUE) | Shoot Fresh Weight | Leaf Area | Root Length |
|---|---|---|---|---|
| Nutrient Film Technique (NFT) | 31.3 g/kWh | Significantly Higher | Significantly Larger | Significantly Longer |
| Deep Water Culture (DWC) | 24.53 g/kWh | Significantly Lower | Significantly Smaller | Significantly Shorter |
Experimental Protocols for Key Studies
To ensure reproducibility and provide clarity on the data's origin, the methodologies from the core comparative studies are detailed below.
Protocol 1: Energy-Use Efficiency (EUE) Experiment [4]
- Objective: To compare the EUE of NFT and DWC systems for lettuce (Lactuca sativa L. 'Little Gem') production in a controlled environment.
- Plant Material & Germination: Seeds were germinated in growth chambers maintained at an ambient temperature of 18°C for 21 days.
- System Setup & Transplanting: Seedlings were transplanted in rockwool cubes and placed in NFT or DWC systems in equal numbers. Both systems were illuminated with LED irradiation having a Photosynthetic Photon Flux (PPF) of 200 µmol·s⁻¹.
- Lighting Regime: A continuous photoperiod of 16 hours was provided to both systems for 5 weeks.
- Data Collection: Crop growth parameters (leaf count, plant height) were measured. Upon conclusion, shoot fresh weight, leaf area, and root length were determined. Energy consumption was monitored to calculate EUE.
Protocol 2: Growth and Phytochemical Content Experiment [5]
- Objective: To investigate differences in growth, nutrient uptake, yield, and quality of butterhead lettuce between NFT and DWC.
- Study Setting: The research was conducted in a climate-controlled greenhouse during summer months (July-August).
- Experimental Design: The study employed a replicated design with four system replicates for each hydroponic type. Each system contained nine lettuce plants.
- Data Collection: Throughout the study, photosynthetic properties were monitored. At harvest, parameters including leaf area, fresh yield, dry yield, and concentrations of total chlorophyll and carotenoids were analyzed. Water consumption and nutrient uptake were also measured.
The Researcher's Toolkit: Essential Materials and Reagents
For scientists seeking to replicate DWC and NFT experiments or conduct their own comparative research, a standardized set of materials and reagents is required. The following table details key items and their functions in a typical experimental setup.
Table 3: Key Research Reagent Solutions and Essential Materials
| Item | Function in Hydroponic Research |
|---|---|
| Hydroponic Nutrient Solution | Provides all essential macro-nutrients (N, P, K, Ca, Mg, S) and micro-nutrients (Fe, Mn, B, Zn, Cu, Mo, Cl) for plant growth. Formulations are often adjusted for specific crop types and growth stages. |
| pH Adjustment Kit (pH Up/Down solutions, pH meter) | Critical for maintaining nutrient solution pH within an optimal range (typically 5.5-6.5) to ensure all nutrients remain soluble and available for plant uptake. |
| Electrical Conductivity (EC) Meter | Measures the total dissolved salts (nutrient concentration) in the solution, allowing researchers to monitor nutrient strength and maintain consistent experimental conditions. |
| Dissolved Oxygen Meter | Essential for quantifying oxygen levels in DWC reservoirs, verifying aeration system performance, and ensuring root zone health. |
| Rockwool or Peat Plugs | Serve as an inert substrate for seed germination and initial seedling development before transplanting into the main hydroponic systems. |
| Net Pots | Hold the growing medium and plant, providing structural support while allowing roots to grow through into the nutrient solution below. |
| Air Pumps & Air Stones | The core aeration system for DWC, responsible for oxygenating the nutrient solution to prevent root anoxia. |
| Water Pumps | Used in NFT systems to create a continuous flow of the nutrient film and in RDWC systems to circulate solution between tanks. |
| LED Grow Lights | Provide a consistent and controllable light source for plant growth in indoor or climate-controlled studies, with defined PPF and photoperiod. |
| Data Loggers | Automate the monitoring and recording of environmental parameters such as temperature, humidity, and light levels over time. |
Deep Water Culture is defined by its operational simplicity, using a deep, oxygenated reservoir to support plant roots. Its primary energy-consuming components are the aeration system and, critically, water temperature control systems [1]. When compared directly to the Nutrient Film Technique (NFT), the energy profile of each system reveals a key trade-off.
Experimental data indicates that NFT can demonstrate superior Energy-Use Efficiency (EUE), producing more biomass per unit of energy input in controlled environments [4]. NFT also often leads to higher fresh and dry weight yields for crops like lettuce [5]. However, DWC offers a significant operational advantage: resilience. The large water volume provides a buffer against equipment failure. In a power outage, DWC roots remain submerged, giving growers a longer window (hours or even days) to rectify the issue before oxygen depletion becomes critical, whereas NFT's thin film can dry out rapidly, leading to crop loss within hours [1].
Therefore, the choice between DWC and NFT is not a simple matter of which system is more "energy-efficient." For a researcher or commercial grower, the decision must balance measured energy efficiency against operational risk tolerance and crop selection. DWC's stability and suitability for a wider range of crops, including larger fruiting plants, may justify its energy cost in many research and commercial contexts, particularly where system resilience is a priority [1].
Within the realm of controlled environment agriculture (CEA), hydroponic systems offer a soil-less method for plant cultivation, with the Nutrient Film Technique (NFT) and Deep Water Culture (DWC) representing two prominent approaches. A critical aspect of their design and operation, particularly within the context of commercial scalability and environmental impact, is their energy consumption profile. This guide provides an objective comparison of NFT and DWC systems, with a focused analysis on their principles of operation and the identification of their primary energy-consuming components. The performance of each system is evaluated based on operational data, energy demands, and suitability for different crop types, providing researchers with a clear framework for selection and optimization.
Principles of Operation and System Architecture
Nutrient Film Technique (NFT)
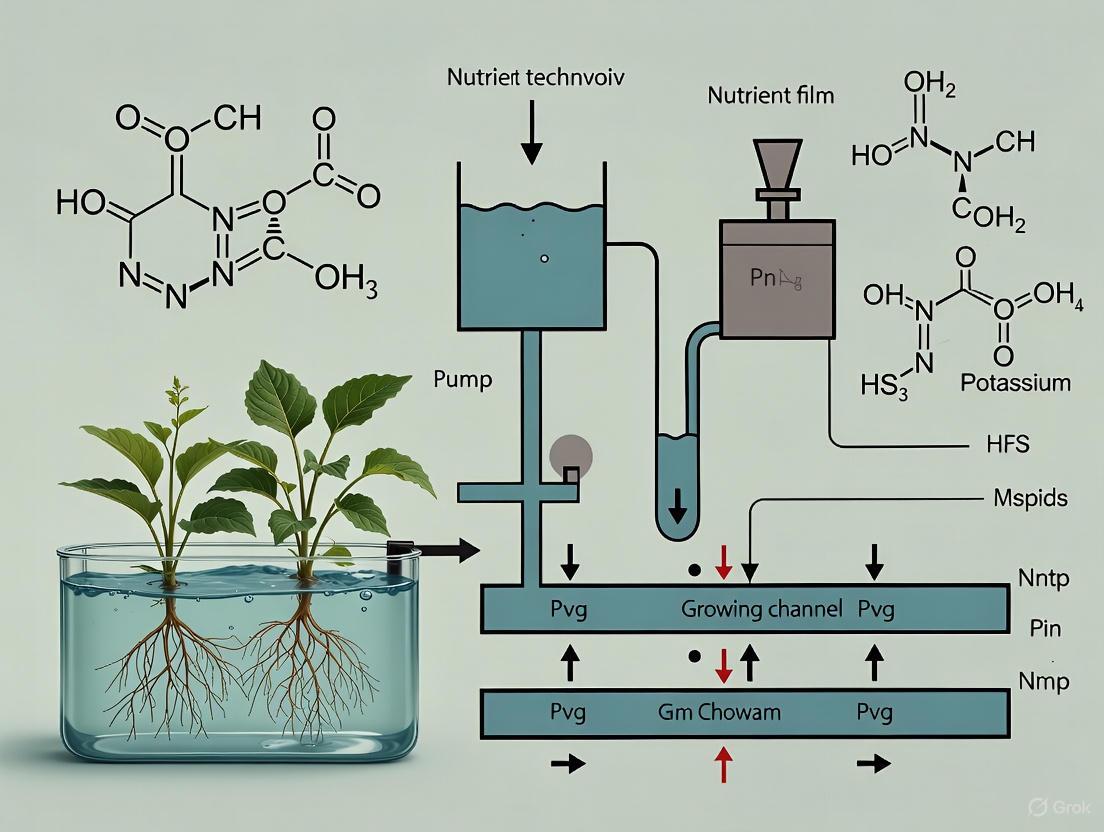
The Nutrient Film Technique operates on the principle of a continuous, shallow flow of nutrient solution over plant roots. In an NFT system, plants are supported in sloped channels, typically made of food-grade plastic, with their root systems suspended in the channel [6] [7]. A thin film of nutrient-rich water is pumped from a reservoir to the higher end of the channel and flows by gravity down the slope, creating a shallow stream that bathes the roots before being recirculated back to the reservoir [1]. This design ensures that the roots have simultaneous access to nutrients from the water film and oxygen from the air-filled portion of the channel, promoting efficient nutrient uptake and healthy plant growth [7]. The system's core components include the growing channels, a nutrient reservoir, a water pump, and tubing for circulation [7]. A key operational requirement is the maintenance of a consistent flow; even brief interruptions can rapidly lead to root drying and plant stress [1].
Deep Water Culture (DWC)
In contrast, Deep Water Culture submerges plant roots entirely within a well-oxygenated nutrient solution. Plants are held in net pots secured on floating rafts (such as Styrofoam) or lids that cover a deep reservoir [1]. The defining feature and most critical component of a DWC system is its aeration system, which consists of one or more air pumps and air stones that continuously bubble oxygen into the nutrient solution [1] [8]. This constant oxygenation is vital to prevent root suffocation and support plant metabolism. The large volume of water in the DWC reservoir provides a stable root environment, acting as a significant buffer against rapid fluctuations in nutrient concentration, pH, and temperature [1] [8]. This inherent stability makes DWC more forgiving to short-term technical failures compared to NFT.
Primary Energy-Consuming Components
The energy consumption profiles of NFT and DWC systems differ significantly due to their distinct operational principles. The following table summarizes their primary energy-consuming components and key characteristics.
Table 1: Primary Energy-Consuming Components in NFT and DWC Systems
| System Component | Role in NFT Systems | Role in DWC Systems | Criticality of Operation |
|---|---|---|---|
| Water Pump | Continuously circulates the nutrient film through the channels [7]. | Not always used; some DWC systems are non-circulating [1]. | High for NFT: Pump failure leads to rapid root drying and crop loss [1]. |
| Air Pump | Optional; sometimes used to oxygenate the reservoir [7]. | Essential for oxygenating the entire root zone [1]. | High for DWC: Failure leads to oxygen depletion, but root submersion provides a longer buffer time [1]. |
| Water Chiller/Heater | May be required due to low water volume's sensitivity to ambient temperature [1]. | Often required to manage temperature in the large water volume [1]. | Medium to High for both, dependent on climate and system scale. |
| Environmental Control | Lighting, climate control, and ventilation are major energy costs for both systems [1]. | Lighting, climate control, and ventilation are major energy costs for both systems [1]. | High for both in controlled environment agriculture. |
Performance Comparison and Experimental Data
Direct experimental comparisons of NFT and DWC reveal differences in yield, resource use, and vulnerability to physiological disorders. A study on lettuce (Lactuca sativa L.) highlighted DWC's inherent stability, showing less fluctuation in nutrient concentration and root zone temperature compared to NFT [8]. The same research also investigated tipburn, a calcium-related disorder, and found that a modified Split-Root NFT (SR-NFT) system could manipulate nutrient delivery to increase yield or reduce tipburn incidence [8]. The following table summarizes key performance metrics based on experimental findings and commercial observations.
Table 2: Experimental and Commercial Performance Data for NFT and DWC
| Performance Metric | Nutrient Film Technique (NFT) | Deep Water Culture (DWC) |
|---|---|---|
| Water & Nutrient Use | Highly efficient; minimal use due to recirculation [1]. | Higher initial use due to large reservoir volume; also recirculated in commercial setups [1]. |
| Yield Potential (e.g., Lettuce) | High for suitable crops [1]. SR-NFT showed a 15% increase in shoot fresh weight vs. conventional NFT [8]. | High; well-managed systems can achieve yields comparable to NFT for shared crops [1]. |
| Temperature Stability | Low water volume is sensitive to ambient air temperature changes [1]. | High water volume provides a stable root zone temperature [1]. |
| Risk of Physiological Disorders | Tipburn can be an issue; SR-NFT demonstrated potential for significant tipburn reduction [8]. | Generally stable; tipburn management depends on nutrient and environmental control [8]. |
| Suitability for Larger Plants | Poor; lack of support for heavy fruiting plants [1]. | Good; can support tomatoes, peppers, and cucumbers with additional support [1]. |
Detailed Experimental Protocol: SR-NFT for Yield and Tipburn
To illustrate the experimental methodologies used in advanced NFT research, the following workflow details a protocol from a study investigating Split-Root NFT (SR-NFT) for lettuce cultivation [8].
Research Reagent Solutions and Essential Materials
The following table lists the key materials and reagents used in the cited SR-NFT experiment, which are essential for replicating or designing similar studies [8].
Table 3: Research Reagent Solutions and Essential Materials for Hydroponic Experiments
| Item | Function/Description | Example from Protocol |
|---|---|---|
| Hydroponic Fertilizer | Provides essential macro and micronutrients for plant growth. | 15 N-5 P-15 K Jack’s CA-MG LX (0.9 g∙L⁻¹) [8]. |
| pH Adjustment Kit | Maintains nutrient solution pH within optimal range for nutrient availability. | Target pH typically 5.5 - 6.5 [7]. |
| EC Meter | Measures the electrical conductivity (EC) of the nutrient solution, indicating total dissolved salts (nutrient concentration). | Used to maintain treatments at EC 0.5, 1.8, and 3.1 dS∙m⁻¹ [8]. |
| Growing Substrate | Supports seed germination and initial seedling growth. | 1-inch rockwool cubes [8]. |
| Net Cups | Hold the substrate and plant, allowing roots to grow through into the nutrient solution. | 1-inch net pots [8]. |
| Air Pump & Air Stones | Oxygenates the nutrient solution in the reservoir during seedling stage and is critical for DWC systems. | Used in the nursery stage to promote root growth [8]. |
NFT and DWC hydroponic systems present a clear trade-off between resource efficiency and operational resilience, largely dictated by their primary energy-consuming components. NFT systems, reliant on continuous water pumping, offer high water and nutrient efficiency but are vulnerable to power interruptions. DWC systems, dependent on robust aeration, provide greater buffer capacity and crop flexibility at the cost of higher water volume and potential energy for temperature control. The choice between systems for research or commercial application hinges on the specific crop requirements, local climate, economic considerations, and the availability of reliable infrastructure. Future innovations, such as the SR-NFT, demonstrate the potential for system modifications to address specific physiological challenges like tipburn, paving the way for more efficient and productive controlled environment agriculture.
Within controlled environment agriculture (CEA), optimizing energy use is critical for economic and environmental sustainability. This guide provides researchers and scientists with a standardized framework for evaluating and comparing energy performance, focusing on the application of key metrics—Energy Use Efficiency (EUE), Specific Energy, and Energy Productivity—in hydroponic systems. Using Deep Water Culture (DWC) and Nutrient Film Technique (NFT) for leafy greens as a comparative case study, we present experimental data, methodologies, and analytical tools to advance energy consumption research in plant production systems.
Agricultural production, particularly in controlled environments, is an energy-intensive process reliant on inputs for lighting, climate control, and nutrient delivery [9]. The dependency on fossil fuels for these inputs creates significant vulnerabilities, underscoring the need for precise energy metrics to optimize systems, reduce costs, and minimize environmental impact [10]. Efficient energy use is a cornerstone of sustainable agriculture, helping to reduce greenhouse gas emissions and conserve finite resources [11].
For researchers comparing systems like Deep Water Culture (DWC) and Nutrient Film Technique (NFT), a consistent application of energy metrics is essential for meaningful, reproducible comparisons. This guide defines three core metrics critical for such evaluations.
Defining Key Energy Metrics
Energy Use Efficiency (EUE)
Energy Use Efficiency (EUE) measures the effectiveness of a system in converting energy inputs into useful product output. It is a ratio of the mass of harvestable output to the total energy consumed.
- Formula: EUE = Mass of Marketable Produce (g or kg) / Total Energy Input (kWh)
- Interpretation: A higher EUE value indicates a more efficient system, as it produces more biomass per unit of energy consumed. For example, in a lettuce study, an NFT system with an EUE of 31.3 g/kWh is more energy-efficient than a DWC system with an EUE of 24.53 g/kWh [4].
Specific Energy
Specific Energy represents the inverse of EUE. It quantifies the amount of energy required to produce one unit of output.
- Formula: Specific Energy = Total Energy Input (kWh) / Mass of Marketable Produce (kg)
- Interpretation: A lower Specific Energy value is desirable, signaling that less energy is needed to produce each kilogram of crop. It is a direct indicator of the energy cost of production.
Energy Productivity
Energy Productivity is a broader metric that relates the economic value of the output to the energy input. It is particularly useful for assessing economic viability.
- Formula: Energy Productivity = Economic Value of Produce (Currency) / Total Energy Input (kWh)
- Interpretation: A higher Energy Productivity value denotes a system that generates more economic value per unit of energy consumed, integrating both biological efficiency and market factors.
Experimental Comparison: DWC vs. NFT for Lettuce Production
To illustrate the application of these metrics, we draw upon a controlled study comparing DWC and NFT systems for growing lettuce (Lactuca sativa L. 'Little Gem') [4].
Experimental Protocol & Methodology
1. Plant Material & Germination:
- Seeds: Lettuce (Lactuca sativa L. 'Little Gem').
- Germination: Seeds were placed in rockwool cubes within a growth chamber.
- Environmental Conditions: Ambient temperature of 18°C for a 21-day period.
2. System Setup & Transplanting:
- Design: The study utilized an aquaponics facility with separate, identical NFT and DWC systems.
- Transplanting: After 21 days, seedlings were transplanted into their respective systems (NFT channels and DWC rafts) in equal numbers.
- Lighting: Both systems were illuminated with energy-efficient Light-Emitting Diodes (LEDs) with a Photosynthetic Photon Flux (PPF) of 200 µmol·m⁻²·s⁻¹.
- Photoperiod: A 16-hour light/8-hour dark cycle was maintained for 5 weeks.
3. Data Collection:
- Growth Parameters: Researchers measured leaf count, plant height, shoot fresh weight, leaf area, and root length at the end of the trial.
- Energy Monitoring: Total energy consumption (primarily from LED lighting and water pumps) was meticulously monitored throughout the growth cycle using energy meters.
4. Data Analysis:
- EUE was calculated for each system using the formula EUE = Total Shoot Fresh Weight (g) / Total Energy Input (kWh).
The experimental workflow from system setup to data analysis is summarized in the following diagram:
Quantitative Results and Energy Metric Comparison
The data from the experiment yielded the following results for the two systems:
Table 1: Growth and Energy Use Efficiency in Hydroponic Systems
| System | Shoot Fresh Weight (g/plant) | Total Energy Input (kWh) | Energy Use Efficiency (EUE) | Specific Energy (kWh/kg) |
|---|---|---|---|---|
| NFT | Higher [4] | Monitored [4] | 31.3 g/kWh [4] | Lower [4] |
| DWC | Lower [4] | Monitored [4] | 24.53 g/kWh [4] | Higher [4] |
The study concluded that the NFT system exhibited a significantly higher EUE (31.3 g/kWh) compared to the DWC system (24.53 g/kWh), indicating that NFT was more effective at converting electrical energy into harvestable lettuce biomass under these specific conditions [4].
Beyond EUE: A Practical System Comparison for Researchers
While EUE is a vital metric, system selection involves trade-offs across multiple operational parameters. The following diagram and table summarize the key characteristics of DWC and NFT systems from a research and development perspective.
Table 2: Operational Comparison of DWC and NFT Hydroponic Systems
| Factor | Deep Water Culture (DWC) | Nutrient Film Technique (NFT) |
|---|---|---|
| Energy & Temperature Stability | Larger water volume provides superior temperature stability and buffering against ambient fluctuations [12] [1]. | Shallow nutrient film is highly sensitive to ambient temperature changes and offers low buffering capacity [12] [1]. |
| System Reliability & Risk | Resilient to pump failure; roots remain submerged for hours/days, preventing rapid loss [12] [1]. | High risk; pump failure stops flow, roots dry out rapidly (within hours), risking total crop loss [12] [1]. |
| Disease & Maintenance | Standing water can promote waterborne pathogens; requires diligent monitoring [12]. | Exposed roots and shared water film can facilitate rapid disease spread throughout the system [1]. |
| Crop Suitability & Yield | Suitable for a wider range of plants, including larger, heavier crops like tomatoes and peppers [13] [1]. | Best suited for fast-growing, lightweight crops with small root systems (e.g., leafy greens, herbs) [13] [1]. Yield potential for these crops is high. |
| Resource Efficiency | Higher initial water volume; nutrient concentration needs monitoring in a large reservoir [12]. | Highly efficient in water and nutrient use due to recirculation and low volume [1]. |
The Scientist's Toolkit: Essential Research Reagents and Materials
For researchers aiming to replicate energy comparison studies, the following tools and materials are essential.
Table 3: Essential Research Materials for Hydroponic Energy Studies
| Item | Function in Research |
|---|---|
| LED Grow Lights | Providing controllable, energy-efficient light spectra (e.g., PPFD of 200-400 µmol·m⁻²·s⁻¹ for lettuce) with a defined photoperiod. Their efficiency is crucial for calculating energy input [4] [14]. |
| Data Loggers | Continuous monitoring of key environmental parameters, including air/water temperature, humidity, and CO₂ levels, to ensure experimental consistency and interpret results [9]. |
| Energy Meters (Kill A Watt, etc.) | Precisely measuring the total electrical energy (kWh) consumed by system components (lights, pumps, climate control) for accurate EUE calculation [4]. |
| Water/Air Pumps | Circulating nutrient solution (NFT and DWC) and oxygenating the root zone (critical in DWC). Pump specifications (e.g., wattage, flow rate) are key energy inputs [13] [1]. |
| Nutrient Solution & pH/EC Meters | Formulating the plant's nutrient environment. Consistent management of electrical conductivity (EC) and pH is vital for valid plant growth comparisons across systems [15]. |
| Hydroponic System Components | NFT: Channels, slopes, reservoir. DWC: Rafts (e.g., Styrofoam), net pots, large reservoir/tank. The design and volume of these components directly influence energy and resource use [12] [1]. |
This guide establishes a standardized approach for evaluating energy performance in agricultural systems, with a focused comparison on DWC and NFT hydroponics. The experimental data demonstrates that NFT can offer superior Energy Use Efficiency (EUE) for producing leafy greens like lettuce under controlled conditions [4]. However, the optimal system choice is context-dependent. NFT excels in resource efficiency for compatible crops, while DWC offers greater operational resilience and temperature stability, which may indirectly affect overall energy performance in non-ideal environments.
For researchers and commercial developers, the decision must integrate direct energy metrics like EUE with broader operational factors, including infrastructure costs, crop selection, local climate, and risk tolerance. Future work should focus on integrating renewable energy sources, like solar panels [14], and advanced automation to further optimize the energy footprint of controlled environment agriculture.
The interlinked challenges of water scarcity, energy demand, food security, and environmental sustainability represent one of the most critical issues facing global agricultural systems. The Water-Energy-Food-Environment (WEFE) nexus provides a holistic framework for understanding these interconnected resource systems, recognizing that actions in one domain invariably impact the others [16]. In modern agriculture, this interdependence is particularly pronounced in Controlled Environment Agriculture (CEA), where technological solutions seek to optimize production while managing resource inputs. With agriculture accounting for approximately 70% of global freshwater withdrawals and a substantial portion of energy consumption, the efficiency of these systems has profound implications for sustainable development [17]. The U.S. Department of Energy has recognized this potential, investing in CEA technologies to decarbonize agriculture while addressing four-season food production challenges [18].
Within CEA, hydroponic systems represent a significant advancement in resource-efficient food production. However, their energy consumption patterns vary considerably, particularly between two predominant systems: Deep Water Culture (DWC) and Nutrient Film Technique (NFT). This review examines these systems through the WEFE nexus lens, focusing on their energy efficiency profiles and implications for sustainable agricultural development. As global research on the FWE nexus has sharply increased since 2014, understanding these technological distinctions becomes critical for researchers, policymakers, and agricultural professionals working at the intersection of resource management and food production [17].
Hydroponic Systems within the WEFE Nexus: A Comparative Framework
System Designs and Operational Principles
The WEFE nexus emphasizes understanding how resource systems interact, making the technical operation of hydroponic systems a critical starting point for analysis.
Nutrient Film Technique (NFT): In NFT systems, plants grow in slightly sloped channels with a thin, continuous film of nutrient solution flowing along the bottom of the channel [1]. The upper roots remain exposed to air, providing oxygenation without additional aeration equipment. This system operates as a recirculating system, with water pumped from a reservoir to the high end of channels and returning via gravity [1]. NFT is particularly suited for lightweight, fast-growing crops like leafy greens, herbs, and strawberries [1].
Deep Water Culture (DWC): DWC systems suspend plant roots in a deep, oxygenated nutrient solution [1]. Plants are typically supported by rafts or lids floating on the reservoir surface. Unlike NFT, DWC requires continuous aeration through air pumps and air stones to prevent root suffocation [1]. The large volume of water in DWC systems provides greater thermal and chemical buffering capacity compared to NFT [1]. DWC can support a wider range of crops, including larger fruiting plants like tomatoes and peppers with proper support [1].
The WEFE Nexus Perspective on System Interactions
Viewing these systems through the WEFE nexus reveals their distinct resource interaction profiles:
Water-Energy Linkages: NFT typically uses less water due to its recirculating design but depends entirely on functioning water pumps [1]. DWC uses more water initially but has lower energy requirements for water circulation, though it requires energy for aeration [1].
Energy-Food Connections: Both systems can produce higher yields than traditional agriculture, but their energy efficiency per unit of production varies significantly, affecting their economic and environmental sustainability [4].
Food-Environment Interactions: The crop suitability differences between systems (NFT for leafy greens vs. DWC for larger fruiting crops) creates different environmental footprints per unit of nutritional output [1].
Experimental Comparisons: Methodologies and Protocols
Controlled Studies on Energy Use Efficiency
Recent research has employed rigorous experimental designs to quantify and compare the resource use efficiencies of NFT and DWC systems:
Energy-Use Efficiency Study Protocol [4]:
- System Design: Comparison of NFT and DWC systems within an aquaponics facility under controlled environment with artificial lighting.
- Lighting Conditions: LED irradiation with photosynthetic photon flux (PPF) of 140 µmol·s−1 during seedling stage (21 days) followed by increased PPF of 200 µmol·s−1 with 16-hour photoperiod for 5 weeks.
- Environmental Parameters: Ambient temperature maintained at 18°C during seedling stage.
- Crop Model: Lettuce (Lactuca sativa L. 'Little Gem') as the test crop, with seedlings transplanted in rockwool cubes.
- Data Collection: Growth parameters (leaf count, plant height, shoot fresh weight, leaf area, root length) measured regularly.
- Energy Monitoring: Direct energy consumption tracking with calculation of Energy Use Efficiency (EUE) as gram per kWh (g·kWh−1).
Seasonal System Performance Protocol [19]:
- Experimental Design: NFT and DWC systems established in climate-controlled greenhouse with four system replicates per design, each containing nine lettuce plants (Lactuca sativa cv. Butterhead).
- Temporal Framework: Comparative production during two growing seasons (July-August for summer conditions; October-November for fall conditions).
- Data Collection: Photosynthetic properties, growth parameters, and irrigation solution nutrient concentrations measured weekly.
- Final Harvest Metrics: Leaf area, fresh and dry yield of shoots and roots, nutritional and phytochemical concentrations.
- Environmental Monitoring: Water temperature fluctuations tracked in both systems.
Key Research Findings and Data Analysis
Table 1: Comparative Performance Metrics of NFT and DWC Hydroponic Systems
| Performance Parameter | NFT System | DWC System | Research Context |
|---|---|---|---|
| Energy Use Efficiency (EUE) | 31.3 g·kWh−1 | 24.53 g·kWh−1 | Controlled environment with artificial lighting [4] |
| Fresh Yield (Summer) | Higher | Lower | Greenhouse, summer season [19] |
| Fresh Yield (Fall) | Lower | Higher | Greenhouse, fall season [19] |
| Water Consumption | 9.6% higher | Lower | Comparative study [5] |
| Tipburn Incidence | More severe | Less severe | Summer growing conditions [19] |
| Antioxidant Concentrations | Lower | Higher (9.4-40.6%) | Varies by specific compound [19] |
| Temperature Buffering | Low | High | Greater fluctuation in NFT [19] |
| Crop Flexibility | Limited to lighter crops | Supports larger plants | Commercial assessment [1] |
Table 2: Resource Use Efficiency and Operational Considerations
| Parameter | NFT System | DWC System |
|---|---|---|
| Water Use Efficiency | High efficiency [1] | Moderate efficiency [1] |
| Nutrient Use Efficiency | High efficiency [15] | Moderate efficiency [15] |
| Initial Investment Cost | Channel infrastructure [1] | Tank/aeration infrastructure [1] |
| Failure Resilience | Low (rapid drying if pump fails) [1] | Moderate (roots remain submerged) [1] |
| System Management | Precision required for pH/EC [1] | Stability management for large volume [1] |
| Labor Requirements | Pump and clog monitoring [1] | Aeration and volume checks [1] |
Visualization of WEFE Nexus Interactions and Experimental Framework
WEFE Nexus Interconnections in Hydroponic Systems
Diagram 1: WEFE Nexus Interconnections in Hydroponic Systems. This diagram illustrates the resource interactions between NFT and DWC systems within the Water-Energy-Food-Environment nexus framework.
Experimental Protocol for Energy Efficiency Analysis
Diagram 2: Experimental Protocol for Energy Efficiency Analysis. This workflow outlines the methodological approach for comparing energy and resource use efficiency between NFT and DWC hydroponic systems.
The Scientist's Toolkit: Essential Research Reagents and Materials
Table 3: Essential Research Materials for Hydroponic System Analysis
| Research Tool | Specification/Function | Application in WEFE Nexus Research |
|---|---|---|
| LED Lighting Systems | PPF 140-200 µmol·s⁻¹, adjustable spectra [4] | Controlled photosynthesis studies, energy efficiency measurement |
| Water Quality Sensors | pH, EC, temperature, dissolved oxygen [19] | Monitoring resource use efficiency and system stability |
| Nutrient Solution Formulations | Balanced macro/micronutrients (e.g., Resh solution) [20] | Standardized plant nutrition across experimental conditions |
| Climate Control Systems | Temperature, humidity, CO₂ regulation [4] | Maintaining consistent environmental conditions for comparison |
| Photosynthesis Measurement | Portable photosynthesis systems [19] | Assessing plant physiological response to system designs |
| Biochemical Analysis Kits | Chlorophyll, carotenoids, antioxidant capacity [19] | Quantifying crop quality and nutritional value |
| Data Logging Systems | Continuous monitoring of energy/water use [4] | Precise resource consumption tracking for efficiency calculations |
| Hydroponic System Components | Channels (NFT), Tanks (DWC), Aeration systems [1] | Experimental infrastructure for system comparison studies |
Discussion: Implications for Sustainable Agricultural Development
Energy Efficiency and System Selection
The experimental data demonstrates a significant advantage in Energy Use Efficiency (EUE) for NFT systems (31.3 g·kWh−1) compared to DWC (24.53 g·kWh−1) in controlled environments [4]. This efficiency advantage positions NFT favorably within the energy component of the WEFE nexus, particularly for operations where energy costs represent a substantial portion of operational expenses. However, this advantage must be balanced against other nexus considerations, including DWC's superior temperature buffering capacity [19] and crop flexibility [1].
The seasonal variations in system performance further complicate this analysis. DWC systems demonstrated better fresh yield in fall conditions, while NFT performed better in summer [19]. This temporal dimension highlights the importance of contextual factors in system selection and suggests that optimal WEFE nexus outcomes may require seasonal adjustments or regional adaptations rather than universal prescriptions.
WEFE Nexus Trade-offs and Synergies
The comparison between NFT and DWC reveals fundamental trade-offs within the WEFE nexus:
Water-Energy Trade-off: NFT's superior water efficiency comes with higher vulnerability to pump failures, creating an energy reliability concern [1]. DWC's larger water volume provides operational resilience but with higher initial water requirements.
Energy-Food Quality Relationship: While NFT showed advantages in energy efficiency and yield in certain conditions, DWC-grown lettuce consistently demonstrated higher antioxidant concentrations, including 9.4% higher vitamin C, 34.6% higher total carotenoids, and 40.6% higher non-acidified phenols in fall growing conditions [19]. This suggests that energy efficiency metrics must be considered alongside nutritional outcomes in comprehensive WEFE assessments.
Environmental Implications: Both systems reduce pesticide needs compared to traditional agriculture [21], but their energy consumption patterns create different environmental footprints. The integration of renewable energy sources represents a promising direction for addressing the energy dimension of both systems.
Within the WEFE nexus framework, both NFT and DWC hydroponic systems offer distinct advantages and limitations. NFT systems demonstrate superior energy use efficiency and water conservation, making them particularly suitable for operations where these resources represent primary constraints. DWC systems provide greater system resilience, crop flexibility, and in some cases, enhanced nutritional quality, at the cost of higher resource consumption.
Future research should focus on several critical directions. First, integrating renewable energy sources specifically designed for hydroponic operations could substantially improve the environmental profile of both systems. Second, developing adaptive control systems that optimize resource use based on real-time monitoring could help maximize synergy between WEFE components. Third, lifecycle assessments encompassing all nexus dimensions would provide more comprehensive sustainability metrics.
For researchers and agricultural professionals, the selection between NFT and DWC requires careful consideration of local resource constraints, energy availability, climate conditions, and market demands. As the DOE's CEA Accelerator program advances [18], such informed decisions become increasingly crucial for developing sustainable agricultural systems that effectively balance the competing demands of the Water-Energy-Food-Environment nexus.
Implementing and Monitoring Energy Consumption in DWC and NFT Setups
Comparative Energy Analysis of Deep Water Culture and Nutrient Film Technique
The scientific investigation into energy consumption of Deep Water Culture (DWC) versus Nutrient Film Technique (NFT) represents a critical research domain within controlled environment agriculture (CEA). With CEA systems experiencing rapid global growth yet facing significant sustainability challenges due to their energy-intensive nature, precise comparative data is essential for advancing the field [22]. Energy constitutes the second largest operational cost in CEA, exceeded only by labor, with carbon footprints reported as 5.6–16.7 times greater than open-field agriculture for indoor vertical farms [22]. This analysis establishes standardized protocols for valid energy comparison between these dominant hydroponic systems, providing researchers with methodological frameworks and experimental benchmarks to advance sustainable CEA design.
The fundamental operational differences between DWC and NFT systems establish the basis for their divergent energy consumption profiles. DWC suspends plant roots in a deep, oxygenated nutrient solution, requiring continuous aeration through air pumps and often needing water temperature management [1]. NFT operates by circulating a thin film of nutrient solution through sloped channels, relying primarily on water pumps for continuous flow [1] [2]. This structural divergence creates distinct energy demand patterns that must be quantified through standardized experimentation to inform sustainable agricultural design.
System Configuration & Standardized Setup
Comparative System Architecture
Table 1: Standardized System Configurations for DWC and NFT Experimental Setups
| System Component | Deep Water Culture (DWC) | Nutrient Film Technique (NFT) |
|---|---|---|
| Root Zone Environment | Roots fully submerged in oxygenated nutrient solution [1] | Roots exposed to thin flowing nutrient film with upper portions aerated [1] |
| Solution Volume | Large reservoir (typically 10-20L per plant for commercial scale) [1] | Minimal solution in channels (1-2mm depth) with central reservoir [1] |
| Aeration Method | Air pumps with air stones for oxygen diffusion [1] [2] | Natural oxygenation through root exposure to air; no additional aeration required [2] |
| Flow Characteristics | Static solution with continuous bubbling [23] | Continuous flow (0.5-2.0 L/min) via water pumps [1] |
| Temperature Control | Often requires water chillers/heaters due to thermal mass [1] | Less dependent on solution temperature control [1] |
| Infrastructure | Buoyant rafts or lids supporting net pots [1] | Sloped channels (1-3% grade) with support structures [1] |
Experimental Setup Workflow
The following standardized workflow ensures valid energy comparisons between DWC and NFT systems:
Energy Consumption Metrics & Experimental Data
Quantitative Energy Performance Comparison
Table 2: Experimentally Measured Energy Performance Indicators for DWC and NFT Systems
| Performance Metric | Deep Water Culture (DWC) | Nutrient Film Technique (NFT) | Measurement Protocol |
|---|---|---|---|
| Energy-Use Efficiency (EUE) | 24.53 g/kWh [4] | 31.3 g/kWh [4] | Total fresh biomass yield per kWh energy input |
| Water Consumption | Higher baseline water usage [1] | 9.6% lower than DWC in lettuce trials [5] | Total system water volume measured weekly |
| Temperature Stability | High thermal buffering capacity [1] | Sensitive to ambient fluctuations [1] | Continuous root zone temperature logging |
| Failure Resilience | Hours to days for oxygen depletion [1] | Rapid drying (hours) during pump failure [1] | Simulated power interruption testing |
| Crop-Specific Yield | Suitable for larger plants (tomatoes, peppers) [1] | Superior for leafy greens (22.8% higher fresh weight) [5] | Destructive harvesting at physiological maturity |
| Operational Complexity | Aeration system critical [1] | Flow rate management essential [1] | Maintenance time tracking and system monitoring logs |
Experimental Protocols for Energy Comparison
Energy-Use Efficiency (EUE) Measurement Protocol
Research examining lettuce production under controlled environments demonstrated precise methodology for EUE calculation [4]. Systems are illuminated with LED irradiation having a PPF of 200 μmol·m⁻²·s⁻¹ with a 16-hour photoperiod. Power consumption meters (±1% accuracy) record energy input to all system components (pumps, aeration, environmental control). After a 5-week growth period, fresh shoot weight is measured. EUE (g/kWh) is calculated as total shoot fresh weight (g) divided by total energy consumed (kWh) [4]. This standardized approach revealed NFT superiority with 31.3 g/kWh versus 24.53 g/kWh for DWC [4].
Growth and Physiological Parameter Assessment
Studies comparing lettuce in NFT and DWC systems employ destructive harvesting at termination, measuring leaf area, fresh/dry yield, and root morphology [5]. Photosynthetic parameters including photosynthetic rate, transpiration rate, and stomatal conductance are measured using portable photosynthesis systems. Leaf nutrient analysis assesses nitrogen, phosphorus, potassium, calcium, and magnesium content [5]. Phytochemical analysis includes total chlorophyll and carotenoid extraction and spectrophotometric quantification, with DWC demonstrating 5.2% higher total chlorophyll and 41.0% higher total carotenoids despite lower biomass yield [5].
Research Toolkit: Essential Materials & Equipment
Table 3: Essential Research Reagent Solutions and Experimental Materials
| Item Category | Specific Examples | Research Function | Application Notes |
|---|---|---|---|
| Nutrient Formulations | Hoagland's solution, Hydroponic-specific blends | Standardized plant nutrition across systems | Maintain identical EC (1.8-2.2 mS/cm) and pH (5.8-6.2) in both systems [1] |
| Water Quality Agents | pH adjusters (pH Up/Down), EC standards | Solution parameter maintenance | Calibrate sensors daily; document all adjustments [23] |
| Sanitation Supplies | Hydrogen peroxide, Food-grade disinfectants | Pathogen prevention and system hygiene | Critical in recirculating systems to prevent cross-contamination [1] |
| Growth Media | Rockwool cubes, Neoprene collars, Net pots | Seedling support and establishment | Identical media across systems to isolate system effects [5] |
| Sensor Systems | Dissolved oxygen meters, pH/EC controllers, Power meters | Continuous parameter monitoring | Data logging at ≤15 minute intervals; regular calibration [24] |
| Lighting Systems | Spectrum-tuned LED arrays, PAR meters | Photosynthetic photon delivery | Maintain identical DLI across treatments; 16-hour photoperiod recommended [4] |
The standardized comparison reveals a significant energy efficiency advantage for NFT systems (31.3 g/kWh) over DWC (24.53 g/kWh) for leafy green production, establishing NFT as the preferred system for energy-conscious cultivation of appropriate crops [4]. However, DWC demonstrates complementary strengths in temperature stability, failure resilience, and suitability for larger plant species [1]. These findings underscore the critical importance of aligning system selection with specific research objectives and crop requirements.
Future research should investigate hybrid system designs that leverage the energy efficiency of NFT with the stability benefits of DWC [25]. Additionally, the integration of renewable energy sources, particularly solar PV integration which can reduce CO₂ emissions by over 94% in hydroponic operations, represents a promising direction for mitigating the environmental impact of both systems [26]. Advanced sensor networks and AI-driven controls offer further optimization potential, with demonstrated energy intensity reductions of 5-12% in commercial applications [24]. This standardized comparison framework provides the methodological foundation for such future innovations in sustainable controlled environment agriculture.
In the rigorous comparison of Deep Water Culture (DWC) and Nutrient Film Technique (NFT) hydroponic systems, the analysis of energy consumption extends beyond simple operational costs to fundamental system stability and control. For researchers and scientists, the selection between these systems dictates a distinct set of critical monitoring parameters. DWC systems, characterized by their large volumes of standing, aerated water, present specific challenges and opportunities in temperature stability and dissolved oxygen management. In contrast, NFT systems, which rely on a thin, flowing film of nutrient solution, demand meticulous tracking of electrical flow and pump dependency [12] [1]. This guide provides an objective, data-driven comparison of these parameters, framing them within the broader thesis of energy consumption in controlled environment agriculture. The subsequent data, protocols, and methodologies are designed to support informed decision-making in research and development settings.
At its core, the DWC vs. NFT comparison hinges on the principle of water volume. DWC suspends plant roots in a deep, oxygenated reservoir, creating a thermally stable and forgiving environment. NFT operates by continuously pumping a shallow stream of nutrient solution through sloped channels, offering efficiency but introducing critical single points of failure [12] [13].
The energy profile of each system is a direct consequence of its design. The table below summarizes the primary energy draws and their operational impact, which form the basis for the experimental monitoring detailed in this guide.
Table 1: Fundamental Energy Consumption Profile of DWC and NFT Systems
| System Component | Deep Water Culture (DWC) | Nutrient Film Technique (NFT) |
|---|---|---|
| Primary Energy Load | Air pumps (Aeration), Water Chillers/Heaters | Water Pumps (Circulation) |
| Energy Driver | Large water volume requiring oxygenation and temperature control | Continuous, reliable fluid flow against gravity |
| Impact of Failure | Gradual oxygen depletion; roots remain hydrated for hours/days [1] | Rapid root desiccation; potential total crop loss within hours [12] [1] |
| Temperature Buffer | High mass provides inherent stability [12] | Low volume is highly sensitive to ambient fluctuations [12] |
Quantitative Comparison of Monitoring Parameters
A scientific comparison requires quantification of key variables. The following data, synthesized from operational analyses, provides a baseline for experimental design and hypothesis testing.
Table 2: Quantitative Monitoring Parameters for DWC and NFT Systems
| Parameter | Deep Water Culture (DWC) | Nutrient Film Technique (NFT) | Measurement Instrument |
|---|---|---|---|
| Dissolved Oxygen (DO) | Critical; must be constantly maintained via aeration [13] [1] | Less critical; roots primarily oxygenated from air [12] | Optical or Electrochemical DO Sensor [27] |
| Water Temperature Stability | High thermal mass; slow to change [12] | Low thermal mass; reacts quickly to ambient changes [12] | Submersible Temperature Probe |
| Electricity for Fluid Movement | Low to Moderate (recirculating systems) | Moderate to High (constant pumping) | Kilowatt-hour (kWh) Meter |
| System Buffering Capacity | High volume buffers pH/EC/nutrient shifts [1] | Low volume; rapid pH/EC shifts require frequent adjustment [1] | pH/EC Meter |
| Failure Response Time | Hours to days after aeration stops [1] | Hours after pump stops [12] | Automated Logging Alarms |
Methodologies for Monitoring Critical Parameters
Tracking Electricity Use
Experimental Protocol: Measuring Pump Power Consumption
- Objective: To quantitatively compare the electrical energy consumption of the primary pumps in NFT systems and the air/water pumps in DWC systems over a complete growth cycle.
- Materials: Kilowatt-hour (kWh) plug-in meter, data logging software.
- Method:
- Connect the NFT water pump and the DWC air pump(s) to separate kWh meters.
- For Recirculating DWC (RDWC), include the water circulation pump.
- Log the cumulative energy consumption (in kWh) daily.
- Normalize the data against biomass production (e.g., kWh per gram of fresh weight) to calculate energy efficiency.
- Data Interpretation: NFT systems typically show a constant, high-level energy draw for pumping. DWC energy use is dominated by air pumps, which is also constant but may be lower overall; however, the addition of water chillers can significantly increase total DWC energy consumption [1].
Measuring Water Temperature
Experimental Protocol: Profiling Thermal Stability
- Objective: To document the thermal inertia of DWC and the thermal sensitivity of NFT in response to ambient temperature changes.
- Materials: Calibrated submersible temperature probes, data logger.
- Method:
- Place temperature probes in the nutrient reservoir of both systems and in the growing channels of the NFT system.
- Record temperatures at 5-minute intervals over a 72-hour period that includes diurnal ambient temperature swings.
- Correlate reservoir/channel temperatures with ambient air temperature.
- Data Interpretation: The DWC reservoir temperature will exhibit minimal fluctuation (±1-2°C), while the NFT channel temperature will closely track ambient air temperature changes (±5-10°C) [12]. This confirms DWC's superior buffering capacity, a key factor in root zone health and metabolic consistency.
Quantifying Dissolved Oxygen
Experimental Protocol: Assessing Oxygen Dynamics
- Objective: To monitor dissolved oxygen (DO) levels in a DWC reservoir and assess the impact of aeration failure.
- Materials: Optical dissolved oxygen sensor, data logger [27].
- Method:
- Calibrate the DO sensor according to the manufacturer's instructions.
- Immerse the sensor in the DWC reservoir, ensuring it is not in direct contact with air stones.
- Log DO concentrations (in mg/L or % saturation) at 1-minute intervals under normal aeration.
- To simulate a failure, turn off the air pump and continue logging until DO levels fall below 2 mg/L, a critical threshold for root stress.
- Data Interpretation: Under normal operation, DO should be maintained at >80% saturation. After aeration stops, the rate of DO decline indicates microbial and root respiration activity. The large water volume in DWC provides a safety buffer, with DO levels taking hours to reach critical levels, unlike the rapid root drying in NFT following a pump failure [1].
Research Reagent and Equipment Solutions
The consistent monitoring of these parameters requires reliable laboratory-grade equipment. The following toolkit is essential for generating reproducible experimental data.
Table 3: Essential Research Toolkit for Hydroponic System Monitoring
| Item | Function | Example Application |
|---|---|---|
| Optical DO Sensor | Measures dissolved oxygen via luminescent quenching [27] | Tracking oxygen depletion rates in DWC during aeration failure experiments. |
| PID Temperature Controller | Maintains precise fluid temperature via heaters and cooling valves [28] [29] | Stabilizing NFT nutrient solution temperature in fluctuating ambient environments. |
| kWh Meter | Logs cumulative electrical energy consumption. | Comparing power draw of NFT water pumps vs. DWC air pumps. |
| pH/EC Controller | Automatically adjusts nutrient solution pH and electrical conductivity. | Maintaining stable root zone chemistry in the low-buffer environment of NFT. |
| Data Logger | Records sensor measurements over time for analysis. | Correlating ambient temperature with NFT solution temperature every 5 minutes. |
Logical Workflow for Parameter Monitoring
The relationship between system choice, critical parameters, and monitoring outcomes can be visualized as a decision and monitoring workflow. The diagram below outlines the logical pathway for establishing a monitoring protocol based on the selected hydroponic system.
Diagram 1: Parameter Monitoring Workflow
Interrelationship of Monitoring Parameters
The critical parameters of electricity, temperature, and dissolved oxygen are not independent variables. They exist in a tightly coupled relationship where a change in one directly impacts the others. This interplay is crucial for understanding overall system efficiency and stability.
Diagram 2: Parameter Interrelationships
The choice between DWC and NFT hydroponic systems fundamentally directs a research program's energy profile and monitoring priorities. DWC's energy consumption is allocated towards aeration and temperature control of a stable, buffered root zone, offering resilience. NFT's energy priority is unequivocally the unwavering operation of its water pumps, trading inherent buffer capacity for resource efficiency. This comparison demonstrates that there is no universally superior system; rather, the optimal choice is dictated by the specific research goals, whether they prioritize system resilience and thermal stability (DWC) or resource efficiency and scalability in a highly controlled environment (NFT). A comprehensive understanding of these critical parameters enables scientists to design more robust, efficient, and reproducible cultivation systems.
As controlled environment agriculture (CEA) expands, quantifying the energy performance of different hydroponic systems has become crucial for advancing sustainability. This guide provides a structured comparison of the energy performance between Deep-Water Culture (DWC) and Nutrient Film Technique (NFT) systems, focusing on the methodologies used to calculate Energy-Use Efficiency (EUE) and Specific Energy Consumption (MJ/kg). Based on compiled experimental data, NFT systems demonstrate superior EUE for lettuce production, while DWC systems show potential for higher biomass quality. The guide details standard experimental protocols, key calculation methodologies, and essential research tools to enable accurate, reproducible energy assessments for researchers and industry professionals.
The transition towards closed-loop hydroponic systems in greenhouses presents a significant trade-off: the potential for immense water and nutrient savings is counterbalanced by substantially elevated energy demands for operations such as heating, cooling, and artificial lighting [30]. This energy-intensity makes the precise quantification of energy performance a cornerstone of sustainable CEA research. Two primary metrics are central to this evaluation: Energy-Use Efficiency (EUE) and Specific Energy (SE).
Energy-Use Efficiency (EUE) is a yield-based metric that defines the fresh biomass produced per unit of electrical energy input, typically expressed in grams per kilowatt-hour (g/kWh). It is particularly useful for assessing the efficiency of systems relying heavily on electricity, especially for artificial lighting [4].
Specific Energy (SE), also known as Energy Intensity, represents the total energy required to produce a unit of dry or fresh mass, expressed in megajoules per kilogram (MJ/kg). This metric provides a broader perspective on energy consumption, often encompassing thermal energy for climate control in addition to electrical inputs, and is essential for lifecycle assessments and global comparisons [30].
Focusing on two prevalent systems—Deep-Water Culture (DWC) and Nutrient Film Technique (NFT)—this guide synthesizes experimental data, outlines standardized methodologies, and provides a toolkit for researchers to conduct their own rigorous energy performance evaluations.
Comparative Energy Performance Data
Direct experimental comparisons between DWC and NFT systems reveal clear differences in their energy performance profiles. The following table consolidates key quantitative findings from relevant studies, primarily on lettuce cultivation.
Table 1: Comparative Energy and Resource Use Efficiency between DWC and NFT Systems
| Metric | Crop | DWC Performance | NFT Performance | Notes & Context | Source |
|---|---|---|---|---|---|
| Energy-Use Efficiency (EUE) | Lettuce ('Little Gem') | 24.53 g/kWh | 31.30 g/kWh | Controlled environment with artificial lighting; NFT outperformed DWC by ~27%. | [4] |
| Specific Energy (SE) | Lettuce (General) | ~66 MJ/kg (GH context) | Information Missing | Figure for India; includes heating/cooling for greenhouse operation. | [30] |
| Water Use Efficiency | Tomato | High | High | Both hydroponic systems showed higher WUE than soil. | [31] |
| Yield (Fresh Mass) | Lettuce (Butterhead) | Baseline | +22.8% | Summer greenhouse conditions; NFT yielded significantly higher fresh mass. | [5] |
| Biomass Quality | Lettuce (Butterhead) | Higher chlorophyll & carotenoids | Lower chlorophyll & carotenoids | DWC produced plants with superior phytochemical content. | [5] |
| Biomass Quality | Tomato | Higher lycopene & β-carotene | Lower lycopene & β-carotene | DWC produced fruits with significantly higher pigment content. | [31] |
Key Findings from Comparative Data
NFT for Higher Yield and Electrical Efficiency: The primary energy advantage of NFT is evident in its superior EUE (31.3 g/kWh vs. 24.53 g/kWh) [4]. This is directly linked to its higher fresh mass yield, as confirmed by independent studies showing NFT can outperform DWC by over 22% in fresh weight [5]. The thin, highly oxygenated film of nutrient solution in NFT appears to optimally balance root zone aeration and nutrient uptake, driving efficient biomass production per unit of electrical energy input.
DWC for Enhanced Biomass Quality: While potentially less efficient in terms of EUE and yield, DWC systems consistently demonstrate an ability to enhance the nutritional and phytochemical quality of produce. Research shows DWC-grown lettuce can have significantly higher total chlorophyll and carotenoid concentrations [5], and tomatoes can possess higher levels of lycopene and β-carotene [31]. This suggests a trade-off where energy input may be channeled into producing secondary metabolites rather than pure biomass.
Contextualizing Specific Energy (MJ/kg): The global energy demand for greenhouse lettuce production is highly variable (39-123 MJ/kg), heavily dependent on external climate and the thermal energy required for heating and cooling [30]. This highlights that while EUE is excellent for comparing electrical efficiency under artificial lighting, a complete energy profile requires SE, which captures the total energy footprint, including climate control.
Experimental Protocols for Energy Assessment
To generate comparable and reliable data for EUE and SE calculations, researchers must adhere to controlled experimental protocols. The following workflow outlines a standardized approach for comparing hydroponic systems, synthesizing methodologies from multiple studies.
Diagram 1: Experimental workflow for hydroponic energy assessment.
Detailed Methodology
1. System Setup and Plant Material
- System Replication: Establish multiple replicates (e.g., n=4) of each hydroponic system (DWC, NFT) to ensure statistical robustness [5]. All system components should be identical where possible.
- Plant Material Standardization: Use a uniform crop, typically a leafy green like Lactuca sativa L. (e.g., 'Little Gem' or 'Butterhead'). Seeds are germinated in a growth chamber under standardized conditions (e.g., 18°C for 21 days) before transplanting as uniform seedlings into rockwool cubes placed into the respective systems [4].
2. Controlled Environment Setup
- Lighting: Utilize LED irradiation to ensure consistent and efficient lighting. The Photosynthetic Photon Flux Density (PPFD) and photoperiod must be standardized. For instance, a PPFD of 200 µmol·m⁻²·s⁻¹ with a 16-hour photoperiod is a common setup [4]. The use of light meters is essential for verification.
- Climate Control: Maintain ambient temperature and relative humidity at constant setpoints relevant to the crop (e.g., 18-24°C) using data loggers [4] [31].
- Energy Monitoring: Install calibrated energy meters (e.g., kilowatt-hour meters) on the circuits powering all system components, including lighting, pumps, and environmental control systems (HVAC) [4] [30].
3. Growth Period and Monitoring
- Nutrient Solution Management: Use a standardized, complete nutrient solution. Monitor and adjust electrical conductivity (EC) and pH to identical levels in all systems daily. A critical parameter is Dissolved Oxygen (DO), which should be measured and logged, as it significantly impacts root health and growth [32].
- Environmental and Energy Logging: Continuously record environmental data (temperature, humidity, PPFD) and energy consumption from all meters throughout the growth cycle.
4. Data Collection and Analysis
- Harvesting: At the end of the trial period (e.g., 5 weeks post-transplant), harvest the plants and measure key growth parameters: fresh shoot weight, dry weight (after oven-drying), leaf area, and root length [4] [5].
- Statistical Analysis: Analyze all data using appropriate statistical methods, such as Analysis of Variance (ANOVA) followed by post-hoc tests like Tukey's HSD to determine the significance of observed differences between systems [5] [32].
Calculation Methodologies
Energy-Use Efficiency (EUE)
EUE calculates the fresh biomass produced per unit of electrical energy consumed. It is most relevant for assessing the efficiency of systems using electrical inputs, particularly artificial lighting.
Formula:
EUE (g/kWh) = Total Fresh Biomass Yield (g) / Total Electrical Energy Input (kWh)
Example Calculation from Data: In a controlled study, an NFT system produced a higher fresh weight yield than a DWC system using the same electrical energy input for lighting [4].
- NFT EUE = 31.3 g/kWh
- DWC EUE = 24.53 g/kWh This indicates that the NFT system was approximately 27% more efficient at converting electrical energy into harvestable fresh biomass.
Specific Energy (SE)
Specific Energy represents the total energy cost of producing a unit of biomass, incorporating both electrical and thermal energy inputs. It is critical for a full lifecycle energy assessment.
Formula:
SE (MJ/kg) = [Electrical Energy (kWh) * 3.6 + Thermal Energy (MJ)] / Total Biomass Yield (kg)
Note: The factor 3.6 converts kWh to MJ (1 kWh = 3.6 MJ).
Contextual Data: A global assessment found that the total energy demand for greenhouse lettuce production, including heating and cooling, can range from 39 to 123 MJ/kg of fresh weight, heavily dependent on the local climate [30]. For example, in India, the SE for lettuce in a closed-loop hydroponic greenhouse was calculated to be approximately 66 MJ/kg [30].
The Researcher's Toolkit
Table 2: Essential Research Reagents and Materials for Hydroponic Energy Studies
| Item Category | Specific Examples | Critical Function in Research | Experimental Consideration |
|---|---|---|---|
| Growth Systems | NFT Channels, DWC Tanks | The core units of comparison. Material, volume, and geometry must be standardized. | NFT channel depth can significantly impact nutrient and water use efficiency [15]. |
| Lighting Source | LED Grow Lights | Provides consistent, efficient, and controllable photosynthetic photon flux. | PPFD and spectral composition must be measured and reported (e.g., 200 µmol·m⁻²·s⁻¹) [4]. |
| Nutrient Solution | Hydroponic Fertilizers (Macro & Micronutrients) | Delivers essential minerals (N, P, K, Ca, Mg, S) to plants in a soluble form. | Concentration, pH (e.g., 5.5-6.5), and EC must be identical across systems to avoid confounding [31]. |
| Environmental Sensors | PAR Meter, Data Loggers (T/RH), Dissolved Oxygen Meter | Quantifies and monitors the controlled environmental variables. | DO is critical for root respiration; levels >8 mg/L can enhance growth in NFT [32]. |
| Energy Meters | Kilowatt-hour (kWh) Meters | Precisely measures the electrical energy input to system components (lights, pumps, HVAC). | Essential for calculating EUE. Must be calibrated and record data continuously. |
| Plant Analysis Tools | Analytical Balance, Leaf Area Meter, Oven (for dry weight) | Accurately measures the final growth and yield parameters. | Fresh and dry mass are required for EUE and quality analyses, respectively. |
This guide provides a foundational framework for quantifying and comparing the energy performance of DWC and NFT hydroponic systems. The synthesized data indicates a performance trade-off: NFT systems generally offer superior Energy-Use Efficiency and higher fresh yield, making them compelling for operations focused on productivity per unit of electrical input. In contrast, DWC systems show a tendency to enhance phytochemical and nutritional content of the produce, which may justify their energy input for certain market segments.
Future research should focus on standardizing the reporting of both EUE and Specific Energy to allow for more direct cross-study comparisons. Furthermore, integrating these energy metrics with other resource use efficiencies, such as water and nutrients, into a multi-dimensional sustainability index will be vital for guiding the development of truly optimized and sustainable controlled environment agriculture systems.
The interconnected challenges of climate change, water scarcity, and food security demand integrated solutions within the Water-Energy-Food-Environment (WEFE) nexus [33]. Agricultural activities significantly impact environmental sustainability through resource consumption and greenhouse gas emissions, with conventional agriculture accounting for approximately 70% of global freshwater withdrawals and nearly 30% of global energy consumption for food production and supply [33]. Against this backdrop, controlled environment agriculture systems, particularly hydroponics, have emerged as promising solutions for enhancing resource efficiency.
This guide objectively compares the performance of solar-PV powered hydroponic systems against conventional alternatives, with specific focus on CO2 emissions and energy efficiency. The analysis is framed within a broader research context examining energy consumption differences between Deep-Water Culture (DWC) and Nutrient Film Technique (NFT) hydroponic systems, providing researchers with experimental data and methodologies for evaluating sustainable agricultural technologies.
Hydroponic Systems: Deep-Water Culture vs. Nutrient Film Technique
System Characteristics and Performance
Hydroponics encompasses various cultivation methods, with DWC and NFT representing two predominant systems. DWC suspends plant roots in a oxygenated nutrient solution, while NFT involves a thin film of nutrient solution flowing through channels containing plant roots [5].
Table 1: Comparative Performance of DWC and NFT Hydroponic Systems
| Performance Parameter | Deep-Water Culture (DWC) | Nutrient Film Technique (NFT) | Significance/Context |
|---|---|---|---|
| Energy Use Efficiency (EUE) | 24.53 g.kWh⁻¹ [4] | 31.3 g.kWh⁻¹ [4] | NFT exhibits 27.6% higher EUE |
| Fresh Yield | Lower yield [5] | 22.8% higher [5] | NFT demonstrates superior productivity |
| Dry Yield | Lower yield [5] | 27.7% higher [5] | Consistent with fresh yield trend |
| Leaf Area | Smaller leaf area [5] | 13.0% larger [5] | Contributes to yield differences |
| Water Consumption | 9.6% lower [5] | Higher consumption [5] | DWC offers water conservation advantage |
| Nutrient Uptake (N, Ca, S) | Lower uptake efficiency [5] | 9.2-33.9% higher uptake [5] | NFT enhances nutrient utilization |
| Photosynthetic Properties | Reduced performance [5] | Enhanced properties [5] | Explains yield differences |
| Phytochemical Content | Higher total chlorophyll and carotenoids [5] | Lower (5.2% chlorophyll, 41.0% carotenoids) [5] | DWC produces nutritionally superior crops |
Experimental Protocols for System Comparison
Research comparing DWC and NFT systems typically employs standardized protocols. A representative methodology involves:
- Plant Material: Butterhead lettuce (Lactuca sativa) is commonly used as a model crop [5].
- System Setup: Four system replicates for each hydroponic design, with each system containing nine lettuce plants [5].
- Growth Conditions: Studies are conducted in climate-controlled greenhouses during summer months (July-August) to assess performance under warm conditions [5].
- Data Collection: Parameters monitored include photosynthetic properties, leaf area, fresh and dry yield, nutrient concentrations in plant tissue and solution, chlorophyll and carotenoid content, and total water consumption [5].
- Lighting Conditions: For indoor studies, LED irradiation with photosynthetic photon flux (PPF) of 200 µmol·s⁻¹ and photoperiod of 16 hours is typically employed [4].
Solar-PV Integration in Hydroponic Systems
System Configuration and Energy Performance
Integrating solar photovoltaic (PV) systems with hydroponics addresses the significant energy demand of controlled environment agriculture. Experimental data demonstrates the substantial benefits of this integration.
Table 2: Energy Performance and CO2 Emissions: Solar-PV vs. Grid-Powered Systems
| Performance Indicator | Grid-Powered System | Solar-PV Powered System | Improvement |
|---|---|---|---|
| Energy Ratio | 0.05 [33] | 0.11 [33] | 120% increase |
| Energy Productivity | 0.07 kg/MJ [33] | 0.16 kg/MJ [33] | 128.6% increase |
| Specific Energy | 14.89 MJ/kg [33] | 6.14 MJ/kg [33] | 58.8% reduction |
| CO2 Emissions (kg CO2 eq/m²) | 1.5386 [33] | 0.0861 [33] | 94.4% reduction |
| Carbon Footprint (kg CO2-eq kg⁻¹) | 49.9 [34] | 1.6 [34] | 96.8% reduction |
| Water Use Efficiency | 0.071 kg/L [33] | 0.073 kg/L [33] | Comparable performance |
| Seasonal Energy Coverage | Not applicable | Spring: 58.0%, Summer: 83.3%, Winter: 9.6% [34] | Seasonal variation |
Experimental Design for Solar-PV Hydroponic Assessment
Methodologies for evaluating solar-PV hydroponic systems typically incorporate these key elements:
- System Configuration: The experimental setup includes (i) a greywater treatment unit, (ii) NFT or DWC hydroponic units, (iii) a solar energy unit with PV panels, charge controller, inverter, and storage system, and (iv) a water scheduling control unit [33].
- Power Management: A microcontroller (Arduino Mega) manages system automation, receiving inputs from voltage/current sensors, DHT11 temperature/humidity sensors, RTC modules for time-based irrigation, and data logging via SD card modules [33].
- Root Zone Temperature Control: Electric resistors (for heating) and hydroponic chillers (for cooling) maintain root zone temperature at 22°C, identified as optimal for leafy vegetables [34].
- Energy Source Comparison: Parallel systems operate with one tank powered by the public grid (PPG) and another by the PV system, enabling direct comparison [34].
- Crop Performance Monitoring: Morphological, physiological, and biochemical parameters of lettuce are measured, including head weight, dimensions, relative water content, dry matter, and chlorophyll content [33].
Advanced Sustainable Integration Strategies
CO2 Supplementation and Resource Recycling
Innovative approaches beyond energy integration further enhance the sustainability of hydroponic systems:
- CO2 Enrichment: Research demonstrates that controlled CO2 supplementation in hydroponic systems can increase yields of leafy greens by up to 30%. Closed-loop systems utilizing CO2 derived from composting and anaerobic digestion create synergistic benefits [35].
- Greywater Integration: Treated greywater from kitchen and bathroom sources provides essential nutrients that support plant growth while reducing synthetic fertilizer requirements. Studies show lettuce irrigated with treated greywater achieved mean head weight of 682.9g with optimal physiological parameters [33].
- Hydromechanical Energy Recovery: Vertical hydroponic systems offer potential for harvesting hydromechanical energy from water flow. Experimental HEHVH (Hydromechanical Energy-Harvesting-based Vertical Hydroponic) systems have generated up to 2.95V without compromising plant growth [36].
The Researcher's Toolkit: Essential Experimental Materials
Table 3: Key Research Reagents and Equipment for Hydroponic Energy Studies
| Item | Specification/Type | Experimental Function |
|---|---|---|
| PV System | 1 kWp total power [34] | Renewable energy generation for system operation |
| Microcontroller | Arduino Mega [33] | System automation and data acquisition control |
| Temperature Sensors | PT-100 [34] / DHT11 [33] | Root zone and air temperature monitoring |
| Water Pumps | Leo XKF-110P (110W) [34] | Nutrient solution circulation in hydroponic tanks |
| Air Pumps | Resun Air-3000 (3.5W) [34] | Oxygenation of nutrient solution |
| LED Lighting | PPF 200 µmol·s⁻¹, 16h photoperiod [4] | Controlled plant illumination in indoor studies |
| Heating/Cooling | Electric resistors & TECO HY2000 chiller [34] | Root zone temperature maintenance at 22°C |
| Data Logging | SD card module [33] / HOBO microstation [34] | Environmental and system parameter recording |
| Hydroponic Channels | NFT pipes or DWC tanks [5] | Plant support and nutrient delivery medium |
| Nutrient Solution | Hoagland formula [34] | Essential element supply for plant growth |
The experimental data presented in this comparison guide demonstrates the significant environmental advantages of integrating solar-PV energy with hydroponic cultivation systems. The 94.4% reduction in CO2 emissions achieved by solar-powered systems compared to grid-powered alternatives [33], coupled with the superior energy use efficiency of NFT systems over DWC [4], provides researchers with quantitative evidence to support sustainable agricultural decisions.
These integrated approaches address multiple WEFE nexus challenges simultaneously: reducing freshwater withdrawals through recirculating systems, replacing fossil-fuel energy with renewables, enhancing food production efficiency, and minimizing environmental impacts. The methodologies and datasets presented offer researchers comprehensive protocols for replicating and expanding upon these investigations, contributing to the advancement of climate-resilient agricultural systems aligned with global sustainability goals.
Future research directions should focus on optimizing system economics, improving energy storage solutions for consistent year-round operation, developing more efficient energy recovery mechanisms such as hydromechanical harvesting [36], and exploring integrated renewable energy frameworks that combine solar with other clean energy sources.
The pursuit of agricultural sustainability has intensified focus on closed-loop hydroponic systems, particularly Deep Water Culture (DWC) and Nutrient Film Technique (NFT). Within research environments, precise management of these systems is paramount for validating crop performance, nutrient efficacy, and energy utilization. The integration of Internet of Things (IoT) technologies and smart sensors provides an unprecedented capability for real-time, data-driven control and monitoring. This guide objectively compares the implementation of automation and IoT in DWC and NFT systems, providing researchers with structured experimental frameworks and data analysis protocols tailored for high-resolution energy and system management studies. Modern IoT platforms leverage arrays of sensors for parameters such as pH, Electrical Conductivity (EC), dissolved oxygen, temperature, and energy consumption, enabling dynamic adjustments that stabilize growth environments and optimize resource use [24] [37].
For scientific and industrial audiences, this synthesis of operational technology and controlled environment agriculture offers a pathway to highly reproducible, scalable, and efficient research methodologies. The following sections provide a comparative analysis, detailed experimental protocols, and essential toolkits for implementing robust automated management systems.
Comparative Analysis of DWC and NFT Systems
- Deep Water Culture (DWC): In a DWC system, plant roots are fully submerged in a large, oxygenated nutrient solution reservoir. Aeration is provided continuously by air pumps and air stones [1]. The large volume of solution provides significant thermal and chemical buffering capacity, making the system less susceptible to rapid fluctuations in temperature, pH, and nutrient concentration.
- Nutrient Film Technique (NFT): NFT operates by circulating a thin film of nutrient solution through gently sloping channels. Plant roots are exposed to this flowing film at their base while the upper portion remains in the humid air, allowing for direct oxygen absorption [1]. This design is highly efficient in its use of water and nutrients but offers minimal buffering capacity.
Energy and Operational Management Profiles
The fundamental differences between DWC and NFT systems necessitate distinct approaches to automation and energy management. The following table summarizes key performance and management characteristics critical for research planning.
Table 1: DWC vs. NFT System Management Profiles for Research Applications
| Characteristic | Deep Water Culture (DWC) | Nutrient Film Technique (NFT) |
|---|---|---|
| Primary Energy Loads | Water chilling/heating, Aeration pumps [1] | Water pumps for circulation [1] |
| Failure Resilience | High resilience to pump failure; roots remain submerged for hours/days [1] | Extremely vulnerable to pump failure; roots can desiccate within hours [1] |
| Temperature Stability | High inherent stability due to large water volume [1] | Low stability; sensitive to ambient air temperature fluctuations [1] |
| Water/Nutrient Efficiency | Moderate; larger initial volume but recirculated [1] | High; uses minimal water and nutrients due to recirculating film [1] |
| IoT Monitoring Priority | Dissolved Oxygen, Water Temperature, EC/pH | Pump Flow/Pressure, Root Zone Temperature, EC/pH |
| Data Density Requirement | Moderate; slower parameter drift allows for less frequent sampling | High; rapid parameter shifts necessitate continuous or high-frequency monitoring |
| Crop Suitability | Leafy greens, herbs, and larger fruiting plants (e.g., tomatoes, peppers) [1] | Primarily lightweight, fast-growing crops (e.g., leafy greens, herbs, strawberries) [1] |
IoT-Driven Experimental Protocols for Energy and System Analysis
To obtain publishable, high-quality data on energy consumption and system management, researchers must implement structured experimental protocols. The following workflows are designed for side-by-side comparison of DWC and NFT systems.
Protocol 1: Real-Time Energy Consumption Profiling
Objective: To quantitatively measure and compare the total energy intensity (kWh per kg of fresh biomass) of DWC and NFT systems under controlled conditions.
Methodology:
- System Setup: Establish matched, bench-scale DWC and NFT systems in identical, climate-controlled growth chambers.
- Sensor Integration: Install smart energy meters (e.g., IoT-connected AC power monitors) on all active system components: water and air pumps (DWC), circulation pumps (NFT), and water chillers/heaters (DWC). These meters should log data at a minimum 5-minute interval [38] [39].
- Environmental Control: Standardize light intensity (PPFD), photoperiod, ambient temperature, and humidity across both systems. The use of spectrum-tuned LEDs is recommended for energy efficiency [24].
- Cultivation: Plant uniform seedlings of a standard research crop (e.g., lettuce, Lactuca sativa) in both systems simultaneously.
- Data Acquisition: Continuously log energy consumption data from all meters to a central IoT platform or edge computing device for the duration of the growth cycle [24] [40].
- Harvest and Analysis: At harvest, record the total fresh weight biomass for each system. Calculate total energy consumption per system and derive the key metric: kWh/kg.
Visualization of Experimental Workflow: The logical flow of the energy profiling protocol is outlined below.
Protocol 2: System Failure Response and Anomaly Detection
Objective: To evaluate the resilience of DWC and NFT systems to operational failures and to test the efficacy of AI-driven predictive alerts.
Methodology:
- Baseline Monitoring: Under stable conditions, use IoT sensors to establish baseline operational signatures for each system, including vibration patterns of pumps (using accelerometer sensors) and normal ranges for dissolved oxygen (DWC) and flow rate (NFT) [38] [41].
- Induced Failure Simulation: Introduce a controlled failure, such as a progressive pump power reduction or a partial blockage in an NFT channel.
- Anomaly Detection: Configure the IoT analytics platform with machine learning models (e.g., LSTMs or clustering algorithms) to detect deviations from the baseline signature in real-time [38] [42]. The time from failure induction to algorithm alert should be recorded.
- Plant Stress Metrics: Simultaneously, monitor plant-based physiological sensors (e.g., canopy temperature, leaf turgor pressure sensors) to detect the onset of plant stress, correlating these with system-level anomalies.
- Response Time Analysis: Compare the time taken for the IoT system to flag an anomaly against the time for visible plant stress symptoms to appear.
Visualization of Anomaly Detection Logic: The core logic for the AI-driven predictive maintenance model is depicted below.
The Researcher's Toolkit: Essential Reagents and Solutions
Implementing the aforementioned protocols requires a suite of reliable research-grade tools and reagents. The following table details essential items for constructing and monitoring automated hydroponic research systems.
Table 2: Essential Research Reagent Solutions for Automated Hydroponic Systems
| Item Name | Function / Application | Research-Grade Considerations |
|---|---|---|
| pH Buffering Calibration Kit | Calibration of pH sensors for precise nutrient management. | Use certified NIST-traceable buffers (e.g., pH 4.01, 7.00, 10.01) for high-accuracy sensor calibration. |
| EC Standard Solution | Calibration of Electrical Conductivity (EC) sensors for nutrient concentration monitoring. | A certified standard, typically 1413 µS/cm at 25°C, ensures accurate and repeatable EC measurements. |
| Dissolved Oxygen Probe | Monitoring critical oxygen levels in DWC reservoirs. | Select a probe with a fast response time and low drift; requires regular calibration and membrane replacement. |
| Hydroponic Nutrient Solution | Provides essential macro and micronutrients for plant growth. | Use a chemically defined, high-purity solution to minimize variability and contamination in experiments. |
| Water Chiller/Heater | Maintains stable root zone temperature in DWC systems. | A recirculating model with ±0.5°C stability is recommended for precise temperature control. |
| IoT Sensor Node | Measures and transmits environmental data (pH, EC, DO, Temp). | Select nodes with appropriate data logging rates, robust connectivity (e.g., 5G, Wi-Fi, LPWAN), and API access for data retrieval [40] [43]. |
| Predictive Maintenance Software | Analyzes sensor data to forecast equipment failures. | Platforms compatible with common data formats and offering customizable alert thresholds are essential [38] [41]. |
The integration of IoT and smart sensors transforms the management of DWC and NFT hydroponic systems from a reactive to a predictive and data-rich endeavor. For the research community, this enables a level of experimental control and detailed energy accounting previously difficult to achieve. The comparative data indicates that DWC offers greater stability and resilience, a critical factor for long-duration or large-plant studies, while NFT provides superior resource efficiency for rapid-cycle leafy crops, provided robust failure safeguards are in place. The experimental protocols and tools detailed herein provide a foundation for rigorous, reproducible research into the energy dynamics and automated management of these pivotal agricultural systems. Future work will likely focus on the deeper integration of AI not just for fault detection, but for the holistic, multi-variable optimization of the entire plant growth environment [24] [41].
Mitigating Energy Inefficiencies and System-Specific Failures
Deep Water Culture (DWC) hydroponic systems offer significant advantages in crop production stability and resilience to pump failures. However, these benefits come with distinct energy demand profiles, particularly for water temperature control and aeration, when compared to Nutrient Film Technique (NFT) systems. This guide objectively analyzes the quantitative differences in energy consumption between these systems, drawing upon experimental data to present a comparative framework for researchers and commercial growers. Within the broader thesis of energy consumption in closed plant production systems, understanding these vulnerabilities is critical for optimizing resource use efficiency and system selection.
The fundamental operational principles of DWC and NFT dictate their respective energy consumption profiles. In a Deep Water Culture (DWC) system, plants are suspended on rafts or lids over a deep, oxygenated reservoir of nutrient solution, with roots fully submerged [1] [12]. This design necessitates continuous aeration via air pumps and air stones to oxygenate the large, static water volume and often requires active water temperature management due to the high thermal mass of the solution [1] [2].
Conversely, the Nutrient Film Technique (NFT) operates by circulating a thin film of nutrient solution through sloped channels, with plant roots suspended in air and only the bottom portion contacting the flowing solution [1] [2]. This design is highly efficient in water and nutrient use but is more vulnerable to pump failures, which can lead to rapid root desiccation [1]. Its energy demands are characterized by lower requirements for water temperature control but a critical dependence on reliable water circulation pumps.
Comparative Energy Consumption Analysis
Experimental data and system analyses reveal clear trade-offs in the energy use profiles of DWC and NFT systems. The following table summarizes key performance metrics.
Table 1: Comparative Analysis of DWC and NFT System Energy & Performance
| Performance Metric | Deep Water Culture (DWC) | Nutrient Film Technique (NFT) | Supporting Experimental Data |
|---|---|---|---|
| Energy-Use Efficiency (EUE) | Lower | Higher | NFT exhibited an EUE of 31.3 g/kWh, outperforming DWC at 24.53 g/kWh for lettuce production [4]. |
| Temperature Control Energy Demand | High | Lower | DWC's large water volume requires energy for heating/cooling to maintain stable root-zone temperature [1] [12]. NFT's shallow film is more susceptible to ambient air temperature fluctuations but has low thermal mass to control [1]. |
| Aeration Energy Demand | High (Continuous) | Negligible | DWC requires constant air pumps to oxygenate the submerged root zone [1] [2]. NFT roots are primarily oxygenated from the air, requiring no active aeration of the thin solution film [1]. |
| Water Circulation Energy Demand | Low (for non-recirculating) or Moderate (for RDWC) | High (Continuous) | NFT demands continuous, reliable water pumping for its core function. Basic DWC can be passive; Recirculating DWC (RDWC) requires pumps but is less vulnerable to failure than NFT [1] [12]. |
| System Resilience to Power Failure | High | Low | In a power outage, DWC roots remain submerged, providing a buffer of hours or days. NFT roots can dry out and cause crop loss within hours [1] [12]. |
| Impact on Growth/Yield | Robust growth for leafy greens and larger plants | High yields for lightweight, fast-growing crops | One study found NFT-grown lettuce had 22.8% higher fresh yield and 27.7% higher dry yield than DWC [5]. Another reported similar growth parameters, but significantly different shoot fresh weight [4]. |
Experimental Protocols for Energy and Performance Assessment
To generate the comparative data presented, researchers employ controlled experimental protocols. The following workflow outlines a standard methodology for comparing DWC and NFT systems.
Figure 1: Experimental workflow for comparing DWC and NFT systems.
Detailed Methodology
A typical protocol, as used in a study comparing Energy-Use Efficiency (EUE) for lettuce, involves several key stages [4]:
- Plant Material and Growth Conditions: Seeds (e.g., Lactuca sativa L. 'Little Gem') are germinated in growth chambers at a controlled ambient temperature (e.g., 18°C) for a set period (e.g., 21 days). Seedlings are then transplanted into inert media like rockwool cubes before being moved to the test systems [4].
- System Configuration: DWC and NFT systems are set up in a controlled environment. Both are illuminated with LED lighting, often with a photosynthetic photon flux (PPF) of 200 µmol·m⁻²·s⁻¹ and a photoperiod of 16 hours [4].
- Resource Monitoring:
- Data Collection and Analysis:
- Growth Parameters: At harvest, parameters like leaf count, plant height, shoot fresh weight, leaf area, and root length are measured [4] [5].
- Efficiency Calculations: Key metrics are calculated, including:
- Energy-Use Efficiency (EUE): Calculated as total fresh weight (g) produced per unit of energy consumed (kWh), expressed as g/kWh [4].
- Water-Use Efficiency (WUE): Biomass produced per unit volume of water used.
The Scientist's Toolkit: Key Research Reagents and Materials
Table 2: Essential Materials for Hydroponic Energy Consumption Research
| Item | Function in Research |
|---|---|
| LED Grow Lights | Provides consistent, tunable light spectra and intensity (PPFD). Essential for creating controlled photoperiods and calculating lighting-related energy inputs [4] [24]. |
| Air Pumps & Air Stones | Critical for oxygenating the nutrient solution in DWC systems. A key variable whose energy consumption is directly measured [1] [2]. |
| Water Pumps | Circulates nutrient solution in NFT and Recirculating DWC (RDWC) systems. Energy use and reliability are central to the NFT vulnerability profile [1] [12]. |
| Water Chillers/Heaters | Used to actively control the root-zone temperature in DWC systems. A significant and specific energy cost component for DWC [1]. |
| Nutrient Solution & pH/EC Meters | The standardized nutritional environment for plants. Precise monitoring of Electrical Conductivity (EC) and pH ensures plant health is not a confounding variable in energy studies [44] [45]. |
| Data Loggers & Power Meters | Continuously monitor and record environmental parameters (temperature, humidity) and, crucially, the real-time energy consumption of individual system components [24]. |
Energy Demand Pathways and System Interrelationships
The core energy demands of DWC and NFT systems and their impact on key outcomes can be visualized through the following logical pathway.
Figure 2: Energy demand pathways and vulnerabilities of DWC vs. NFT systems.
The choice between DWC and NFT involves a direct trade-off between energy consumption and system resilience. DWC systems incur higher energy demands for maintaining water temperature and aeration but offer greater stability and a safety buffer against power interruptions. NFT systems, while demonstrating higher calculated Energy-Use Efficiency (EUE) for specific crops like lettuce, channel their energy into water circulation and carry a higher operational risk due to pump dependency. Future research should focus on integrating renewable energy sources, AI-driven optimization, and heat recovery systems to mitigate the identified energy vulnerabilities in both systems, particularly the high thermal load in DWC [24]. This analysis provides a foundational framework for guiding such innovations in sustainable controlled environment agriculture.
The pursuit of sustainable agricultural practices has positioned hydroponic systems as a cornerstone for future food production, with their efficiency in resource utilization being of particular importance in controlled environment agriculture. Within this context, the balance between energy-use efficiency (EUE) and system resilience becomes a critical research focus. The Nutrient Film Technique (NFT) and Deep Water Culture (DWC) represent two predominant hydroponic approaches with distinct energy and risk profiles. NFT systems, characterized by their thin film of flowing nutrient solution, have demonstrated superior energy-use efficiency in direct comparative studies [4]. However, this efficiency comes with a significant vulnerability: a high risk of catastrophic crop failure resulting from pump interruption [1] [46]. This analysis examines the precise failure mechanisms of NFT systems, quantifies their impact on the energy efficiency metric, and contrasts these dynamics with the more buffered failure response of DWC systems, providing researchers with experimental data and methodologies for evaluating system reliability within energy consumption frameworks.
Comparative Analysis: NFT vs. DWC Failure Profiles and Energy Efficiency
Quantitative Comparison of System Performance and Risks
Table 1: Direct comparison of NFT and DWC systems based on experimental data and operational characteristics.
| Parameter | Nutrient Film Technique (NFT) | Deep Water Culture (DWC) |
|---|---|---|
| Energy Use Efficiency (EUE) | 31.3 g·kWh⁻¹ [4] | 24.53 g·kWh⁻¹ [4] |
| Pump Failure Impact | Catastrophic: Root drying and plant death within hours [1] [47] | Buffered: Roots remain submerged for days, allowing time for intervention [1] [12] |
| System Buffer Capacity | Very Low: Minimal nutrient solution volume in channels [48] | High: Large reservoir volume provides stability [1] [2] |
| Temperature Stability | Low: Small water volume is sensitive to ambient fluctuations [1] [48] | High: Large water mass resists rapid temperature change [1] [12] |
| Inherent Oxygenation | Roots partially exposed to air [46] [49] | Requires active aeration via air stones/pumps [1] [2] |
| Primary Mechanical Risk | Water pump failure [1] [47] | Air pump failure (less immediately critical) [1] [12] |
Experimental Evidence: Energy Use Efficiency and Growth Parameters
Direct experimental comparison under controlled conditions provides the most reliable data for evaluating system performance. A controlled study measuring the Energy Use Efficiency (EUE) for lettuce (Lactuca sativa L. 'Little Gem') found a significant advantage for NFT systems. The NFT system achieved an EUE of 31.3 g·kWh⁻¹, outperforming the DWC system's EUE of 24.53 g·kWh⁻¹, indicating higher growth yield per unit of energy input [4]. While crop growth parameters such as leaf count and plant height were similar between the systems, shoot fresh weight, leaf area, and root length were significantly different, suggesting that the NFT system supported more robust growth for the same energy expenditure [4]. This efficiency advantage, however, exists in tension with the system's operational vulnerabilities.
The NFT Failure Mode: Pump Failure as a Catastrophic Risk
Mechanism of Catastrophic Failure
The defining vulnerability of NFT systems stems from their fundamental design principle: a shallow, flowing film of nutrient solution. This very feature that provides excellent root oxygenation becomes a critical liability during pump operation failure. Without continuous flow, the thin film quickly dissipates, leaving roots exposed to air [47]. This exposure leads to rapid root desiccation and plant death. The timeframe for catastrophe is remarkably short; researchers and commercial growers note that in hot weather, plants can be irreversibly damaged within a matter of hours [1] [49]. This risk is compounded by the fact that vigorous root growth in mature plants can itself clog the narrow channels, damming the nutrient film and creating localized failure points even with a functioning pump [47] [48].
Impact on Energy Per Unit Yield
The vulnerability to pump failure directly and negatively impacts the life-cycle energy efficiency of NFT systems. While the baseline EUE is favorable, the risk of a single pump failure event wiping out an entire production cycle cannot be overlooked in a comprehensive energy analysis. A total crop loss represents a net negative return on all energy invested in lighting, climate control, and water pumping up to that point, effectively driving the EUE for that cycle to zero. To mitigate this risk, growers must invest in redundant systems such as backup pumps and uninterruptible power supplies, which themselves consume energy and increase the system's initial embodied energy cost [1] [47]. Therefore, the theoretical energy efficiency of NFT is contingent upon significant investment in failure-prevention infrastructure, a critical factor in total energy accounting.
DWC: A Contrasting Failure Profile and Its Energy Implications
Deep Water Culture presents a fundamentally different failure profile. In a DWC system, plant roots are continuously submerged in a large, aerated reservoir of nutrient solution [1] [2]. The primary mechanical risk is the failure of the air pump, which provides essential oxygenation. However, the consequences are not immediately catastrophic. The large volume of water acts as a physical buffer, keeping roots hydrated and providing a rescue window of hours or even days before oxygen depletion becomes critical [1] [12]. This resilience is a key operational advantage. From an energy perspective, DWC systems may have a lower baseline EUE, but they offer greater predictability and lower risk of total crop loss from a single point of failure. The energy consumption profile differs, with a greater proportion likely dedicated to temperature control of the large water volume, but the overall energy investment is not jeopardized by a brief power interruption [1].
Experimental Protocols for Assessing Failure Risk and Energy Impact
Methodology for Simulating and Measuring Pump Failure
To quantitatively assess the failure risk and its impact on plant viability and energy metrics, researchers can employ the following controlled protocol, derived from operational descriptions in the literature [1] [47] [12].
- System Setup: Establish identical NFT and DWC systems in a controlled environment. For NFT, use channels with a standard slope (e.g., 1-3%) [47] [49]. For DWC, use reservoirs with active aeration. Cultivate fast-growing, shallow-rooted crops like lettuce (Lactuca sativa) or herbs (e.g., basil) in both systems [46] [50].
- Environmental Control: Maintain consistent climatic conditions (light, temperature, humidity) using LED lighting with a defined photoperiod (e.g., 16 hours) and photosynthetic photon flux (e.g., 200 µmol·m⁻²·s⁻¹) [4].
- Failure Induction: Once plants reach a mature growth stage (e.g., 4-5 weeks), simulate a pump failure in the NFT system and an air pump failure in the DWC system.
- Data Collection:
- Plant Stress Indicators: Monitor and record plant wilting, root desiccation (NFT), and root discoloration (DWC) at regular intervals (e.g., every 30-60 minutes).
- Viability Timeline: Document the time from failure induction to the point of irreversible plant damage.
- Energy Measurement: Use energy meters to record total energy consumption (kWh) for each system up to the point of failure.
- Post-Failure Analysis: If plants are recovered, measure final biomass and calculate the actual EUE (g·kWh⁻¹), factoring in the yield loss.
Research Reagent Solutions and Essential Materials
Table 2: Key materials and equipment required for conducting comparative hydroponic research on NFT and DWC systems.
| Item | Function in Experiment |
|---|---|
| NFT Channels/Gutters | Plant support and conduit for the thin film of nutrient solution [50]. |
| DWC Reservoir/Tank | Holds a large volume of nutrient solution in which roots are submerged [1] [2]. |
| Water Pump (for NFT) | Circulates the nutrient solution continuously; the primary point of failure [50] [47]. |
| Air Pump & Air Stones (for DWC) | Oxygenates the nutrient solution in the DWC reservoir; secondary point of failure [1] [2]. |
| LED Grow Lights | Provides consistent, measurable photosynthetic light while allowing for energy consumption tracking [4]. |
| EC/pH Meters | Monitors nutrient solution concentration and acidity, ensuring optimal plant growth conditions [50]. |
| Data Logger | Continuously records parameters like water temperature, ambient temperature, and energy use [50]. |
| Hydroponic Fertilizer | Water-soluble nutrients (e.g., 8-15-36 plus calcium nitrate) formulated for recirculating systems [50]. |
The interplay between energy efficiency and system resilience represents a core trade-off in hydroponic system design. NFT technology offers a demonstrably higher Energy Use Efficiency under optimal conditions, as evidenced by a 28% higher EUE compared to DWC in lettuce cultivation [4]. However, this efficiency is critically dependent on continuous system operation, as NFT is profoundly vulnerable to pump failure, which can precipitate total crop loss within hours and annihilate any EUE advantage [1] [47]. In contrast, DWC systems provide inherent resilience through their buffered root zone, protecting against rapid catastrophe and offering a more predictable, though baseline less efficient, energy profile. For researchers and commercial operators, the choice is not merely a question of nominal efficiency but of risk management and total cost of operation. Future research should focus on quantifying the energy overhead of failure-mitigation strategies for NFT and further refining DWC aeration techniques to narrow the EUE gap, ultimately driving forward the sustainability of controlled environment agriculture.
The escalating global demand for sustainable food production has accelerated the adoption of Controlled Environment Agriculture (CEA), with Deep Water Culture (DWC) and Nutrient Film Technique (NFT) emerging as prominent hydroponic systems. Within this context, the optimization of energy consumption represents a critical research frontier, as energy inputs significantly influence both operational economics and environmental footprint. This guide provides a scientific comparison of DWC and NFT systems, focusing specifically on the implementation of energy-efficient LED lighting and high-efficiency pumps. It is structured to offer researchers and agricultural scientists a rigorous, data-driven framework for evaluating system performance, supported by experimental data and detailed methodologies relevant to energy consumption research.
The foundational difference between DWC and NFT systems lies in their root zone architecture, which directly dictates their energy consumption profiles and operational vulnerabilities.
- Deep Water Culture (DWC): In a DWC system, plant roots are fully submerged in a large, oxygenated reservoir of nutrient solution [12] [1]. This large volume of water acts as a significant thermal mass, buffering against rapid temperature fluctuations and providing inherent system stability [12] [1]. Furthermore, in the event of a power outage, the roots remain hydrated, granting a critical window of several hours to days before oxygen depletion becomes lethal [1]. This makes DWC notably more forgiving for new growers and resilient to equipment failure [12].
- Nutrient Film Technique (NFT): NFT operates by continuously circulating a thin film of nutrient solution over plant roots housed in slightly sloped channels [1]. This design is highly efficient in its use of water and nutrients but possesses a low buffering capacity [1]. The system is acutely vulnerable to pump failures, as the root zone can desiccate within hours, risking total crop loss [1]. Its shallow water volume is also highly sensitive to ambient temperature changes, requiring more precise environmental control [12] [1].
The following diagram illustrates the core operational logic and key energy considerations for each system.
Experimental Comparison and Energy-Use Efficiency
A controlled study provides quantitative evidence for comparing the energy efficiency of NFT and DWC systems. The experiment focused on cultivating lettuce (Lactuca sativa L. 'Little Gem'), a common leafy green, under identical environmental conditions to isolate the effect of the hydroponic system.
Experimental Protocol and Methodology
- Plant Material & Germination: Lettuce seeds were germinated in a growth chamber maintained at an ambient temperature of 18°C for a period of 21 days [4].
- Seedling Transplantation: After the germination phase, seedlings were transplanted into rockwool cubes and then transferred in equal numbers to separate NFT and DWC systems [4].
- Growing Conditions: Both systems were illuminated with LED lighting providing a Photosynthetic Photon Flux (PPF) of 200 µmol·m⁻²·s⁻¹. A photoperiod of 16 hours was maintained for a duration of 5 weeks [4].
- Data Collection: Throughout the growth cycle, standard crop growth parameters were monitored. Upon conclusion, the shoot fresh weight was measured for both systems to calculate the Energy-Use Efficiency (EUE) [4].
- Energy-Use Efficiency (EUE) Calculation: EUE was calculated as the mass of fresh biomass produced per unit of electrical energy input, expressed in grams per kilowatt-hour (g/kWh) [4]. This metric directly links yield to energy consumption.
Key Findings and Data Analysis
The experimental results revealed critical differences in both growth output and energy efficiency, as summarized in the table below.
Table 1: Comparative Experimental Results for Lettuce in NFT vs. DWC Systems
| Parameter | NFT System | DWC System | Contextual Notes |
|---|---|---|---|
| Energy-Use Efficiency (EUE) | 31.3 g/kWh [4] | 24.53 g/kWh [4] | Higher EUE indicates greater biomass produced per unit of energy consumed. |
| Shoot Fresh Weight | Significantly higher [4] | Lower [4] | A key yield metric for leafy greens like lettuce. |
| Leaf Count & Plant Height | Similar to DWC [4] | Similar to NFT [4] | These specific parameters showed no significant difference. |
| Root Length & Leaf Area | Significantly different from DWC [4] | Significantly different from NFT [4] | Highlights divergent root and canopy development. |
The data demonstrates that the NFT system outperformed DWC in EUE by approximately 28% under the conditions of this experiment [4]. This suggests that for compact, fast-growing crops like lettuce, NFT's design can translate into superior energy productivity. The following workflow maps the experimental protocol from setup to data analysis.
Optimization Strategy 1: Energy-Efficient LED Lighting
Lighting is often the largest energy consumer in indoor hydroponic systems. Optimizing this component is therefore essential for improving overall EUE.
LED Technology and Energy Savings
Light-Emitting Diodes (LEDs) represent the most energy-efficient lighting technology available for horticultural applications. According to the U.S. Department of Energy, quality LED bulbs use at least 75% less energy and can last up to 25 times longer than traditional incandescent lighting [51]. The key advantages of LEDs include:
- Directional Light Emission: LEDs emit light in a specific direction, drastically reducing losses from reflectors and diffusers required by other lighting types [51].
- Reduced Heat Output: LEDs emit very little heat compared to incandescent bulbs (which release 90% of their energy as heat) or CFLs (80%) [51]. This reduces the load on climate control systems, creating indirect energy savings.
- Spectral Control: LEDs can be engineered to emit specific wavelengths of light optimal for photosynthesis, ensuring that energy is not wasted on non-essential parts of the spectrum [52].
Experimental Implementation and Impact
In the cited lettuce study, the use of LED lighting with a defined PPF and photoperiod was a controlled variable [4]. This underscores its role as a foundational element in modern energy-use efficiency research. The strategic selection of LEDs over less efficient technologies like High-Pressure Sodium (HPS) or fluorescent lights is a primary optimization step that directly improves the EUE metric for both NFT and DWC systems [53] [4].
Optimization Strategy 2: High-Efficiency Pumps and Aeration
The second major target for energy optimization is the machinery responsible for water circulation and oxygenation, which includes water pumps and air pumps.
Pump Efficiency in NFT vs. Aeration in DWC
The energy priorities for each system differ:
- NFT Systems: The primary electrical load for water management is the water pump, which must run continuously to maintain the nutrient film [53] [1]. A pump failure is catastrophic [1]. Therefore, optimizing NFT involves selecting a high-efficiency, correctly sized water pump and ensuring it is powered by a reliable electricity source, often with a backup [53].
- DWC Systems: The most critical energy load is the air pump, which must run continuously to oxygenate the reservoir and prevent root suffocation [12] [1]. While a failure is less immediately catastrophic than in NFT, it remains a serious risk [1]. Optimization focuses on selecting an energy-efficient air pump and ensuring proper maintenance of air stones to maintain oxygenation efficiency [53].
Operational Cost and Risk Analysis
The table below summarizes the key energy drivers and risks associated with each system's hydraulic components.
Table 2: Pump and Aeration Energy Profile & Risk Analysis
| Component | NFT System | DWC System |
|---|---|---|
| Primary Energy Load | Water Circulation Pump [53] [1] | Aeration System (Air Pump) [1] |
| Run-time Requirement | Continuous [53] | Continuous [1] |
| Failure Impact & Risk | Very High: Pump failure leads to rapid root dessication and potential total crop loss within hours [1]. | High: Air pump failure leads to oxygen depletion; roots remain hydrated, providing a longer recovery window (hours to days) [1]. |
| Optimization Strategy | Use energy-efficient, correctly sized pumps; implement uninterruptible power supplies (UPS) or backup generators [53]. | Use energy-efficient air pumps; perform regular maintenance on air stones and lines; monitor dissolved oxygen levels [53]. |
The Researcher's Toolkit
To conduct replicable experiments in hydroponic energy consumption, researchers should standardize the following reagents and equipment.
Table 3: Essential Research Reagents and Materials
| Item | Function in Research |
|---|---|
| LED Grow Lights | Provides controllable, energy-efficient light source for photosynthesis. Key parameters to report include PPF and photoperiod [4] [51]. |
| Water/Air Pumps | Circulates nutrient solution (NFT) or oxygenates reservoir (DWC). Efficiency (GPH/W) and power consumption should be monitored [53] [1]. |
| Nutrient Solution | Supplies essential macro and micronutrients for plant growth. Standardized recipes and monitoring of Electrical Conductivity (EC) are necessary for reproducibility [52]. |
| pH/EC Meters | Critical for monitoring and maintaining nutrient solution chemistry, which directly affects plant health and growth rates, a key variable in EUE calculations [52]. |
| Data Logger | Automatically records environmental parameters (temperature, humidity, light levels) and energy consumption from smart plugs for high-fidelity data [52]. |
The choice between DWC and NFT systems involves a direct trade-off between resilience and ultimate efficiency. DWC offers greater buffer capacity and forgiveness, making it less risky for power interruptions and easier for novice researchers to manage [12] [1]. In contrast, the experimental data indicates that well-managed NFT systems can achieve a higher Energy-Use Efficiency (EUE) for certain crops, such as lettuce, making them potentially more productive per unit of energy input in a stable research environment [4].
The integration of energy-efficient LEDs is a universally applicable strategy that dramatically reduces the largest energy cost in indoor farming while providing superior control over the light spectrum [4] [51]. The optimization of pumps, while also universal, requires a system-specific approach: prioritizing reliability and efficiency in water pumps for NFT and in air pumps for DWC [53] [1].
For researchers, the decision framework should be guided by the specific goals of the inquiry. If the research priority is maximizing recorded EUE for leafy greens under ideal conditions, NFT may be superior. If the focus is on system robustness, fault tolerance, or growing a wider variety of crops, DWC presents a compelling alternative. Ultimately, this comparison confirms that there is no single "best" system, only the system that is best optimized for a defined set of research objectives and constraints.
In the context of sustainable agricultural technology, the energy efficiency of hydroponic systems is a critical area of research, particularly when comparing Deep Water Culture (DWC) and Nutrient Film Technique (NFT). System upkeep, especially preventative maintenance, is not merely an operational concern but a significant determinant of energy consumption. Clogged filters and inefficient equipment can drastically increase the energy demand of pumps and environmental control systems. This guide objectively compares the performance of DWC and NFT systems, framing the analysis within a broader thesis on energy consumption and providing supporting experimental data for a scientific audience.
Comparative Analysis of DWC and NFT Systems
Deep Water Culture (DWC) and Nutrient Film Technique (NFT) represent two predominant approaches to recirculating hydroponics. A performance comparison is essential to understand their inherent operational characteristics and their relationship with maintenance and energy use.
Table 1: Fundamental Characteristics of DWC and NFT Systems
| Characteristic | Deep Water Culture (DWC) | Nutrient Film Technique (NFT) |
|---|---|---|
| Basic Principle | Plant roots are fully suspended in a deep, aerated, nutrient-rich water reservoir [54]. | A thin film of nutrient-rich water flows continuously over roots in a sloped channel [55] [56]. |
| Root Zone Environment | Fully submerged, requiring active oxygenation (e.g., air stones) [54]. | Partially submerged; roots are exposed to air and nutrient film, promoting oxygen access [56]. |
| Inherent Water Efficiency | High, due to a closed, recirculating design that minimizes evaporation [54]. | High, as a small volume of water is recirculated with minimal waste [54]. |
| Primary Maintenance Concerns | Oxygen system failure, water temperature management, root rot [54]. | Pump failure, root clogging of channels, water temperature fluctuations [55]. |
Table 2: Documented System Performance and Resource Use
| Performance Metric | Deep Water Culture (DWC) | Nutrient Film Technique (NFT) | Experimental Context |
|---|---|---|---|
| Fresh Yield (Lettuce) | Baseline | 22.8% Higher in NFT [5] | Comparative study in a controlled greenhouse [5]. |
| Water Consumption | Baseline | 9.6% Higher in NFT [5] | Same study as above; increased transpiration linked to greater nutrient accumulation [5]. |
| Nitrogen (N) Uptake | Baseline | 9.2% Higher in NFT [5] | Measurement of nutrient content in plant tissue [5]. |
| Suitability for Crops | Wide range of crops [54] | Leafy greens, herbs, and small fruiting plants like strawberries [55] [56]. | Based on root system size and plant support needs [55] [54]. |
The data in Table 2, derived from a controlled study comparing lettuce growth, reveals a performance trade-off. While NFT systems can potentially yield more, they do so at the cost of higher water consumption and specific nutrient demands [5]. This interplay between yield and resource use is a key area where maintenance schedules impact overall efficiency.
The Impact of Maintenance on System Energy Consumption
The relationship between preventative maintenance and energy consumption is direct and multifaceted. Neglected maintenance leads to two primary issues: clogging and equipment strain.
The Science of Clogging
Clogging, whether in filters, pipes, or NFT channels, is fundamentally a hydrodynamic issue involving particle deposition in porous media or confined spaces [57]. This deposition reduces the system's permeability, increasing hydraulic resistance. To maintain the required flow rate, pumps must work against this increased resistance, leading to higher energy draw [57]. In severe cases, clogging can alter the entire system's flow dynamics, as noted in aquifer thermal energy storage systems, where it can significantly impact recovery efficiency—a concept transferable to hydroponic loop performance [58].
Energy Consequences in DWC vs. NFT
NFT Systems: These are highly vulnerable to energy waste from clogs. The narrow channels are susceptible to blockage by plant roots or debris [55]. A partial clog disrupts the critical, uniform thin film of water, potentially stranding plant roots. To compensate, growers may increase pump power, consuming more energy. A complete pump failure, often caused by a clogged intake filter, is catastrophic in NFT, as the shallow film of water depletes rapidly, leading to plant wilting within hours [55] [56].
DWC Systems: The primary maintenance-related energy cost in DWC involves the air pumps for oxygenation and water pumps for circulation. Clogged air stones force the air pump to operate at higher pressures, increasing energy use. Furthermore, because DWC uses a larger volume of water, heating or cooling this reservoir to an optimal temperature (e.g., 65-75°F or 18-24°C) is a significant energy expenditure [56]. Inefficient heating/cooling systems due to poor maintenance (e.g., scale buildup on heating elements) can drastically increase this energy load.
Experimental Protocols for Quantifying Energy and Hydraulic Performance
To objectively assess the impact of maintenance on system efficiency, researchers can employ the following experimental protocols.
Workflow for System Efficiency Analysis
The following diagram outlines a generalized experimental workflow to investigate the relationships between maintenance, clogging, and energy use in hydroponic systems.
Protocol 1: Measuring Pump Energy Draw Under Clogged Conditions
Objective: To quantify the increase in energy consumption of DWC and NFT system pumps in response to induced filter clogging.
- Setup: Use two identical loops for each system type (DWC and NFT). Install a new filter and a calibrated energy meter (e.g., a kilowatt-hour meter) on the power supply to the water pump.
- Baseline Measurement: For each system, measure and record the pump's energy draw (in kWh) and the system's flow rate (in L/min) over a 24-hour period with a clean filter.
- Induced Clogging: Introduce a standardized, quantified amount of particulate matter (e.g., fine clay particles or organic debris) into the system reservoir to simulate the gradual clogging of the mechanical filter.
- Data Collection: Continuously monitor and record the pump's energy draw and the system flow rate. The experiment concludes when the flow rate drops to 50% of its baseline value or after a predetermined time.
- Data Analysis: Plot energy draw against flow rate. The correlation demonstrates the energy cost of overcoming the hydraulic resistance caused by a clogged filter. The slope of this curve can be a key performance indicator (KPI) for the system's energy sensitivity to clogging.
Protocol 2: Assessing the Impact of Maintenance on Temperature Stability
Objective: To evaluate how preventative maintenance (cleaning of heating/cooling elements) affects energy efficiency in maintaining root zone temperature.
- Setup: Utilize DWC systems, as they are more sensitive to water temperature fluctuations. Fit systems with immersion heaters and/or chillers connected to a temperature controller.
- Experimental Groups:
- Group A (Maintained): Heating/cooling elements are cleaned and descaled weekly.
- Group B (Neglected): No maintenance is performed on the elements.
- Data Collection: Over a growth cycle, use a data logger to record:
- The water temperature.
- The on/off cycles and cumulative run-time of the heater and chiller.
- The total energy consumption of the temperature control system.
- Data Analysis: Compare the total energy consumption between Group A and Group B. The difference quantifies the energy waste resulting from poor maintenance. Monitor temperature stability (coefficient of variation) to assess the impact on the growing environment [59].
The Scientist's Toolkit: Key Research Reagents and Materials
Table 3: Essential Materials for Hydroponic Energy and Maintenance Research
| Item | Function in Research Context |
|---|---|
| Energy Meter (Kill A Watt type) | Precisely measures pump, heater, and lighting energy draw (kWh), providing primary data for efficiency calculations. |
| Flow Meter & Data Logger | Measures the flow rate in the system; a drop in flow is a direct indicator of developing clogs or pump inefficiency. |
| pH & EC (Electrical Conductivity) Meters | Critical for monitoring nutrient solution quality and concentration [56]. Drifts in EC can indicate nutrient imbalances related to flow problems. |
| Data Logging Thermometer | Tracks root zone temperature stability in DWC reservoirs [56] and NFT channels [55], a factor influenced by equipment performance and a driver of energy use. |
| Dissolved Oxygen Meter | Monitors oxygen levels in DWC systems; crucial for assessing the performance and potential clogging of aeration systems [54]. |
| Hydraulic Pressure Sensor | Placed before and after filters and pumps to measure pressure drop (ΔP), a sensitive and direct measure of clogging severity [57]. |
The choice between DWC and NFT involves a complex trade-off between yield potential, resource use efficiency, and operational resilience. NFT systems can offer higher yields for certain crops but are more immediately vulnerable to energy waste and crop loss from pump-related failures and clogs [55] [5]. DWC systems, while potentially less productive by yield metrics, possess a larger buffer capacity in their reservoir, making them less immediately sensitive to pump failures, though highly sensitive to temperature control energy costs [56] [54].
This analysis demonstrates that preventative maintenance is not a mere operational task but a critical component of energy optimization. A structured schedule for cleaning filters, inspecting pumps, and maintaining temperature control systems is essential for minimizing energy waste. Future research should focus on integrating sensor data for predictive maintenance and quantifying the lifetime energy costs of these systems, providing a more robust framework for sustainable agricultural technology development.
In the context of sustainable agricultural research, the optimization of energy consumption is a critical factor for the viability and environmental footprint of controlled environment agriculture. This guide objectively compares energy performance within a specific segment of this field: deep water culture (DWC) versus nutrient film technique (NFT) hydroponic systems. The focus is on leveraging data analytics, artificial intelligence (AI), and predictive models to transition from reactive to proactive energy management. For researchers and scientists, this involves a meticulous process of data collection, model training, and system optimization to achieve significant reductions in energy use without compromising crop yield or quality. The following sections provide a comparative analysis of the energy profiles of DWC and NFT systems, detail experimental protocols for quantifying energy-use efficiency, and outline a framework for implementing AI-driven energy management strategies.
Comparative Analysis: Energy Consumption in DWC vs. NFT Hydroponics
The fundamental operational differences between Deep Water Culture (DWC) and Nutrient Film Technique (NFT) systems create distinct energy consumption profiles. A thorough understanding of these profiles is a prerequisite for applying targeted data analytics.
In a DWC system, plants are suspended over a deep reservoir of nutrient solution, with their roots fully submerged. Oxygen is supplied via air pumps and air stones, which constitute a primary, continuous energy load. A significant secondary energy load can come from the need for thermal regulation, as the large volume of water has high thermal mass and may require heating or cooling to maintain an optimal root zone temperature [1] [2]. NFT systems, in contrast, use a shallow, sloping channel through which a thin film of nutrient solution continuously flows. The main energy load typically comes from the water pump that circulates the solution. Due to the low volume of water in the channels, NFT systems are more susceptible to rapid temperature fluctuations from ambient air conditions, but require less energy for actively heating or cooling the nutrient solution itself [1] [60].
A controlled study provides critical quantitative data for this comparison. Research conducted within an aquaponics facility monitored the energy consumption of both systems for growing lettuce (Lactuca Sativa L. ‘Little Gem’) under identical artificial lighting. The study found a significant difference in Energy-Use Efficiency (EUE), which is defined as the grams of fresh shoot weight produced per kilowatt-hour of energy consumed [4].
Table 1: Experimental Energy-Use Efficiency (EUE) Comparison for Lettuce Production
| Hydroponic System | Energy-Use Efficiency (EUE) | Key Energy Loads |
|---|---|---|
| Nutrient Film Technique (NFT) | 31.3 g/kWh [4] | Water circulation pumps, environmental control. |
| Deep Water Culture (DWC) | 24.53 g/kWh [4] | Aeration pumps, water temperature control (chillers/heaters). |
This data indicates that the NFT system was approximately 28% more energy-efficient for producing the same crop under the specified conditions [4]. However, it is crucial to contextualize this finding. This EUE metric encompasses the total energy input, which was likely dominated by lighting. The result suggests that the NFT system facilitated a higher growth yield (shoot fresh weight) for the same energy cost, potentially due to better root zone oxygenation or nutrient uptake dynamics under that experimental setup.
Table 2: Systemic Energy and Risk Profile: DWC vs. NFT
| Factor | Deep Water Culture (DWC) | Nutrient Film Technique (NFT) |
|---|---|---|
| Primary Energy Loads | Aeration, water temperature control [1]. | Water circulation pumps [1]. |
| Temperature Buffer | High thermal mass provides stability but requires more energy to adjust [1] [61]. | Low water volume is sensitive to ambient temperature, requiring less energy for active control [1]. |
| Failure Resilience | High; roots remain submerged during pump failure, allowing a longer response window [1]. | Low; pump failure leads to rapid root drying and potential crop loss within hours [1] [13]. |
| Crop Suitability | Broader; supports larger, fruiting plants (e.g., tomatoes, peppers) [1]. | Narrower; ideal for lightweight, fast-growing crops (e.g., lettuce, herbs) [1] [60]. |
Experimental Protocols for Energy Monitoring and Data Collection
To gather actionable data for AI and predictive modeling, researchers must implement rigorous and standardized experimental protocols. The following methodology, adapted from a published study, provides a template for quantifying energy-use efficiency.
Experimental Methodology for EUE Calculation
This protocol is designed to directly compare the EUE of NFT and DWC systems under controlled conditions [4].
System Setup:
- Establish identical NFT and DWC systems in a controlled environment (e.g., growth chamber, plant factory).
- NFT System: Use sloped channels with a continuous flow of nutrient solution provided by a water pump.
- DWC System: Use reservoirs with air pumps and air stones to oxygenate the nutrient solution.
- Ensure the reservoir volume and material are standardized where possible, acknowledging the inherent design differences.
Plant Material & Growth Conditions:
- Crop Selection: Select a suitable crop such as lettuce (Lactuca Sativa).
- Germination: Germinate seeds in a growth chamber at a set temperature (e.g., 18°C) for a fixed period (e.g., 21 days).
- Transplantation: Transplant seedlings into rockwool cubes and place them in their respective systems (NFT channels and DWC rafts) in equal numbers.
- Environmental Control: Maintain consistent ambient temperature, humidity, and CO₂ levels for both systems.
- Lighting: Illuminate both systems with LED lights. A suggested protocol uses a photosynthetic photon flux (PPF) of 200 µmol·m⁻²·s⁻¹ with a 16-hour photoperiod for the growth phase [4].
Data Collection:
- Energy Monitoring: Install energy meters (e.g., kilowatt-hour meters) to record the total energy consumption of each system, including pumps, aeration devices, and climate control systems, for the duration of the growth cycle.
- Growth Parameters: At the end of the trial, measure:
- Shoot fresh weight (g) – the primary yield metric for EUE.
- Leaf count and area.
- Root length and biomass.
Data Analysis:
- Calculate the Energy-Use Efficiency (EUE) for each system using the formula:
EUE (g/kWh) = Total Shoot Fresh Weight (g) / Total Energy Consumed (kWh) - Perform statistical analysis (e.g., t-test) to determine if the differences in EUE and growth parameters between the systems are significant.
- Calculate the Energy-Use Efficiency (EUE) for each system using the formula:
Workflow for an AI-Driven Energy Management Research Project
The following diagram visualizes the end-to-end workflow for a research project integrating AI into the energy management of hydroponic systems.
Diagram 1: AI-Driven Energy Management Research Workflow
The Scientist's Toolkit: Key Solutions for AI-Driven Energy Research
Implementing the workflow above requires a suite of research reagents, hardware, and software solutions. The table below details essential components for building a research capability in this field.
Table 3: Essential Research Toolkit for AI-Driven Energy Management
| Category / Solution | Function in Research | Specific Examples & Notes |
|---|---|---|
| Data Acquisition Hardware | ||
| IoT Sensors & Smart Meters | Collect real-time data on energy consumption (kWh), temperature, humidity, water pH/EC, dissolved oxygen, and light levels [62] [63]. | Critical for creating a high-resolution dataset for model training. |
| Data Management & Analytics | ||
| Cloud Computing Platforms | Provide scalable storage and processing power for large datasets generated by continuous monitoring [63]. | Amazon Web Services (AWS), Microsoft Azure, Google Cloud. |
| Predictive Analytics Software | Platforms used to build, train, and deploy machine learning models for forecasting and optimization [62]. | IBM SPSS, Microsoft Azure Machine Learning, Siemens MindSphere [62]. |
| Data Visualization Tools | Translate complex datasets and model outputs into interpretable graphs and dashboards for analysis [62]. | Tableau, custom dashboards built with Python or R [62] [64]. |
| AI & Machine Learning Models | ||
| Regression Analysis / Neural Networks | Models used to predict future energy demand based on historical data, weather forecasts, and crop growth stage [62]. | Accuracy depends on data quality and feature selection. |
| Reinforcement Learning | An AI technique where models learn optimal control strategies (e.g., for HVAC, pumps) through trial and error to maximize energy savings [63]. | Used for managing energy storage and real-time system adjustments. |
| System Integration | ||
| Digital Twin Technology | A virtual replica of the physical hydroponic system used to simulate and test optimization strategies without risk to the actual crop [62]. | Allows for scenario modeling and hypothesis testing. |
Implementing AI for Predictive Energy Management
The transition from data collection to actionable AI-driven management involves a structured process. Industrial AI solutions, such as Schneider Electric's EcoStruxure Industrial Advisor, demonstrate a viable framework. This solution employs predictive machine learning models to optimize plant utility systems, achieving reported energy consumption reductions of up to 10% and associated carbon emissions reductions of up to 40% [65]. The implementation follows a secure, five-step process: data connection from IoT devices, data processing and model development, AI-based analysis and generation of optimization recommendations, human review and validation of insights by plant experts, and execution of the optimized settings [65]. This human-in-the-loop approach is critical for building trust and ensuring agronomic factors are considered.
The core of predictive analytics lies in applying machine learning models to the collected data. For energy management, these models can forecast short-term energy demand, allowing a system to pre-cool water or shift non-essential operations to off-peak hours [62] [63]. Furthermore, predictive maintenance models can analyze data from vibration and current sensors on pumps and aerators to identify anomalies that precede equipment failures, enabling timely intervention, reducing downtime, and preventing energy waste from inefficient operation [62] [64].
The following diagram illustrates the core logical process of a predictive model for energy management, from data input to actionable output.
Diagram 2: Predictive Model Logic for Energy Management
The integration of data analytics and AI presents a transformative opportunity for proactive energy management in hydroponic research and production. The experimental data indicates that system choice itself—NFT versus DWC—has a significant impact on baseline energy-use efficiency, with NFT showing a potential advantage for certain crops like lettuce [4]. However, beyond this fundamental choice, lies a greater opportunity for optimization. By implementing standardized experimental protocols for energy monitoring and leveraging the toolkit of IoT sensors, machine learning models, and predictive analytics, researchers can move beyond static comparisons. They can develop dynamic, AI-driven systems that continuously learn and adapt to minimize energy consumption. This approach not only reduces operational costs and environmental impact but also enhances system resilience and reliability, contributing to the advancement of sustainable and precision agriculture.
Data-Driven Comparison: Validating Energy, Yield, and Environmental Performance
Within the fields of controlled environment agriculture (CEA) and hydroponic research, the optimization of energy use is a critical factor for economic viability and environmental sustainability. The energy used to power system components like pumps and aerators, as well as to manage solution temperatures, constitutes a significant portion of operational overhead. This guide provides a objective analysis of the Energy Use Efficiency (EUE), measured in grams per kilowatt-hour (g/kWh), of two predominant hydroponic systems: Deep Water Culture (DWC) and the Nutrient Film Technique (NFT). Framed within broader research on energy consumption, this comparison synthesizes data from peer-reviewed studies to serve scientists, researchers, and professionals involved in optimizing agricultural systems for drug development and other high-value plant production applications.
Energy Use Efficiency (EUE) quantifies the biomass produced per unit of energy consumed, providing a direct metric for evaluating the sustainability and cost-effectiveness of agricultural systems. The following table consolidates available EUE data from relevant studies for direct comparison.
Table 1: Comparative Energy Use Efficiency (EUE) in Hydroponic Systems
| Hydroponic System | Crop | Energy Use Efficiency (EUE) | Comparative EUE Performance | Citation |
|---|---|---|---|---|
| Substrate-Culture | Strawberry | Highest EUE among systems studied | Outperformed all water-culture systems, including NFT and aeroponics [66]. | [66] |
| Vertical Tower | Strawberry | Promising EUE | Showed competitive performance, though was outperformed by the substrate system [66]. | [66] |
| Aeroponics | Strawberry | Greater Water Use Efficiency (WUE) vs. NFT | EUE was not the primary metric; however, the system demonstrated higher water efficiency [15]. | [15] |
| Nutrient Film Technique (NFT) | Strawberry | Lower EUE | Was outperformed by both substrate and vertical tower systems in a multi-system comparison [66]. | [66] |
| Deep Water Culture (DWC) | Lettuce | Not Significantly Different from NFT | A direct comparison found no significant difference in biomass productivity or EUE for lettuce crops [67]. | [67] |
Key Findings on EUE
The available peer-reviewed data indicates that the choice of hydroponic system significantly impacts EUE, though a direct, conclusive EUE (g/kWh) comparison between DWC and NFT for a single crop is limited. A 2023 study found no statistically significant difference in biomass productivity or EUE between DWC and NFT systems when growing 'Rex Butterhead' lettuce [67]. Conversely, a 2025 study on strawberries revealed that substrate-based systems achieved a higher EUE than water-culture systems, including NFT [66]. This suggests that crop type is a critical variable in determining the most energy-efficient system. Furthermore, aeroponic systems, while not directly reporting EUE, have demonstrated superior Water Use Efficiency (WUE) compared to NFT, highlighting that efficiency metrics must be considered alongside energy data [15].
Experimental Protocols and Methodologies
A critical analysis of EUE data requires a thorough understanding of the experimental designs from which it is derived. The following section details the methodologies of key studies cited in this guide.
Protocol: Comparative Performance of NFT and DWC in GREENBOX Technology
Objective: To compare the crop growth performance and productivity of lettuce between DWC and NFT systems in a controlled environment [67]. Summary: This study provides a direct, controlled comparison of NFT and DWC, making its methodology particularly relevant.
- System Setup: Two identical GREENBOX units were used. These are thermally insulated, climate-controlled chambers with artificial lighting [67].
- Hydroponic Systems: One unit was fitted with a DWC system, the other with an NFT system. Both used commercially available equipment [67].
- Plant Material & Growth: 'Rex Butterhead' Lettuce (Lactuca sativa) plugs were grown for 14 days before being transferred into the systems. The plants were arranged in a 4x6 configuration and grown for 30 days to full bloom [67].
- Data Collection: Researchers collected data on wet weight (g), dry weight (g), leaf area (cm²), and chlorophyll concentration (µmol/m²) [67].
- Data Analysis: Derived parameters, including Specific Leaf Area (SLA) and biomass productivity (kg/m²), were calculated. A Paired t-test was used to determine statistical significance between the systems [67].
- Outcome: The study concluded that both systems could grow lettuce to harvest weight with no significant differences in biomass parameters or productivity [67].
Protocol: Performance of Substrate and Water-Culture Systems for Strawberry
Objective: To compare the yield and resource use efficiencies (including EUE) of strawberry plants grown in substrate-culture and various water-culture systems in a greenhouse [66]. Summary: This study is a key source for EUE data but involves a broader comparison beyond just DWC and NFT.
- Location & Conditions: The experiment was conducted in a polycarbonate greenhouse at the University of Georgia. Environmental conditions (air temperature, relative humidity, vapor pressure deficit) were meticulously monitored and controlled [66].
- Systems Compared: The study included one substrate-culture system and three water-culture systems: Nutrient Film Technique (NFT), vertical tower (stacked nutrient flow), and aeroponics (nutrient misted roots) [66].
- Plant Material: Two strawberry cultivars, 'Florida Brilliance' and 'Florida Beauty', were used to evaluate genotypic differences [66].
- Duration: The experiment lasted 129 days [66].
- Input/Output Quantification: The study quantified system inputs (water, energy, and footprint area) and outputs (yield, biomass) over the entire growth cycle [66].
- Efficiency Calculation: Fruit yield was used to calculate water (WUE), energy (EUE), and area (AUE) use efficiencies [66].
- Outcome: The substrate system performed best in terms of yield and resource use efficiencies, with the vertical tower system also showing promising results [66].
System Selection and Energy Consumption Workflow
The decision to use either DWC or NFT involves a trade-off between system resilience and resource efficiency, which directly influences energy consumption patterns. The following diagram illustrates the logical pathway for selecting a system based on key operational parameters and their subsequent impact on EUE.
Diagram 1: System Selection and EUE Logic
This workflow demonstrates that the path to selecting DWC or NFT is governed by crop requirements and operational priorities, which in turn dictate the primary energy loads of the system. These energy loads are a direct input into the final EUE calculation.
The Scientist's Toolkit: Key Research Reagents and Materials
For researchers aiming to replicate or design experiments comparing hydroponic systems, a standardized set of materials and reagents is essential. The following table details critical components used in the featured studies.
Table 2: Essential Research Reagents and Materials for Hydroponic Comparison Studies
| Item Name | Function in Experimental Protocol | Specific Example / Note |
|---|---|---|
| Soilless Growing Media | Provides physical support for plant roots in substrate-based systems; its composition can affect water and nutrient retention [66]. | Common mixes include peat, coco coir, and perlite [66]. |
| Net Pots | Holds the plant and (if used) growing medium in place, allowing roots to access the nutrient solution below [2]. | Typically made of plastic and used in both DWC and NFT systems. |
| Nutrient Solution | Aqueous solution containing all essential macro and micronutrients required for plant growth. Its formulation is a key experimental variable [1]. | Composition (EC, pH, specific ion concentrations) must be meticulously monitored and controlled [1]. |
| Air Pump & Air Stones | Critical for oxygenating the nutrient solution in DWC systems to prevent root anoxia [1] [2]. | Failure of this component is a major risk for DWC systems [1]. |
| Water Pump | Circulates the nutrient solution from the reservoir to the channels in an NFT system, creating the essential "film" of solution [1]. | Failure of this component is a major risk for NFT systems [1]. |
| pH & EC Meters | For monitoring and maintaining the chemical environment of the nutrient solution, which is critical for plant health and nutrient uptake [1] [67]. | Regular calibration is required for accurate data. |
| Data Logger | Automatically records environmental data (e.g., temperature, humidity, light levels) over the course of the experiment [66]. | Essential for correlating plant performance with environmental conditions. |
| Climate-Controlled Chamber | Provides a stable, reproducible environment (GREENBOX, greenhouse) by regulating temperature, humidity, and light [66] [67]. | Allows for the isolation of system performance from external environmental variability. |
In the pursuit of sustainable agricultural solutions for a growing global population, controlled environment agriculture (CEA) offers a pathway to enhance food security. Within this domain, two hydroponic systems—Deep Water Culture (DWC) and Nutrient Film Technique (NFT)—are frequently employed for the commercial production of leafy greens and herbs [1] [68]. The selection between these systems represents a critical operational decision, as it involves fundamental trade-offs between yield, product quality, and resource consumption [1] [15]. This analysis provides a structured comparison of DWC and NFT systems, focusing on fresh weight, growth rates, and phytochemical content, all framed within the critical context of energy input. The objective is to deliver a data-driven guide that informs researchers and commercial growers in selecting the optimal system to align with their production goals, whether oriented towards maximum biomass, enhanced nutrient density, or operational energy efficiency.
The fundamental difference between DWC and NFT lies in the root zone environment, which directly influences their operational parameters and energy profiles.
Deep Water Culture (DWC) suspends plant roots in a deep, oxygenated reservoir of nutrient solution [1] [12]. Plants are typically held in place by floating rafts or lids, and aeration is provided by air pumps and air stones. The large volume of water acts as a significant thermal buffer, promoting root zone temperature stability [1] [12].
Nutrient Film Technique (NFT) operates by continuously circulating a thin film of nutrient solution through slightly sloped channels, with the upper portion of the roots exposed to air [1]. This design is highly efficient in its use of water and nutrients but contains a low fluid volume, making it highly sensitive to ambient temperature fluctuations and pump failures [1].
Table 1: Fundamental Characteristics of DWC and NFT Systems
| Characteristic | Deep Water Culture (DWC) | Nutrient Film Technique (NFT) |
|---|---|---|
| Root Zone Environment | Roots fully submerged in a static, aerated solution [1] | Roots exposed to a thin, flowing film of solution; upper roots in air [1] |
| Water Volume | High | Very Low |
| Inherent Oxygenation | Requires active aeration (air pumps/stones) [1] | Passive oxygenation from air-exposed roots [1] |
| Buffer Capacity | High buffering capacity for temperature, pH, and EC [1] [12] | Low buffering capacity; rapid shifts in parameters [1] |
| Primary Energy Consumers | Water/air pumps, potential water chillers/heaters [1] | Water circulation pumps, minimal temperature control [1] |
Comparative Analysis of Agronomic Performance
Yield and Growth Rate
Research indicates that yield performance is not universally superior in one system but is significantly influenced by crop type and seasonal conditions. A controlled study on butterhead lettuce found that the DWC system provided more stable water temperatures, which supported better photosynthetic rates and a 13.0% higher fresh yield in fall growing conditions compared to NFT [69]. Conversely, another study reported that NFT-grown lettuce could achieve a 22.8% higher fresh yield and a 27.7% higher dry yield than DWC in summer conditions, though this was coupled with a 9.6% increase in water consumption [5]. This suggests that NFT may facilitate greater nutrient uptake and growth under optimal, well-managed conditions, but DWC offers greater resilience and consistency, particularly in the face of environmental fluctuations.
Phytochemical and Nutrient Content
The root zone environment significantly impacts plant metabolic processes and the accumulation of health-promoting compounds. DWC has demonstrated a capacity to enhance the synthesis of certain phytochemicals. Studies on lettuce have shown that the stable environment of DWC can lead to produce with higher antioxidant concentrations, including 9.4% higher vitamin C, 34.6% higher total carotenoids, and 40.6% higher non-acidified phenols in fall harvests compared to NFT [69]. Similarly, research on tomatoes has confirmed that DWC-grown fruit can contain significantly higher levels of lycopene and β-carotene than those grown in NFT or soil systems [31]. These compounds are not only key nutrients but also influence crop quality and marketability. Furthermore, DWC has been associated with reduced incidence of tipburn in lettuce, a disorder linked to calcium deficiency, as it supported higher shoot calcium and magnesium concentrations than NFT [69].
Table 2: Agronomic Performance and Phytochemical Content of Lettuce in DWC vs. NFT
| Performance Metric | Deep Water Culture (DWC) | Nutrient Film Technique (NFT) | Notes & Experimental Context |
|---|---|---|---|
| Fresh Yield (Lettuce) | Variable | Variable | DWC superior in fall; NFT superior in summer [69] [5] |
| Dry Yield (Lettuce) | Lower [5] | Higher (27.7%) [5] | Measured in summer growing conditions [5] |
| Vitamin C | Higher (9.4%) [69] | Lower [69] | Measured in fall growing conditions [69] |
| Total Carotenoids | Higher (34.6%) [69] | Lower [69] | Measured in fall growing conditions [69] |
| Total Chlorophyll | Higher (12.9%) [69] | Lower [69] | Measured in summer growing conditions [69] |
| Mineral Uptake (N, Ca, S) | Lower [5] | Higher [5] | NFT showed 9.2-33.9% higher uptake of specific nutrients [5] |
| Tipburn Incidence | Lower [69] | Higher [69] | Associated with lower shoot Ca and Mg in NFT [69] |
Energy Input and Resource Use Efficiency
The operational energy demands of DWC and NFT stem from their distinct designs. NFT's primary energy consumption comes from water circulation pumps, which run continuously. While individually these pumps may be low-power, the consequences of their failure are severe, with the potential for total crop loss within hours due to the rapid drying of roots [1]. DWC systems also use electricity for water and air pumps. However, its most significant energy trade-off lies in thermal management. The large volume of water in DWC provides inherent temperature stability, often reducing the need for active cooling or heating [1] [12]. Conversely, if the water temperature does move outside the optimal range, the energy required to correct it is substantial due to the high volume [1]. NFT, with its low water volume, is highly susceptible to ambient temperature swings and may require more consistent, albeit less intensive, energy input for environmental control to protect the root zone [1].
Regarding other resources, NFT is typically more efficient, using less water and nutrients due to its recirculating design [1] [15]. DWC, while still recirculating, has higher baseline water usage [1]. However, this very characteristic contributes to its resilience; in a power outage, DWC provides a safety buffer of several days, whereas NFT's window for intervention is a matter of hours [1] [12].
Diagram 1: Energy and operational risk logic in DWC vs. NFT. DWC's thermal mass reduces HVAC load, while NFT's low water volume increases it. NFT also carries higher operational risk from pump failure.
Experimental Protocols for System Comparison
To ensure the validity and reproducibility of comparative studies between DWC and NFT, researchers must standardize protocols to isolate the effect of the system design. The following outlines a generalized experimental framework suitable for evaluating key parameters like yield, phytochemical content, and resource use efficiency.
System Setup and Plant Material
- Growth Chambers/Greenhouses: Experiments should be conducted in a controlled environment where temperature, humidity, and light intensity/photoperiod are monitored and kept uniform across all treatments [31].
- System Replication: A minimum of four replicate systems for each hydroponic design (DWC and NFT) is recommended, with each system containing multiple plants (e.g., nine lettuce plants per unit) to allow for robust statistical analysis [69] [5].
- Plant Material & Nutrition: Use a uniform plant cultivar (e.g., Lactuca sativa 'Butterhead') [69] [5]. The nutrient solution formulation (macro and micronutrients) and its initial pH and Electrical Conductivity (EC) must be identical across all systems and maintained at consistent levels throughout the trial to avoid nutritional confounding [31].
- Data Collection Schedule: Key metrics should be tracked weekly and at harvest.
Key Measured Parameters
- Growth and Yield: Leaf area, fresh weight of shoots and roots, and dry weight (after oven-drying) [69] [5].
- Photosynthetic Properties: Leaf gas exchange measurements, including photosynthetic rate and transpiration [69] [5].
- Water and Nutrient Use: Total water consumption and periodic analysis of nutrient solution composition to track uptake [69] [5] [31].
- Crop Quality: Analysis of mineral nutrients in plant tissue, total chlorophyll, carotenoids, vitamin C, and specific phytochemicals like lycopene or phenolics via spectrophotometry or HPLC [69] [31].
- Visual Quality: Assessment of disorders like tipburn [69].
Diagram 2: Experimental workflow for comparing DWC and NFT systems. The process ensures controlled, reproducible data on agronomic and qualitative outputs.
Essential Research Reagents and Materials
The following reagents and materials are critical for establishing controlled experiments and analyzing the resulting data from DWC and NFT trials.
Table 3: Key Research Reagents and Materials for Hydroponic Comparison Studies
| Reagent/Material | Function in Research | Application Example |
|---|---|---|
| Hydroponic Fertilizers | Source of essential macro (N, P, K, Ca, Mg, S) and micronutrients (Fe, Mn, B, etc.) [31]. | Formulating a standardized nutrient solution with a specific EC and pH for all system replicates to ensure uniform plant nutrition [31]. |
| pH & EC Adjustment Reagents | To maintain the nutrient solution within optimal physiological ranges (e.g., pH 5.5-6.5; EC 1.5-2.5 mS/cm) [1]. | Using potassium hydroxide (KOH) to raise pH or phosphoric acid (H₃PO₄) to lower pH; adding water to lower EC [1]. |
| Spectrophotometry Reagents | For quantitative analysis of key phytochemicals in plant tissue [69]. | Measuring total chlorophyll and carotenoid content using solvents like acetone or dimethyl sulfoxide (DMSO) for extraction [69]. |
| HPLC Standards | For precise identification and quantification of specific antioxidant compounds [31]. | Analyzing levels of ascorbic acid (Vitamin C), lycopene, or β-carotene using authenticated commercial standards for calibration [31]. |
| Plant Tissue Digestion Reagents | For mineral nutrient analysis of plant shoots and roots [69] [5]. | Using strong acids (e.g., nitric acid) in a digestion block to prepare samples for analysis via Inductively Coupled Plasma (ICP) spectroscopy [69] [5]. |
The choice between DWC and NFT is not a matter of declaring a universal winner but of aligning system strengths with specific research or production objectives. DWC offers greater resilience, crop quality (phytochemical content), and temperature stability, making it a robust choice for reliable production and for growers prioritizing enhanced nutrient density [69] [31] [12]. Its higher buffer capacity also makes it more forgiving for new operators. In contrast, NFT can, under optimal management, achieve high growth rates and superior water use efficiency, but it demands more precise control and carries a higher inherent risk from system failure [1] [5]. Ultimately, the optimal system is contingent upon the specific weight assigned to the key trade-offs: the value of yield stability versus potential peak yield, the importance of premium phytochemical content, and the operational cost and complexity of managing energy for temperature control versus pump redundancy. Future research should continue to quantify these trade-offs, especially in relation to integrated energy models that account for both direct electrical inputs and the indirect energy consequences of system resilience and crop loss risk.
Water Use Efficiency in the Context of Energy Consumption
In contemporary controlled environment agriculture, the optimization of resource use is paramount. This guide provides an objective comparison of two predominant hydroponic systems—Deep Water Culture (DWC) and the Nutrient Film Technique (NFT)—focusing on the critical synergy and trade-offs between water use efficiency and energy consumption. As global agricultural systems face increasing pressure from water scarcity and rising energy costs, understanding these dynamics is essential for researchers, scientists, and commercial developers seeking to implement sustainable and economically viable plant production protocols. The analysis is framed within a broader research thesis on energy consumption, providing a quantitative foundation for system selection based on empirical data and established experimental protocols.
Deep Water Culture (DWC) Hydroponic Systems
In a Deep Water Culture (DWC) system, plants are suspended over a deep, aerated reservoir of nutrient solution, with their roots fully submerged 24/7 [1]. The defining mechanical feature is the reliance on a robust aeration system, typically comprising air pumps and air stones, which constantly bubble oxygen into the water to prevent root suffocation [1]. The significant volume of water in a DWC system acts as a substantial buffer, conferring high resilience against power interruptions and stabilizing root zone temperature against ambient fluctuations [1]. This large thermal mass, however, can necessitate energy-intensive water chillers or heaters to maintain optimal temperatures [1]. DWC supports a wider range of crop types, including larger fruiting plants like tomatoes and peppers, in addition to leafy greens [1].
Nutrient Film Technique (NFT) Hydroponics
The Nutrient Film Technique (NFT) operates on a fundamentally different principle. Plants are secured in slightly sloped channels, where a very thin, continuous "film" of nutrient solution flows past the bare roots [1]. This design exposes the upper sections of the root system to the air, providing oxygenation without the need for forced aeration [1]. The minimal water volume makes NFT highly efficient in its use of water and nutrients but also renders it vulnerable to rapid drying out in the event of pump failure, creating a critical operational risk [1]. Its design is best suited for lightweight, fast-growing crops such as leafy greens, herbs, and strawberries [1].
The logical relationship between the core operational requirements, inherent risks, and resource consumption profiles of each system is detailed in the diagram below.
Quantitative Performance Comparison
Direct experimental comparisons and commercial analyses reveal distinct performance profiles for each system. The following tables summarize key quantitative data on energy-use efficiency, operational parameters, and commercial viability.
Table 1: Experimental Growth and Energy-Use Efficiency (EUE) Data [4]
| Parameter | Nutrient Film Technique (NFT) | Deep Water Culture (DWC) |
|---|---|---|
| Energy-Use Efficiency (EUE) | 31.3 g.kWh⁻¹ | 24.53 g.kWh⁻¹ |
| Shoot Fresh Weight | Significantly Higher | Lower |
| Leaf Area | Significantly Larger | Smaller |
| Root Length | Significantly Longer | Shorter |
| Leaf Count & Plant Height | Similar to DWC | Similar to NFT |
Table 2: Operational and Commercial Comparison Summary [1]
| Factor | Nutrient Film Technique (NFT) | Deep Water Culture (DWC) |
|---|---|---|
| Water Efficiency | High (Recirculating thin film) | Lower (Large static volume) |
| Temperature Buffer | Low (Sensitive to ambient air) | High (Stable root zone) |
| System Failure Risk | High (Rapid dry-out from pump failure) | Moderate (Slower O₂ depletion from air pump failure) |
| Crop Suitability | Leafy greens, herbs, strawberries | Leafy greens, herbs, tomatoes, peppers, cucumbers |
| Disease Spread Risk | High (Shared film facilitates pathogen movement) | Moderate (Risk in poorly managed water) |
| Management Complexity | Precision required for pH/EC shifts | Stability management for large water volume |
Table 3: Profitability Factor Summary (NFT vs. DWC) [1]
| Profitability Factor | Nutrient Film Technique (NFT) | Deep Water Culture (DWC) |
|---|---|---|
| Operational Cost Drivers | Lower water/nutrient costs; higher pump failure risk | Potential for higher energy cost for water temp control |
| Revenue Potential | High for suited crops (leafy greens, herbs) | Broader crop flexibility allows for higher-value crops |
| Risk Impact on Profit | High financial risk from rapid crop loss | Lower immediate risk from pump failure |
Experimental Protocols and Methodologies
To ensure the reproducibility of the comparative data cited in this guide, the following detailed methodology is provided, based on a controlled experiment evaluating Energy-use Efficiency (EUE) in NFT and DWC systems [4].
Experimental Workflow
The standardized protocol for comparing hydroponic system performance involves several key stages, from plant preparation to final data collection, as visualized in the workflow below.
Plant Material and Germination:
- Crop: Lactuca Sativa L. 'Little Gem' (leafy green crop).
- Germination Environment: Seeds are placed in a controlled growth chamber.
- Environmental Parameters: Ambient temperature is maintained at 18°C with a 12-hour photoperiod.
- Lighting: Irradiation is provided by Light-Emitting Diodes (LEDs) with a Photosynthetic Photon Flux (PPF) of 140 µmol·s⁻¹.
- Duration: This stage lasts for 21 days.
Transplantation:
- After 21 days, the seedlings are transplanted into rockwool cubes.
- The rockwool cubes are then placed in their respective hydroponic systems (NFT and DWC) in equal numbers to ensure a valid comparison.
System Comparison Trial:
- Duration: The trial runs for 5 weeks.
- Lighting: Both systems are illuminated with LED irradiation having a PPF of 200 µmol·s⁻¹.
- Photoperiod: A continuous irradiation period of 16 hours per day is provided to both systems.
- Energy Monitoring: The total energy consumed by each system is monitored throughout the 5-week growth period.
Data Collection:
- Growth Parameters: The following crop growth parameters are measured in both systems at the end of the trial: leaf count, plant height, shoot fresh weight, leaf area, and root length.
- Energy-Use Efficiency (EUE) Calculation: The EUE is calculated using the formula EUE = Total Shoot Fresh Weight (g) / Total Energy Consumed (kWh). This metric quantifies the grams of produce yielded per kilowatt-hour of energy expended.
The Researcher's Toolkit: Essential Research Reagent Solutions
Table 4: Essential Materials and Research Reagents [4] [1]
| Item | Function/Application in Hydroponic Research |
|---|---|
| LED Growth Lights | Provides controllable and efficient light source for photosynthesis with defined Photoperiod and Photosynthetic Photon Flux (PPF). |
| Nutrient Solution | A balanced, water-soluble mixture of essential macro and micronutrients required for plant growth. Formulation and Electrical Conductivity (EC) are key variables. |
| Rockwool Substrate | An inert, fibrous medium used for seed germination and seedling establishment, providing mechanical support and optimal moisture retention. |
| Water Chillers/Heaters | Critical for maintaining the root zone temperature within a specific physiological range, especially in DWC due to its large water volume. |
| Air Pumps & Air Stones | Essential for oxygenating the nutrient solution in Deep Water Culture (DWC) systems to prevent root anoxia. |
| Water Pumps | Used to circulate the nutrient solution in NFT systems and in Recirculating Deep Water Culture (RDWC) systems. |
| pH & EC Meters | For daily monitoring and adjustment of nutrient solution pH (acidity/alkalinity) and EC (nutrient concentration). |
| Data Loggers | Automated sensors for continuous monitoring of environmental parameters such as temperature, humidity, and light levels. |
| Dielectric Fluid | A specialized, non-conductive coolant used in advanced immersion cooling systems for high-density computing, analogous to its use in controlling server temperatures in supporting AI infrastructure [70]. |
The choice between Deep Water Culture and Nutrient Film Technique represents a fundamental trade-off between operational resilience and resource-use efficiency. DWC offers greater stability and crop flexibility, making it a more robust choice for environments where power reliability is a concern or for growers targeting a diverse crop portfolio. In contrast, NFT demonstrates superior performance in energy-use efficiency and conservation of water and nutrients, making it highly suitable for operations focused on leafy greens in contexts where precise management can be guaranteed. This comparison underscores that there is no universally superior system; the optimal choice is contingent upon specific research objectives, local resource constraints, and commercial priorities. Future research should focus on integrating advanced automation to mitigate the primary risks identified in each system, thereby enhancing their overall sustainability and profitability.
The evaluation of energy resilience in closed plant production systems is a critical component of sustainable agricultural research. Within the broader thesis investigating energy consumption in Deep Water Culture (DWC) versus Nutrient Film Technique (NFT) hydroponic systems, this analysis focuses specifically on quantifying their respective vulnerabilities to power interruptions. Such disruptions pose significant risks to crop production, potentially leading to substantial system downtime and complete crop loss. Understanding the distinct failure modes and recovery timelines of DWC and NFT systems is essential for developing robust food production infrastructures, particularly as climate change and aging power grids increase the frequency of outages [71] [72]. This guide provides an objective, data-driven comparison of these two predominant hydroponic systems, framing their performance within the critical context of power reliability.
Deep Water Culture (DWC) is a hydroponic method where plant roots are continuously submerged in a deep, oxygenated reservoir of nutrient solution. Plants are typically supported by floating rafts or lids on the reservoir. The system requires constant aeration via air pumps and air stones to oxygenate the water and prevent root suffocation [12] [1].
Nutrient Film Technique (NFT) operates by circulating a shallow, continuous stream (or "film") of nutrient solution through slightly sloped channels. Plant roots are suspended in these channels, with the lower portion absorbing nutrients from the flowing film while the upper roots remain exposed to air for oxygenation [4] [1].
The fundamental difference in water management between the two systems directly dictates their resilience to power outages. DWC's large, static water volume provides a significant buffer, while NFT's reliance on continuous circulation creates a critical point of failure [12] [1].
Quantitative System Comparison
The following tables synthesize key performance and risk metrics derived from experimental studies and commercial analyses, providing a foundation for objective comparison.
Table 1: Performance and Efficiency Metrics for DWC and NFT Systems
| Parameter | Deep Water Culture (DWC) | Nutrient Film Technique (NFT) | Research Context |
|---|---|---|---|
| Energy Use Efficiency (EUE) | 24.53 g·kWh⁻¹ [4] | 31.3 g·kWh⁻¹ [4] | Lettuce production under LED lighting |
| Average Fresh Weight Yield | Lower comparative yield [5] | 22.8% higher than DWC [5] | Lettuce (Lactuca sativa 'Butterhead') |
| Water Consumption | 9.6% lower than NFT [5] | Higher water consumption [5] | Same crop, controlled greenhouse |
| Leaf Phytochemical Content | Higher total chlorophyll & carotenoids [5] | Lower total chlorophyll & carotenoids [5] | Indicates differential plant response |
Table 2: Risk & Resilience Profile for Power Interruptions
| Risk Factor | Deep Water Culture (DWC) | Nutrient Film Technique (NFT) | Source |
|---|---|---|---|
| Power Failure: Pump Stoppage | High resilience; roots remain submerged for hours/days [12] [1] | Extreme vulnerability; roots dry out within hours [12] [1] | Industry & commercial analysis |
| Temperature Stability | High; large water volume buffers against ambient swings [12] | Low; shallow film heats/cools rapidly [12] [1] | Industry & commercial analysis |
| Nutrient Solution Stability | High buffering capacity; slow pH/EC shifts [1] | Low buffering capacity; rapid pH/EC shifts [1] | Commercial analysis |
| Inherent System Reliability | Considered more forgiving and accessible for new growers [12] | Requires more experience and precise management [12] | Industry practice |
Experimental Protocols for Resilience Assessment
Protocol for Energy-Use Efficiency (EUE) and Growth Analysis
The following methodology, adapted from a controlled comparison study, provides a standardized approach for generating comparable data on system efficiency and crop response [4].
- Plant Material & Germination: Use a standardized crop such as Lactuca sativa L. 'Little Gem'. Germinate seeds in growth chambers maintained at a constant 18°C ambient temperature for 21 days [4].
- Seedling Transplantation: Transplant uniform seedlings into rockwool cubes. Assign them randomly to NFT or DWC systems in equal numbers to ensure statistical validity [4].
- System Lighting & Environment: Illuminate both systems with LED irradiation providing a Photosynthetic Photon Flux (PPF) of 200 µmol·m⁻²·s⁻¹. Maintain a 16-hour photoperiod for 5 weeks. The growing environment must be tightly controlled [4].
- Data Collection:
- Growth Parameters: Periodically measure leaf count, plant height, shoot fresh weight, leaf area, and root length.
- Energy Monitoring: Precisely monitor the total electrical energy input (kWh) into each system throughout the growth cycle.
- EUE Calculation: Calculate Energy-Use Efficiency using the formula: EUE (g·kWh⁻¹) = Total Shoot Fresh Weight (g) / Total Energy Consumed (kWh) [4].
Protocol for Simulating Power Interruption Events
While the search results do not provide a specific laboratory protocol for power failure simulation, the following procedure can be derived from described system vulnerabilities [12] [1].
- System Setup: Establish mature, crop-bearing DWC and NFT systems under identical environmental conditions.
- Failure Induction: Simultaneously deactivate the main water pump for the NFT system and the air pump for the DWC system. This simulates a total power outage.
- Parameter Monitoring:
- NFT: Track the moisture loss in the root zone and the time until visible wilting occurs.
- DWC: Monitor dissolved oxygen (DO) levels in the reservoir using a DO meter. Record the rate of oxygen depletion.
- Recovery & Damage Assessment: After a predetermined stress period (e.g., 2, 4, 8 hours), restore power. After a recovery period, quantitatively assess crop damage through measurements of plant survival rate, fresh weight loss, and root health.
Visualizing Power Failure Impact Pathways
The diagram below illustrates the distinct failure pathways and consequences for DWC and NFT systems during a power outage.
The logical pathway clearly demonstrates NFT's acute vulnerability to pump failure versus DWC's more gradual degradation, underscoring DWC's superior inherent resilience for risk mitigation planning.
The Researcher's Toolkit: Essential Materials & Reagents
Table 3: Key Research Reagent Solutions and Equipment for Comparative Hydroponic Studies
| Item | Function/Application | Relevance to Resilience Research |
|---|---|---|
| Hydroponic Nutrient Solution | Provides essential macro/micro-nutrients (N, P, K, Ca, Mg, S) for plant growth [5]. | Standardized solution is critical for ensuring yield and EUE comparisons are not confounded by nutritional differences. |
| LED Growth Lights | Provides controllable photosynthetic photon flux (PPF) for plant growth in indoor settings [4]. | Enables precise measurement of energy inputs for EUE calculation and eliminates environmental light variability. |
| Dissolved Oxygen (DO) Meter | Measures concentration of oxygen in the nutrient solution. | Essential for quantifying the rate of oxygen depletion in DWC tanks during a simulated power outage event. |
| pH & EC (Electrical Conductivity) Meters | Monitors acidity/alkalinity (pH) and nutrient concentration (EC) of the solution [1]. | Critical for maintaining solution stability and quantifying system buffering capacity post-disturbance. |
| Data Logging System | Automatically records environmental parameters (temperature, humidity) and energy use. | Provides accurate, high-resolution data for correlating energy input with plant growth output and stress responses. |
| Air & Water Pumps | Oxygenates water (DWC) and circulates nutrient film (NFT) [12] [1]. | The primary points of failure; required for setting up systems and simulating outage scenarios. |
The choice between DWC and NFT systems involves a direct trade-off between efficiency and resilience, a critical consideration within energy consumption research. NFT systems demonstrate higher energy-use efficiency and yield potential under optimal conditions [4] [5]. However, DWC systems offer significantly greater resilience to power interruptions, providing a vital buffer against crop loss due to their large water volume and slower failure onset [12] [1]. The decision framework for commercial or research applications must therefore extend beyond baseline performance to include a rigorous risk assessment of local power reliability. For locations with unstable grid infrastructure or a high frequency of extreme weather events [71] [72], the forgone efficiency of DWC may be a justified insurance premium against total system failure. Future work should integrate smart farming technologies like IoT-based monitoring and automated backup systems to mitigate the identified vulnerabilities, particularly for the high-efficiency but high-risk NFT systems [44].
The global push for sustainable agricultural practices has intensified focus on Controlled Environment Agriculture (CEA) as a solution to climate uncertainty, water scarcity, and arable land loss [22]. Hydroponic systems, particularly Deep Water Culture (DWC) and Nutrient Film Technique (NFT), are central to this transition, offering high yields and significant water savings compared to traditional farming [24]. However, their environmental sustainability, particularly concerning energy consumption, is a subject of rigorous scientific inquiry. This analysis adopts a comprehensive lifecycle perspective to evaluate the operational versus initial embedded energy and the total environmental footprint of DWC and NFT systems. Framed within a broader thesis on energy consumption, this guide provides researchers and scientists with a structured comparison, supporting experimental data, and standardized protocols for further investigation into climate-smart agriculture solutions.
DWC and NFT, while both hydroponic, function on distinct principles that fundamentally influence their resource consumption and environmental profile.
- Deep Water Culture (DWC): In a DWC system, plant roots are fully submerged in a large, aerated reservoir of nutrient solution [1] [2]. Aeration is provided continuously by air pumps and air stones, which are critical for preventing root suffocation [13]. The large volume of water acts as a buffer, providing high stability against rapid fluctuations in temperature, pH, and nutrient concentration (EC) [1].
- Nutrient Film Technique (NFT): NFT operates by circulating a very thin, continuous film of nutrient solution through sloped channels, with the upper portion of the roots exposed to air [1] [2]. This design is highly efficient in its use of water and nutrients but offers minimal buffering capacity, making it more sensitive to environmental shifts and pump failures [1].
The following diagram illustrates the core architectural and operational differences that drive the divergent energy and resource profiles of these two systems.
Lifecycle Assessment: Operational vs. Embedded Energy
A holistic lifecycle assessment (LCA) is critical for understanding the true environmental footprint of agricultural technologies. For DWC and NFT, this involves quantifying both the initial embedded energy and the ongoing operational energy.
Initial Embedded Energy
The initial embedded energy encompasses the energy required to manufacture, transport, and install all system components. Key differentiators include:
- DWC: Typically requires substantial materials for constructing large, robust reservoirs or tanks capable of holding significant volumes of water. Commercial-scale operations often use Recirculating Deep Water Culture (RDWC), which adds complexity with interconnected piping and plumbing [1] [13].
- NFT: Embedded energy is concentrated in the fabrication of the sloped channels, gullies, and the supporting racking structure, particularly in vertical farm configurations [1] [73]. While the material mass per unit may be lower than a DWC tank, the total for a large-scale system can be considerable.
Operational Energy
Operational energy is the largest contributor to the lifecycle footprint of CEA systems [22]. The primary energy-consuming processes and their system-specific demands are mapped below.
Table 1: Operational Energy Profile of DWC and NFT Systems
| Energy Component | Deep Water Culture (DWC) | Nutrient Film Technique (NFT) | Primary Data Source & Context |
|---|---|---|---|
| Aeration/Water Circulation | Continuous high oxygen demand requires constant air pump operation [1]. | Continuous water circulation requires constant water pump operation [1]. | Commercial profitability analysis [1]. |
| Temperature Control | High thermal mass requires significant energy for water chilling/heating; less sensitive to ambient air fluctuations [1]. | Low thermal mass is highly sensitive to ambient air temperature; requires precise climate control [1]. | Commercial profitability analysis [1]. |
| Lighting & HVAC | Energy intensity is a function of facility design (greenhouse vs. vertical farm). Lighting is the dominant load in vertical farms regardless of hydroponic type [22]. | Life cycle assessment and industry perspective [22] [24]. | |
| Potential for Efficiency | Integration of thermal storage and heat recovery systems can reduce HVAC loads [24]. | Highly compatible with vertical stacking, optimizing energy use per unit floor area [24]. | Analysis of 2025 vertical farming breakthroughs [24]. |
Quantitative Environmental Footprint and Experimental Data
Life Cycle Assessment (LCA) Findings
A rigorous LCA study of hydroponic systems in arid climates provides critical quantitative data on environmental impacts. The study compared Open (drain-to-waste) and Closed (recirculating) hydroponic systems, a classification that encompasses both DWC and NFT when operated with nutrient solution recirculation [74].
Table 2: LCA-Based Environmental Impact Reduction of Closed vs. Open Hydroponic Systems
| Environmental Impact Category | Reduction in Closed Systems (e.g., Recirculating DWC/NFT) | Remarks |
|---|---|---|
| Abiotic Depletion | 11% | Reduced extraction of finite resources due to recirculation [74]. |
| Global Warming Potential (GWP) | 9% | Lower greenhouse gas emissions, linked to reduced fertilizer production and energy use [74]. |
| Eutrophication Potential | 8% | Minimized nutrient leaching and chemical runoff [74]. |
| Overall Environmental Impact | 8-11% | Aggregated improvement across multiple endpoints, including human health, ecosystems, and resources [74]. |
The study further highlighted that integrating solar energy can significantly reduce greenhouse gas emissions and mitigate fossil fuel depletion, a finding applicable to both DWC and NFT operations [74].
Comparative Crop Study: Lettuce in DWC vs. NFT
A controlled experiment directly compared the growth and resource use of butterhead lettuce (Lactuca sativa cv. Butterhead) in DWC and NFT systems across two growing seasons [19]. The methodology and results provide a model for experimental protocol in this field.
4.2.1 Experimental Protocol
- System Setup: The study was conducted in a climate-controlled greenhouse with four replicate systems for each hydroponic design (DWC and NFT). Each system contained nine lettuce plants [19].
- Growing Conditions: The experiment was repeated during fall (October-November) and summer (July-August) to account for seasonal variation [19].
- Data Collection:
- Weekly Measurements: Plant photosynthetic properties, growth parameters, and irrigation solution nutrient concentrations [19].
- Final Harvest Analysis: Leaf area; fresh and dry yield of shoots and roots; mineral nutrient concentration (e.g., Ca, Mg); and phytochemical concentrations (Vitamin C, total carotenoids, non-acidified phenols, total chlorophyll) [19].
- Resource Monitoring: Water consumption and quality parameters, including water temperature, were tracked [19].
4.2.2 Key Findings and Data
Table 3: Experimental Results from Lettuce Growth in DWC vs. NFT [19]
| Parameter | Deep Water Culture (DWC) | Nutrient Film Technique (NFT) | Seasonal Context & Significance |
|---|---|---|---|
| Fresh Yield | Higher fresh yield in the fall season [19]. | Greater yield in summer, but accompanied by more severe tipburn [19]. | Yield advantage is season- and system-dependent. |
| Mineral Uptake | Significantly higher shoot calcium (Ca) and magnesium (Mg) concentrations [19]. | Significantly lower Ca and Mg concentrations in both seasons [19]. | Explains higher incidence and severity of tipburn disorder in NFT during summer. |
| Phytochemical Concentration | Higher antioxidant concentrations: 9.4% higher Vitamin C, 34.6% higher total carotenoids, 40.6% higher non-acidified phenols in fall; 12.9% higher total chlorophyll in summer [19]. | Lower overall antioxidant and phytochemical profile compared to DWC [19]. | Suggests DWC water quality stability may enhance nutritional quality. |
| Water Temperature | Less seasonal fluctuation in root zone temperature [19]. | Higher sensitivity to ambient temperature changes [19]. | Directly impacts root health, metabolic activity, and disease risk. |
| Water Consumption | System recirculates water, but initial volume and evaporation losses can be higher. | Inherently high water efficiency due to the thin film design [1]. | NFT may have an operational advantage in water-scarce environments. |
The Researcher's Toolkit
To replicate the cited studies or conduct novel research on hydroponic system footprints, the following reagents, equipment, and methodologies are essential.
Table 4: Essential Research Reagents and Equipment for Hydroponic LCA
| Item | Function/Application | Example in Experimental Context |
|---|---|---|
| pH & EC (Electrical Conductivity) Meters | Continuous monitoring of nutrient solution acidity and ion concentration (nutrient strength). Critical for maintaining plant health [19] [24]. | Used for weekly monitoring of nutrient solutions in the lettuce comparative study [19]. |
| Dissolved Oxygen Sensor | Measures oxygen concentration in the nutrient solution. Vital for root health, especially in DWC systems [24]. | A key performance indicator (KPI) for AI-driven sensor systems; target >7 mg/L for leafy greens [24]. |
| Water Temperature Sensor | Monitors root zone temperature, a key factor in metabolic activity and disease risk [19]. | Documented more stable temperature in DWC vs. NFT [19]. |
| Nutrient Solution (Macro & Microelements) | Formulated solutions containing essential elements (N, P, K, Ca, Mg, S, Fe, Mn, B, Zn, Cu, Mo). | Basis for all plant growth in hydroponic systems; composition affects yield and quality [19]. |
| LED Lighting System | Provides sole-source or supplemental lighting. Spectrum and intensity can be tuned for specific crops and growth stages [24]. | Next-gen LEDs reported to provide 28-40% energy savings while increasing yield [24]. |
| Climate Control Data Logger | Records ambient temperature, humidity, and CO2 levels, which are critical for correlating with system energy use [22]. | Necessary for contextualizing operational energy data for HVAC systems. |
| LCA Software (e.g., SimaPro) | Models the environmental impacts of a product or system across its entire lifecycle [74]. | Used to calculate GWP and other impact categories for hydroponic systems in the UAE study [74]. |
The lifecycle perspective reveals that the choice between DWC and NFT involves a complex trade-off between operational stability, resource efficiency, and energy consumption. DWC systems demonstrate notable advantages in crop quality, nutritional density, and buffering capacity against environmental fluctuations, albeit with potentially higher energy demands for water temperature control. Conversely, NFT systems offer superior water use efficiency and are highly adaptable to space-constrained vertical farming, but they exhibit greater vulnerability to operational interruptions and can result in lower mineral uptake in certain crops.
Critically, the largest environmental impact for both systems stems from operational energy consumption, predominantly for lighting and climate control. The adoption of closed, recirculating systems is a decisive factor in reducing the overall environmental footprint, evidenced by 8-11% lower impacts across key LCA metrics [74]. Future research and development must prioritize the integration of renewable energy sources, AI-driven optimization, and energy-efficient hardware to mitigate the carbon footprint of CEA. For the research community, the path forward lies in conducting localized LCAs that integrate economic and social dimensions to fully validate these systems as scalable, sustainable, and climate-smart solutions for global food security.
Conclusion
The choice between DWC and NFT involves a critical trade-off between energy efficiency and system resilience. Empirical evidence indicates that well-managed NFT systems can achieve a higher Energy Use Efficiency (EUE of 31.3 g/kWh) for suitable crops like leafy greens, making them ideal for operations prioritizing resource efficiency. In contrast, DWC offers greater buffering capacity against power disruptions and temperature fluctuations, potentially justifying its energy cost for higher-value or more sensitive crops. The integration of renewable energy sources, particularly solar-PV, emerges as a transformative strategy, dramatically reducing CO2 emissions by over 94% and enhancing sustainability. Future directions for research should focus on developing next-generation, energy-resilient hybrid systems, refining dynamic energy models using AI, and exploring the application of these optimized controlled-environment principles in biomedical fields, such as for the sustainable production of plant-derived pharmaceuticals. The pursuit of energy efficiency is not merely an operational goal but a fundamental requirement for the advancement of sustainable and secure agricultural and research systems.
References
- 1. NFT vs DWC Hydroponics: 2025 Profitability Guide for ... [https://growdirector.com/nft-vs-dwc-hydroponics-profitability-guide-for-commercial-growers/]
- 2. Deep Water Culture vs. Nutrient Film Technique [https://www.doctorblooms.co.uk/growers-blog-posts/deep-water-culture-vs-nutrient-film-technique.html]
- 3. Top Commercial Hydroponic Systems Compared for 2025 [https://www.miilkiiagrow.com/news/top-commercial-hydroponic-systems-compared-for-2025/]
- 4. Comparison of Energy-use Efficiency for Lettuce Plantation ... [https://www.sciencedirect.com/science/article/pii/S187705092202275X]
- 5. nutrient film technique and deep-water culture [https://www.ishs.org/ishs-article/1377_91]
- 6. What is the Hydroponic Nutrient-Film-Technique (NFT) [https://hydroplanner.com/blog/hydroponic-nutrient-film-technique-nft]
- 7. Hydroponic Nutrient Film Technique (NFT): A Beginner's ... [https://hydragarden.com/blogs/blogs/hydroponic-nutrient-film-technique-nft-a-beginners-guid?srsltid=AfmBOooXc0TextkygLEndrBySj0uY_jz3a5FmBeNV4iooDamo6QMmqtc]
- 8. Evaluation of Split Root Nutrient Film Technique (SR-NFT) ... [https://www.mdpi.com/2077-0472/15/13/1350]
- 9. Evaluation and comparison of energy use efficiency among ... [https://www.frontiersin.org/journals/sustainable-food-systems/articles/10.3389/fsufs.2024.1427530/full]
- 10. Energy-use efficiency of organic and conventional plant ... [https://www.nature.com/articles/s41598-024-51768-3]
- 11. Energy efficiency | In-depth topics [https://www.eea.europa.eu/en/topics/in-depth/energy-efficiency]
- 12. Comparing hydroponic setups: DWC vs. NFT [https://www.thegrowcer.ca/blog/comparing-hydroponic-setups-dwc-vs-nft]
- 13. NFT or DWC: Which Hydroponic System Is Better? [https://getgrowee.com/nft-vs-dwc/]
- 14. Do Hydroponic Systems Use a Lot of Electricity? [https://www.miilkiiagrow.com/news/do-hydroponic-systems-use-a-lot-of-electricity/]
- 15. Comparing resource use efficiencies in hydroponic and ... [https://www.maxapress.com/article/doi/10.48130/tihort-0024-0002?viewType=HTML]
- 16. Water, energy, food and environment nexus (WEFEN) [https://www.sciencedirect.com/science/article/pii/S2211467X24002049]
- 17. The Food Water Energy Nexus in Agriculture [https://www.mdpi.com/2071-1050/17/10/4428]
- 18. Water, Energy, and the Future of Farming [https://www.energy.gov/eere/iedo/articles/water-energy-and-future-farming]
- 19. Growth, phytochemical concentration, nutrient uptake, and ... [https://www.sciencedirect.com/science/article/pii/S0304423824003601]
- 20. The plant growth, water and electricity consumption ... [https://www.nature.com/articles/s41598-023-48284-1]
- 21. Hydroponics Trends Shaping Agriculture in 2025 [https://www.miilkiiagrow.com/news/hydroponics-trends-shaping-agriculture-in-2025/]
- 22. Finding sustainable, resilient, and scalable solutions for ... [https://www.nature.com/articles/s44383-025-00006-4]
- 23. Comparing Hydroponic Systems: Pros and Cons of NFT, ... [https://benehorti.com/blogs/news/hydroponic-systems-pros-cons]
- 24. Vertical farming hydroponics: 7 Breakthroughs 2025 [https://farmonaut.com/precision-farming/vertical-farming-hydroponics-7-breakthroughs-2025]
- 25. NFT Hydroponics vs. Deep Water Culture for Leafy Green ... [https://www.miilkiiagrow.com/news/nft-hydroponics-vs-deep-water-culture-for-leafy-green-production/]
- 26. Sustainable Hydroponics Production Data [https://www.grozine.com/2025/08/25/sustainable-hydroponics-production-data/]
- 27. Measuring Dissolved Oxygen [https://www.fondriest.com/environmental-measurements/measurements/measuring-water-quality/dissolved-oxygen-sensors-and-methods/]
- 28. Water Temperature Control Units - The Mold ... [https://www.frigel.com/water-temperature-control-units]
- 29. Temperature Controllers [https://www.thermalcare.com/temperature-controllers/]
- 30. Global water-nutrient-salinity-energy nexus in lettuce ... [https://www.sciencedirect.com/science/article/pii/S2666154325003060]
- 31. Controlled comparisons between soil and hydroponic ... [https://pmc.ncbi.nlm.nih.gov/articles/PMC7885021/]
- 32. Optimizing Lettuce Growth in Nutrient Film Technique ... [https://www.mdpi.com/2073-4395/14/9/1896]
- 33. Sustainable hydroponic production using solar energy and ... [https://www.nature.com/articles/s41598-025-16030-4]
- 34. Energy Use Efficiency and Carbon Footprint of ... [https://www.mdpi.com/2071-1050/15/2/1024]
- 35. Looking at CO₂-supplemented hydroponics to support ... [https://www.hortidaily.com/article/9716606/looking-at-co2-supplemented-hydroponics-to-support-sustainable-growing/]
- 36. Harnessing Hydromechanical Energy from Vertical ... [https://www.sciencedirect.com/science/article/abs/pii/S3050475925007663]
- 37. Hydroponic Greenhouses: Pros, Cons & Role of Smart ... [https://agtech.folio3.com/blogs/hydroponic-greenhouses-and-smart-systems/]
- 38. IoT Energy Management in 2025: Real Results from Smart ... [https://energiesmedia.com/iot-energy-management-in-2025-real-results-from-smart-industries/]
- 39. Demand for Energy Intelligence Solution in USA [https://www.futuremarketinsights.com/reports/united-states-energy-intelligence-solution-market]
- 40. IoT Trends in 2025: What's Next? [https://www.pondiot.com/blog/iot-trends-in-2025-what-is-next]
- 41. Smart Applications in 2025: AI-Powered IoT Solutions That ... [https://skywinds.tech/ai-powered-iot-solutions-2025/]
- 42. Sensors in 2025: Global Market Trend Report [https://www.azosensors.com/article.aspx?ArticleID=3258]
- 43. Number of connected IoT devices growing 14% to 21.1 billion [https://iot-analytics.com/number-connected-iot-devices/]
- 44. Hydroponics: current trends in sustainable crop production [https://pmc.ncbi.nlm.nih.gov/articles/PMC10625363/]
- 45. Optimization of an Indoor DWC Hydroponic Lettuce ... [https://www.mdpi.com/2227-9717/11/2/365]
- 46. Nutrient Film Technique (NFT): Hydroponic Growing Systems [https://www.edengreen.com/blog-collection/nutrient-film-technique]
- 47. The Do's and Don'ts of NFT Hydroponic Systems [https://www.ceagworld.com/greenhouse-produce/the-dos-and-donts-of-nft-hydroponic-systems/]
- 48. Advancements and future perspectives in nutrient film ... [https://pmc.ncbi.nlm.nih.gov/articles/PMC11688204/]
- 49. NFT hydroponic systems | Nutrient Film Technique [http://flairform.com/hints/nft/]
- 50. Nutrient Film Technique (NFT) Systems - VCE Publications [https://www.pubs.ext.vt.edu/content/pubs_ext_vt_edu/en/SPES/spes-463/spes-463.html]
- 51. LED Lighting [https://www.energy.gov/energysaver/led-lighting]
- 52. A Deep Dive into hydro farms and Its Impact on Efficiency [https://www.paclights.com/explore/a-deep-dive-into-hydro-farms-and-its-impact-on-efficiency/]
- 53. hydroponic systems electricity usage [https://www.miilkiiagrow.com/news/hydroponic-systems-electricity-usage/]
- 54. 5 water-efficient hydroponic systems available to ... [https://growdirector.com/water-efficient-hydroponic-systems/]
- 55. Guide to Nutrient Film Technique Aquaponics System [https://gogreenaquaponics.com/blogs/news/nutrient-film-technique-in-aquaponics?srsltid=AfmBOorJEyREzaPc5jSF5Pl8NmuShygaWWRcYMVjCUgErNPoQWhXEHny]
- 56. How to Build a Nutrient Film Technique (NFT) System in ... [https://atlas-scientific.com/blog/nft-system-hydroponics/?srsltid=AfmBOoqa3JFUsl1GJJpaqk1IkPwT4BU3Ws0jrFFMnvC_GXdsoN0EyACD]
- 57. Hydrodynamic Aspects of Particle Clogging in Porous Media [https://pmc.ncbi.nlm.nih.gov/articles/PMC2858458/]
- 58. On the impact of clogging in aquifer thermal energy storage ... [https://www.sciencedirect.com/science/article/pii/S0022169425019018]
- 59. Exploration of efficient water, energy and nutrient use in ... [https://www.sciencedirect.com/science/article/pii/S2772801322000100]
- 60. The Nutrient Film Technique (NFT) in Vertical Farming [https://viemose-dgs.dk/vertical-farming-nutrient-film-technique/]
- 61. Hydro hints: Deep water culture - OSU Extension Service [https://extension.oregonstate.edu/catalog/pub/em-9455-hydro-hints-deep-water-culture]
- 62. Predictive Analytics For Energy Management [https://www.meegle.com/en_us/topics/predictive-analytics/predictive-analytics-for-energy-management]
- 63. Optimize Efficiency With AI-Driven Energy Management [https://www.pecan.ai/blog/optimize-efficiency-with-ai-energy-management/]
- 64. Predictive Databricks Energy Analytics | Case Study [https://www.royalcyber.com/resources/case-studies/databricks-predictive-analytics-for-energy-management/]
- 65. Industrial artificial intelligence: Optimizing energy efficiency ... [https://blog.se.com/industry/2024/11/29/what-is-predictive-ai/]
- 66. Substrate system outperforms water-culture ... - PubMed Central [https://pmc.ncbi.nlm.nih.gov/articles/PMC11860082/]
- 67. The Comparative Performance of Nutrient Film Technique and ... [https://elibrary.asabe.org/abstract.asp?aid=54096]
- 68. Comprehensive Guide to Hydroponics in 2025 - Planthex [https://planthex.com/hydrophonics/guide-to-hydroponics/]
- 69. Growth, phytochemical concentration, nutrient uptake, and ... [https://ui.adsabs.harvard.edu/abs/2024ScHor.33213201Y/abstract]
- 70. Data Centers and Water Consumption | Article | EESI [https://www.eesi.org/articles/view/data-centers-and-water-consumption]
- 71. Assessing the Impact of Catastrophic Electricity Loss on ... [https://link.springer.com/article/10.1007/s13753-024-00574-6]
- 72. Spatiotemporal distribution of power outages with climate ... [https://pmc.ncbi.nlm.nih.gov/articles/PMC10147900/]
- 73. Hydroponic Vertical Farming Systems 2025 Trends and ... [https://www.archivemarketresearch.com/reports/hydroponic-vertical-farming-systems-569466]
- 74. Life cycle assessment of open and closed hydroponic ... [https://www.sciencedirect.com/science/article/pii/S0959652625022760]