Electrochemical vs. Optical Hydrogen Peroxide Sensors for Plant Health Monitoring: A Comprehensive Review for Biomedical and Agri-Tech Research
This article provides a systematic comparison of electrochemical and optical biosensors for detecting hydrogen peroxide (H₂O₂) in plants, a critical biomarker for early stress signaling.
Electrochemical vs. Optical Hydrogen Peroxide Sensors for Plant Health Monitoring: A Comprehensive Review for Biomedical and Agri-Tech Research
Abstract
This article provides a systematic comparison of electrochemical and optical biosensors for detecting hydrogen peroxide (H₂O₂) in plants, a critical biomarker for early stress signaling. Targeting researchers and scientists in drug development and agri-tech, we explore the foundational principles, operational mechanisms, and real-world applications of both sensor classes. The review delves into methodological considerations for in situ and in vivo plant monitoring, addresses key challenges in troubleshooting and optimization, and offers a direct validation and comparative analysis of sensor performance. By synthesizing these aspects, this work aims to guide the selection and development of robust sensing platforms for precision agriculture and the exploration of plant-based biomedical models.
The Role of H₂O₂ in Plant Stress and Foundational Biosensor Principles
Hydrogen Peroxide as a Universal Plant Stress Biomarker
Hydrogen peroxide (H₂O₂) has emerged as a crucial signaling molecule and a universal biomarker for detecting plant stress responses. As a reactive oxygen species (ROS), H₂O₂ functions as a key mediator in plant defense mechanisms, transmitting distress signals systemically when plants encounter biotic stressors like pathogens or abiotic challenges such as drought, salinity, and extreme temperatures [1] [2]. Unlike other ROS with shorter lifetimes, H₂O₂'s relative stability and ability to cross cellular membranes via specific aquaporins make it an ideal long-distance signaling molecule [1]. This dual role—as both a harmful oxidant at high concentrations and an essential signaling molecule at controlled levels—underscores its critical importance in plant physiology and stress adaptation [2]. This review comprehensively compares the two primary technological approaches for detecting H₂O₂ in plants: electrochemical sensing and optical sensing, evaluating their performance characteristics, experimental requirements, and suitability for different research applications.
Technical Comparison: Electrochemical vs. Optical Sensing Platforms
Performance Metrics and Operational Characteristics
The following table summarizes the key performance characteristics and operational parameters of electrochemical and optical H₂O₂ sensing platforms as revealed by recent studies.
Table 1: Performance comparison of H₂O₂ sensing platforms for plant stress monitoring
| Feature | Electrochemical Sensors | Optical Sensors |
|---|---|---|
| Detection Mechanism | Catalytic reaction (HRP/ChOx enzymes) on electrode surface [3] [4] | Fluorescence emission changes via ICT process [2] |
| Detection Limit | 0.43 μM (PMWCNT/ChOx) [5] | ~0.1 μM (NAPF-AC probe) [2] |
| Response Time | <1 minute (microneedle sensor) [3] | ~10 minutes (NAPF-AC probe) [2] |
| Spatial Resolution | Single-point measurement [3] | Tissue-wide imaging capability [1] [2] |
| Key Materials | Chitosan, graphene oxide, HRP/ChOx enzymes [5] [3] | Naphthyl fluorescein derivatives, acetyl recognition groups [2] |
| Invasiveness | Minimally invasive (microneedles) [3] | Non-invasive (surface application) [2] |
| Measurement Output | Current intensity (amperometry) [5] | Fluorescence intensity at 665 nm (NIR) [2] |
| Cost per Test | <$1 (microneedle sensor) [3] | Higher (specialized optics required) |
Experimental Workflows and Implementation
The fundamental workflows for implementing these sensing technologies differ significantly in their operational requirements and procedural steps.
Table 2: Experimental workflows for H₂O₂ sensing platforms
| Experimental Phase | Electrochemical Approach | Optical Approach |
|---|---|---|
| Sample Preparation | Direct attachment to plant tissue [3] | Probe synthesis and purification [2] |
| Sensor Fabrication | Enzyme immobilization on electrode [5] [3] | Molecular design for NIR emission [2] |
| Measurement | Amperometry at fixed potential [5] | Fluorescence spectrometry/imaging [2] |
| Data Acquisition | Current measurement over time [5] | Fluorescence intensity mapping [2] |
| Signal Processing | Calibration curve correlation [5] | Background subtraction, ratio analysis [2] |
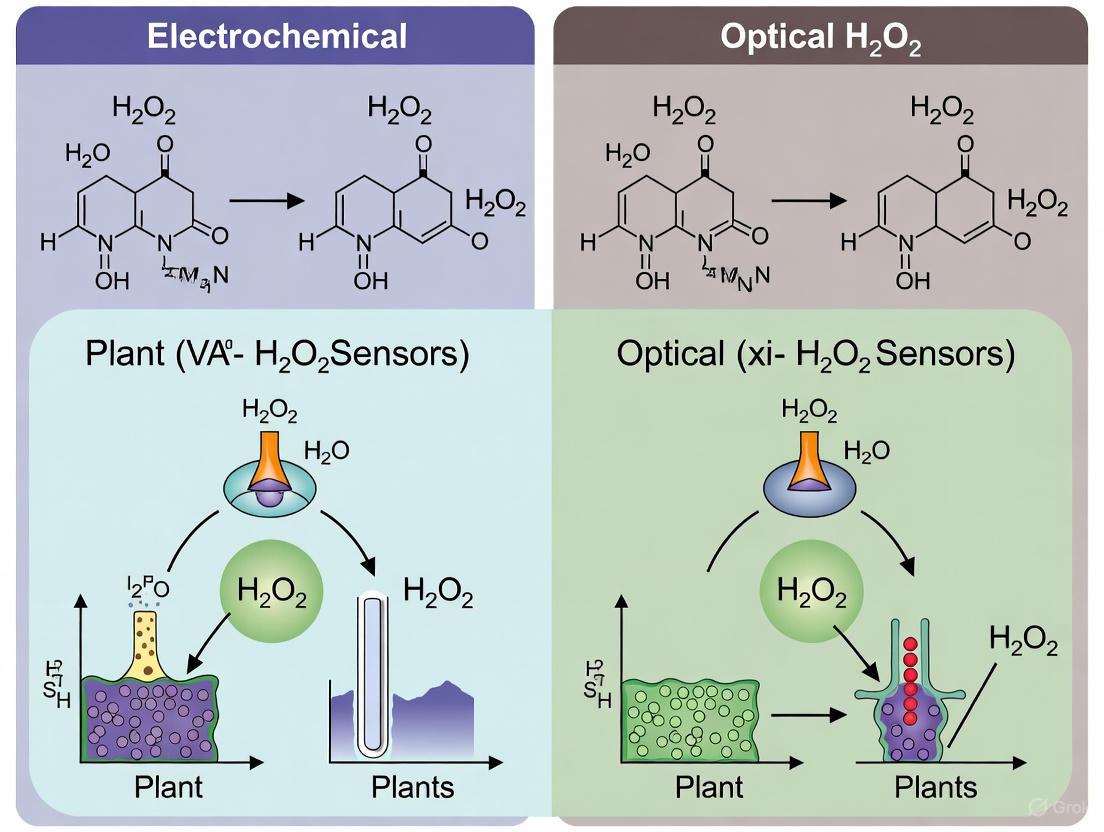
Figure 1: H₂O₂ signaling pathway and detection methodologies in plants under stress conditions
Electrochemical Sensing Platforms: Principles and Applications
Electrochemical sensors detect H₂O₂ through catalytic reactions on electrode surfaces, typically functionalized with enzymes like horseradish peroxidase (HRP) or cholesterol oxidase (ChOx) that facilitate electron transfer during H₂O₂ reduction or oxidation [5] [4]. These platforms measure current changes proportional to H₂O₂ concentration, providing direct quantitative readouts. Recent innovations include biohydrogel-enabled microneedle arrays that can be directly attached to plant leaves for in situ monitoring, achieving detection in under one minute at low cost [3]. Another advancement utilizes multi-walled carbon nanotube paste electrodes with cholesterol oxidase, demonstrating 21-times enhanced sensitivity compared to non-enzymatic approaches, with a detection limit of 0.43 μM and linear range from 0.4 to 4.0 mM [5].
Experimental Protocol: Microneedle Sensor Implementation
The following protocol describes the implementation of a wearable microneedle electrochemical sensor for plant H₂O₂ detection [3]:
Sensor Fabrication: Prepare biohydrogel by combining chitosan (a natural biopolymer) with reduced graphene oxide to create a porous, hydrophilic matrix. Functionalize with horseradish peroxidase (HRP) enzyme for H₂O₂ specificity.
Microneedle Array Formation: Mold the biohydrogel composite into microneedle arrays using microfabrication techniques, creating structures capable of minimal tissue penetration.
Plant Attachment: Directly apply the microneedle sensor to live plant leaves, ensuring microneedles penetrate the epidermal layer for access to apoplastic fluid.
Electrochemical Measurement: Apply a fixed potential and monitor current changes amperometrically. H₂O₂ catalysis by HRP generates measurable electron flow.
Data Collection: Record current values over time, with measurements achievable within approximately one minute of attachment.
Validation: Compare results against standard assays like 3,3'-diaminobenzidine (DAB) staining to confirm accuracy.
This platform has successfully detected H₂O₂ bursts following bacterial pathogen inoculation, demonstrating its practical application for real-time plant disease monitoring [3].
Optical Sensing Platforms: Principles and Applications
Optical sensors utilize light-matter interactions to detect H₂O₂, primarily through fluorescence changes in specialized molecular probes. Recent advances include near-infrared (NIR) fluorescent probes like NAPF-AC, which employs naphthalene-based fluorescein extended with benzene rings to achieve emission wavelengths around 665 nm—significantly longer than conventional fluorescein probes (~520 nm) [2]. This NIR capability reduces interference from plant autofluorescence and improves tissue penetration depth. The detection mechanism relies on modulation of intramolecular charge transfer (ICT), where acetyl groups serve dual roles as H₂O₂ recognition elements and fluorescence quenchers. Upon H₂O₂ exposure, the acetyl groups are cleaved, restoring ICT and generating strong NIR fluorescence [2]. Alternative approaches using nanosensors based on single-walled carbon nanotubes functionalized with DNA aptamers have enabled real-time monitoring of H₂O₂ signaling waves across multiple plant species, revealing propagation speeds ranging from 0.44 to 3.10 cm min⁻¹ [1].
Experimental Protocol: NIR Fluorescent Probe Implementation
The following protocol describes the implementation of NAPF-AC for H₂O₂ monitoring in plant tissues [2]:
Probe Synthesis: Synthesize NAPF-AC by attaching acetyl chloride to the hydroxyl group of NAPF-OH naphthyl fluorescein derivative. Confirm structure via NMR and mass spectrometry.
Plant Preparation: Apply probe solution to plant tissues through infiltration or surface application. For food samples, homogenize tissue and incubate with probe.
Fluorescence Measurement: Excite samples at appropriate wavelength (∼605 nm for NAPF-AC) and collect emission spectra around 665 nm using fluorescence spectrometry.
Imaging: Utilize fluorescence microscopy for spatial mapping of H₂O₂ distribution within plant tissues.
Kinetics Monitoring: Record fluorescence changes over time, with significant response observable within 10 minutes of H₂O₂ exposure.
Selectivity Validation: Test probe response against other ROS and relevant analytes to confirm H₂O₂ specificity.
This approach has been successfully used to monitor both exogenous and endogenous H₂O₂ production in plant tissues under stress conditions, providing high spatial resolution of H₂O₂ distribution patterns [2].
Figure 2: Classification of H₂O₂ detection methodologies for plant stress monitoring
The Scientist's Toolkit: Essential Research Reagents and Materials
Successful implementation of H₂O₂ sensing platforms requires specific reagents and materials tailored to each technological approach.
Table 3: Essential research reagents for H₂O₂ sensing in plant studies
| Reagent/Material | Function | Example Applications |
|---|---|---|
| Chitosan | Biopolymer hydrogel matrix for microneedles [3] | Wearable plant sensors [3] |
| Reduced Graphene Oxide | Electron transfer enhancement in electrodes [3] | Electrochemical sensor fabrication [3] |
| Horseradish Peroxidase (HRP) | H₂O₂ catalytic enzyme for recognition [3] [4] | Enzyme-based electrochemical sensors [3] [4] |
| Cholesterol Oxidase (ChOx) | Flavoenzyme for H₂O₂ electrochemical reduction [5] | PMWCNT/ChOx biosensing platforms [5] |
| Naphthyl Fluorescein | NIR fluorophore backbone [2] | NAPF-AC optical probe synthesis [2] |
| Acetyl Chloride | Recognition group and fluorescence quencher [2] | H₂O₂-responsive probe design [2] |
| Multi-walled Carbon Nanotubes | Electrode material with high surface area [5] | Nanocomposite electrochemical sensors [5] |
| Single-walled Carbon Nanotubes | Fluorescence quenching scaffolds [1] | Optical nanosensors for H₂O₂ waves [1] |
The choice between electrochemical and optical sensing platforms for detecting hydrogen peroxide as a plant stress biomarker depends heavily on research objectives and experimental requirements. Electrochemical sensors offer superior temporal resolution, lower cost, and direct quantification capabilities, making them ideal for real-time monitoring and field applications. The recent development of wearable microneedle sensors represents a significant advancement toward practical agricultural implementation [3]. Conversely, optical sensors provide unmatched spatial resolution and imaging capabilities, enabling researchers to visualize H₂O₂ distribution patterns and signaling waves across plant tissues—a crucial advantage for understanding systemic stress signaling mechanisms [1] [2]. As both technologies continue to evolve, we anticipate further miniaturization, multiplexing capabilities, and integration with wireless systems that will transform how researchers monitor plant health and stress responses in both controlled environments and field settings.
Fundamental Principles of Electrochemical H₂O₂ Sensors
Hydrogen peroxide (H₂O₂) is a crucial reactive oxygen species (ROS) that functions as a key signaling molecule in plant physiological processes, including stress responses, growth regulation, and programmed cell death. Accurate detection of H₂O₂ is essential for understanding plant redox biology and oxidative stress pathways. Electrochemical sensors have emerged as powerful tools for quantifying H₂O₂ due to their high sensitivity, rapid response, and capability for real-time measurements in complex biological matrices. This guide provides a comprehensive comparison of electrochemical sensing principles, methodologies, and performance metrics relevant to plant science research.
Working Principles and Sensor Architectures
Electrochemical H₂O₂ sensors operate by measuring electrical signals generated from the catalytic oxidation or reduction of H₂O₂ at an electrode surface. The electron transfer rate is proportional to H₂O₂ concentration, enabling quantitative detection. Two primary approaches dominate current research: enzymatic sensors utilizing biological recognition elements and non-enzymatic sensors relying on nanomaterial catalysts.
Table 1: Fundamental Principles of Electrochemical H₂O₂ Detection
| Detection Method | Working Principle | Typical Electrode Materials | Reaction Mechanism |
|---|---|---|---|
| Amperometry | Measures current at fixed potential during H₂O₂ redox reaction | Noble metals, carbon nanomaterials, metal oxides | H₂O₂ → O₂ + 2H⁺ + 2e⁻ (oxidation) or H₂O₂ + 2H⁺ + 2e⁻ → 2H₂O (reduction) |
| Voltammetry | Applies potential sweep and measures current response | Nanocomposites, enzyme-modified electrodes | Catalytic H₂O₂ redox reaction with current peaks proportional to concentration |
| Potentiometry | Measures potential change at zero current | Ion-selective membranes, metal oxides | Potential shift correlates with H₂O₂ concentration in solution |
| Impedimetry | Measures impedance changes during H₂O₂ interaction | Functionalized electrodes, nanomaterials | Changes in charge transfer resistance due to H₂O₂ binding or reaction |
Figure 1: Electrochemical H₂O₂ Sensor Working Principle and Architectures
Performance Comparison of Electrochemical Sensor Technologies
Recent advances in nanotechnology and materials science have yielded significant improvements in H₂O₂ sensor performance. The following comparison evaluates current electrochemical sensing platforms based on critical analytical parameters.
Table 2: Performance Comparison of Recent Electrochemical H₂O₂ Sensors
| Sensor Architecture | Linear Range | Detection Limit | Sensitivity | Response Time | Reference |
|---|---|---|---|---|---|
| 3DGH/NiO Octahedrons | 10 µM – 33.58 mM | 5.3 µM | 117.26 µA mM⁻¹ cm⁻² | <5 seconds | [6] |
| Ag-CeO₂/Ag₂O/GCE | 10 nM – 0.5 mM | 6.34 µM | 2.728 µA cm⁻² µM⁻¹ | ~3 seconds | [7] |
| PMWCNT/ChOx Bioplatform | 0.4 – 4.0 mM | 0.43 µM | 26.15 µA/mM | ~10 seconds | [5] |
| PEDOT:BTB/PEDOT:PSS OECT | pM to µM range | 1.8 × 10⁻¹² M | N/A | <2 seconds | [8] |
| Green-silver nanoparticles | Not specified | Not specified | Not specified | Not specified | [9] |
Electrochemical vs. Optical Sensing Technologies
While electrochemical sensors dominate H₂O₂ detection research, optical methods provide complementary approaches. The comparative analysis below highlights key differences relevant to plant research applications.
Table 3: Electrochemical vs. Optical H₂O₂ Sensor Comparison
| Parameter | Electrochemical Sensors | Optical Sensors (LPFG) |
|---|---|---|
| Detection Principle | Electron transfer during H₂O₂ redox reaction | Refractive index change from H₂O₂ interaction |
| Sensitivity | High (µM to pM) | Moderate to High |
| Selectivity | Good (can be improved with materials design) | Good with nanozyme coatings (e.g., GO/2L-Fht) |
| Response Time | Seconds | Minutes |
| pH Compatibility | Varies with catalyst (some broad range) | Broad pH range (5-9) suitable for plant apoplast |
| Miniaturization Potential | Excellent for in vivo plant studies | Moderate (fiber optic dimensions) |
| Cost | Low to moderate | Moderate to high |
| Interference Susceptibility | Affected by electroactive species | Less affected by electrochemical interferents |
| Real-time Monitoring | Excellent | Good |
Figure 2: Comparative Detection Pathways for H₂O₂ Sensors
Experimental Protocols for Sensor Implementation
Non-enzymatic Nanocomposite Sensor Fabrication
The synthesis of NiO octahedron-decorated 3D graphene hydrogel follows this optimized protocol [6]:
- Template Preparation: Dissolve 10 mg silica (SBA-15) in 100 ml anhydrous ethanol containing 10 mg nickel nitrate hexahydrate
- Precursor Processing: Stir for 24 hours at room temperature, dry at 80°C for 48 hours, and grind to powder
- Calcination: Transfer to muffle furnace and calcinate at 550°C for 3 hours at 2°C/min heating rate
- Template Removal: Treat with 2M NaOH at 60°C, wash repeatedly with ethanol and water
- Hydrogel Self-Assembly: Disperse 48 mg GO in 32 mL deionized water with 12 mg NiO octahedrons
- Sonication: Bath-sonication for 2 hours followed by prop-sonication for 1.5 hours
- Hydrothermal Treatment: Transfer to 45 mL Teflon-lined autoclave, maintain at 180°C for 12 hours
- Final Processing: Wash with deionized water and freeze-dry
Enzymatic Biosensor Development
The cholesterol oxidase-based platform fabrication involves [5]:
- MWCNT Activation:
- Sonicate MWCNTs in 1M nitric acid for 30 minutes
- Filter and transfer to 1M sulfuric acid with sonication for 30 minutes
- Repeat twice and wash until neutral pH with ethanol and acetone
- Paste Preparation: Mix activated MWCNTs with mineral oil in 70/30 w/w ratio
- Electrode Preparation:
- Polish glassy carbon with 1µm and 0.5µm alumina slurry
- Rinse with deionized water, sonicate for 1 minute, and dry under nitrogen
- Apply MWCNT paste to glassy carbon contact
- Enzyme Immobilization: Drop-cast 10µL ChOx (20 U/mL) onto PMWCNT surface
- Drying: Air-dry for 10 minutes at room temperature before use
Electrochemical Measurement Parameters
Standard measurement conditions for plant tissue extracts [4] [7]:
- Buffer System: 0.1 M phosphate buffer, pH 7.4
- Temperature: Room temperature (25±2°C)
- Applied Potential: -0.2V to +0.6V (vs. Ag/AgCl) depending on catalyst
- Stirring Rate: 300 rpm for amperometric measurements
- Stabilization: 300 seconds in buffer before H₂O₂ addition
The Scientist's Toolkit: Essential Research Reagents and Materials
Table 4: Key Research Reagents for H₂O₂ Electrochemical Sensor Development
| Reagent/Material | Function | Example Application |
|---|---|---|
| Graphene Oxide | Conductive support with high surface area | 3D hydrogel matrix for nanocomposites [6] |
| Nickel Oxide Octahedrons | Electrocatalyst for H₂O₂ redox reaction | Non-enzymatic sensing platform [6] |
| Cholesterol Oxidase | Biological recognition element for H₂O₂ | Enzymatic biosensing with FAD cofactor [5] |
| Silver-doped CeO₂/Ag₂O | Nanocomposite catalyst | Enhanced electron transfer for H₂O₂ reduction [7] |
| PEDOT:PSS | Conductive polymer matrix | OECT semiconductor channel [8] |
| Bromothymol Blue | pH-sensitive indicator | Nernst potential enhancement in OECTs [8] |
| Multi-walled Carbon Nanotubes | Electron transfer mediator | Paste electrode formation [5] |
| Mesoporous Silica SBA-15 | Hard template for nanostructures | NiO octahedron morphology control [6] |
Electrochemical sensors represent the most promising technology for H₂O₂ quantification in plant research due to their exceptional sensitivity, rapid response, and adaptability to complex biological environments. Non-enzymatic approaches using nanomaterial catalysts offer superior stability for prolonged plant stress studies, while enzymatic platforms provide high specificity for precise signaling research. The integration of nanotechnology with electrochemical sensing has enabled detection limits approaching physiological concentrations (nM to pM range), making these tools indispensable for advancing our understanding of ROS signaling in plant systems. Future developments will likely focus on multiplexed sensor arrays for simultaneous detection of H₂O₂ and related signaling molecules, and miniaturized platforms for in planta monitoring.
Core Mechanisms of Optical H₂O₂ Sensing
Hydrogen peroxide (H₂O₂) is a crucial reactive oxygen species (ROS) that functions as a key signaling molecule in plant physiological processes, regulating growth, development, and stress responses [10]. However, when plants encounter biotic stressors (e.g., bacteria, fungi, viruses) or abiotic stressors (e.g., drought, high salinity, temperature extremes, herbicides), the equilibrium between H₂O₂ production and scavenging can be disrupted, leading to its accumulation and causing oxidative stress [11] [10]. This oxidative stress can damage cell membranes, impair photosynthesis, and hinder vital plant functions, ultimately affecting crop yield and quality [11] [12]. Precise detection and quantification of H₂O₂ is therefore fundamental for understanding plant stress physiology and developing effective management strategies. Among the various analytical techniques available, optical sensing has emerged as a powerful, non-invasive approach for real-time monitoring of H₂O₂ in plant systems. This guide provides a detailed comparison of the core mechanisms of optical H₂O₂ sensing, contextualized against electrochemical alternatives, to inform researchers and professionals in plant science and related fields.
Fundamental Principles of Optical H₂O₂ Sensing
Optical sensors for hydrogen peroxide detection operate on the principle of measuring changes in optical properties—such as absorbance, fluorescence, or reflectance—that occur when a sensing element interacts with H₂O₂. Unlike electrochemical sensors that transduce chemical information into an electrical signal, optical sensors convert this information into a measurable optical signal [13]. A significant advantage of optical methods is their suitability for real-time, in-situ detection, which is highly desirable for monitoring dynamic physiological processes in plants [11].
The general mechanism involves a selective recognition element or a chemical reaction that is specific to H₂O₂. This interaction alters the characteristics of light associated with the sensor. For instance, a sensor may incorporate a fluorophore that is initially in a quenched ("off") state. Upon reaction with H₂O₂, the fluorophore is liberated or chemically altered, resulting in the emission of fluorescence ("on" state), the intensity of which is proportional to the H₂O₂ concentration [10]. Other systems may rely on the catalytic decomposition of H₂O₂ by metal oxides or enzymes, leading to a local change in refractive index or light absorption that can be detected optically. A core strength of optical methods is their compatibility with miniaturized and integrated systems, such as microfluidic devices and lab-on-a-chip platforms, facilitating applications in flow-chemistry and bioreactors [13].
Comparative Analysis: Optical vs. Electrochemical H₂O₂ Sensors
The choice between optical and electrochemical sensing modalities depends heavily on the specific requirements of the experiment. The table below provides a quantitative and qualitative comparison of the two approaches, synthesizing data from recent research.
Table 1: Performance Comparison of Optical and Electrochemical H₂O₂ Sensors
| Feature | Optical Sensors | Electrochemical Sensors |
|---|---|---|
| General Principle | Measure changes in light properties (absorbance, fluorescence) upon interaction with H₂O₂ [13] [10] | Measure electrical current or potential change from H₂O₂ redox reaction [6] [10] |
| Sensitivity | Varies with design; can be high with fluorescent probes [10] | Very high; e.g., LOD of 5.3 µM for NiO/3D graphene nanocomposite [6] |
| Selectivity | Can be susceptible to interference from other ROS or colored compounds [10] | High, especially with nanostructured metal oxides (CuO, Co₃O₄) [10] |
| Real-time, in-situ Capability | Excellent; suitable for non-invasive, real-time monitoring in live tissues and flow systems [11] [13] | Good; capable of real-time measurement, but may be more invasive [10] |
| Miniaturization Potential | High; easily integrated into microfluidics and portable devices [13] | High; electrodes can be fabricated at micro-scale [10] |
| Key Advantage | Non-invasiveness, spatial imaging capability, suitability for integrated flow systems [12] [13] | High sensitivity, excellent selectivity with nano-catalysts, cost-effectiveness [6] [10] |
| Key Limitation | Potential for optical interference from sample matrix [10] | Enzyme-based sensors can lack stability; non-enzymatic may have slightly lower sensitivity than top-tier optical [6] [10] |
Table 2: Comparison of Sensor Performance in Applied Plant Research
| Sensor Type | Specific Technology / Material | Reported Performance Metrics | Application Context |
|---|---|---|---|
| Electrochemical | Nanostructured CuO and Co₃O₄ electrodes [10] | Used to detect H₂O₂ release in rye under salt/herbicide stress; levels were ~30% higher than control [10] | Direct quantification of oxidative stress in plant juice |
| Electrochemical | NiO octahedrons on 3D graphene hydrogel (3DGH/NiO) [6] | Sensitivity: 117.26 µA mM⁻¹ cm⁻²; Linear Range: 10 µM–33.58 mM; LOD: 5.3 µM [6] | Detection in real samples (milk); demonstrates sensor capability |
| Optical | Not Specified (Flow-through cell) [13] | Designed for measurements in flow; suitable for microfluidic applications and bioreactors [13] | Integration into flow-chemistry systems for process monitoring |
| Optical | Fluorometric assays (e.g., DCFH-DA) [10] | High sensitivity; uses fluorescent probes that react with H₂O₂ [10] | A common method for H₂O₂ determination in plant tissues |
Experimental Protocols for Sensor Validation
To ensure the reliability and accuracy of H₂O₂ sensors, rigorous experimental validation is essential. The following protocols are representative of methodologies used in the field.
Protocol for Plant Stress Induction and H₂O₂ Measurement
This protocol is adapted from studies assessing oxidative stress in plants using electrochemical sensors [10].
- Plant Material Preparation: Rye seeds are surface-sterilized and germinated under controlled conditions (e.g., 12h light/12h dark photoperiod, 22°C).
- Application of Stressors: Seedlings are divided into groups and treated with abiotic stressors.
- Salt Stress: Water with NaCl solutions (e.g., 150 mM).
- Herbicide Stress: Water with glyphosate solution.
- Control Group: Water without stressor.
- Sample Extraction: After a defined period (e.g., 7-10 days), plant juice is extracted from the seedlings.
- H₂O₂ Quantification:
- The electrochemical sensor (e.g., nanostructured CuO/Co₃O₄ electrode) is calibrated with standard H₂O₂ solutions.
- The plant juice sample is placed on the sensor, and the amperometric response is measured.
- Validation: Chlorophyll concentration can be measured via optical absorption to correlate with H₂O₂ levels, as high H₂O₂ is known to impair photosynthesis [10].
Protocol for Characterizing a Nanomaterial-Based Electrochemical Sensor
This protocol outlines the development and testing of a non-enzymatic sensor, such as the 3DGH/NiO nanocomposite [6].
- Sensor Fabrication:
- Synthesis of Nanomaterial: NiO octahedrons are prepared using a hard template (e.g., mesoporous silica SBA-15). 3D graphene hydrogel (3DGH) is synthesized via a hydrothermal method.
- Composite Formation: NiO octahedrons are self-assembled with 3DGH during the hydrothermal process to form the 3DGH/NiO nanocomposite.
- Electrode Preparation: The nanocomposite is drop-cast or coated onto a glassy carbon electrode surface.
- Physicochemical Characterization: The morphology and structure of the nanocomposite are analyzed using FE-SEM, HR-TEM, XRD, TGA, and Raman spectroscopy [6].
- Electrochemical Performance Evaluation:
- Cyclic Voltammetry (CV): Performed in the absence and presence of H₂O₂ to observe electrocatalytic activity.
- Chronoamperometry: Used to study the current-time response at a fixed potential with successive additions of H₂O₂. This data is used to calculate sensitivity, linear range, and limit of detection (LOD).
- Selectivity and Stability Tests: The sensor's response is tested against common interferents (e.g., ascorbic acid, dopamine, uric acid, glucose), and its long-term stability is assessed over days or weeks [6].
Diagram of Sensing Mechanisms and Workflow
The following diagrams illustrate the core mechanisms of H₂O₂ sensors and a generalized experimental workflow for their application in plant research.
Diagram 1: H₂O₂ Sensing Mechanisms and Application Workflow
The Scientist's Toolkit: Essential Reagents and Materials
Successful H₂O₂ sensing experiments, particularly in complex matrices like plant samples, require carefully selected materials and reagents. The following table details key components used in the featured research.
Table 3: Key Research Reagent Solutions for H₂O₂ Sensing
| Item | Function / Description | Example Use Case |
|---|---|---|
| Nanostructured Metal Oxides (CuO, Co₃O₄, NiO) | Act as electrocatalysts for H₂O₂ redox reaction; increase surface area and reactive sites for enhanced sensitivity [6] [10] | Core material in non-enzymatic electrochemical sensors [10] |
| 3D Graphene Hydrogel | Provides a highly conductive, porous scaffold with a large surface area to support catalyst nanoparticles and facilitate electron transport [6] | Used as a support matrix for NiO octahedrons in a nanocomposite sensor [6] |
| Fluorescent Probes (e.g., DCFH-DA) | Cell-permeable dyes that react with H₂O₂ to produce a fluorescent compound, enabling quantification [10] | Fluorometric detection of H₂O₂ in plant tissues [10] |
| Phosphate Buffered Saline | Provides a stable pH and ionic strength environment for electrochemical measurements and sensor calibration [6] | Base electrolyte for testing sensor performance (e.g., 0.1 M PBS, pH 7.4) [6] |
| Salt/Herbicide Stressors | Used to induce oxidative stress in plant models, leading to elevated H₂O₂ production [10] | Application to rye seedlings to study plant stress responses [10] |
Both optical and electrochemical sensors offer distinct and powerful pathways for detecting hydrogen peroxide in plant science research. Optical sensors excel in scenarios requiring non-invasiveness, spatial mapping, and seamless integration into flow-based systems like microfluidics and bioreactors [12] [13]. In contrast, electrochemical sensors, particularly those leveraging nanostructured metal oxides, provide exceptional sensitivity, selectivity, and cost-effectiveness for direct quantification in complex plant extracts [6] [10].
The decision between these technologies is not a matter of superiority but of application-specific suitability. Researchers must weigh factors such as the need for spatial resolution, required sensitivity, sample matrix, and the potential for integration into larger experimental setups. As both fields advance, the development of novel nanomaterials and fluorescent probes will further enhance the performance, stability, and applicability of these vital scientific tools. The choice ultimately hinges on the specific biological question and experimental constraints, with both modalities offering robust solutions for illuminating the role of H₂O₂ in plant health and stress.
Hydrogen peroxide (H₂O₂) plays a dual role in plant systems, acting as a toxic byproduct of metabolic processes at high concentrations while serving as a key signaling molecule in stress response and development at lower concentrations [14]. Accurate detection of H₂O₂ is therefore crucial for understanding plant physiology, oxidative stress responses, and redox signaling pathways [14]. The selection of an appropriate sensing technology directly impacts the reliability and biological relevance of experimental data. This guide provides an objective comparison between electrochemical and optical H₂O₂ sensors, focusing on the three fundamental performance metrics critical for plant research: sensitivity, limit of detection (LOD), and selectivity.
The following analysis synthesizes experimental data from recent studies to enable researchers to select the most appropriate sensor technology for their specific experimental needs in plant biology.
Performance Metrics Comparison
The table below summarizes the key performance characteristics of electrochemical and optical H₂O₂ sensors based on experimental data from recent studies.
Table 1: Comparative Performance of Electrochemical and Optical H₂O₂ Sensors
| Sensor Technology | Sensitivity | Limit of Detection (LOD) | Selectivity Characteristics | Linear Range | Response Time |
|---|---|---|---|---|---|
| Electrochemical: Ag-doped CeO₂/Ag₂O/GCE [15] | 2.728 µA cm⁻² µM⁻¹ | 6.34 µM | Minimal interference from ascorbic acid, uric acid, dopamine, glucose | 1 × 10⁻⁸ to 0.5 × 10⁻³ M | Not specified |
| Electrochemical: PPy-Ag/Cu modified GCE [16] | 265.06 µA/(mM×cm²) (0.1-1 mM); 445.78 µA/(mM×cm²) (1-35 mM) | 0.027 µM (S/N=3) | Good anti-interference capability demonstrated | 0.1-35 mM | Not specified |
| Optical: LPFG with GO/2L-Fht coating [17] | Resonance wavelength shift vs. concentration | Not specified | High selectivity for H₂O₂ across broad pH range (5-9) | Not specified | Rapid (specific time not given) |
| Optical: Spectrometric with peroxidase enzyme [18] | 41,400 photon count/% | 3.49 × 10⁻⁵% (0.35 ppm) | Specific to enzymatic reaction with H₂O₂ | 5 × 10⁻⁵% to 1 × 10⁻³% | < 3 minutes |
Experimental Protocols for Sensor Evaluation
Electrochemical Sensor Fabrication and Testing
Ag-doped CeO₂/Ag₂O/GCE Sensor Preparation [15]: The Ag-doped CeO₂/Ag₂O nanocomposite was synthesized using a chemical co-precipitation method. Cerium nitrate hexahydrate (0.1 M) was dissolved in 50 mL deionized water, followed by addition of 0.5 g polyvinylpyrrolidone (PVP). This solution was mixed with 0.1 M silver nitrate in 50 mL deionized water. Subsequently, 0.3 M NaOH was gradually added to the colloidal solution under continuous stirring for two hours. The resulting product was washed repeatedly with deionized water, acetone, and ethanol, then dried at 160°C for 12 hours. For electrode preparation, 5 mg of the synthesized nanocomposite was dispersed in 1 mL deionized water and sonicated for 2 hours. Then, 10 µL of this suspension was drop-cast onto a polished glassy carbon electrode (GCE) and dried at ambient temperature.
Performance Evaluation [15]: Electrochemical sensing performance was evaluated using cyclic voltammetry and amperometry in a three-electrode configuration. The modified GCE served as the working electrode, with platinum wire as the counter electrode and Ag/AgCl as the reference electrode. Measurements were conducted in 0.1 M phosphate buffer (pH 7.4) with successive additions of H₂O₂ stock solution. The sensitivity was calculated from the slope of the calibration curve of current response versus H₂O₂ concentration. Selectivity was assessed by challenging the sensor with potential interferents including ascorbic acid, uric acid, dopamine, and glucose.
Optical Sensor Fabrication and Testing
LPFG with GO/2L-Fht Coating Preparation [17]: The long-period fiber grating (LPFG) sensor was fabricated by coating a fiber with graphene oxide (GO) and two-line ferrihydrite (2L-Fht) nanozyme. The optical fiber was first functionalized with (3-aminopropyl)triethoxysilane (APTES) to create amino groups on its surface. The GO/2L-Fht composite was synthesized by mixing GO suspension with 2L-Fht nanoparticles, which exhibit high peroxidase-like activity across a broad pH range. The composite was then immobilized on the sensitive region of the optical fiber. The surface morphology and composition of the coating were characterized using scanning electron microscopy (SEM), energy-dispersive X-ray spectroscopy (EDS), and Fourier-transform infrared (FTIR) spectroscopy.
Performance Evaluation [17]: The sensing mechanism relies on the catalytic decomposition of H₂O₂ by 2L-Fht nanozyme, which interacts with GO nanosheets and modulates the fiber's refractive index, resulting in a shift of the LPFG resonance wavelength. This wavelength shift is directly proportional to H₂O₂ concentration. Sensor performance was evaluated by exposing the functionalized LPFG to H₂O₂ solutions of varying concentrations while monitoring the resonance wavelength shift using an optical sensing interrogator. The effect of pH on sensor performance was investigated across the range of 5-9, which is relevant for plant research applications.
Spectrometric Sensor with Peroxidase Enzyme [18]: This optical sensor utilized peroxidase enzyme immobilized on a glass substrate. The working principle involves the peroxidase-catalyzed conversion of H₂O₂ into water and oxygen, during which the reagent 4-amino-phenazone takes up oxygen together with phenol to form a colored product with absorption peaks at 510 nm and 450 nm. The transmission intensity, which is strongly related to H₂O₂ concentration, was measured for quantitative analysis. The sensor demonstrated reusability for up to 10 applications with consistent performance.
Signaling Pathways and Experimental Workflows
Diagram 1: H₂O₂ Sensor Selection and Evaluation Workflow
The Scientist's Toolkit: Essential Research Reagents and Materials
Table 2: Key Reagents and Materials for H₂O₂ Sensor Implementation
| Material/Reagent | Function/Application | Example Use Case |
|---|---|---|
| Cerium Nitrate Hexahydrate [15] | Precursor for CeO₂ nanocomposite synthesis | Electrochemical sensor fabrication |
| Silver Nitrate (AgNO₃) [15] [16] | Source of silver nanoparticles for electrode modification | Enhancing electrocatalytic activity in non-enzymatic sensors |
| Polypyrrole (PPy) [16] | Conductive polymer for electrode modification | Matrix for metal nanoparticle deposition in electrochemical sensors |
| Graphene Oxide (GO) [17] | Signal transducer and immobilization scaffold | Optical fiber sensor coating for refractive index modulation |
| Two-line Ferrihydrite (2L-Fht) [17] | Nanozyme with peroxidase-like activity | Catalytic decomposition of H₂O₂ in optical sensors |
| Peroxidase Enzyme [18] | Biological recognition element for H₂O₂ | Enzymatic spectrometric sensor for specific H₂O₂ detection |
| (3-aminopropyl)triethoxysilane (APTES) [17] | Surface functionalization agent | Creating amino groups for immobilization on optical fibers |
| Polyvinylpyrrolidone (PVP) [15] | Stabilizing agent in nanoparticle synthesis | Preventing aggregation during nanocomposite preparation |
| 4-amino-phenazone [18] | Chromogenic reagent in spectrometric detection | Forms colored product with phenol in presence of H₂O₂ for optical measurement |
The comparative analysis of electrochemical and optical H₂O₂ sensors reveals distinct advantages for each technology in plant research applications. Electrochemical sensors, particularly non-enzymatic variants using nanocomposite materials, demonstrate superior sensitivity and lower detection limits, with LOD values reaching 0.027 µM [16] and 6.34 µM [15]. These characteristics make electrochemical sensors ideal for quantifying subtle fluctuations in H₂O₂ concentration during plant stress signaling.
Optical sensors offer complementary benefits, including minimal interference in complex plant matrices, compatibility with real-time monitoring, and preservation of sample integrity [19] [17]. The LPFG sensor with GO/2L-Fht coating operates effectively across the pH range of 5-9 [17], which encompasses typical physiological conditions in plant systems. Additionally, the reusability of certain optical sensor designs [18] provides practical advantages for long-term studies.
Selection between these technologies should be guided by specific experimental requirements: electrochemical sensors for maximum sensitivity and detection limits, and optical sensors for non-invasive monitoring and minimal sample perturbation. Future developments will likely focus on integrating both approaches to create hybrid systems that leverage the respective advantages of each technology for advanced plant redox biology research.
Sensor Deployment: Methodologies and Real-World Applications in Plant Science
In-Situ and In-Vivo Monitoring with Electrochemical Patches and Probes
Hydrogen peroxide (H₂O₂) plays a dual role in biological systems, acting as a key signaling molecule at physiological levels while contributing to oxidative stress at elevated concentrations. In plants, H₂O₂ functions as a secondary messenger in signaling pathways and defense responses against pathogens, making its accurate monitoring crucial for understanding cellular processes. Traditional analytical techniques for H₂O₂ detection, including titration, fluorescence spectroscopy, and chromatography, often require sample extraction and lack the temporal resolution for capturing rapid dynamic changes in living systems. The emergence of in-situ and in-vivo monitoring platforms has revolutionized this field by enabling real-time measurements within intact biological specimens with minimal perturbation. Among these advanced tools, electrochemical and optical sensors represent two complementary approaches, each with distinct advantages and limitations for specific research applications. This comparison guide objectively evaluates the performance characteristics of electrochemical versus optical H₂O₂ sensors, providing researchers with experimental data and methodological details to inform their sensor selection for plant research applications.
Fundamental Operating Principles: Electrochemical vs. Optical Sensing Technologies
Electrochemical Sensing Mechanisms
Electrochemical sensors detect H₂O₂ through oxidation or reduction reactions at the electrode-solution interface, generating measurable electrical signals proportional to concentration. These platforms can be categorized into enzymatic and non-enzymatic (nano-enzymatic) systems. Enzymatic sensors utilize biological recognition elements such as horseradish peroxidase (HRP), cytochrome c (Cyt c), catalase (CAT), or cholesterol oxidase (ChOx) that specifically catalyze H₂O₂ redox reactions [4] [5]. While offering excellent selectivity, enzymatic sensors face challenges related to enzyme stability, denaturation, and cost limitations for long-term in-vivo applications [4].
Non-enzymatic electrochemical sensors employ nanostructured materials with inherent electrocatalytic activity toward H₂O₂. Recent developments include silver nanoparticles [9], nickel oxide octahedrons on 3D graphene hydrogel [6], and coordination bond-connected porphyrin-MOFs@MXenes hybrids [20]. These materials facilitate electron transfer reactions while offering enhanced stability and tunable sensitivity. For instance, the 3D graphene hydrogel/NiO nanocomposite demonstrated H₂O₂ reduction with a sensitivity of 117.26 µA mM⁻¹ cm⁻², leveraging the synergistic effects between the conductive carbon framework and catalytic metal oxide [6].
Optical Sensing Mechanisms
Optical sensors transduce H₂O₂ concentration into measurable changes in light properties, including intensity, wavelength, phase, or polarization. Long-period fiber grating (LPFG) sensors represent one advanced approach where H₂O₂ interaction with sensitive coatings (e.g., graphene oxide/two-line ferrihydrite) alters the refractive index near the fiber core, shifting the resonance wavelength [17]. These platforms enable distributed sensing along the fiber length and immunity to electromagnetic interference.
Genetically encoded H₂O₂ indicators (GEHIs) constitute another optical approach, utilizing engineered proteins that undergo conformational changes upon H₂O₂ binding, modulating fluorescence output. The recently developed oROS-HT635 sensor couples a bacterial OxyR peroxide sensing domain with a rhodamine-HaloTag reporter system, enabling real-time monitoring of intracellular H₂O₂ dynamics with subcellular resolution [21]. This far-red indicator (excitation/emission: 640/650 nm) facilitates multiparametric imaging alongside green fluorescent sensors for other analytes while avoiding blue-light-induced photochromic artifacts common in earlier red fluorescent protein-based GEHIs.
Table 1: Fundamental Characteristics of Electrochemical and Optical H₂O₂ Sensors
| Feature | Electrochemical Sensors | Optical Sensors |
|---|---|---|
| Transduction Mechanism | Current/voltage from redox reactions | Light intensity/wavelength changes |
| Sensing Elements | Enzymes, nanomaterials, metal complexes | Dyes, nanoparticles, genetically encoded proteins |
| Signal Output | Electrical (amperometric, voltammetric) | Optical (fluorescence, absorbance, refractive index) |
| Spatial Resolution | Single point measurements (microelectrodes) | Distributed sensing possible (fiber optics) |
| Response Time | Seconds to milliseconds | Milliseconds to seconds (varies by design) |
| Key Advantage | High sensitivity, miniaturization potential | Multiparametric imaging, non-electrical interference |
Figure 1: Fundamental signaling pathways for electrochemical and optical H₂O₂ sensors showing different transduction mechanisms and sensing elements.
Performance Comparison: Quantitative Analysis of Sensing Platforms
Sensitivity and Detection Limits
Direct comparison of sensitivity metrics reveals significant differences between electrochemical and optical sensing platforms. Electrochemical sensors generally achieve higher sensitivity values, as evidenced by the NiO octahedron/3D graphene hydrogel composite exhibiting 117.26 µA mM⁻¹ cm⁻² [6]. This enhanced sensitivity stems from efficient electrocatalytic amplification of the faradaic response. In contrast, optical platforms typically provide sufficient sensitivity for biological concentrations but may not reach the same current-based amplification factors.
Detection limits represent another critical parameter, particularly for measuring basal H₂O₂ levels in physiological conditions. Advanced electrochemical configurations, such as the cholesterol oxidase-based biosensor, achieve detection limits of 0.43 µM [5], while the porphyrin-MOFs@MXenes hybrid system reaches 3.1 µM [20]. Optical approaches like the LPFG sensor offer comparable detection capabilities, optimized for the micromolar range typically encountered in plant systems [17].
Dynamic Range and Response Kinetics
The effective dynamic range determines a sensor's applicability across various biological scenarios, from basal signaling to stress-induced H₂O₂ bursts. Electrochemical sensors frequently demonstrate wider linear ranges, such as the 10 µM–33.58 mM range reported for the 3DGH/NiO25 nanocomposite [6]. This extensive span enables quantification across nearly three orders of magnitude, accommodating diverse experimental conditions. Optical sensors may exhibit more constrained linear ranges but often optimize performance within biologically relevant windows.
Response kinetics critically influence temporal resolution for capturing rapid H₂O₂ fluctuations. Electrochemical microelectrodes enable real-time monitoring with response times of seconds, as demonstrated by in-vivo measurements in Agave tequilana leaves [22]. Advanced optical GEHIs like oROS-HT635 also offer fast kinetics, enabling observation of intracellular H₂O₂ diffusion dynamics, though some fluorescent protein-based variants suffer from slower activation and reduction cycles [21].
Table 2: Performance Comparison of Representative Electrochemical and Optical H₂O₂ Sensors
| Sensor Platform | Sensitivity | Linear Range | Detection Limit | Response Time | Reference |
|---|---|---|---|---|---|
| 3DGH/NiO25 (Electrochemical) | 117.26 µA mM⁻¹ cm⁻² | 10 µM – 33.58 mM | 5.3 µM | Seconds | [6] |
| PMWCNT/ChOx (Electrochemical) | 26.15 µA/mM | 0.4 – 4.0 mM | 0.43 µM | < 30 seconds | [5] |
| (MXenes-FeP)n-MOF (Electrochemical) | Not specified | 10 µM – 3 mM | 3.1 µM | Seconds | [20] |
| Pt Microelectrode (Electrochemical) | Not specified | Biological range | Micromolar | Real-time (seconds) | [22] |
| LPFG Sensor (Optical) | Wavelength shift | 0–80 µM (optimized) | Micromolar | < 2 minutes | [17] |
| oROS-HT635 (Optical) | ΔF/F₀: -68% (300 µM) | Physiological range | Nanomolar (estimated) | Fast (subcellular diffusion) | [21] |
Experimental Protocols for Sensor Implementation
Electrochemical Sensor Fabrication and Measurement
Non-enzymatic Nanocomposite Sensor Preparation [6]:
- Synthesis of NiO Octahedrons: Dissolve 10 mg silica template in 100 mL anhydrous ethanol containing 10 mg nickel nitrate hexahydrate. Stir for 24 hours at room temperature, then dry at 80°C for 48 hours. Calcinate the powder at 550°C for 3 hours (heating rate: 2°C min⁻¹). Remove silica template by treating with 2 M NaOH at 60°C, followed by repeated washing with ethanol and water.
- Self-Assembly of 3D Graphene Hydrogel/NiO: Disperse 48 mg graphene oxide in 32 mL deionized water containing 12 mg NiO octahedrons using bath sonication (2 hours) followed by probe sonication (1.5 hours). Transfer the mixture to a 45 mL Teflon-lined autoclave and maintain at 180°C for 12 hours. After cooling, wash the product with deionized water and dry by freeze-drying.
- Electrode Modification: Prepare electrode ink by dispersing 3DGH/NiO nanocomposite in suitable solvent (e.g., ethanol/water mixture). Drop-cast optimized volume (typically 5-10 µL) onto polished glassy carbon electrode surface and dry under ambient conditions or gentle heating.
- Electrochemical Measurement: Perform cyclic voltammetry in deaerated phosphate buffer (pH 7.4) from -0.8 V to 0.2 V (vs. Ag/AgCl) at scan rate 0.1 V/s. For chronoamperometric H₂O₂ detection, apply constant potential of -0.65 V while adding successive H₂O₂ aliquots under stirred conditions.
In-Vivo Plant Measurement Protocol [22]:
- Microelectrode Fabricration: Fabricate dual-function platinum microelectrodes with diameter < 100 µm to minimize tissue damage during insertion.
- Plant Preparation: Grow Agave tequilana plantlets under controlled conditions (27°C, 14h photoperiod). Inoculate roots with Enterobacter cloacae suspension 3 hours before measurement.
- In-Situ Measurement: Carefully insert microelectrode into leaf tissue avoiding major veins. Record cyclic voltammograms in the potential range of -0.8 V to 0.4 V (vs. pseudo-Ag/AgCl reference) at scan rate 0.1 V/s.
- Data Analysis: Quantify H₂O₂ concentration from reduction current at approximately -0.7 V after background subtraction and calibration with standard solutions.
Optical Sensor Implementation
LPFG Sensor Fabrication and Operation [17]:
- Fiber Grating Preparation: Inscribe long-period grating in single-mode fiber using appropriate UV laser system with controlled periodicity (typically 100-500 µm).
- Sensitive Coating Application: Functionalize grating region with GO/2L-Fht nanocomposite by dip-coating or spray-coating. Prepare coating solution by dispersing 2L-Fht nanozymes (exhibiting peroxidase-like activity across broad pH range) in GO suspension.
- Sensor Characterization: Mount coated LPFG in flow cell and connect to optical measurement system (broadband light source and optical spectrum analyzer). Monitor resonance wavelength shift (λres) during H₂O₂ exposure according to equation: λres = (neffcore - neffclad,m)Λ, where Λ is grating period, neffcore and neffclad,m are effective refractive indices of core and mth cladding mode, respectively.
- Measurement Protocol: Expose sensor to sample solutions with varying H₂O₂ concentrations (0-80 µM) in different pH environments (pH 5-9). Record wavelength shifts and establish calibration curve. Evaluate selectivity against potential interferents (e.g., other ROS, common ions).
Genetically Encoded Sensor Expression and Imaging [21]:
- Plasmid Construction: Clone oROS-HT635 gene construct (ecOxyR sensing domain coupled with HaloTag) into mammalian expression vector under appropriate promoter.
- Cell Transfection: Transfect HeLa cells or other target cells using standard methods (lipofection, electroporation). For plant cells, utilize protoplast transformation or Agrobacterium-mediated delivery.
- Fluorophore Labeling: Incubate transfected cells with 100-500 nM JF635 HaloTag ligand for 15-30 minutes at 37°C. Wash thoroughly to remove unbound dye.
- Live-Cell Imaging: Perform fluorescence imaging using microscope equipped with appropriate far-red filter sets (excitation ~635 nm, emission ~650-700 nm). Acquire time-lapse sequences before and after experimental treatments.
- Data Analysis: Calculate ΔF/F₀ where F₀ is baseline fluorescence before stimulation. Relate fluorescence changes to H₂O₂ concentration using in-situ calibration curves generated with known H₂O₂ additions.
Figure 2: Experimental workflow for implementing electrochemical and optical H₂O₂ sensors, from fabrication to in-vivo application.
The Scientist's Toolkit: Essential Research Reagent Solutions
Table 3: Key Research Reagents and Materials for H₂O₂ Sensor Development
| Reagent/Material | Function/Application | Example Sources |
|---|---|---|
| Graphene Oxide | Conductive scaffold with high surface area for electrode modification | Sigma-Aldrich, Aladdin Biochemical Technology [17] [6] |
| Nickel Nitrate Hexahydrate | Precursor for NiO octahedron synthesis | Sigma-Aldrich [6] |
| Cholesterol Oxidase (ChOx) | Enzymatic recognition element for H₂O₂ detection | Sigma-Aldrich (C1235-100UN) [5] |
| Multi-walled Carbon Nanotubes | Conductive nanomaterial for electrode matrices | Sigma-Aldrich (OD: 6-13 nm, Length: 2.5-20 μm) [5] |
| 4-Mercaptopyridine | Surface modifier for MXenes functionalization | Aladdin Biochemical Technology [20] |
| TCPP (Tetrakis(4-carboxyphenyl)porphyrin) | Organic linker for MOF construction | Scientific suppliers [20] |
| Janelia Fluor 635 (JF635) | HaloTag ligand for far-red fluorescence | Janelia Research Campus [21] |
| Two-line Ferrihydrite (2L-Fht) | Nanozyme with peroxidase-like activity | Laboratory synthesis [17] |
| APTES (3-Aminopropyltriethoxysilane) | Silane coupling agent for surface functionalization | Aladdin Biochemical Technology [17] |
Electrochemical and optical H₂O₂ sensors offer complementary strengths for in-situ and in-vivo monitoring applications in plant research. Electrochemical platforms provide superior sensitivity, rapid response kinetics, and direct quantification capabilities, making them ideal for real-time monitoring of H₂O₂ fluctuations in complex plant tissues with minimal spatial resolution requirements. The microelectrode study in Agave tequilana demonstrates their practical utility for detecting early stress responses [22]. Conversely, optical sensors excel in applications requiring spatial mapping, multiparametric imaging, and non-invasive monitoring over extended periods. The LPFG platform enables distributed sensing in growth environments [17], while genetically encoded indicators permit subcellular resolution of H₂O₂ dynamics in living cells [21].
Sensor selection should be guided by specific research objectives: electrochemical systems for temporal resolution of rapid H₂O₂ transients, and optical approaches for spatial mapping or integration with other fluorescent biomarkers. Future developments will likely focus on hybrid approaches combining the advantages of both technologies, enhanced biocompatibility for long-term implantation, and expanded multiplexing capabilities for comprehensive oxidative stress assessment in plant systems.
Non-Invasive Plant Health Assessment via Optical Spectroscopy and Imaging
In plant physiology, hydrogen peroxide (H₂O₂) functions as a crucial signaling molecule involved in development, stress response, and defense pathways. However, its accurate detection presents significant challenges due to its transient nature, low concentration in tissues, and the potential for causing damage during invasive measurement procedures. The detection of H₂O₂ has become a critical component in understanding plant stress responses to abiotic and biotic factors, including pathogen attack, drought, salinity, and heavy metal toxicity. The development of reliable, non-invasive sensing methodologies is therefore essential for advancing plant science and precision agriculture.
This guide provides a comparative analysis of two principal technological approaches for H₂O₂ detection in plant research: electrochemical sensing and optical spectroscopy/imaging. We objectively evaluate their operational principles, performance metrics, and practical applicability to help researchers select the appropriate tool for their specific experimental needs.
Comparative Analysis of H₂O₂ Sensing Technologies
The following table summarizes the key performance characteristics of state-of-the-art electrochemical and optical H₂O₂ sensors as documented in recent literature.
Table 1: Performance Comparison of Electrochemical and Optical H₂O₂ Sensors
| Sensor Technology | Detection Principle | Linear Range | Limit of Detection (LOD) | Key Advantages | Reported Applications/Context |
|---|---|---|---|---|---|
| Ag-CeO₂/Ag₂O/GCE (Electrochemical) [7] | Electrocatalytic reduction of H₂O₂ | 1×10⁻⁸ to 0.5×10⁻³ M | 6.34 µM | High sensitivity (2.728 µA cm⁻² µM⁻¹), excellent selectivity, non-enzymatic | Laboratory analysis; potential for real-sample analysis in various sectors |
| PEDOT:BTB/PEDOT:PSS OECT (Electrochemical) [8] | Synergistic Nernst potential from Pt gate and H⁺-BTB interaction | Information missing | 1.8×10⁻¹² M (pM level) | Ultra-low LOD, portable microsystem capability, biocompatible | Food safety (e.g., milk), fundamental study of enzyme-catalyzed reactions |
| CeO₂-phm/cMWCNTs/SPCE (Electrochemical) [23] | Nanozyme-catalyzed reduction | 0.5 to 450 µM | 0.017 µM | High sensitivity (~2162 µA·mM⁻¹·cm⁻²), wide linear range, flexible substrate | Biomedical diagnostics, environmental surveillance, food safety |
| GO/2L-Fht LPFG (Optical) [17] | Refractive index shift induced by H₂O₂ decomposition products | 0 - 100 µM | ~0.21 µM (Estimated from data) | Rapid response (~6.4 s), works in broad pH range (3-11), suitable for in-situ monitoring | Optimizing H₂O₂ dosage in UV/H₂O₂ wastewater treatment processes |
Experimental Protocols for H₂O₂ Sensor Development and Validation
1. Synthesis of Ag-Doped CeO₂/Ag₂O Nanocomposite:
- Materials: Cerium nitrate hexahydrate (Ce(NO₃)₃·6H₂O), silver nitrate (AgNO₃), polyvinylpyrrolidone (PVP, MW 40,000), sodium hydroxide (NaOH), acetone, and ethanol.
- Procedure:
- Dissolve 0.1 M Ce(NO₃)₃·6H₂O in 50 mL deionized water. Add 0.5 g PVP to the solution.
- Mix this solution with 0.1 M AgNO₃ dissolved in 50 mL deionized water.
- Gradually add 0.3 M NaOH in 50 mL deionized water to the mixed colloidal solution under continuous stirring.
- Stir the mixture for 2 hours.
- Wash the resultant precipitate multiple times with deionized water, acetone, and ethanol.
- Dry the final product at 160 °C for 12 hours to obtain the Ag-doped CeO₂/Ag₂O nanocomposite.
2. Sensor Fabrication and Characterization:
- The nanocomposite is used to modify a glassy carbon electrode (GCE).
- Material characterization is performed using X-ray diffraction (XRD), Fourier-transform infrared spectroscopy (FT-IR), field-emission scanning electron microscopy (FE-SEM), and high-resolution transmission electron microscopy (HR-TEM).
- Electrochemical performance is evaluated using cyclic voltammetry and amperometry in a standard three-electrode setup.
3. H₂O₂ Detection:
- The amperometric response (current change) is measured at a fixed potential while successive additions of H₂O₂ are made to the buffer solution.
- The sensitivity, limit of detection (LOD), and linear range are calculated from the resulting calibration curve.
1. Sensor Probe Fabrication:
- Materials: Long-period fiber grating (LPFG), graphene oxide (GO, 1 mg/mL), ferric nitrate nonahydrate, 3-aminopropyltriethoxysilane (APTES).
- Procedure:
- Fiber Functionalization: Immerse the LPFG in a piranha solution for 1 hour, then rinse. Subsequently, immerse it in a 5% v/v APTES ethanol solution for 12 hours to aminate the surface.
- Sensitive Coating Preparation: Synthesize two-line ferrihydrite (2L-Fht) nanozyme. Prepare the GO/2L-Fht composite by dispersing GO in a 2L-Fht suspension.
- Coating Immobilization: Dip the aminated LPFG into the GO/2L-Fht composite solution, then dry it at 60°C for 6 hours to form the sensitive coating.
2. H₂O₂ Detection Setup:
- The experimental setup involves a broadband light source to illuminate the optical fiber and an optical spectrum analyzer (OSA) to monitor the transmission spectrum.
- The sensor probe is immersed in the analyte solution containing H₂O₂.
- The catalytic reaction between the 2L-Fht nanozyme and H₂O₂ produces water, which interacts with GO sheets, altering the local refractive index.
- This change in refractive index causes a shift in the resonance wavelength of the LPFG, which is recorded in real-time by the OSA.
3. Data Analysis:
- The wavelength shift is plotted against the H₂O₂ concentration to generate a calibration curve from which the sensor's sensitivity and LOD are derived.
Visualization of Sensor Principles and Workflows
The Scientist's Toolkit: Essential Research Reagents and Materials
Table 2: Key Research Reagents and Materials for H₂O₂ Sensor Development
| Item | Function/Application | Example Context |
|---|---|---|
| Cerium Nitrate Hexahydrate | Cerium source for synthesizing CeO₂-based nanozymes. | Precursor for Ag-CeO₂/Ag₂O nanocomposite [7] and porous CeO₂ hollow microspheres [23]. |
| Silver Nitrate (AgNO₃) | Dopant to enhance the electrical conductivity and catalytic activity of metal oxides. | Used in Ag-doped CeO₂/Ag₂O nanocomposite [7]. |
| Polyvinylpyrrolidone (PVP) | Stabilizing agent to control particle growth and prevent aggregation during synthesis. | Used in the co-precipitation synthesis of Ag-CeO₂/Ag₂O [7]. |
| Graphene Oxide (GO) | Scaffold for immobilizing nanozymes; acts as a highly responsive signal transducer. | Component of the GO/2L-Fht sensitive coating in LPFG optical sensors [17]. |
| Two-line Ferrihydrite (2L-Fht) | Nanozyme with high peroxidase-like activity for catalyzing H₂O₂ decomposition. | Active material in the GO/2L-Fht coating for optical sensing [17]. |
| 3-Aminopropyltriethoxysilane (APTES) | Silane coupling agent for functionalizing surfaces with amine groups. | Used to aminate the optical fiber surface for coating adhesion [17]. |
| Screen-Printed Carbon Electrodes (SPCE) | Low-cost, disposable, and flexible substrate for building electrochemical sensors. | Platform for the CeO₂-phm/cMWCNTs biosensor [23]. |
| Carboxylated Multi-Walled Carbon Nanotubes (cMWCNTs) | Enhance electron transfer and provide a high-surface-area platform for immobilizing nanozymes. | Used in the CeO₂-phm/cMWCNTs/SPCE sensor [23]. |
| PEDOT:PSS and PEDOT:BTB | Conductive polymer and composite used as the semiconducting channel in organic electrochemical transistors (OECTs). | Enable ultra-low LOD detection in OECT-based H₂O₂ sensors [8]. |
The comparative data indicates a clear performance trade-off between electrochemical and optical sensing platforms. Electrochemical sensors currently dominate in achieving ultra-low limits of detection, reaching picomolar (pM) levels [8], and offer high sensitivity, making them ideal for quantifying trace amounts of H₂O₂ in complex matrices. Their potential for miniaturization and integration into portable systems is a significant advantage for field-deployable plant health monitors.
Conversely, optical sensors, particularly those based on fiber gratings like LPFG, excel in scenarios requiring in-situ, real-time monitoring within dynamic liquid environments without consuming reagents [17]. Their robustness across a broad pH range and immunity to electromagnetic interference are distinct benefits. Furthermore, the integration of optical sensing with broader non-destructive plant phenotyping platforms, such as multispectral and hyperspectral imaging systems, presents a powerful synergy [24] [25]. These imaging technologies can provide a holistic view of plant health status, where an integrated optical H₂O₂ sensor could offer a specific, validated biochemical correlate to the broader physiological and growth parameters measured by the imager.
In conclusion, the choice between electrochemical and optical sensing depends heavily on the research priorities. Electrochemical methods are superior for ultimate sensitivity and low-concentration quantification. Optical methods offer significant advantages for non-invasive, real-time monitoring and integration into larger phenotyping systems. Future development will likely focus on merging the strengths of both approaches to create highly sensitive, specific, and integrable sensors for a comprehensive, non-invasive assessment of plant health.
Integration with Precision Agriculture and Smart Farming Systems
The accurate monitoring of hydrogen peroxide (H₂O₂) in plants has emerged as a critical capability in modern precision agriculture. As a key signaling molecule and stress indicator, H₂O₂ concentration provides vital insights into plant health, disease states, and responses to environmental stressors [26] [27]. The integration of sensing technologies into smart farming systems enables real-time monitoring of crop physiology, moving beyond traditional visual inspection to precise molecular diagnostics [26]. Two principal sensing paradigms—electrochemical and optical detection—have established themselves as foundational technologies for this purpose, each with distinct operational principles, performance characteristics, and implementation considerations within agricultural frameworks [26] [27].
Electrochemical sensors function by converting chemical reactions involving H₂O₂ into measurable electrical signals, enabling direct quantification of this important biomarker [28] [26]. These systems have evolved significantly with advancements in nanomaterial science, leading to the development of enzyme-free approaches that offer enhanced stability and reliability in field conditions [28] [29]. Optical sensing strategies, conversely, typically employ catalytic nanomaterials that mimic peroxidase enzymes to produce colorimetric changes in the presence of H₂O₂, allowing visual or spectrophotometric detection [27]. The selection between these technological approaches represents a significant consideration for researchers and agricultural professionals implementing precision monitoring systems.
This analysis provides a comprehensive comparison of electrochemical and optical H₂O₂ sensing platforms, with particular emphasis on their integration capabilities, performance parameters, and practical implementation within precision agriculture and smart farming systems. By synthesizing experimental data and technical specifications, this review aims to inform sensor selection and deployment strategies for agricultural researchers and technology developers working at the intersection of plant science, sensor technology, and smart farming infrastructure.
Fundamental Operating Principles
Electrochemical Sensing Mechanisms
Electrochemical H₂O₂ sensors operate on the principle of directly converting the chemical energy of H₂O₂ redox reactions into measurable electrical signals without requiring external power sources for the detection reaction itself [28]. These systems typically employ a two-electrode configuration where H₂O₂ serves as both oxidant and reductant in a galvanic cell setup, generating electrical signals proportional to concentration [28].
The fundamental mechanism involves redox reactions facilitated by electrocatalytic materials. At the anode, hydrogen peroxide undergoes oxidation: H₂O₂ → O₂ + 2H⁺ + 2e⁻, while at the cathode, reduction occurs: H₂O₂ + 2H⁺ + 2e⁻ → 2H₂O [28] [30]. This approach enables the development of self-powered sensors that are particularly advantageous for remote agricultural monitoring applications where power availability may be limited [28]. Advanced electrode materials including noble metals, metal-organic frameworks (MOFs), carbon nanomaterials, and biomimetic nanozymes have been engineered to enhance sensitivity, selectivity, and stability in complex plant environments [30] [29].
Recent innovations have focused on enzyme-free configurations using durable catalytic materials that resist denaturation in field conditions. For instance, Pt-Ni hydrogels have demonstrated exceptional electrocatalytic activity toward H₂O₂, facilitating sensitive detection in plant systems while overcoming the fragility and cost limitations associated with natural enzymes [27].
Optical Sensing Mechanisms
Optical H₂O₂ sensors typically operate through peroxidase-mimetic (nanozyme) catalytic activities that generate measurable color changes in the presence of H₂O₂ [27]. These systems employ catalytic nanomaterials such as metal hydrogels that facilitate the oxidation of chromogenic substrates like 3,3,5,5-tetramethylbenzidine (TMB), producing color transitions from transparent to blue with intensity proportional to H₂O₂ concentration [27].
The catalytic mechanism primarily involves the generation of hydroxyl radicals (•OH) from H₂O₂, which subsequently oxidize the chromogenic substrate [27]. This reaction pathway enables both visual qualitative assessment and quantitative spectrophotometric measurement at characteristic wavelengths (typically 652 nm for ox-TMB) [27]. The fundamental reaction can be summarized as: H₂O₂ + chromogen (colorless) → oxidized chromogen (colored) + H₂O.
Advanced nanozymes have been engineered to exhibit enhanced catalytic efficiency compared to natural enzymes like horseradish peroxidase (HRP), with higher substrate affinity (lower Michaelis constant Km) and increased catalytic activity per unit concentration (higher Kcat) [27]. These properties make optical sensors particularly valuable for field-deployable applications in agricultural settings, where visual readouts provide immediate diagnostic information without requiring sophisticated instrumentation.
Performance Comparison and Experimental Data
Quantitative Performance Metrics
Direct comparison of electrochemical and optical H₂O₂ sensors reveals distinct performance advantages for each platform across different metrics. Electrochemical systems generally offer superior sensitivity with lower detection limits, while optical sensors provide wider linear ranges suitable for measuring H₂O₂ across varying concentration levels found in plant systems.
Table 1: Comparative Performance Metrics of H₂O₂ Sensing Platforms
| Parameter | Electrochemical Sensors | Optical Sensors |
|---|---|---|
| Detection Limit | 0.030 μM – 0.15 μM [27] | 0.030 μM – 0.15 μM [27] |
| Linear Range | 0.50 μM – 5.0 mM [27] | 0.10 μM – 10.0 mM [27] |
| Response Time | Rapid (< 30 seconds) [29] | Moderate (∼3 minutes) [27] |
| Stability | > 60 days [27] | > 60 days [27] |
| Selectivity | High against common interferents [27] | High against common interferents [27] |
| Power Requirement | Self-powered or minimal [28] | No power for detection |
| Measurement Type | Quantitative | Qualitative/Semi-quantitative/Quantitative |
Electrochemical sensors demonstrate exceptional performance for precise quantification of low H₂O₂ concentrations, with detection limits as low as 0.030 μM achieved using advanced Pt-Ni hydrogel platforms [27]. This sensitivity is crucial for detecting early stress responses in plants, where subtle changes in H₂O₂ concentration may signal the onset of disease or environmental stress before visible symptoms appear [26]. The rapid response time of electrochemical systems (typically under 30 seconds) enables real-time monitoring of dynamic physiological processes in plants [29].
Optical sensors offer the advantage of visual interpretation, with color changes providing immediate qualitative information for field assessment [27]. The wider linear range of optical platforms (0.10 μM – 10.0 mM) accommodates measurement across diverse plant systems and stress conditions where H₂O₂ concentrations may vary significantly [27]. Both platforms demonstrate excellent long-term stability exceeding 60 days, ensuring reliable performance throughout critical crop growth periods [27].
Agricultural Implementation Characteristics
The integration of H₂O₂ sensing platforms within precision agriculture systems involves distinct considerations for field deployment, data acquisition, and compatibility with smart farming infrastructure.
Table 2: Agricultural Implementation Characteristics
| Implementation Factor | Electrochemical Sensors | Optical Sensors |
|---|---|---|
| Field Deployment | Suitable for continuous monitoring [26] | Best for periodic assessment |
| Data Integration | Direct compatibility with IoT platforms [31] [32] | Requires imaging systems for quantification |
| Multiplexing Capability | Moderate | High with multiple chromogens |
| Cost Considerations | Higher initial investment [33] | Lower cost for simple tests |
| Expertise Requirements | Technical expertise needed [32] | Minimal training required |
| Scalability | Moderate | High for simple colorimetric tests |
Electrochemical sensors integrate seamlessly with IoT-based smart farming systems through direct electrical signal output that interfaces efficiently with data acquisition modules and wireless communication platforms [31] [32]. This enables continuous monitoring of plant stress indicators and integration with automated decision-support systems for precision irrigation, fertilization, and pest management [32]. The digital nature of electrochemical sensor output facilitates aggregation with other agricultural data streams (soil moisture, temperature, humidity) within centralized farm management platforms [31].
Optical sensing platforms offer distinct advantages in accessibility and visual verification, allowing direct observation of results without intermediary electronics [27]. This characteristic is particularly valuable for field scouting applications and farm operations with limited technical infrastructure. Recent advancements have enabled integration of optical sensors with portable imaging devices (smartphones) and simplified readers, bridging the gap between qualitative assessment and quantitative data collection for precision agriculture applications [27].
Experimental Protocols and Methodologies
Electrochemical Sensor Fabrication and Measurement
The development of high-performance electrochemical H₂O₂ sensors employs sophisticated nanomaterial synthesis and electrode modification protocols to achieve the sensitivity and selectivity required for plant monitoring applications.
Electrode Fabrication Protocol:
- Synthesis of Pt-Ni Hydrogel Catalysts: Prepare an aqueous solution containing chloroplatinic acid (H₂PtCl₆) and nickel chloride (NiCl₂) with controlled atomic ratios (e.g., Pt:Ni = 1:3). Rapidly reduce the metal precursors using freshly prepared sodium borohydride (NaBH₄) solution under vigorous stirring. Centrifuge the resulting hydrogel and wash thoroughly to remove impurities [27].
- Electrode Modification: Deposit the Pt-Ni hydrogel suspension onto pre-treated screen-printed carbon electrodes (SPCEs) or other suitable substrates. Optimize the modification density to achieve uniform catalytic layer coverage without compromising mass transport. Dry under controlled conditions to form stable modified electrodes [27].
- Sensor Characterization: Perform cyclic voltammetry in buffer solutions with and without H₂O₂ to confirm electrocatalytic activity. Evaluate sensor performance through amperometric i-t measurements at optimized detection potential [27].
H₂O₂ Measurement Protocol:
- Sample Preparation: Extract apoplastic fluid or prepare leaf tissue homogenates from plant specimens using standardized extraction buffers. For in vivo applications, implant microsensors in plant tissues or use sap-collecting microfluidic interfaces [26].
- Amperometric Detection: Apply a constant optimal detection potential (typically -0.2 V to 0.6 V vs. Ag/AgCl depending on catalytic material) to the working electrode. Record the steady-state current response upon successive additions of standard H₂O₂ solutions or plant samples [27].
- Data Analysis: Construct a calibration curve by plotting current response against H₂O₂ concentration. Determine unknown concentrations in plant samples from the regression equation of the calibration curve. Account for matrix effects through standard addition methods when necessary [27].
Optical Sensor Preparation and Detection
Colorimetric H₂O₂ sensing employs nanozyme-based detection systems that generate measurable color changes proportional to analyte concentration.
Nanozyme Synthesis Protocol:
- Preparation of Pt-Ni Hydrogel Nanozymes: Follow the metal reduction synthesis described in section 4.1 to prepare peroxidase-mimetic nanocatalysts. Characterize the morphological properties using SEM/TEM to confirm the formation of interconnected nanowire networks with high surface area [27].
- Catalytic Activity Optimization: Evaluate the peroxidase-like activity using TMB as chromogenic substrate. Systematically vary synthesis parameters (metal ratios, reduction conditions) to maximize catalytic efficiency. Determine kinetic parameters (Km, Vmax) through steady-state kinetic assays [27].
H₂O₂ Detection Protocol:
- Colorimetric Reaction: Incubate plant samples (extracted sap or tissue homogenates) with optimized concentrations of nanozyme catalyst and TMB substrate in suitable buffer (e.g., acetate buffer, pH 4.0). Allow the color development reaction to proceed for a fixed time period (typically 3-10 minutes) [27].
- Signal Measurement: Quantify the color intensity using either:
- Spectrophotometric Method: Measure absorbance at 652 nm using a microplate reader or portable spectrophotometer [27].
- Visual Assessment: Compare against standardized color reference cards for semi-quantitative field analysis [27].
- Portable Digital Imaging: Capture images using smartphone cameras and analyze RGB values with dedicated applications for quantitative interpretation [27].
- Quantification: Calculate H₂O₂ concentrations from standard curves prepared with known H₂O₂ concentrations processed under identical conditions. Account for sample matrix effects through appropriate controls [27].
Integration with Precision Agriculture Systems
Smart Farming Implementation Frameworks
The incorporation of H₂O₂ sensing technologies within precision agriculture occurs within the broader context of Agriculture 4.0 and Agriculture 5.0 frameworks, which emphasize data-driven decision-making and human-technology collaboration [32]. These frameworks leverage IoT architectures to create interconnected sensing networks that monitor multiple aspects of crop health and environmental conditions [31] [32].
Electrochemical H₂O₂ sensors function as key components within wireless sensor networks (WSNs) deployed throughout agricultural fields [31]. These networks utilize communication protocols including LoRa, NB-IoT, and ZigBee to transmit real-time phyto-chemical data to centralized farm management platforms [31]. The electrical output of electrochemical sensors interfaces directly with microcontroller-based systems (e.g., Arduino, Raspberry Pi) for onboard processing and wireless transmission, enabling continuous monitoring of plant stress status [31]. This capability aligns with the vision of Agriculture 4.0, which emphasizes automation and data exchange in farming technologies [32].
Optical H₂O₂ detection systems integrate within precision agriculture through both laboratory-based analysis and emerging field-deployable platforms. Portable colorimetric tests enable rapid in-field assessment of plant stress during crop scouting activities [27]. For more quantitative applications, smartphone-based imaging platforms coupled with cloud-based analytics provide a bridge between simple color tests and sophisticated laboratory instrumentation, making optical sensing particularly accessible for farming operations at various technological levels [27]. This approach resonates with the Agriculture 5.0 paradigm that emphasizes human-machine collaboration and accessibility [32].
Data Integration and Decision Support Systems
H₂O₂ sensor data acquires maximum value when integrated with complementary agricultural data streams within comprehensive farm management systems. Smart farming implementations typically combine H₂O₂ measurements with environmental sensors (temperature, humidity, soil moisture), soil nutrient sensors, and optical imaging data from drones or satellites [34] [32].
Electrochemical sensors generate continuous digital data that feeds into predictive analytics algorithms for early stress detection and intervention planning [31] [32]. Machine learning models correlate H₂O₂ patterns with specific stress conditions (pathogen attack, drought, nutrient deficiency), enabling prescriptive recommendations for targeted interventions through variable-rate technology (VRT) systems [32]. This integrated approach optimizes resource allocation, minimizing unnecessary applications of water, fertilizers, and pesticides while maximizing crop protection efficacy [26] [32].
Optical sensor data, while often less continuous, provides valuable ground-truthing for remote sensing platforms and rapid assessment during critical growth stages. The visual nature of optical results facilitates farmer engagement and interpretation, supporting informed decision-making even in resource-limited settings [27]. Both sensing approaches contribute to the creation of comprehensive agricultural databases that drive continuous improvement through retrospective analysis of crop responses to management practices [26] [32].
Essential Research Reagent Solutions
Successful implementation of H₂O₂ sensing in plant research requires specific reagent systems and materials tailored to each detection methodology. The following research reagents represent fundamental components for experimental work in this domain.
Table 3: Essential Research Reagents for H₂O₂ Sensing in Plants
| Reagent/Material | Function | Application Context |
|---|---|---|
| Pt-Ni Hydrogel Catalysts | Electrocatalytic and nanozyme activity | Electrode modification (electrochemical) and colorimetric detection (optical) [27] |
| Screen-Printed Electrodes (SPE) | Disposable electrode platforms | Electrochemical sensor fabrication for field-deployable systems [27] |
| TMB (3,3,5,5-Tetramethylbenzidine) | Chromogenic substrate | Colorimetric detection of H₂O₂ in optical sensing [27] |
| Metal-Organic Frameworks (MOFs) | Porous catalytic materials | Enzyme-free electrochemical sensing platforms [29] |
| Plant Extraction Buffers | Sample preparation and stabilization | Isolation of apoplastic fluid and tissue homogenates for H₂O₂ analysis [26] |
| Nafion Membranes | Interference rejection | Selective permeation membranes for electrochemical sensors [30] |
| Portable Potentiostats | Electrochemical signal measurement | Field-deployable electronic readers for electrochemical sensors [27] |
| Smartphone Imaging Platforms | Colorimetric signal quantification | Portable readout systems for optical sensors in field conditions [27] |
The selection and optimization of these reagent systems significantly impact sensor performance characteristics including sensitivity, selectivity, and reliability in complex plant matrices. Pt-Ni hydrogel catalysts represent particularly versatile materials that function effectively in both electrochemical and optical detection modalities, demonstrating the convergence of sensing material development [27]. Metal-organic frameworks (MOFs) offer tunable catalytic properties and high surface areas that enhance electrochemical detection capabilities, with composition and structure directly influencing sensor performance [29].
Sample preparation reagents require careful formulation to stabilize endogenous H₂O₂ during extraction while minimizing artificial generation or decomposition. Plant-specific extraction protocols must account for tissue-specific variations in antioxidant content and potential interfering compounds that might affect detection accuracy [26]. The integration of these reagent systems with appropriate instrumentation platforms enables the translation of laboratory-based sensing methodologies to field-deployable monitoring solutions suitable for precision agriculture applications.
Electrochemical and optical H₂O₂ sensing platforms offer complementary capabilities for integration within precision agriculture and smart farming systems. Electrochemical sensors provide superior sensitivity, rapid response, and direct compatibility with digital farming infrastructure, making them ideal for continuous monitoring applications and automated decision-support systems. Optical sensors offer accessibility, visual verification, and simpler implementation, serving well for periodic assessment, field scouting, and operations with limited technical resources.
The selection between these technologies depends on specific application requirements, available infrastructure, and implementation context within the agricultural workflow. Future developments in sensor miniaturization, energy harvesting, wireless communication, and data analytics will further enhance the integration of both sensing paradigms within comprehensive smart farming ecosystems. As precision agriculture continues to evolve toward more proactive, predictive management approaches, H₂O₂ monitoring will play an increasingly important role in understanding plant physiology and optimizing crop production systems.
The accurate detection of hydrogen peroxide (H2O2) has emerged as a critical methodology in plant stress physiology, serving as a primary signaling molecule in plant immune responses and adaptation mechanisms. This reactive oxygen species functions as a central messenger in systemic signaling pathways, activating defense mechanisms against both biotic challenges, such as pathogen attacks, and abiotic stresses, including wounding, salinity, and heat [35] [36]. The real-time monitoring of H2O2 dynamics provides researchers with a powerful window into understanding plant stress perception and transduction mechanisms. Currently, two principal sensing paradigms dominate this field: electrochemical sensors, which transduce H2O2 concentration into measurable electrical signals, and optical sensors, which utilize fluorescent or chemiluminescent properties for detection [19]. This guide provides an objective comparison of these competing technological approaches, evaluating their performance characteristics, experimental requirements, and suitability for specific research scenarios in crop science, supported by direct experimental evidence from recent studies.
Performance Comparison: Electrochemical vs. Optical H2O2 Sensors
The selection between electrochemical and optical sensing platforms requires careful consideration of performance specifications relative to experimental goals. The following table summarizes quantitative and qualitative data from recent sensor applications in plant studies, providing a basis for direct comparison.
Table 1: Performance comparison of electrochemical and optical H2O2 sensors in plant research
| Feature | Electrochemical Sensors | Optical Nanosensors |
|---|---|---|
| Detection Principle | Amperometric or voltammetric measurement of H2O2 redox current [4] [37] | Fluorescence quenching or enhancement of nanomaterial-analyte interaction [35] [38] |
| Sensitivity | High (e.g., PMWCNT/ChOx LOD: 0.43 µM) [5] | High (enables real-time tracking of H2O2 waves) [38] |
| Spatial Resolution | Macroscopic (millimeter to centimeter scale) | High (subcellular to tissue level) [21] [38] |
| Temporal Resolution | Real-time (seconds to minutes) [4] [39] | Real-time (sub-second to minute scale) [21] |
| Invasiveness | Typically implantable, requiring physical insertion [39] | Minimally invasive (wiped or sprayed on surface) [35] |
| Key Advantages | Simple operation, portable, cost-effective, self-powered systems possible [4] [37] [39] | Species-independent, spatial mapping capability, multiparametric imaging with different fluorophores [21] [38] |
| Limitations | Limited spatial mapping capability, potential electrode fouling | Potential photobleaching, light scattering in tissues, calibration challenges in vivo |
| Example Wave Speed Measurement | Not directly applicable | Lettuce: 0.44 cm/min; Arabidopsis: 3.10 cm/min [38] |
Experimental Protocols for H2O2 Sensing in Plant Studies
Implantable Electrochemical Sensor for Real-Time H2O2 Monitoring
Recent research demonstrates the development of fully implantable, self-powered electrochemical systems for continuous H2O2 monitoring in living plants [39].
- Sensor Fabrication and Principle: The platform typically consists of a microsensor for H2O2 detection integrated with a miniature photovoltaic (PV) module. The sensor operates on amperometric principles, where a constant potential is applied, and the current generated from the oxidation or reduction of H2O2 at the electrode surface is measured. This current is directly proportional to the H2O2 concentration [4] [39].
- Power Management: The integrated PV module scavenges energy from sunlight or artificial growth lights, enabling continuous, long-term operation without external power sources. This self-sufficiency is crucial for field applications [39].
- Implantation and Data Acquisition: The microsensor is implanted directly into specific plant tissues (e.g., stem, leaf). The resulting current signal is transmitted to a data acquisition system, which correlates the signal with H2O2 concentration via a pre-established calibration curve. This setup allowed researchers to resolve the time and concentration specificity of H2O2 signals in response to various abiotic stresses [39].
In Situ Fluorescence Sensing of Stress-Induced H2O2
A representative protocol for using optical nanosensors involves the application of a fluorescent composite material to plant surfaces for in situ monitoring [35].
- Nanosensor Synthesis: Zeolitic imidazolate framework-67 (ZIF-67) nanoparticles are synthesized in methanol solutions of cobalt nitrate and 2-methylimidazole. Silver nanoparticles (Ag NPs) are then generated in situ on the ZIF-67 surface to form the Ag@ZIF-67 composite. The Pacific Blue fluorophore, conjugated to a single-stranded DNA probe, is immobilized onto the Ag NPs via Ag-S bonds. In this state, the fluorophore's signal is quenched by the proximal Ag NPs ("signal-off" state) [35].
- Sensor Application and Imaging: The Pacific Blue-probe DNA/Ag@ZIF-67 composite is suspended in a solution and sprayed onto or wiped onto the surface of the plant organ to be monitored (e.g., leaf, root). The sample is then subjected to stress (e.g., mechanical wounding, heat). The presence of H2O2 produced in response to the stress corrodes the Ag NPs, releasing the Pacific Blue fluorophore and restoring its fluorescence ("signal-on" state) [35].
- Data Capture and Analysis: The fluorescence signal is captured using a fluorescence imaging system. The increase in fluorescence intensity is quantitatively correlated with the concentration of H2O2, allowing for the visualization and quantification of H2O2 dynamics, such as the propagation of a wave from a wound site [35] [38].
Genetically Encoded Sensor for Subcellular H2O2 Imaging
For unparalleled spatial resolution at the subcellular level, genetically encoded H2O2 indicators (GEHIs) represent the state-of-the-art in optical sensing.
- Sensor Design: The far-red sensor oROS-HT635 was engineered by coupling the bacterial H2O2-sensing domain of OxyR to a HaloTag protein. When expressed in cells, the HaloTag covalently binds to a cell-permeable Janelia Fluor (JF) dye, such as JF635, which serves as the fluorescent reporter [21].
- Plant Transformation and Expression: The gene encoding the GEHI is introduced into the plant genome, often under a tissue-specific or inducible promoter. Stable transgenic lines are generated. The HaloTag ligand JF635 is applied to the plant tissue, where it is taken up and labels the expressed sensor [21].
- Confocal Microscopy and Multiparametric Imaging: Tissues are imaged using a confocal laser scanning microscope, with excitation at 635 nm and emission detection around 650 nm. An increase in H2O2 causes a conformational change in the OxyR domain, leading to a decrease in fluorescence (inverse response). This sensor enables the mapping of inter- and intracellular H2O2 diffusion and can be used in combination with green fluorescent sensors (e.g., for Ca2+) for multiparametric analysis [21].
Signaling Pathways in Plant Stress Responses
H2O2 is embedded in a complex signaling network that integrates multiple components to coordinate plant defense. The following diagram illustrates the key pathways involved in response to pathogens and abiotic stress.
Figure 1: H2O2 in plant stress signaling pathways.
The pathway initiates with the perception of stress (biotic or abiotic), which triggers an immediate influx of calcium ions (Ca2+) into the cytosol. This Ca2+ signal activates the membrane-associated NADPH oxidase (specifically, RbohD), which catalyzes the production of superoxide (O2·-) in the apoplast [38] [36]. Superoxide is rapidly converted to H2O2 by superoxide dismutase (SOD). The resulting H2O2 acts as a central signaling molecule, propagating both local and systemic signals. It directly influences the expression of defense-related genes and interacts with other signaling components, such as nitric oxide (NO) [36]. Glutamate-receptor-like channels (GLR3.3 and GLR3.6) are critical for the propagation of the Ca2+ signal and the subsequent H2O2 wave, forming a positive feedback loop that amplifies the signal throughout the plant [38]. Finally, the H2O2 signal is modulated by antioxidant systems like catalase (CAT) and ascorbate peroxidase (APX) to maintain cellular redox homeostasis [36].
The Scientist's Toolkit: Essential Research Reagents and Materials
Successful experimentation in this field relies on a suite of specialized materials and reagents. The following table catalogues key solutions employed in the featured case studies.
Table 2: Key research reagents and materials for H2O2 sensor development and application
| Item Name | Function/Application | Relevant Study |
|---|---|---|
| Multi-Walled Carbon Nanotubes (MWCNTs) | Electrode nanomaterial; enhances electron transfer and surface area for H2O2 electro-reduction. [37] [5] | Electrochemical Sensor [5] |
| Cholesterol Oxidase (ChOx) | Flavin-enzyme used for enzymatic recognition and catalytic reduction of H2O2 on electrode surfaces. [5] | Electrochemical Sensor [5] |
| Ag@ZIF-67 Nanoparticles | Fluorescence quenching core; ZIF-67 provides a high surface area matrix, while Ag nanoparticles quench fluorescence until H2O2-induced corrosion. [35] | Optical Nanosensor [35] |
| Pacific Blue Fluorophore | Fluorescent reporter dye whose signal is restored ("turned on") upon release from quenching Ag nanoparticles by H2O2. [35] | Optical Nanosensor [35] |
| oROS-HT635 Genetic Construct | Genetically encoded indicator; combines OxyR H2O2-sensing domain with HaloTag for labeling with JF635 dye, enabling far-red imaging. [21] | GEHI Sensor [21] |
| Janelia Fluor (JF) Dyes (e.g., JF635) | Bright, photostable, cell-permeable rhodamine dyes used to label HaloTag-based sensors for live-cell imaging. [21] | GEHI Sensor [21] |
| Zymosan | A stimulant agent used to trigger respiratory bursts and H2O2 generation in cells for experimental studies. [4] | Cell Stimulation [4] |
Both electrochemical and optical sensing platforms offer distinct and powerful capabilities for probing H2O2 signaling in crops. The choice between them is not a matter of superiority but of strategic alignment with research objectives. Electrochemical sensors are unparalleled for portable, cost-effective, and continuous monitoring of bulk H2O2 fluctuations over extended periods, ideal for field phenotyping and time-course studies. Conversely, optical nanosensors and GEHIs provide unmatched spatial resolution and the ability to visualize the intricate dynamics of H2O2 waves and gradients at subcellular levels, making them the tools of choice for dissecting fundamental signaling mechanisms. Future progress will likely hinge on the development of more robust, miniaturized, and multiplexed sensors, potentially through the fusion of concepts from both paradigms, ultimately providing plant scientists with an ever more refined toolkit to understand and enhance crop resilience.
Overcoming Practical Challenges: Sensor Limitations and Optimization Strategies
Addressing Biofouling and Matrix Interference in Complex Plant Tissues
The accurate detection of hydrogen peroxide (H₂O₂) in plant tissues represents a critical challenge for researchers studying plant stress responses, signaling pathways, and physiological adaptations. As an important reactive oxygen species (ROS) and signaling molecule, H₂O₂ concentration changes provide valuable insights into plant health and adaptive mechanisms, especially under rapidly changing climate conditions [40]. However, two significant obstacles complicate reliable H₂O₂ measurement: biofouling—the unwanted adhesion and growth of microorganisms on sensor surfaces—and matrix interference—where complex plant tissue components obstruct accurate detection.
Biofouling poses a particularly persistent problem for long-term monitoring applications. The colonization of sensor surfaces by microorganisms compromises measurement accuracy, increases maintenance requirements, and ultimately shortens sensor operational lifespans [41]. This phenomenon is especially prevalent in marine and aquatic environments, but similarly affects terrestrial plant monitoring where moisture and nutrients facilitate microbial growth. Simultaneously, the complex chemical composition of plant tissues introduces substantial matrix effects that can interfere with sensor readings through competing reactions, sensor surface passivation, or generation of false signals.
This comparison guide objectively evaluates two principal sensing methodologies—electrochemical and optical approaches—for detecting H₂O₂ in plant systems, with particular emphasis on their respective vulnerabilities and solutions to biofouling and matrix interference. We present experimental data comparing performance metrics and provide detailed protocols for implementing the most promising biofouling resistance strategies.
Technical Comparison: Electrochemical vs. Optical H₂O₂ Sensors
The operating principles, advantages, and limitations of electrochemical and optical sensors differ substantially, leading to distinct performance characteristics in plant research applications.
Electrochemical sensors operate on fuel cell or electrocatalytic principles where chemical energy from H₂O₂ converts directly into electrical signals without external power requirements. Recent innovations include self-powered electrochemical sensors (SPESs) based on hydrogen peroxide fuel cells (HPFCs), where H₂O₂ serves as both oxidant and reductant in a one-compartment cell [28]. These systems utilize biomimetic catalysts and nanozymes to overcome the cost, stability, and electron transfer limitations of enzyme-based detection. For plant research, this enables in-field deployment without sophisticated instrumentation.
Optical sensing platforms employ alternative detection mechanisms, typically based on colorimetric, fluorescent, or chemiluminescent responses to H₂O₂ presence. The recently developed hydrogel microneedle patch represents an innovative optical approach for plant H₂O₂ monitoring, utilizing poly (methyl vinyl ether-alt-maleic acid) crosslinked with polyethylene glycol to extract leaf sap for analysis [40]. This minimally invasive technique facilitates rapid in-field detection by combining extraction and detection in a single platform.
Table 1: Performance Comparison of H₂O₂ Sensing Technologies for Plant Applications
| Parameter | Electrochemical Sensors | Optical Sensors |
|---|---|---|
| Detection Principle | Electrocatalytic oxidation/reduction of H₂O₂ | Optical property changes (absorbance, fluorescence) |
| Sensitivity | High (nM-μM range) [6] | Variable (dependent on probe chemistry) |
| Selectivity against Matrix Interference | Moderate to High (with selective catalysts) | Low to Moderate (subject to optical interference) |
| Biofouling Resistance | Built-in H₂O₂ generation [42] | Surface modifications & material selection |
| Measurement Duration | Long-term monitoring capable | Typically short-term or endpoint |
| Tissue Damage | Minimal with microelectrodes | Minimal with microneedle patches [40] |
| Implementation Complexity | Simple readout; complex fabrication | Simplified fabrication; may require imaging |
| Suited for Field Deployment | Excellent (self-powered options) [28] | Good (visual readout possible) |
Biofouling Resistance Strategies for Plant Sensors
Biofouling presents a multi-faceted challenge for H₂O₂ sensors deployed in plant environments, where high humidity and nutrient availability promote microbial growth. The following section examines proven antifouling strategies adapted from marine and biomedical applications for plant science use.
Electrochemical Biofouling Control
ANB Sensors has developed an innovative approach wherein the sensor itself generates low concentrations of hydrogen peroxide at its surface, effectively inhibiting bacterial biofilm formation. This method has demonstrated exceptional biofouling resistance during six-week deployments in marine environments, with the sensing element remaining completely free of biofouling despite extensive growth on adjacent housing surfaces [42]. Control experiments confirmed that sensors in sleep mode (not generating H₂O₂) rapidly accumulated surface biofilms, validating the approach's efficacy.
The mechanism relies on localized H₂O₂ generation at concentrations sufficient to inhibit microbial attachment but low enough to rapidly dilute to environmentally safe levels. This strategy provides broad-spectrum protection against bacteria, including strains resistant to chlorine-based treatments, without introducing chemicals that might alter local pH or interfere with measurements [42].
Material Science Solutions
Surface modifications and material selection offer complementary approaches to biofouling mitigation:
- Non-toxic anti-adhesion coatings: Silicon or polymer-based coatings with low surface energy prevent microorganism attachment through physical rather than chemical means [41].
- Polydopamine coatings: These modifications significantly improve surface hydrophilicity, reducing water contact angles from 110° to 67° on polypropylene membranes and thereby reducing biofouling adhesion [43].
- Zwitterionic chemical modifications: These create surface structures that resist protein adsorption and subsequent biofilm formation [43].
- Nanomaterial enhancements: Incorporation of SiO₂, TiO₂, or ZnO nanoparticles into polymer matrices enhances antibacterial activity while maintaining membrane performance [43].
Table 2: Biofouling Resistance Strategies for H₂O₂ Plant Sensors
| Strategy | Mechanism | Implementation | Effectiveness |
|---|---|---|---|
| H₂O₂ Generation [42] | Localized production inhibits biofilm formation | Built into sensor operation | Excellent (6+ weeks protection) |
| Metal Ion Release [41] | Copper ions interfere with cellular division | Coatings or ablative paints | Moderate (ineffective against some algae) |
| Surface Energy Modification [43] | Low surface energy prevents attachment | Silicon/polymer coatings | Good (requires specific surface properties) |
| Hydrophilicity Enhancement [43] | Reduced adhesion to hydrophilic surfaces | Polydopamine coatings | Good (67° contact angle demonstrated) |
| Nanoparticle Additives [43] | Antimicrobial activity | SiO₂, TiO₂, ZnO in polymers | Good (broad-spectrum protection) |
| Electro-chlorination [42] | Hypochlorite generation from seawater | Electrolysis of saltwater | Excellent (but unsuitable for plant tissues) |
Experimental Protocol: Validating Biofouling Resistance
For researchers developing plant-deployable H₂O₂ sensors, the following protocol provides a standardized approach to evaluate biofouling resistance:
- Sensor Preparation: Divide sensors into test and control groups. Configure test sensors for continuous or periodic antifouling operation (e.g., H₂O₂ generation), while control sensors remain in passive state.
- Deployment Setup: Deploy sensors in representative plant environments (e.g., greenhouse, growth chamber, or field conditions) with high biofouling potential.
- Environmental Monitoring: Record temperature, humidity, and microbial load throughout the trial period.
- Performance Assessment: Measure sensor response to standardized H₂O₂ solutions at regular intervals (e.g., daily or weekly) to track signal drift.
- Surface Analysis: Document biofilm accumulation on sensor surfaces using microscopy techniques at experiment conclusion.
- Data Analysis: Correlate biofouling extent with measurement accuracy degradation to establish operational lifespan.
This protocol adapts validation approaches successfully used in marine environments [42] for plant science applications.
Mitigating Matrix Interference in Complex Plant Tissues
The complex chemical composition of plant tissues presents significant challenges for selective H₂O₂ detection. Secondary metabolites, enzymes, and other redox-active compounds can interfere with both electrochemical and optical detection methods.
Electrochemical Approaches to Matrix Interference
Advanced electrode materials and sensor designs have demonstrated improved selectivity in complex matrices:
- Enzymeless detection using NiO octahedron decorated 3D graphene hydrogel: This nanocomposite electrode achieves high sensitivity (117.26 µA mM⁻¹ cm⁻²) with wide linear range (10 µM–33.58 mM) and excellent selectivity against common interferents like dopamine, uric acid, and ascorbic acid [6]. The material's success stems from synergistic effects between the NiO octahedrons' catalytic properties and the 3D graphene's high surface area and conductivity.
- Self-powered sensors with selective catalysts: SPESs utilizing biomimetic catalysts or nanozymes can be engineered for specific H₂O₂ detection while ignoring competing redox species [28].
- Prussian blue and transition metal complexes: These catalysts offer high selectivity for H₂O₂ reduction while minimizing interference from other electroactive compounds present in plant tissues [28].
Optical Approaches to Matrix Interference
- Hydrogel microneedle patches: The PMVE/MA hydrogel microneedle patch enables direct extraction and analysis of leaf sap, potentially reducing interference from solid tissue components [40]. The extraction mechanism selectively accumulates H₂O₂ while excluding larger biomolecules that might interfere with detection.
- Chromogenic and fluorogenic probes: Specific molecular probes that react selectively with H₂O₂ over other ROS can be incorporated into hydrogel matrices, though these may still suffer from interference from pigmented plant compounds.
Experimental Protocol: Assessing Matrix Interference
To quantitatively evaluate matrix interference in plant H₂O₂ sensors, researchers should implement the following protocol:
- Sample Preparation: Prepare plant tissue homogenates from the target species using standard extraction buffers.
- Spiked Recovery Experiments: Fortify samples with known H₂O₂ concentrations across the expected physiological range (typically 1-100 µM).
- Interference Challenge: Add potential interfering compounds at physiological concentrations (e.g., ascorbic acid, glutathione, phenolic compounds).
- Comparative Analysis: Measure H₂O₂ recovery rates using both the candidate sensor and a validated reference method (e.g., spectrophotometric assay).
- Statistical Evaluation: Calculate recovery percentages, detection limits, and correlation coefficients relative to reference methods.
This systematic approach enables objective comparison of sensor performance across different plant species and tissue types with varying chemical compositions.
Implementation Guide: Sensor Selection Framework
Choosing the optimal H₂O₂ detection platform requires careful consideration of research objectives, environmental conditions, and analytical requirements. The following decision framework supports appropriate sensor selection:
Sensor Selection Decision Framework
Research Reagent Solutions
Table 3: Essential Materials for H₂O₂ Sensor Implementation in Plant Research
| Material/Category | Function | Example Applications |
|---|---|---|
| 3D Graphene Hydrogel [6] | High-surface-area electrode substrate | Enzymeless H₂O₂ detection in complex matrices |
| Nickel Oxide (NiO) Octahedrons [6] | Electrocatalytic H₂O₂ oxidation | Selective detection against interferents |
| PMVE/MA Hydrogel [40] | Microneedle matrix for sap extraction | Minimally invasive plant H₂O₂ sampling |
| Polydopamine Coating [43] | Surface hydrophilization | Biofouling resistance for sensor housings |
| Zwitterionic Polymers [43] | Anti-adhesion surface modification | Reducing microbial attachment on sensors |
| Prussian Blue & Analogs [28] | Selective H₂O₂ electrocatalysis | Self-powered sensor development |
| TiO₂/ZnO Nanoparticles [43] | Antimicrobial additives | Polymer composite coatings for fouling resistance |
The advancing capabilities of both electrochemical and optical H₂O₂ sensors offer plant researchers increasingly sophisticated tools for monitoring oxidative stress and signaling processes. Electrochemical platforms, particularly those with self-powering capability and integrated biofouling resistance, provide robust solutions for long-term monitoring applications in challenging environments. Optical approaches using microneedle extraction technologies offer minimally invasive alternatives with simplified readout capabilities for shorter-term studies.
Biofouling and matrix interference remain significant challenges, but material science innovations and clever sensor designs are progressively overcoming these limitations. The ongoing development of nanozymes and biomimetic catalysts promises further improvements in selectivity and stability, while multifunctional materials that combine sensing and antifouling properties will extend deployment durations in field applications.
Researchers should select sensing platforms based on their specific deployment duration, environmental conditions, and tissue complexity requirements, using the frameworks provided in this guide to inform their technology selection. As both approaches continue to evolve, the integration of electrochemical and optical principles into hybrid sensors may ultimately provide the optimal solution for addressing the dual challenges of biofouling and matrix interference in plant tissue research.
Enhancing Sensor Stability and Reusability for Long-Term Monitoring
In the study of plant physiology, hydrogen peroxide (H2O2) has emerged as a crucial signaling molecule involved in a plant's response to various environmental stresses, including pathogen attack, high light intensity, heat, and drought [40] [44]. The ability to monitor H2O2 dynamics accurately over extended periods is essential for understanding plant stress signaling pathways and developing early warning systems for crop management [44] [39]. However, a significant challenge in this field lies in developing sensing systems that maintain high stability and reusability for long-term monitoring applications without compromising sensitivity or selectivity.
This comparison guide objectively evaluates the performance of two predominant sensor technologies—electrochemical and optical sensors—for monitoring H2O2 in plant research environments. We focus specifically on their stability, reusability, and practical implementation for continuous monitoring, supported by experimental data from recent studies. For researchers, scientists, and drug development professionals working in agricultural biotechnology and plant sciences, understanding these trade-offs is crucial for selecting appropriate sensing platforms for specific applications, from fundamental plant stress research to precision agriculture implementations.
Performance Comparison: Electrochemical vs. Optical H2O2 Sensors
Table 1: Comprehensive Performance Comparison of Electrochemical and Optical H2O2 Sensors
| Performance Parameter | Electrochemical Sensors | Optical Sensors |
|---|---|---|
| Long-term Stability | 60 days with <10% sensitivity loss [27]; 21 days with proper storage at 4°C [45] | Limited data, but implantable systems demonstrated for continuous monitoring in plants [39] |
| Reusability | Good, with minimal fouling when using fast scanning techniques like LSV [45] | Limited; typically single-use due to irreversible colorimetric reactions or photobleaching |
| Sensitivity | LOD: 0.15 μM (Pt-Ni hydrogel) [27]; 5.3 μM (3DGH/NiO) [6] | LOD: 0.030 μM (colorimetric Pt-Ni hydrogel) [27] |
| Linear Range | 0.50 μM–5.0 mM (Pt-Ni hydrogel) [27]; 10 μM–33.58 mM (3DGH/NiO) [6] | 0.10 μM–10.0 mM (Pt-Ni hydrogel) [27] |
| Response Time | <60 seconds [45] | Within 3 minutes for colorimetric response [27] |
| Measurement Environment | Suitable for complex media with strategies to reduce fouling [45] | Affected by sample turbidity; requires transparent media |
| Miniaturization Potential | High; compatible with microelectrodes and portable systems [27] | Moderate; requires optical components |
| Implantability in Plants | Challenging due to wired connections | Promising; carbon nanotube-based sensors implanted in leaves [44] |
Table 2: Stability-Enhancing Strategies for H2O2 Sensors
| Strategy | Electrochemical Sensors | Optical Sensors |
|---|---|---|
| Material Design | 3D graphene hydrogel/NiO octahedrons nanocomposites [6] | Carbon nanotubes wrapped in polymers [44] |
| Storage Conditions | Stored at 4°C maintains performance for 21 days [45] | Information limited in search results |
| Operation Technique | LSV reduces fouling compared to chronoamperometry in complex media [45] | N/A |
| Power Management | External power required | Self-powered systems using photovoltaic modules [39] |
| Fouling Mitigation | Medium dilution or fast scanning techniques [45] | N/A |
Experimental Protocols for Assessing Sensor Stability and Reusability
Electrochemical Sensor Stability Assessment Protocol
The evaluation of electrochemical sensor stability typically involves accelerated aging tests and continuous operation measurements. For instance, in developing enzymeless H2O2 biosensors using NiO octahedron-decorated 3D graphene hydrogel (3DGH/NiO), researchers employed comprehensive characterization including cyclic voltammetry and chronoamperometry tests to assess stability [6]. The experimental workflow follows these key stages:
Sensor Fabrication: Synthesize NiO octahedrons using mesoporous silica SBA-15 as a hard template, then self-assemble with 3D graphene hydrogel via hydrothermal method at 180°C for 12 hours [6].
Electrode Preparation: Prepare working electrodes by depositing the 3DGH/NiO nanocomposite onto substrate electrodes, with composition optimized at 25% NiO content for best performance [6].
Performance Benchmarking: Characterize initial sensor performance in phosphate buffer solution (PBS, 0.1 M, pH 7.4) using standardized H2O2 solutions to establish baseline sensitivity, linear range, and detection limit [6].
Stability Testing: Subject sensors to extended operation in relevant media (e.g., cell culture media or plant extracts) with periodic measurements of standard H2O2 solutions to quantify sensitivity degradation over time [45].
Reusability Assessment: Evaluate sensor-to-sensor reproducibility and individual sensor performance across multiple measurement cycles with intermediate cleaning steps [27].
For sensors used in biological media such as cell culture environments, researchers have implemented additional strategies to enhance stability. These include using fast scanning techniques like linear scan voltammetry (LSV) instead of chronoamperometry to reduce electrode fouling, and optimizing storage conditions (4°C in PBS) to maintain sensor performance for up to 21 days [45].
Optical Sensor Stability Assessment Protocol
Optical H2O2 sensors, particularly those based on colorimetric and carbon nanotube technologies, require different stability assessment approaches:
Sensor Fabrication: For colorimetric sensors, prepare Pt-Ni hydrogels via coreduction of mixed metal salt solutions by sodium borohydride, creating alloyed nanowire networks with Ni(OH)2 nanosheets [27]. For implantable plant sensors, synthesize carbon nanotubes wrapped in polymers tailored to detect specific molecules [44].
Initial Activity Measurement: Characterize peroxidase-like activity through TMB-induced chromogenic reactions monitored via UV-vis absorption spectra at 652 nm [27].
Accelerated Aging: Subject sensors to repeated measurement cycles or continuous operation in target environments, such as implanted in plant leaves for extended periods [44] [39].
Signal Stability Assessment: Monitor fluorescence intensity or colorimetric response consistency when exposed to standardized H2O2 concentrations over time [44] [27].
A key advancement in optical sensor stability for plant applications is the development of self-powered systems that integrate photovoltaic modules to harvest sunlight or artificial light from the planting environment, enabling continuous operation of implantable microsensors [39].
Signaling Pathways and Experimental Workflows in Plant H2O2 Monitoring
Plant H2O2 Signaling Pathway
Experimental Workflow for Sensor Deployment
Research Reagent Solutions for H2O2 Sensing Studies
Table 3: Essential Research Reagents for H2O2 Sensor Development and Testing
| Reagent/Material | Function/Application | Examples from Literature |
|---|---|---|
| Graphene Oxide/Reduced Graphene Oxide | Enhances electron transfer, provides high surface area support for catalytic materials | Reduced graphene oxide with gold nanoparticles for electrochemical sensing [45]; 3D graphene hydrogel with NiO octahedrons [6] |
| Transition Metal Oxides (NiO, etc.) | Catalyze H2O2 decomposition, enable enzymeless detection | NiO octahedrons for non-enzymatic H2O2 detection [6] |
| Noble Metal Nanomaterials (Pt, Au) | Provide catalytic activity for H2O2 oxidation/reduction | Pt-Ni hydrogels with peroxidase-like activity [27]; Gold nanoparticles with rGO [45] |
| Carbon Nanotubes | Fluorescence quenching, molecular recognition elements in optical sensors | Polymer-wrapped carbon nanotubes for implantable plant sensors [44] |
| TMB (3,3',5,5'-Tetramethylbenzidine) | Chromogenic substrate for peroxidase-like activity detection | Used to test peroxidase-like activity of Pt-Ni hydrogels [27] |
| Polymer Matrices | Provide structural support, enable functionalization, enhance biocompatibility | Polymers for wrapping carbon nanotubes in optical sensors [44]; PMVE/MA hydrogel for microneedle patches [40] |
| Cell Culture Media | Simulate physiological environment for sensor testing | RPMI, MEM, DMEM used to test sensor performance in biologically relevant conditions [45] |
The comparative analysis of electrochemical and optical H2O2 sensors reveals distinct advantages for each technology in the context of long-term monitoring applications in plant research. Electrochemical sensors, particularly those utilizing novel nanocomposites like 3DGH/NiO and Pt-Ni hydrogels, demonstrate superior reusability and long-term stability, with some systems maintaining performance for up to 60 days [6] [27]. The ability to implement fast scanning techniques such as LSV further enhances their practicality in complex media by reducing fouling effects [45].
Optical sensors, while generally less reusable due to their typically irreversible colorimetric reactions or susceptibility to photobleaching, offer superior implantability for plant systems and can achieve higher sensitivity in certain configurations [44] [27]. The recent development of self-powered optical sensing systems that harvest energy from the planting environment represents a significant advancement toward truly autonomous long-term monitoring platforms [39].
Future research directions should focus on bridging the gap between these technologies, potentially through the development of hybrid systems that combine the implantability and sensitivity of optical sensors with the reusability and stability of electrochemical platforms. Additionally, more comprehensive long-term stability studies under real-world conditions are needed, particularly for optical sensors where such data is currently limited in the literature. For researchers selecting sensing platforms, the decision should be guided by specific application requirements: electrochemical systems for reusable, long-term monitoring in accessible environments, and optical systems for minimally invasive, implantable applications where single-use operation is acceptable.
Hydrogen peroxide (H₂O₂) serves as a crucial stress signaling molecule in plants, functioning as a key distress signal that activates defense mechanisms in response to pests, drought, extreme temperatures, and infections [46]. The early detection of this chemical clue is vital for optimizing plant care, preventing extensive damage, and maximizing crop yields, even under challenging environmental conditions [46]. The accurate monitoring of H₂O₂ dynamics in plants relies increasingly on sophisticated sensing platforms that leverage recent advances in nanotechnology and materials science. Among the most promising developments are electrochemical and optical sensors incorporating nanozymes (nanoparticles with enzyme-mimicking activities), biomimetic materials, and advanced nanocomposites [47] [48]. These material innovations have substantially enhanced the sensitivity, selectivity, and practicality of H₂O₂ detection in complex plant environments. This guide provides a comprehensive comparison of electrochemical versus optical H₂O₂ sensors, with a specific focus on their underlying material innovations, operational performance, and practical applications within plant science research.
Performance Comparison: Electrochemical vs. Optical H₂O₂ Sensors
The quantitative performance of H₂O₂ sensors varies significantly based on their transduction mechanism and the specific materials employed in their construction. The following tables summarize key performance metrics for both electrochemical and optical sensor types, providing researchers with directly comparable data.
Table 1: Performance Metrics of Electrochemical H₂O₂ Sensors
| Sensor Material/Design | Detection Principle | Linear Range | Sensitivity | Limit of Detection (LOD) | Reference |
|---|---|---|---|---|---|
| Plant Wearable Patch (MWCNT/Enzyme) [46] | Amperometry | Not Specified | Not Specified | Significantly lower than previous plant sensors | |
| PMWCNT/ChOx Bioplatform [5] | Amperometry | 0.4 to 4.0 mM | 26.15 µA/mM | 0.43 µM | |
| Ag-doped CeO₂/Ag₂O Nanocomposite [7] | Amperometry | 1×10⁻⁸ to 0.5×10⁻³ M | 2.728 µA cm⁻² µM⁻¹ | 6.34 µM | |
| Green-Synthesized Ag Nanoparticles [9] | Electrochemical | Not Specified | Not Specified | Not Specified |
Table 2: Performance Metrics of Optical H₂O₂ Sensors
| Sensor Material/Design | Detection Principle | Linear Range | Sensitivity | Limit of Detection (LOD) | Reference |
|---|---|---|---|---|---|
| Nanosensors with Thermal Signatures [49] | Machine-Learnable Thermal Signatures | Not Specified | Not Specified | Not Specified | |
| Nanozyme-based SERS Platform [48] | Surface-Enhanced Raman Spectroscopy (SERS) | Not Specified | High (Single-Molecule Level) | Exceptionally Low | |
| Fluorescent Aptasensor with GO [50] | Fluorescence (FRET) | 0.5–20 ng/mL | Not Specified | 0.15 ng/mL |
Table 3: Comparative Analysis of Sensor Class Characteristics
| Characteristic | Electrochemical Sensors | Optical Sensors |
|---|---|---|
| Key Material Innovations | Nanocomposites (e.g., Ag-CeO₂/Ag₂O), Green-synthesized Nanoparticles, CNT-based Pastes [7] [9] [5] | Nanozymes, Graphene Oxide (GO), Quantum Dots, SERS-active substrates [48] [50] [47] |
| Typical Response Time | Fast (e.g., under 1 minute for plant patch) [46] | Varies (can be rapid, but may involve multiple steps) [50] |
| Selectivity | Excellent (with specific enzymes/bioreceptors) [5] | High (with aptamers or molecular fingerprints) [50] [48] |
| Suitability for In-Planta Sensing | High (miniaturized, wearable patches demonstrated) [46] | Moderate to High (can be challenged by chlorophyll interference) [46] |
| Cost & Operational Complexity | Low cost, simple instrumentation [46] [7] | Can be higher (e.g., SERS requires specialized equipment) [48] |
Experimental Protocols for Key Sensor Types
Electrochemical Sensor: Plant Wearable Patch
This protocol is adapted from the development of a microneedle-based patch for direct, real-time H₂O₂ monitoring in live plants [46].
1. Sensor Fabrication:
- Microneedle Array Preparation: Create an array of microscopic plastic needles on a flexible polymer base using standard microfabrication techniques (e.g., photolithography and soft lithography).
- Hydrogel Formulation: Prepare a chitosan-based hydrogel mixture. Incorporate the enzyme horseradish peroxidase (HRP) and reduced graphene oxide (rGO) into the hydrogel to confer electrocatalytic activity and conductivity.
- Sensor Assembly: Coat the microneedle array with the functionalized hydrogel. The hydrogel serves as the sensing interface that reacts with H₂O₂ and facilitates electron transfer.
2. Measurement Procedure:
- Patch Application: Gently attach the patch to the underside of a live plant leaf, ensuring the microneedles penetrate the leaf surface to access the apoplastic fluid containing H₂O₂.
- Electrochemical Measurement: Connect the patch to a portable potentiostat. Apply a constant potential and use amperometry to measure the resulting electrical current, which is directly proportional to the local H₂O₂ concentration.
- Data Acquisition: Record the stable current signal, typically within one minute of application. The current level is correlated with H₂O₂ concentration through a pre-established calibration curve.
3. Validation:
- Validate the sensor readings against standard laboratory methods, such as colorimetric or fluorometric assays performed on extracted leaf sap, to confirm accuracy [46].
Optical Sensor: Fluorescent Aptasensor with Graphene Oxide
This protocol is based on a "signal-on" fluorescent biosensor for sensitive detection, leveraging graphene oxide (GO) and an H₂O₂-specific aptamer [50].
1. Sensor Preparation:
- Aptamer Labeling: Chemically modify a single-stranded DNA aptamer, selected for H₂O₂ binding, with the fluorophore carboxy-X-rhodamine (ROX).
- GO Solution Preparation: Disperse graphene oxide nanosheets in an appropriate aqueous buffer to form a stable suspension.
2. Assay Execution:
- Initial Quenching: Mix the ROX-labeled aptamer with the GO solution. The π–π stacking interaction will cause the aptamer to adsorb onto the GO surface, quenching the ROX fluorescence.
- Sample Introduction: Introduce the plant extract or standard H₂O₂ solution to the mixture.
- Target Binding and Signal Generation: As H₂O₂ binds to its aptamer, the biorecognition element undergoes a conformational change. This change separates the ROX fluorophore from the GO surface, restoring fluorescence.
- Signal Amplification (Optional): To enhance sensitivity, add nucleases to the mixture. The enzyme will digest the aptamer-H₂O₂ complex, releasing H₂O₂ to bind another aptamer and initiating a cyclic amplification process.
3. Data Collection:
- Use a fluorometer to measure the fluorescence intensity at the appropriate excitation/emission wavelengths for ROX.
- Construct a calibration curve by plotting fluorescence intensity against the concentration of H₂O₂ standards to quantify the target in unknown samples.
The Scientist's Toolkit: Essential Research Reagents and Materials
Table 4: Key Reagents and Materials for H₂O₂ Sensor Development and Application
| Reagent/Material | Function and Role in Research | Example Application |
|---|---|---|
| Multi-Walled Carbon Nanotubes (MWCNTs) | Provide a high-surface-area, conductive matrix for electron transfer in electrochemical sensors. | Used in paste electrodes for enzymatic H₂O₂ detection [5]. |
| Nanozymes (e.g., Fe₃O₄ NPs, Bi₀.₃Fe₁.₇MoO₆) | Stable, low-cost alternatives to natural enzymes that mimic peroxidase or oxidase activity, catalyzing colorimetric or chemiluminescent reactions. | Used as catalytic labels in optical and electrochemical assays for H₂O₂ and antioxidants [47] [48]. |
| Cholesterol Oxidase (ChOx) | An oxidoreductase enzyme used as a biorecognition element; its interaction with H₂O₂ can be measured electrochemically. | Immobilized on MWCNT paste to create a highly sensitive H₂O₂ bioplatform [5]. |
| Silver Nanoparticles (Ag NPs) | Offer excellent electrocatalytic properties for H₂O₂ reduction. Can be synthesized via green chemistry principles. | Used in nanocomposites (e.g., with CeO₂) for non-enzymatic electrochemical sensing [7] [9]. |
| Graphene Oxide (GO) | A 2D nanomaterial with exceptional quenching efficiency for fluorophores, used in FRET-based optical sensors. | Serves as a platform for fluorescent aptasensors, where target binding restores fluorescence [50]. |
| Specific Aptamers | Single-stranded DNA/RNA molecules that bind to targets (e.g., H₂O₂) with high specificity, serving as synthetic bioreceptors. | Function as the recognition element in optical and electrochemical aptasensors [50]. |
| Cerium Oxide (CeO₂) Nanostructures | Possess redox activity (Ce³⁺/Ce⁴⁺ switch) and oxygen vacancies, making them catalytic for H₂O₂ detection. | Used as a base material, often doped with metals like silver, to form nanocomposite sensors [7]. |
| Chitosan-based Hydrogel | A biocompatible polymer that forms a 3D network for immobilizing enzymes/nanomaterials and can adhere to plant tissues. | Forms the core sensing layer in wearable plant patches [46]. |
Operational Workflow and Signaling Pathways in Plant H₂O₂ Sensors
The following diagrams illustrate the fundamental operational principles of the two primary sensor classes used in plant H₂O₂ detection.
Optical Aptasensor Workflow
Electrochemical Sensing Pathway
The choice between electrochemical and optical sensing platforms for detecting H₂O₂ in plant research is multifaceted, hinging on the specific requirements of the study. Electrochemical sensors, particularly those leveraging novel nanocomposites and wearable formats, offer compelling advantages for in-situ, real-time monitoring due to their rapid response, miniaturization potential, and lower operational complexity [46] [7]. In contrast, optical sensors, empowered by nanozymes and advanced materials like GO, frequently provide superior sensitivity and the benefit of molecular fingerprinting, making them exceptionally powerful for highly sensitive, multiplexed detection in laboratory settings [48] [50]. The ongoing material innovations in both fields—such as the development of more stable and specific nanozymes, greener synthesized nanoparticles, and multifunctional nanocomposites—continue to push the boundaries of performance. For researchers, the optimal path forward may lie in the strategic integration of both technologies, leveraging the strengths of each to create robust, multi-modal sensing systems that provide a more comprehensive understanding of plant stress signaling and physiology.
Strategies for Minimizing Chlorophyll Interference in Optical Sensing
The accurate detection of hydrogen peroxide (H2O2) in plant tissues is crucial for understanding oxidative stress signaling, plant immune responses, and physiological adaptations [38]. However, the presence of chlorophyll—a highly efficient light-absorbing pigment—poses significant challenges for optical sensing technologies. Chlorophyll's strong absorption in the blue and red regions of the spectrum, coupled with its fluorescence emission in the red to far-red region, directly interferes with the optical signals of many H2O2 sensors [51]. This interference is particularly problematic when monitoring H2O2 signaling waves induced by wounding or pathogen attack, as these biological events occur in chlorophyll-rich tissues [38]. Researchers have developed multiple strategies to overcome this limitation, leading to ongoing innovation in both optical and electrochemical sensing approaches. This review systematically compares these strategies, providing experimental protocols and performance data to guide sensor selection for plant research applications.
Fundamental Interference Mechanisms
Optical Properties of Chlorophyll
Chlorophyll molecules exhibit distinct spectral properties that create specific interference patterns with optical sensors:
- Absorption Peaks: Strong absorption maxima at approximately 430 nm (blue region) and 662 nm (red region) [51]
- Fluorescence Emission: Peak emission between 650-700 nm when excited by blue light [51]
- Spatial Distribution: Heterogeneous distribution within plant tissues, creating variable background signals
Interference with Optical H2O2 Sensors
The fundamental conflict arises from the overlapping spectral ranges between chlorophyll properties and the operational wavelengths of many optical H2O2 sensors. Fluorescence-based sensors, particularly those using blue excitation wavelengths, experience significant signal contamination from chlorophyll autofluorescence [51] [38]. This overlap leads to increased background noise, reduced signal-to-noise ratios, and potentially false-positive readings in plant tissues. The interference is most pronounced in sensors utilizing:
- Fluorescence quenching/activation mechanisms in the 400-500 nm range [51]
- FRET-based sensors with emission spectra overlapping chlorophyll fluorescence [51]
- Broad-spectrum optical sensors without precise wavelength discrimination
Comparative Sensor Technologies
Optical Sensing Approaches with Chlorophyll Compensation
Advanced Nanosensors
Recent developments in optical nanosensors have specifically addressed the chlorophyll interference problem in plant research. These sensors employ several strategic approaches:
Spectral Shifting: Nanosensors engineered to operate in spectral windows with minimal chlorophyll absorption, particularly in the green and near-infrared regions (500-600 nm), where chlorophyll absorption is reduced [38]. These sensors utilize fluorophores with excitation and emission profiles specifically designed to avoid the chlorophyll absorption peaks at 430 nm and 662 nm.
Ratiometric Measurements: Dual-wavelength detection systems that measure both the sensor signal and the chlorophyll background, allowing for mathematical correction of interference [51]. This approach uses reference channels that monitor chlorophyll autofluorescence independently from the H2O2-sensitive signal, enabling real-time background subtraction.
Time-Resolved Fluorescence: Sensors exploiting differences in fluorescence lifetime between synthetic fluorophores and natural chlorophyll [51]. While chlorophyll exhibits a fluorescence lifetime of approximately 0.5-1.5 nanoseconds, engineered nanosensors can be designed with significantly longer lifetimes (4-10 nanoseconds), allowing temporal separation of the signals.
Table 1: Performance Characteristics of Optical H2O2 Sensors in Plant Tissues
| Sensor Type | Excitation/Emission (nm) | Chlorophyll Interference | Detection Limit | Temporal Resolution | Spatial Resolution |
|---|---|---|---|---|---|
| Traditional Fluorescent Probes | 400-500/500-600 | High | 50-100 nM | Minutes | Cellular |
| Ratiometric Nanosensors | 500-600/600-700 | Moderate | 10-50 nM | Seconds | Subcellular |
| NIR Nanosensors | 650-750/700-800 | Low | 100-500 nM | Seconds | Tissue |
| Time-Resolved Sensors | 450-500/550-650 | Low-Moderate | 5-20 nM | Minutes | Cellular |
Wound-Induced H2O2 Wave Detection
The application of advanced optical nanosensors has enabled groundbreaking research in plant signaling. A landmark study demonstrated real-time detection of wound-induced H2O2 signaling waves in multiple plant species using specialized nanosensors [38]. The research revealed:
- Logistic Wave Propagation: H2O2 concentration profiles follow a logistic waveform post-wounding
- Species-Specific Velocities: Wave speeds varying from 0.44 to 3.10 cm min⁻¹ across six plant species
- Genetic Dependencies: Dependence on specific plant genes (RbohD, GLR3.3, and GLR3.6) for wave propagation
This study highlighted the species-independent capability of properly designed nanosensors, which successfully operated across diverse plant species including lettuce, arugula, spinach, strawberry blite, sorrel, and Arabidopsis thaliana [38].
Electrochemical Sensing Approaches
Electrochemical sensors offer an alternative detection strategy that is inherently immune to optical interference from chlorophyll. These sensors measure electrical signals generated by H2O2 redox reactions rather than optical properties.
Self-Powered Electrochemical Sensors (SPESs)
A significant advancement in electrochemical detection is the development of self-powered electrochemical sensors that operate without external power sources [28]. These sensors:
- Utilize Fuel Cell Principles: Convert chemical energy from H2O2 reactions directly into electrical signals
- Eliminate Optical Interference: Are completely unaffected by chlorophyll absorption or fluorescence
- Enable Miniaturization: Can be fabricated as compact devices suitable for plant research applications
SPESs operate based on spontaneous electrochemical reactions where H2O2 serves as both oxidant and reductant in a membraneless, one-compartment fuel cell design [28]. This approach suppresses dependence on oxygen availability and simplifies sensor architecture.
Nanocomposite-Enhanced Electrochemical Sensors
Material science advances have significantly improved electrochemical sensor performance through nanocomposite materials:
Silver-Incorporated CeO₂/Ag₂O Nanocomposite: This innovative material demonstrated exceptional electrocatalytic activity for H2O2 detection [7]. Key performance metrics include:
- High sensitivity of 2.728 µA cm⁻² µM⁻¹
- Low detection limit of 6.34 µM
- Broad linear detection range from 1 × 10⁻⁸ to 0.5 × 10⁻³ M
- Excellent selectivity with minimal interference from common analytes
The enhanced performance stems from increased active sites and improved electron transfer facilitated by the nanocomposite structure, specifically the redox cycling between Ce³⁺ and Ce⁴⁺ states and the incorporation of silver nanoparticles [7].
Table 2: Comparison of Electrochemical H2O2 Sensor Performance
| Electrode Material | Sensitivity (µA cm⁻² µM⁻¹) | Detection Limit (µM) | Linear Range (M) | Interference Resistance | Stability |
|---|---|---|---|---|---|
| Bare Glassy Carbon | 0.004-0.01 | 50-100 | 10⁻⁵-10⁻³ | Low | Moderate |
| CeO₂/GCE | 0.0404 | ~25 | 10⁻⁵-10⁻³ | Moderate | Good |
| Ag-CeO₂/Ag₂O/GCE | 2.728 | 6.34 | 10⁻⁸-0.5×10⁻³ | High | Excellent |
| Prussian Blue-Based | 0.5-1.2 | 0.1-1.0 | 10⁻⁶-10⁻³ | High | Good |
Experimental Protocols for Chlorophyll Interference Minimization
Protocol for Validating Optical Sensor Performance in Plant Tissues
Materials:
- Optical nanosensors with spectral properties outside chlorophyll absorption peaks
- Chlorophyll-rich plant tissues (e.g., spinach, Arabidopsis leaves)
- Fluorescence microscope with appropriate filter sets
- Spectrofluorometer for spectral characterization
Methodology:
- Spectral Characterization: Measure full excitation and emission spectra of the sensor in buffer solution
- Chlorophyll Background Assessment: Measure autofluorescence of plant tissue at sensor operational wavelengths
- Sensor Calibration: Perform standard addition calibration of sensors in plant homogenates
- Selectivity Testing: Verify sensor response to H2O2 versus other reactive oxygen species
- Temporal Stability: Monitor signal stability over extended periods (hours to days)
Validation Metrics:
- Signal-to-noise ratio > 3:1
- Recovery of spiked H2O2 standards between 85-115%
- Minimal cross-reactivity with other ROS (<5%)
Protocol for Electrochemical Sensor Deployment in Plant Systems
Materials:
- Fabricated electrochemical sensor (e.g., Ag-CeO₂/Ag₂O/GCE)
- Potentiostat for electrochemical measurements
- Micro-reference electrode suitable for plant tissues
- Plant mounting apparatus for in vivo measurements
Methodology:
- Sensor Preparation: Polish and clean electrode surface following established protocols [7]
- Plant Interface: Establish stable electrical contact with plant tissue using micro-manipulators
- In Vivo Measurement: Monitor H2O2 fluctuations in response to wounding or treatment
- Data Analysis: Quantify H2O2 concentrations based on pre-established calibration curves
Validation Approach:
- Comparison with established colorimetric or chemiluminescence methods
- Spike recovery experiments in plant sap or apoplastic fluid
- Demonstration of expected physiological responses (e.g., wound-induced increases)
Signaling Pathways and Experimental Workflows
The detection of H2O2 in plant research primarily focuses on understanding stress signaling pathways. The diagram below illustrates the key pathway involved in wound-induced H2O2 signaling and the points of sensor intervention:
Diagram 1: H2O2 signaling pathway and sensor integration points. Wounding triggers calcium influx through glutamate-receptor-like channels (GLR3.3, GLR3.6), activating NADPH oxidase (RbohD) to produce H2O2, which propagates as a signaling wave to initiate defense responses. Both optical and electrochemical sensors monitor H2O2 production at critical points in this pathway.
The experimental workflow for comparing sensor performance in plant tissues involves multiple validation steps as shown below:
Diagram 2: Experimental workflow for comparative sensor validation. The process begins with plant selection and sensor calibration, followed by application of a standardized wounding stimulus. Parallel detection using both optical and electrochemical approaches enables direct comparison of performance and quantitative assessment of chlorophyll interference.
The Researcher's Toolkit: Essential Reagents and Materials
Table 3: Research Reagent Solutions for H2O2 Sensing in Plants
| Reagent/Material | Function | Application Notes | Key References |
|---|---|---|---|
| Ag-CeO₂/Ag₂O Nanocomposite | Electrochemical sensing element | High sensitivity (2.728 µA cm⁻² µM⁻¹), minimal interference | [7] |
| NIR Fluorescent Nanosensors | Optical H2O2 detection | Reduced chlorophyll interference, suitable for deep tissue | [38] |
| Ratiometric Fluorescence Probes | Optical H2O2 detection with internal calibration | Corrects for variable chlorophyll background | [51] |
| Prussian Blue Catalysts | Peroxidase-mimicking nanozyme | High selectivity for H2O2 reduction | [28] |
| GLR3.3/3.6 Inhibitors | Pathway validation tools | Confirm specificity of H2O2 signaling waves | [38] |
| RbohD Mutants | Genetic controls | Verify detection of specific H2O2 production mechanisms | [38] |
The selection between optical and electrochemical sensing strategies for H2O2 detection in chlorophyll-rich plant environments depends on specific research requirements. Optical sensors, particularly advanced nanosensors with optimized spectral properties, offer non-invasive monitoring with high spatial resolution, making them ideal for mapping H2O2 signaling waves in real-time [38]. Electrochemical approaches provide superior immunity to optical interference and can achieve excellent sensitivity and temporal resolution, especially with novel nanocomposite materials [7] [28].
For researchers facing significant chlorophyll interference challenges, the following recommendations are provided:
- For high-resolution spatial mapping in thin tissues: Utilize near-infrared optical nanosensors with ratiometric capabilities
- For quantitative measurements in dense tissues: Employ electrochemical sensors with nanocomposite-enhanced electrodes
- For long-term continuous monitoring: Implement self-powered electrochemical sensors to avoid photobleaching issues
- For method validation: Combine both approaches to confirm results independent of detection methodology
Future directions include the development of multimodal sensors that combine optical and electrochemical detection in a single platform, allowing cross-validation and complementary data collection. Additionally, further material innovations in both nanozymes for electrochemical sensing and chlorophyll-compatible fluorophores for optical sensing will continue to push the detection limits and accuracy of H2O2 measurements in plant systems.
Head-to-Head Comparison: Validating Sensor Performance and Selecting the Right Tool
Monitoring hydrogen peroxide (H₂O₂) is critical in plant research, as it is a key reactive oxygen species metabolite and signaling molecule that regulates vital processes including cell proliferation, differentiation, and stress responses [4] [52]. Disruptions in H₂O₂ homeostasis are linked to major physiological consequences, making its accurate detection essential for understanding plant health, development, and adaptation [4] [53].
Electrochemical and optical biosensors represent the two dominant technological approaches for H₂O₂ measurement, each with distinct operational principles and performance characteristics [54]. This guide provides a direct, objective comparison of their analytical figures of merit, supported by experimental data, to inform sensor selection for specific research applications in plant science.
Performance Metrics Comparison
The following tables summarize the key analytical performance data for recent electrochemical and optical H₂O₂ sensors, with a focus on platforms applicable to plant and cellular research.
Table 1: Comparative Analytical Performance of Electrochemical and Optical H₂O₂ Sensors
| Sensor Technology | Detection Principle | Linear Range (μM) | Detection Limit (μM) | Response Time / Stability | Key Materials / Components |
|---|---|---|---|---|---|
| Electrochemical (Pt-Ni Hydrogel) [27] | Amperometry | 0.50 – 5,000 | 0.15 | Rapid response; >60 days stability | Pt-Ni alloyed nanowires, Ni(OH)₂ nanosheets, screen-printed electrode (SPE) |
| Electrochemical (Porphyrin-MOFs@MXenes) [20] | Amperometry | 10 – 3,000 | 3.1 | N/A | Fe-Porphyrin MOFs, MXenes (Ti₃C₂Tₓ), 4-mercaptopyridine, ITO electrode |
| Colorimetric (Pt-Ni Hydrogel) [27] | Peroxidase-like activity (TMB oxidation) | 0.10 – 10,000 | 0.030 | Steady state in <3 min; >60 days stability | Pt-Ni alloyed nanowires, Ni(OH)₂ nanosheets, TMB chromogen |
| Optical (Genetically Encoded Biosensor) [52] | Fluorescence (HyPer7 sensor) | N/A (In vivo ratio-metric imaging) | High spatial-temporal resolution | Real-time, in vivo monitoring in plant tissues | HyPer7 protein, fluorescence microscopy |
Table 2: Comparison of Practical Application Features
| Feature | Electrochemical Sensors | Optical Sensors (Colorimetric/FL) |
|---|---|---|
| Quantification | Excellent, direct electrical readout | Excellent (Colorimetric), Ratio-metric (Fluorescent biosensors) |
| Spatial Resolution | Low (bulk measurement) | Very High (microscopy-based sensors) |
| Temporal Resolution | High (real-time monitoring) [20] | High (real-time monitoring) [52] |
| Invasiveness | Can be invasive for implantable sensors [55] | Minimal with genetically encoded sensors [52] |
| Ease of Miniaturization | High (portable devices, SPEs) [27] | Moderate (portable readers for colorimetric) [54] |
| Key Advantage | High sensitivity, portability, quantitative | Spatial mapping, in vivo sensing, visual readout |
Experimental Protocols for Key Methodologies
Electrochemical Sensor Fabrication and Measurement
Protocol 1: Pt-Ni Hydrogel-based Sensor for Cell H₂O₂ Release [27]
- Sensor Fabrication: Pt-Ni hydrogels are synthesized via a fast co-reduction of chloroplatinic acid and nickel chloride using sodium borohydride (NaBH₄) in an ice bath. The resulting hydrogel is drop-cast onto a screen-printed electrode (SPE) and dried.
- Cell Culture and Stimulation: HeLa cells are cultured directly on or in close proximity to the sensor. To stimulate H₂O₂ production, cells are exposed to chemical stimulants such as ascorbic acid or Zymosan.
- H₂O₂ Measurement: The Pt-Ni hydrogel/SPE is connected to a portable potentiostat. Amperometric detection (i-t curve) is performed at an applied potential of -0.65 V (vs. Ag/AgCl) in a stirred phosphate buffer solution (PBS). The current increase is recorded upon the addition of the stimulant, and the signal is correlated to H₂O₂ concentration using a pre-established calibration curve.
Protocol 2: (MXenes-FeP)n-MOF Sensor for In-Situ Cell Monitoring [20]
- Composite Synthesis: MXenes (Ti₃C₂Tₓ) are first functionalized with 4-mercaptopyridine (4-PySH) via reflux. The 4-PySH@MXenes are then mixed with FeCl₃ and tetrakis(4-carboxyphenyl)porphyrin (TCPP) in a solvent mixture, followed by solvothermal reaction to form the coordination-bond-connected (MXenes-FeP)n-MOF composite.
- Electrode Modification: The composite is dispersed in ethanol, and the suspension is drop-cast onto a clean ITO electrode surface and dried.
- Biocompatibility & Real-time Detection: HeLa cells are seeded and cultured directly on the modified ITO electrode. The system is transferred to a custom electrochemical cell, and chronoamperometry is performed in culture medium at -0.65 V (vs. Ag/AgCl) to monitor H₂O₂ released by the cells in real-time without the need for external stimulation.
Optical Sensor Fabrication and Measurement
Protocol 3: Colorimetric H₂O₂ Detection Using Nanozymes [27]
- Test Paper Fabrication: Pt-Ni hydrogel is synthesized and integrated into a porous membrane to form a colorimetric test strip.
- Colorimetric Assay: The test paper is exposed to a solution containing H₂O₂ and the chromogenic substrate 3,3',5,5'-Tetramethylbenzidine (TMB). In the presence of H₂O₂, the Pt-Ni hydrogel exhibits peroxidase-like activity, catalyzing the oxidation of colorless TMB to a blue product (ox-TMB).
- Signal Readout: The color intensity can be quantified visually for semi-quantitative analysis or, more precisely, using a portable spectrometer or a smartphone-based RGB color detector. The absorbance at 652 nm is measured and plotted against H₂O₂ concentration.
Protocol 4: In Vivo H₂O₂ Imaging in Plants with Genetically Encoded Biosensors [52]
- Plant Material Preparation: Transgenic Marchantia polymorpha plants expressing the HyPer7 biosensor are generated. The HyPer7 gene is fused to a constitutive or tissue-specific promoter and introduced into the plant genome.
- Microscopy and Imaging: Plant tissues (e.g., gemmae or thallus) are mounted on a microscope slide. The excitation of the biosensor is performed at two wavelengths (typically 420 nm and 500 nm), and the emission at 516 nm is captured using a sensitive camera on a confocal or epifluorescence microscope.
- Data Analysis: A ratio (500 nm/420 nm) is calculated for each pixel, which is proportional to the H₂O₂ concentration and is independent of the biosensor's expression level. This allows for high-resolution, ratio-metric mapping of H₂O₂ dynamics in different cell types (e.g., meristematic vs. differentiated cells).
Signaling Pathways and Experimental Workflows
The following diagrams illustrate the fundamental working principles of the two sensor types and a generalized experimental workflow for their application in plant research.
Figure 1: Fundamental working principles of electrochemical and optical H₂O₂ sensors. Electrochemical sensors rely on catalytic reactions at an electrode surface that generate a measurable current, while optical sensors depend on detectable changes in color or fluorescence.
Figure 2: A generalized experimental workflow for H₂O₂ sensing in plant research, highlighting the decision point for sensor selection based on the biological question and required performance metrics.
The Scientist's Toolkit: Essential Research Reagents and Materials
Table 3: Key Reagents and Materials for H₂O₂ Sensor Development and Application
| Item Name | Function / Application | Example Use Case |
|---|---|---|
| Pt-Ni Hydrogel | Nanozyme with dual peroxidase & electrocatalytic activity; serves as enzyme mimic for signal generation. | Core sensing material in colorimetric test strips and amperometric sensors [27]. |
| MXenes (Ti₃C₂Tₓ) | 2D conductive nanomaterial; enhances electron transfer and provides scaffold for composite fabrication. | Improving conductivity and stability in (MXenes-FeP)n-MOF electrochemical sensors [20]. |
| Screen-Printed Electrode (SPE) | Disposable, miniaturized electrochemical cell; enables portable, low-volume measurements. | Platform for Pt-Ni hydrogel-based portable H₂O₂ sensor [27]. |
| 4-Mercaptopyridine (4-PySH) | Molecular linker; forms coordination bonds between MXenes and metal ions in MOFs. | Synthesizing stable, coordinated MOF-MXene hybrids for sensing [20]. |
| TMB (3,3',5,5'-Tetramethylbenzidine) | Chromogenic substrate; produces a blue color upon oxidation by peroxidase or nanozymes. | Colorimetric detection of H₂O₂ with Pt-Ni hydrogel [27]. |
| HyPer7 Biosensor | Genetically encoded, ratio-metric fluorescent protein; responds specifically to H₂O₂. | Real-time, high-resolution imaging of H₂O₂ dynamics in live plant tissues [52]. |
| Zymosan / Ascorbic Acid | Chemical stimulants; induce respiratory bursts and H₂O₂ production in living cells. | Triggering H₂O₂ release from cultured cells for sensor validation [4] [27]. |
The choice between electrochemical and optical H₂O₂ sensors is dictated by the specific requirements of the plant research study. Electrochemical sensors, particularly non-enzymatic nanozyme-based platforms, are superior for applications demanding high sensitivity, low detection limits, and portable quantitative analysis [4] [27]. In contrast, optical sensors, especially genetically encoded probes like HyPer7, are unparalleled for studies requiring non-invasive, high-spatial-resolution imaging of H₂O₂ gradients and fluxes within living plant tissues [52].
Future advancements will likely focus on the further miniaturization and integration of these sensors into wearable or implantable devices for continuous plant monitoring [55] [53], and the development of novel multiparametric sensors capable of simultaneously tracking H₂O₂ alongside other key biomarkers.
Analysis of Portability, Cost-Effectiveness, and Suitability for Point-of-Care Use
The accurate detection of hydrogen peroxide (H₂O₂) is crucial in plant physiology research, where it functions as a key signaling molecule and stress indicator. The development of point-of-care (POC) sensors for field-deployable H₂O₂ monitoring represents a significant advancement over traditional laboratory-bound techniques. This guide provides a systematic comparison of two predominant sensing technologies—electrochemical and optical biosensors—evaluating their relative performance for plant science applications. We analyze critical parameters including portability, cost-effectiveness, detection limits, and operational simplicity to determine the most suitable applications for each technology in resource-limited plant research settings.
Fundamental Sensing Mechanisms and Experimental Workflows
Electrochemical H₂O₂ Sensing
Electrochemical biosensors operate on the principle of detecting electron transfer generated from the redox reaction of hydrogen peroxide at an electrode interface [56] [57]. The fundamental reaction involves the reduction or oxidation of H₂O₂, which generates a measurable electrical signal (current or potential) proportional to its concentration.
Experimental Protocol for MWCNT/ChOx Electrode (From [5]):
- Electrode Preparation: Multi-walled carbon nanotubes (MWCNTs) were activated by sequential sonication in 1 M nitric acid and 1 M sulfuric acid, followed by extensive washing until neutral pH. The paste electrode (PMWCNT) was prepared by mixing activated MWCNTs with mineral oil in a 70/30 w/w ratio.
- Enzyme Immobilization: The enzyme Cholesterol Oxidase (ChOx) was immobilized onto the PMWCNT electrode via drop-casting 10 μL of ChOx (20 U/mL) and drying for 10 minutes at room temperature.
- Electrochemical Characterization: Cyclic Voltammetry (CV) and Electrochemical Impedance Spectroscopy (EIS) were performed in 0.050 M phosphate buffer (PB), pH 7.4, using Ag/AgCl(sat) as a reference electrode.
- H₂O₂ Quantification: Amperometric measurements were conducted by applying a constant potential, with current changes correlated to H₂O₂ concentration in the range of 0.4 to 4.0 mM.
Optical H₂O₂ Sensing
Optical biosensors transduce the H₂O₂ concentration into a measurable optical signal, typically a color change, which can be quantified visually or with portable readers [54] [58]. These often utilize nanozymes (nanomaterials with enzyme-like activity) to catalyze a chromogenic reaction.
Experimental Protocol for Paper-Based Colorimetric Sensor (From [58]):
- Sensor Fabrication: Whatman grade 1 filter paper was patterned to create hydrophilic detection zones surrounded by hydrophobic barriers.
- Reagent Deposition: A mixture containing potassium iodide (KI, catalyst) and 3,3′,5,5′-tetramethylbenzidine (TMB, chromogen) was deposited onto the detection zones and dried.
- Detection Principle: In the presence of H₂O₂, KI is oxidized to iodic acid (HIO₃), which subsequently catalyzes the oxidation of colorless TMB to a blue product (oxTMB).
- Signal Readout: The color intensity of the detection zone was captured using a portable scanner or smartphone camera and analyzed using image processing software (e.g., Adobe Photoshop) to correlate intensity with H₂O₂ concentration.
Diagram 1: Fundamental signaling pathways for optical (top) and electrochemical (bottom) H₂O₂ biosensors, illustrating the distinct transduction mechanisms from analyte binding to signal output.
Comparative Performance Analysis
The quantitative performance of electrochemical and optical H₂O₂ sensors directly influences their suitability for specific plant research applications. The following table summarizes key metrics derived from recent experimental studies.
Table 1: Performance Comparison of Electrochemical and Optical H₂O₂ Biosensors
| Performance Parameter | Electrochemical Sensors | Optical Sensors |
|---|---|---|
| Typical Detection Limit | 0.030 μM – 0.43 μM [5] [27] | 0.03 mM – 0.10 mM [27] [58] |
| Linear Detection Range | 0.50 μM – 5.0 mM [27] | 0.10 mM – 10.0 mM [27] [58] |
| Sensitivity | 26.15 μA/mM (PMWCNT/ChOx) [5] | Color intensity vs. concentration [58] |
| Response Time | Rapid (seconds to minutes) [56] | ~3 minutes (Pt-Ni Hydrogel/TMB) [27] |
| Long-Term Stability | > 60 days (Pt-Ni Hydrogel) [27] | Varies with nanozyme stability; generally high [59] |
| Sample Volume Requirement | Low (microliters) [57] | Low (microliters, paper-based) [58] |
Analysis of Portability and Cost-Effectiveness
Portability and cost are decisive factors for POC use in field research. The following table provides a direct comparison based on the core components and operational requirements of each sensor type.
Table 2: Portability and Cost-Effectiveness Comparison for POC Use
| Aspect | Electrochemical Sensors | Optical Sensors |
|---|---|---|
| Instrumentation | Requires potentiostat (increasingly miniaturized) [27] [57] | Smartphone camera, portable scanner, or naked-eye readout [59] [58] |
| Sensor Fabrication Cost | Low to moderate (carbon materials, noble metal nanozymes) [56] | Very low (paper substrate, common chemicals) [58] |
| Operational Complexity | Requires technical knowledge of electrochemistry [57] | Simple; minimal training required ("sample-in, answer-out") [58] |
| Assay Workflow | Multi-step; often requires electrode preparation and stabilization [5] | Can be designed as single-step dipstick tests [58] |
| Power Requirements | Requires electrical source for instrumentation [56] | Minimal to none for colorimetric readout [54] |
The Scientist's Toolkit: Essential Research Reagent Solutions
The development and operation of high-performance H₂O₂ sensors rely on a core set of materials and reagents. The following table details key components and their functions in typical experimental protocols.
Table 3: Key Research Reagent Solutions for H₂O₂ Biosensor Development
| Reagent/Material | Function in Biosensing | Representative Use Case |
|---|---|---|
| Multi-Walled Carbon Nanotubes (MWCNTs) | Electrode nanomaterial; enhances electron transfer and surface area for biomolecule immobilization. [5] | Base material for the paste electrode in the PMWCNT/ChOx sensor. [5] |
| Cholesterol Oxidase (ChOx) | Biological recognition element; catalyzes reactions producing H₂O₂, used here for its redox properties towards H₂O₂ itself. [5] | Enzyme immobilized on PMWCNT to enhance H₂O₂ detection sensitivity. [5] |
| Pt-Ni Bimetallic Hydrogel | Nanozyme with dual peroxidase-like and electrocatalytic activity; replaces natural enzymes like HRP. [27] | Core sensing material for both colorimetric and electrochemical detection in a portable setup. [27] |
| 2D Ni/Co-MOF@CMC | Nanozyme with peroxidase-like activity; catalyzes oxidation of chromogenic substrates. [59] | Peroxidase mimetic in a colorimetric biosensor for H₂O₂ and glucose detection. [59] |
| 3,3′,5,5′-Tetramethylbenzidine (TMB) | Chromogenic substrate; changes color (colorless to blue) upon enzyme/nanozyme-catalyzed oxidation. [27] [58] | Colorimetric indicator in both Pt-Ni hydrogel and paper-based KI/TMB sensors. [27] [58] |
| Potassium Iodide (KI) | Peroxidase mimetic catalyst; oxidizes in presence of H₂O₂ to catalyze TMB oxidation. [58] | Low-cost, effective alternative to HRP or noble metal nanozymes in paper-based sensors. [58] |
Diagram 2: An experimental workflow for plant researchers, guiding the selection between electrochemical and optical biosensing methods based on the required sensitivity and application context.
This comparative analysis reveals a clear trade-off between performance and practicality for H₂O₂ biosensors in plant research. Electrochemical sensors are the unequivocal choice for applications demanding high sensitivity, low detection limits, and precise quantification, such as studying subtle changes in H₂O₂ signaling during early plant stress responses [5] [27]. However, this comes at the cost of requiring more sophisticated instrumentation and operational expertise.
Conversely, optical colorimetric sensors, particularly paper-based platforms, excel in scenarios where rapid, inexpensive, and user-friendly screening is the priority. Their supreme portability and minimal cost make them ideal for high-throughput field surveys or educational applications in resource-limited settings, even though they offer higher detection limits [58].
The choice between these technologies is not a matter of superiority but of strategic alignment with research goals. For ultimate sensitivity and quantitative rigor in controlled settings, electrochemical sensors are recommended. For maximum portability, cost-effectiveness, and ease of use in field-based plant studies, optical sensors present a compelling solution. The ongoing convergence of these technologies, exemplified by the use of nanozymes like Pt-Ni hydrogels in both platforms, promises a future of even more versatile and powerful POC diagnostic tools for plant science [27].
Correlation with Gold-Standard Methods (e.g., HPLC, Spectrophotometry)
The accurate detection and quantification of hydrogen peroxide (H₂O₂) is crucial across numerous scientific fields, including plant physiology, where it functions as a key signaling molecule and stress indicator. The evaluation of any new sensing technology requires rigorous correlation with established analytical methods to validate its performance. High-Performance Liquid Chromatography (HPLC) and UV Spectrophotometry are widely recognized as gold-standard methods in analytical chemistry due to their well-documented accuracy, precision, and reliability [60] [61]. These methods provide the benchmark against which newer, often more rapid or portable techniques—such as electrochemical and optical sensors—must be compared. This guide provides a structured framework for conducting such comparisons, presenting objective experimental data and detailed protocols to help researchers critically assess the correlation between emerging H₂O₂ sensors and traditional gold-standard methods. The principles outlined are particularly vital for plant research, where the complexity of the plant matrix demands methods of the highest specificity and accuracy.
Experimental Comparison of Core Analytical Methods
A direct comparison of analytical techniques requires an examination of key performance metrics derived from validated experimental procedures.
Table 1: Quantitative Performance Metrics of Gold-Standard and Sensor-Based Methods for H₂O₂ Analysis
| Methodology | Linear Range | Limit of Detection (LOD) | Limit of Quantification (LOQ) | Precision (% R.S.D.) | Accuracy (% Recovery) | Key Applications & Notes |
|---|---|---|---|---|---|---|
| HPLC with UV Detection | 5–50 μg/mL [60] | Varies with detector | Varies with detector | < 1.50% [60] | 99.71–100.25% [60] | High specificity; suitable for complex plant matrices; requires extensive sample preparation. |
| UV Spectrophotometry | 5–30 μg/mL [60] | Varies with analyte | Varies with analyte | < 1.50% [60] | 99.63–100.45% [60] | Simple and fast; susceptible to interference from colored compounds in plant extracts. |
| Electrochemical Sensors | 100 nM – 1 mM [56] | ~100 nM [56] | ~500 nM (estimated) | Data not available | Data not available | High sensitivity for low concentrations; ideal for real-time, in-situ monitoring in plant tissues. |
| Potentiometric Titration | Applicable for bulk analysis [61] | Less sensitive | Less sensitive | Data not available | Data not available | Primarily for raw material quantification; less suitable for trace analysis in biological samples. |
The data in Table 1 illustrates the performance trade-offs between methods. For instance, HPLC and UV Spectrophotometry offer exceptional accuracy and precision, making them ideal for validating the concentration of H₂O₂ in prepared samples [60]. In contrast, electrochemical sensors excel in sensitivity (low LOD) and are capable of operating in a physiologically relevant range (nM to μM), which is critical for measuring the low concentrations of H₂O₂ found in plant cells [56] [62]. However, the reliability of sensor data must be confirmed by demonstrating a strong correlation with HPLC or spectrophotometry results, especially when analyzing complex plant extracts.
Detailed Experimental Protocols for Method Correlation
To ensure the validity of comparative studies, the following standardized protocols for gold-standard methods can be employed.
Protocol for H₂O₂ Quantification via UV Spectrophotometry
UV Spectrophotometry is a fundamental technique for H₂O₂ analysis due to its simplicity and cost-effectiveness.
- Instrumentation and Materials: Double-beam UV-Vis spectrophotometer with 1.0 cm quartz cells; methanol or deionized water as solvent [60] [63].
- Standard Solution Preparation: A primary stock solution of H₂O₂ (1000 μg/mL) is prepared in deionized water. This solution is serially diluted with the same solvent to prepare standard solutions covering the calibration range (e.g., 5–30 μg/mL) [60] [63].
- Sample Preparation: Plant tissue (e.g., leaf disc) is homogenized in an appropriate extraction buffer. The homogenate is centrifuged, and the supernatant is filtered prior to analysis. For pharmaceutical or pure chemical analysis, a direct dilution in solvent is performed [60].
- Analysis and Calibration: The absorbance of the standard solutions is measured at the maximum absorption wavelength (λmax) for H₂O₂. A calibration curve is constructed by plotting absorbance against concentration, and the regression equation is used to determine the H₂O₂ concentration in unknown samples [63].
Protocol for H₂O₂ Quantification via Reversed-Phase HPLC
RP-HPLC provides superior specificity, separating H₂O₂ from other compounds in a complex plant extract matrix.
- Instrumentation and Materials: HPLC system with UV detector; C18 column (e.g., 250 mm × 4.6 mm, 5 μm); mobile phase such as methanol-water mixtures [60] [61] [63].
- Chromatographic Conditions:
- Sample Analysis: The same standard and sample solutions prepared for spectrophotometry can be used. The sample is injected, and the peak area or height of H₂O₂ is measured. The concentration is determined from a calibration curve of peak area versus concentration [60] [63].
Protocol for Correlation with Electrochemical Sensors
- Sensor Calibration: The electrochemical sensor is first calibrated using a series of standard H₂O₂ solutions in a clean buffer to establish its own calibration curve (e.g., current response vs. concentration) [56] [62].
- Parallel Analysis: A set of plant extract samples is split and analyzed simultaneously using the calibrated electrochemical sensor and the gold-standard HPLC or spectrophotometry method.
- Data Correlation: The results from the sensor (y-axis) are plotted against the results from the gold-standard method (x-axis). A linear regression analysis is performed. The resulting correlation coefficient (r²), slope, and intercept are used to validate the sensor's accuracy. A slope close to 1.0 and an intercept close to 0 indicate strong agreement [56].
The Scientist's Toolkit: Essential Reagents and Materials
Successful experimentation requires high-quality, well-characterized materials. The following table lists key reagents used in the featured methodologies.
Table 2: Essential Research Reagents for H₂O₂ Analysis
| Reagent/Material | Function in Experiment | Specification Notes |
|---|---|---|
| Hydrogen Peroxide Reference Standard | Serves as the primary standard for preparing calibration curves; essential for determining accuracy and recovery. | High purity certified material; requires proper storage to prevent degradation. |
| HPLC-Grade Methanol & Water | Used as solvents for mobile phase preparation and sample dilution. | Low UV absorbance; free from particulate matter to prevent HPLC system damage and baseline noise. |
| C18 Chromatographic Column | The stationary phase for reversed-phase HPLC separation. | Standard dimensions: 250 mm x 4.6 mm, 5 μm particle size; provides necessary separation efficiency [60] [63]. |
| Buffer Salts (e.g., Phosphate) | Used to prepare the sample matrix and electrolyte for electrochemical sensing. | Maintains physiological pH and ionic strength; ensures stable sensor performance [56]. |
| Electrochemical Sensor Probe | The transducer that converts H₂O₂ concentration into a measurable electrical signal. | Often modified with nanomaterials (e.g., Pt, Au, MnO₂) to enhance sensitivity and selectivity [56] [62]. |
Critical Analysis of Sensor Performance vs. Gold Standards
When comparing electrochemical and optical sensors to gold-standard methods, distinct advantages and limitations emerge, shaping their application in plant research.
Specificity and Interference: HPLC excels in specificity by physically separating H₂O₂ from other compounds in a complex plant extract, reducing false positives [61]. Both UV Spectrophotometry and simple optical sensors can suffer from interference from other absorbing or fluorescing molecules in the sample. Electrochemical sensors can be highly selective, particularly when a specific applied potential is used, but may still be affected by other electroactive species [56] [62].
Sensitivity and Detection Limits: Electrochemical sensors demonstrate superior sensitivity for detecting trace levels of H₂O₂, with detection limits potentially in the nanomolar range, which is crucial for monitoring subtle changes in plant signaling [56] [62]. HPLC-UV and spectrophotometry typically operate effectively in the microgram-per-milliliter range, which may require sample pre-concentration for low-abundance plant H₂O₂ measurements [60].
Throughput and Practicality: UV Spectrophotometry offers the highest throughput and simplicity for analyzing large numbers of samples [60]. HPLC, while highly accurate, has slower throughput due to longer run times. Electrochemical sensors provide a unique advantage for real-time, continuous monitoring of H₂O₂ flux in living plant tissues, a capability that is impossible with chromatographic or spectroscopic methods that provide a single time-point measurement [56] [19].
The correlation of emerging electrochemical and optical sensors with gold-standard methods like HPLC and Spectrophotometry is not merely a regulatory formality but a fundamental scientific practice. This guide demonstrates that while traditional methods provide the foundation for accuracy and validation, modern sensors offer unparalleled advantages for real-time, sensitive, and in-situ monitoring in dynamic plant systems. The optimal approach for plant researchers is not to choose one method over the other, but to leverage their complementary strengths. Gold-standard methods are indispensable for initial sensor validation and calibrating sample extracts, while advanced sensors open new frontiers for understanding the spatial and temporal dynamics of H₂O₂ in living plants. This synergistic use of analytical techniques will continue to drive innovation and discovery in plant science.
Hydrogen peroxide (H₂O₂) is a crucial reactive oxygen species (ROS) that functions as a central signaling molecule in plant physiology, regulating processes from growth and development to defense responses against biotic and abiotic stressors [10] [64]. However, maintaining redox homeostasis is critical, as excessive H₂O₂ accumulation leads to oxidative stress, causing cellular damage, impaired photosynthesis, and hindered plant functions [10]. Accurate monitoring of H₂O₂ dynamics is therefore fundamental to understanding plant physiology, stress responses, and developing strategies to enhance crop resilience [39] [10].
The selection of an appropriate sensing methodology is paramount for obtaining reliable, biologically relevant data. Researchers primarily choose between electrochemical and optical sensing approaches, each with distinct operational principles, advantages, and limitations. This guide provides a structured framework to help researchers navigate this decision based on specific experimental requirements, measurement environments, and performance priorities.
Core Sensing Technologies: Principles and Comparison
Electrochemical Sensors
Electrochemical sensors convert the chemical recognition of H₂O₂ into an measurable electrical signal. They operate by detecting changes in electrical current (amperometric) or potential (potentiometric) resulting from the catalytic reduction or oxidation of H₂O₂ at an electrode surface [10] [56].
- Enzymatic Electrochemical Sensors: These incorporate biological elements like horseradish peroxidase (HRP) to catalyze H₂O₂ reduction, generating an electrical current proportional to concentration. While highly selective, the enzymes are susceptible to denaturation under non-physiological conditions [10].
- Non-Enzymatic Electrochemical Sensors: These utilize catalytic nanomaterials—such as metal oxides (CuO, Co₃O₄), noble metals (Pt, Au), or conductive polymers (polypyrrole)—to directly react with H₂O₂. They offer greater stability and longer lifespan, albeit sometimes with slightly lower sensitivity than their enzymatic counterparts [10] [16]. Enhancing these sensors with nanostructures increases the electrode's surface area, providing more reactive sites and facilitating electron transfer for improved sensitivity and speed [10].
A significant advancement is the Self-Powered Electrochemical Sensor (SPES), which operates on a fuel cell principle. These devices use H₂O₂ as both fuel and oxidant, generating an analytical signal without an external power source. This makes them ideal for implantable, in-situ, and long-term monitoring applications [28].
Optical Sensors
Optical sensors detect H₂O₂ by measuring changes in light properties, such as intensity, color, or wavelength, induced by a specific reaction with the analyte.
- Colorimetric Sensors: These typically employ a peroxidase-like nanozyme (e.g., Pt-Ni hydrogels) to catalyze a color-changing reaction in a substrate like TMB in the presence of H₂O₂. The color intensity, measurable via spectrophotometry or even smartphone cameras, is proportional to H₂O₂ concentration [27].
- Fluorescent Sensors (Genetically Encoded): Represented by sensors like oROS-G and the HyPer family, these are engineered proteins containing a peroxide-sensitive domain (e.g., from bacterial OxyR) fused to a fluorescent protein (e.g., cpGFP). H₂O₂ binding induces a conformational change that alters the sensor's fluorescence, enabling real-time tracking within living cells [64]. Recent engineering of oROS-G has achieved superior sensitivity and fast on-and-off kinetics, capturing transient H₂O₂ dynamics in real-time [64].
Decision Framework: Electrochemical vs. Optical
The table below summarizes the core characteristics of each sensor type to guide your initial selection.
Table 1: Core Characteristics of Electrochemical and Optical H₂O₂ Sensors
| Feature | Electrochemical Sensors | Optical Sensors |
|---|---|---|
| Fundamental Principle | Measures electrical current/potential from H₂O₂ redox reaction [10] [56] | Measures changes in light absorption/emission from H₂O₂ reaction [27] [64] |
| Key Strengths | High sensitivity, portability, low cost, miniaturization potential, quantitative real-time readout [10] [56] | High spatial mapping, minimal physical invasion (optical), compatibility with live-cell imaging [39] [64] |
| Common Limitations | Potential electrode fouling, requires physical contact with sample, limited spatial information | Signal interference from chlorophyll autofluorescence, light scattering in tissues, more complex instrumentation for some formats [65] |
| Typical Detection Limit | Nanomolar to micromolar range [10] [16] | Nanomolar to micromolar range [27] [64] |
| Temporal Resolution | Seconds to minutes [65] | Sub-second to seconds (e.g., oROS-G) [64] |
| Spatial Resolution | Bulk tissue or localized point measurements | High, capable of subcellular resolution [64] |
To further refine the choice, consider the following decision workflow that maps research goals to the recommended sensor technology:
Performance Data and Experimental Protocols
Quantitative Performance Comparison
The following table compiles experimental data from recent studies to illustrate the performance range achievable with different sensor designs.
Table 2: Experimental Performance of Recent Electrochemical and Optical H₂O₂ Sensors
| Sensor Type | Specific Example | Detection Limit | Linear Range | Response Time | Key Application Demonstrated |
|---|---|---|---|---|---|
| Wearable Electrochemical | Microneedle Patch w/ Enzyme-Graphene Oxide [65] | Significantly lower than previous needle sensors | N/A | < 1 minute | Detection of bacterial pathogen stress in soybean & tobacco plants [65] |
| Non-Enzymatic Electrochemical | PPy-Ag/Cu modified electrode [16] | 0.027 μM | 0.1–1 mM & 1–35 mM | N/A | Laboratory analysis of H₂O₂ in solution [16] |
| Self-Powered Electrochemical | Pt-Ni Hydrogel-based SPES [27] | 0.15 μM (Electrochemical mode) | 0.50 μM–5.0 mM | N/A | Detection of H₂O₂ released from living cells (HeLa) [27] |
| Colorimetric Optical | Pt-Ni Hydrogel-based Test Paper [27] | 0.030 μM | 0.10 μM–10.0 mM | Steady state in 3 min | Portable visual detection; cell culture [27] |
| Genetically Encoded Optical | oROS-G (optogenetic) [64] | High sensitivity (≈7x improvement over HyperRed) | N/A | 1.06 seconds (25-75% saturation) | Real-time transient H₂O₂ in neurons, cardiomyocytes, brain slices [64] |
Detailed Experimental Protocols
This protocol describes the deployment of a system that can be used for continuous, in-situ monitoring.
- System Fabrication: Integrate a miniature photovoltaic (PV) module with an implantable microsensor. The PV module harvests ambient light (sunlight or artificial) from the planting environment.
- Sensor Implantation: Carefully implant the microsensor into the plant tissue of interest (e.g., leaf, stem). The design must minimize tissue damage.
- Power Management: The integrated PV module continuously powers the microsensor, eliminating the need for external batteries or wired connections.
- Data Acquisition & Analysis: Monitor the electrical signal (current or potential) generated by the sensor. Relate this signal to in-vivo H₂O₂ concentrations to resolve the timing and specificity of stress responses.
This method is designed for rapid, non-destructive stress detection on the leaf surface.
- Sensor Fabrication: Fabricate a flexible patch with an array of microscopic plastic needles. Coat this array with a chitosan-based hydrogel containing an enzyme (e.g., horseradish peroxidase) and reduced graphene oxide.
- Patch Application: Adhere the patch directly to the underside of a plant leaf, allowing the microneedles to interface with the apoplastic fluid.
- Measurement: When H₂O₂ is present, the enzyme catalyzes its conversion, producing electrons. The graphene oxide conducts these electrons, generating a measurable electrical current.
- Interpretation: Measure the current signal within one minute. Compare the signal intensity between healthy and stressed plants; a higher current indicates elevated H₂O₂ levels and stress.
This protocol uses a genetically encoded sensor for high-resolution dynamic tracking in living cells.
- Sensor Expression: Transfect or transduce the target cell line (e.g., HEK293, stem cell-derived neurons, astrocytes) with a plasmid vector encoding the oROS-G sensor protein.
- Stimulation & Imaging: Mount the cells on a confocal or fluorescence microscope. Acquire time-lapse images (excitation: 488 nm, emission: 515 nm) before and after applying a stimulus (e.g., pharmacological agent like menadione, GPCR agonist, or external H₂O₂).
- Data Quantification: Analyze the fluorescence intensity changes (ΔF/F₀) over time. The fast kinetics of oROS-G allow for tracking of transient H₂O₂ fluxes and diffusion dynamics across the cell.
The Scientist's Toolkit: Essential Research Reagents and Materials
Table 3: Key Reagents and Materials for H₂O₂ Sensor Implementation
| Item | Function / Application | Example Use Case |
|---|---|---|
| Horseradish Peroxidase (HRP) | Enzyme that catalyzes H₂O₂ reduction; used in enzymatic electrochemical sensors and colorimetric assays [10]. | Key component in the bio-hydrogel of wearable microneedle patches [65]. |
| Reduced Graphene Oxide (rGO) | Conducting nanomaterial that facilitates electron transfer in electrochemical sensors [65]. | Used in microneedle patches to conduct electrons generated from the H₂O₂-enzyme reaction [65]. |
| Metal Oxide Nanostructures (CuO, Co₃O₄) | Catalytic nanomaterials for non-enzymatic H₂O₂ detection; increase electrode surface area and reactivity [10]. | Fabrication of sensitive and selective electrodes for detecting H₂O₂ in complex plant juice samples [10]. |
| Pt-Ni Hydrogels | Nanozyme with excellent peroxidase-like and electrocatalytic activity; enables both colorimetric and electrochemical detection [27]. | Serves as the core sensing material in dual-mode portable sensors and self-powered systems [27] [28]. |
| oROS-G Plasmid DNA | Genetically encoded construct for expressing the optogenetic H₂O₂ sensor in living cells [64]. | Transfection into mammalian cells for real-time, high-resolution imaging of H₂O₂ dynamics and signaling [64]. |
| Polypyrrole (PPy) | Conductive polymer used as a scaffold for electrode modification, offering high conductivity and reversible redox properties [16]. | Serves as a stable base for the electrodeposition of Ag/Cu nanoparticles in non-enzymatic electrodes [16]. |
Choosing between electrochemical and optical sensors for H₂O₂ research is a strategic decision that directly impacts data quality and biological insights. There is no universally superior technology; the optimal choice is dictated by the specific research question.
- Electrochemical sensors are the preferred tools for quantitative, sensitive, and portable measurements, especially for in-situ plant health monitoring, field applications, and when external power is a constraint. Their evolution toward implantable and self-powered designs is particularly promising for agricultural and physiological studies [39] [28].
- Optical sensors are unmatched for visualizing spatiotemporal dynamics within living systems. Genetically encoded sensors like oROS-G represent a breakthrough for interrogating real-time H₂O₂ signaling and transient events in live cells and complex tissues with high kinetic resolution [64].
By applying the structured framework, performance data, and protocols outlined in this guide, researchers can make an informed decision, ensuring their selected sensor technology aligns perfectly with their experimental goals and unlocks deeper understanding of H₂O₂ in plant biology.
Conclusion
This review synthesizes the distinct advantages and limitations of electrochemical and optical sensors for plant H₂O₂ monitoring. Electrochemical sensors, particularly self-powered and wearable patches, offer superior potential for real-time, in-situ quantification with high sensitivity and direct electrical readouts, making them ideal for integration into precision agriculture networks. Optical sensors provide exceptional capabilities for non-invasive, spatially resolved imaging and multiplexing, valuable for fundamental plant physiology studies. Future directions will focus on developing multi-modal sensor fusion platforms, creating more robust and selective nanozyme-based materials, and leveraging machine learning for data analysis. The translation of these advanced diagnostic tools from plant science to biomedical research, such as using plant stress models to understand oxidative stress in human pathologies, presents a promising frontier for interdisciplinary collaboration.
References
- 1. Real-time detection of wound-induced H signalling... | Nature 2 O 2 Plants [https://www.nature.com/articles/s41477-020-0632-4?error=cookies_not_supported]
- 2. An activatable near-infrared probe for in situ monitoring of ... [https://www.sciencedirect.com/science/article/abs/pii/S0308814625019430]
- 3. Wearable Sensor for Plants Monitors Stress in Real Time [https://axial.acs.org/agriculture-and-food-chemistry/wearable-sensor-for-plants-monitors-stress-in-real-time]
- 4. A review on recent advances in hydrogen peroxide ... [https://www.sciencedirect.com/science/article/abs/pii/S1001841722001590]
- 5. Experimental and In Silico Studies on the Development of ... [https://pmc.ncbi.nlm.nih.gov/articles/PMC12109943/]
- 6. Enzymeless electrochemical detection of hydrogen ... [https://www.nature.com/articles/s41598-025-10472-6]
- 7. Sensitive and Selective Electrochemical Detection of ... [https://www.mdpi.com/2079-6374/15/9/617]
- 8. Ultra‐low LOD H2O2 Sensor Based on Synergistic Nernst ... [https://pmc.ncbi.nlm.nih.gov/articles/PMC12244517/]
- 9. Hydrogen peroxide electrochemical sensor using green ... [https://www.sciencedirect.com/science/article/pii/S2468023025019145]
- 10. Assessment of Oxidative Stress by Detection of H 2 O 2 in ... [https://www.mdpi.com/2227-9040/11/10/532]
- 11. Electrochemical sensors for plant signaling molecules [https://www.sciencedirect.com/science/article/abs/pii/S0956566324007632]
- 12. Proximal Methods for Plant Stress Detection Using Optical ... [https://pmc.ncbi.nlm.nih.gov/articles/PMC7760370/]
- 13. Optical hydrogen peroxide sensor for measurements in flow [https://www.sciencedirect.com/science/article/pii/S0925400523016222]
- 14. Comparative Proteomics Analysis Reveals an Intimate Protein ... [https://pmc.ncbi.nlm.nih.gov/articles/PMC2500226/]
- 15. Sensitive and Selective Electrochemical Detection of ... [https://pmc.ncbi.nlm.nih.gov/articles/PMC12467245/]
- 16. Hydrogen Peroxide Electrochemical Sensor Based on Ag ... [https://pmc.ncbi.nlm.nih.gov/articles/PMC10611109/]
- 17. LPFG Sensor for Rapid and Accurate In-Situ Detection of H ... [https://www.sciencedirect.com/science/article/abs/pii/S0925400525019252]
- 18. A spectrometric method for hydrogen peroxide ... [https://pubmed.ncbi.nlm.nih.gov/26473862/]
- 19. Comparative analysis of electrochemical and optical ... [https://www.sciencedirect.com/science/article/pii/S095656632400099X]
- 20. Electrochemical sensing system based on coordination ... [https://www.nature.com/articles/s41598-025-89688-5]
- 21. Far-red and sensitive sensor for monitoring real time H2O2 ... [https://pmc.ncbi.nlm.nih.gov/articles/PMC10871219/]
- 22. In-vivo electrochemical monitoring of H2O2 production ... [https://www.sciencedirect.com/science/article/abs/pii/S0956566317304888]
- 23. A Flexible Electrochemical Sensor Based on Porous Ceria ... [https://pmc.ncbi.nlm.nih.gov/articles/PMC12563342/]
- 24. MADI: A multispectral automated dynamic imager to ... [https://www.sciencedirect.com/science/article/pii/S2643651525000469]
- 25. Application of Non-Destructive Technology in Plant ... [https://www.mdpi.com/2077-0472/15/15/1670]
- 26. Electrochemical Sensors for Sustainable Precision ... [https://www.frontiersin.org/journals/chemistry/articles/10.3389/fchem.2022.848320/full]
- 27. Portable visual and electrochemical detection of hydrogen ... [https://www.nature.com/articles/s41378-023-00623-y]
- 28. Hydrogen Peroxide Fuel Cells and Self-Powered ... [https://pmc.ncbi.nlm.nih.gov/articles/PMC11852683/]
- 29. Electrochemical-Based Sensing Platforms for Detection of ... [https://www.mdpi.com/2079-6374/13/3/347]
- 30. Recent Advances in Electrochemical Sensing of Hydrogen ... [https://pmc.ncbi.nlm.nih.gov/articles/PMC9103167/]
- 31. Smart Sensors and Smart Data for Precision Agriculture [https://www.mdpi.com/1424-8220/24/8/2647]
- 32. Integration of smart sensors and IOT in precision agriculture [https://pmc.ncbi.nlm.nih.gov/articles/PMC12116683/]
- 33. 7 types of agricultural sensors driving the smart farming ... [https://www.escatec.com/blog/7-types-of-agricultural-sensors-driving-the-smart-farming-revolution]
- 34. What types of sensors are used in precision agriculture? [https://geopard.tech/blog/what-are-the-types-of-sensors-used-in-agriculture/]
- 35. In situ monitoring of dynamic H 2 O 2 produced upon the ... [https://www.sciencedirect.com/science/article/abs/pii/S0925400525002473]
- 36. Hydrogen Peroxide Signaling in Plant Development and ... [https://pmc.ncbi.nlm.nih.gov/articles/PMC4777889/]
- 37. Recent progress in nanomaterial-based electrochemical ... [https://www.sciencedirect.com/science/article/abs/pii/S0039914024018290]
- 38. Real-time detection of wound-induced H2O2 signalling ... [https://pubmed.ncbi.nlm.nih.gov/32296141/]
- 39. An Implantable and Self-Powered Sensing System for the ... [https://www.sciencedirect.com/science/article/pii/S2095809924000626]
- 40. Rapid and In-Field Sensing of Hydrogen Peroxide in Plant ... [https://pubmed.ncbi.nlm.nih.gov/38766989/]
- 41. Strategies for Biofouling Control: A Review from an ... [https://www.mdpi.com/2079-6412/15/10/1185]
- 42. Biofouling Resistance [https://www.anbsensors.com/biofouling-resistance/]
- 43. Surface Treatment of Polymer Membranes for Effective ... [https://pmc.ncbi.nlm.nih.gov/articles/PMC10456448/]
- 44. Plant sensors could act as an early warning system ... [https://news.mit.edu/2024/plant-sensors-could-be-early-warning-system-farmers-0417]
- 45. Electrochemical Quantification of H2O2 Released by Airway ... [https://pmc.ncbi.nlm.nih.gov/articles/PMC9611932/]
- 46. Plant patch can detect stress signals in real time [https://www.acs.org/pressroom/presspacs/2025/march/plant-patch-can-detect-stress-signals-in-real-time.html]
- 47. Recent Advances in Nanozyme-Based Sensing Technology ... [https://pmc.ncbi.nlm.nih.gov/articles/PMC11511242/]
- 48. Advances and Future Trends in Nanozyme-Based SERS ... [https://www.mdpi.com/1422-0067/26/2/709]
- 49. Nanosensors Convert H2O2 to Machine-Learnable ... [https://www.sciencedirect.com/science/article/pii/S2773237125000784]
- 50. A comprehensive review on optical and electrochemical ... [https://www.frontiersin.org/journals/nutrition/articles/10.3389/fnut.2025.1596673/full]
- 51. Advances in Nanostructured Fluorescence Sensors for H 2 ... [https://www.mdpi.com/2673-8023/5/2/15]
- 52. Redox buffering and H2O2 orchestrate the vegetative ... [https://pmc.ncbi.nlm.nih.gov/articles/PMC12274077/]
- 53. Electrochemical Sensors for Sustainable Precision Agriculture ... [https://pmc.ncbi.nlm.nih.gov/articles/PMC9124781/]
- 54. Electrochemical vs. Optical Biosensors for Point-of-Care ... [https://www.mdpi.com/2227-9040/11/10/546]
- 55. Recent advances in wearable and implantable ... [https://www.sciencedirect.com/science/article/pii/S0165993625002043]
- 56. Flexible Sensors for Hydrogen Peroxide Detection: A Critical ... [https://pmc.ncbi.nlm.nih.gov/articles/PMC9104121/]
- 57. Engineered Intelligent Electrochemical Biosensors for ... [https://www.mdpi.com/2227-9040/13/4/146]
- 58. An Economical and Portable Paper-Based Colorimetric ... [https://www.mdpi.com/2227-9040/10/8/335]
- 59. Point-of-care colorimetric biosensor for H2O2 and glucose ... [https://www.sciencedirect.com/science/article/abs/pii/S0003267025003873]
- 60. Comparison of UV spectrophotometry and high ... [https://pmc.ncbi.nlm.nih.gov/articles/PMC3658086/]
- 61. Comparison of HPLC, UV spectrophotometry and ... [https://www.sciencedirect.com/science/article/abs/pii/S0731708508002707]
- 62. Recent Advances in Electrochemical Sensing of Hydrogen ... [https://www.mdpi.com/2079-4991/12/9/1475]
- 63. Comparison of HPLC and UV Spectrophotometric Methods ... [https://brieflands.com/journals/ijpr/articles/124310]
- 64. Structure-guided engineering of a fast genetically encoded ... [https://pmc.ncbi.nlm.nih.gov/articles/PMC10862829/]
- 65. Wearable Sensor Detects Plant Stress Before It’s Visible [https://scitechdaily.com/wearable-sensor-detects-plant-stress-before-its-visible/]