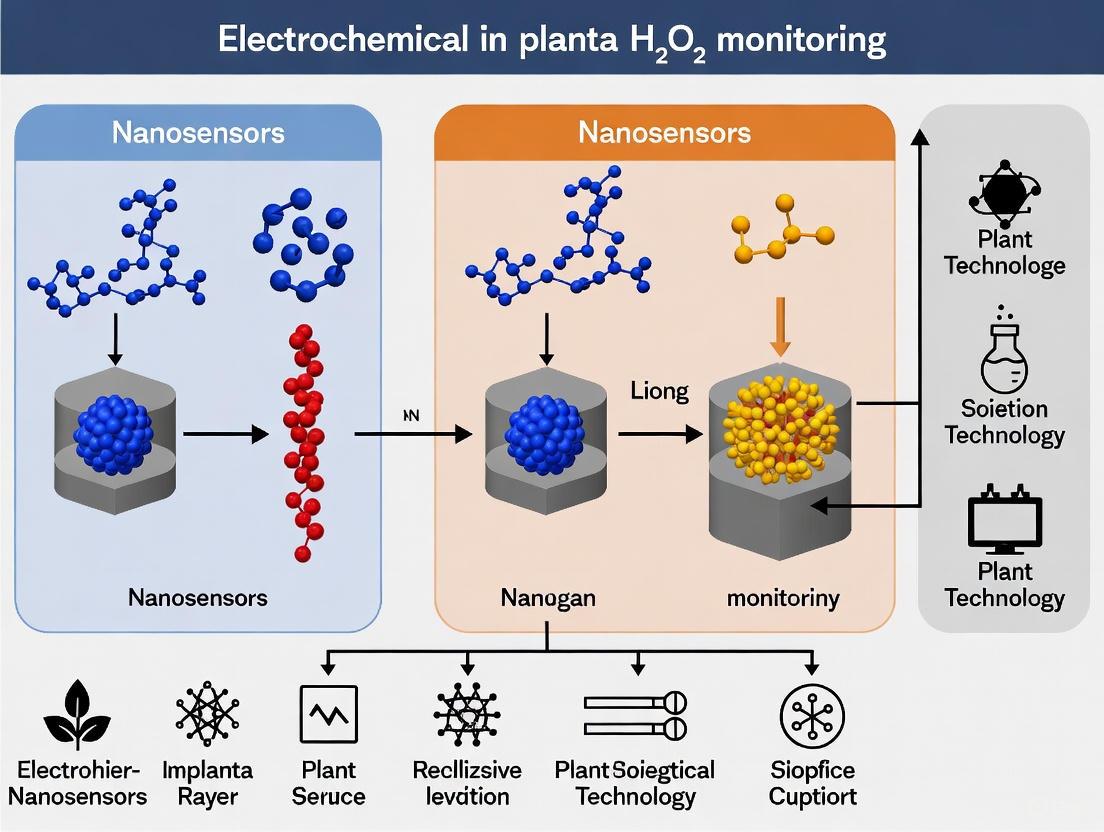
Electrochemical Nanosensors for In-Planta H2O2 Monitoring: A New Era in Real-Time Plant Health Diagnostics
This article comprehensively reviews the development and application of electrochemical nanosensors for the in-situ monitoring of hydrogen peroxide (H2O2) in plants.
Electrochemical Nanosensors for In-Planta H2O2 Monitoring: A New Era in Real-Time Plant Health Diagnostics
Abstract
This article comprehensively reviews the development and application of electrochemical nanosensors for the in-situ monitoring of hydrogen peroxide (H2O2) in plants. As a key reactive oxygen species, H2O2 serves as a central biomarker for plant stress responses, including pathogen attack and abiotic challenges. We explore the foundational principles, from sensing mechanisms to nanomaterial design, including the use of carbon nanomaterials, metal nanoparticles, and innovative biohydrogels. The scope extends to methodological advances in wearable and microneedle-based sensors for real-time, in-planta application, addressing critical challenges in sensitivity, selectivity, and biocompatibility. A comparative analysis validates these nanosensors against traditional methods, highlighting their transformative potential for precise agricultural monitoring, crop disease management, and fundamental plant science research, with significant implications for biomedical sensing.
The Critical Role of H2O2 and the Need for Advanced In-Planta Monitoring
H2O2 as a Central Signaling Molecule in Plant Defense and Stress Response
Hydrogen peroxide (H2O2) has emerged as a pivotal signaling molecule mediating plant physiological and biochemical processes under abiotic and biotic stresses. Unlike other reactive oxygen species (ROS), H2O2's relative stability and capacity to traverse membranes enable it to function as a core regulator in complex signaling networks that integrate multiple stress responses. This technical guide explores H2O2 signaling mechanisms, crosstalk with other signaling molecules, and quantitative variation patterns under stress conditions. Framed within the context of electrochemical nanosensor development for in planta H2O2 monitoring, we provide comprehensive data tables, experimental methodologies, and pathway visualizations to facilitate advanced research into plant stress acclimation mechanisms. Recent advances in enzymeless electrochemical detection using nanomaterial-based sensors offer unprecedented opportunities for real-time, precise monitoring of H2O2 flux in plant systems, enabling deeper understanding of its dual role in oxidative damage and stress signaling.
Hydrogen peroxide functions as a significant regulatory component interconnected with signal transduction in plants, particularly under stressful environmental conditions [1]. While historically viewed primarily as a damaging oxidant, H2O2 is now recognized as a crucial signaling molecule that maintains cellular homeostasis in crop plants [1]. The concentration-dependent duality of H2O2 action defines its functional roles: at nanomolar levels, it acts as a signaling molecule that facilitates seed germination, chlorophyll content, stomatal opening, and delays senescence, whereas at elevated concentrations, it triggers oxidative damage to organic molecules, potentially leading to cell death [1].
The signaling capacity of H2O2 stems from its physicochemical properties, including relative stability compared to other ROS (half-life of approximately 1 ms), capacity to diffuse across membranes via aquaporins, and ability to oxidize specific target proteins [2] [3]. These characteristics enable H2O2 to participate in sophisticated signaling networks that coordinate plant growth, development, and stress adaptation. The complexity of H2O2-mediated regulation increases throughout the phylogenetic tree, reaching sophisticated levels in higher plants where multiple sensors and pathways converge to regulate transcription factors at multiple levels [4].
H2O2 Homeostasis: Production and Scavenging Systems
H2O2 Production Pathways
H2O2 in plant cells originates from multiple subcellular compartments through both enzymatic and non-enzymatic pathways [3]. The major sites of H2O2 production include:
Chloroplasts: H2O2 generation occurs primarily through the reduction of molecular oxygen by photosynthetic electron transport (PET) chain components, including Fe-S centers, reduced thioredoxin, ferredoxin, and reduced plastoquinone [3]. The Mehler reaction represents a significant source of H2O2 production in chloroplasts during photosynthesis [3].
Peroxisomes: These organelles are crucial sites for H2O2 production during photorespiration, where glycolate oxidation in the photosynthetic carbon oxidation cycle generates substantial H2O2 [3]. Peroxisomal matrix enzymes like glycolate oxidase directly produce H2O2 as a metabolic byproduct.
Mitochondria: During aerobic respiration, electron transport chains at complexes I and III generate superoxide radicals that are rapidly converted to H2O2 by superoxide dismutase (SOD) enzymes [3].
Apoplast: NADPH oxidases (RBOHs) located in the plasma membrane generate superoxide which is dismutated to H2O2, while cell wall peroxidases can directly produce H2O2 [2] [3]. This apoplastic H2O2 production is particularly important for signaling processes such as stomatal closure and defense responses.
Table 1: Major Enzymatic Sources of H2O2 in Plant Cells
| Enzyme | Subcellular Location | Function | Signaling Role |
|---|---|---|---|
| NADPH Oxidases (RBOHs) | Plasma membrane, Apoplast | Superoxide production converted to H2O2 | Defense responses, stomatal closure, root growth |
| Cell Wall Peroxidases | Apoplast | Direct H2O2 production | Cell wall cross-linking, defense |
| Glycolate Oxidase | Peroxisomes | Photorespiratory H2O2 production | Metabolic signaling, stress response |
| Superoxide Dismutase | Multiple compartments | Superoxide dismutation to H2O2 | First-line antioxidant defense |
| Oxalate Oxidase | Apoplast | Pathogen-induced H2O2 production | Defense against pathogens |
H2O2 Scavenging Systems
Plants maintain sophisticated antioxidant systems comprising both enzymatic and non-enzymatic components that regulate H2O2 levels and prevent oxidative damage [3]:
Enzymatic Scavengers: Include catalase (CAT) in peroxisomes, ascorbate peroxidase (APX) in chloroplasts, cytosol, and mitochondria, glutathione reductase (GR), and various peroxidases (POX) [3]. These enzymes exist in different organelles and efficiently decrease H2O2 content to maintain membrane stability and cellular homeostasis.
Non-enzymatic Antioxidants: Ascorbate (AsA) and glutathione (GSH) constantly participate in regulating ROS levels [3]. AsA directly reacts with H2O2, while GSH regenerates AsA and rapidly oxidizes excess H2O2, thereby regulating redox balance in plant cells.
The dynamic equilibrium between H2O2 production and removal establishes specific H2O2 signatures that vary in time, space, and concentration, enabling the encoding of specific signaling information under different physiological conditions [2].
H2O2 Signaling Mechanisms in Stress Responses
Molecular Mechanisms of Signal Transduction
H2O2 signaling involves multiple molecular mechanisms that regulate transcriptional and post-translational events:
Protein Oxidation: H2O2 specifically oxidizes cysteine and methionine residues in target proteins, leading to reversible sulfenic acid formation or disulfide bonds that alter protein function [2] [4]. This oxidative post-translational modification represents a fundamental mechanism for H2O2 signal transduction.
Calcium Signaling: H2O2 activates the plasma membrane-localized receptor kinase HPCA1, which mediates Ca2+ influx into the cytosol by activating calcium channels [2]. The resulting calcium spikes interact with ROS production, creating amplification loops essential for stress signaling.
Transcriptional Regulation: H2O2 modulates transcription factor activity through multiple mechanisms, including synthesis (transcription, mRNA stability, translation), stability (ubiquitin-proteasome regulation), cytoplasm-nuclear trafficking, and DNA binding affinity [4]. This multi-level regulation enables sophisticated control of gene expression patterns.
Chromatin Remodeling: Emerging evidence indicates H2O2 influences epigenetic landscapes by modifying chromatin structure, thereby establishing "stress memory" through priming mechanisms that enable more robust responses to subsequent stresses [2].
H2O2 Signaling Pathways and Crosstalk
H2O2 does not function in isolation but participates in extensive signaling crosstalk with other key signaling molecules and plant growth regulators:
Phytohormone Interactions: H2O2 interacts synergistically or antagonistically with auxins, gibberellins, cytokinins, abscisic acid, jasmonic acid, ethylene, salicylic acid, and brassinosteroids under myriad environmental stresses [1]. This crosstalk enables fine-tuning of growth-defense balance.
Nitric Oxide (NO) Crosstalk: Both H2O2 and NO are generated under similar stress conditions with comparable kinetics and interact functionally to modulate transduction processes in plants [3]. This interplay is particularly important for stomatal closure and defense responses.
Calcium Signaling Integration: Complex interactions exist between H2O2 and Ca2+ in response to development and abiotic stresses, with each capable of activating the other in self-amplifying loops that enhance signal specificity and amplitude [3].
The following diagram illustrates the core H2O2 signaling pathway and its integration with other signaling components:
H2O2 Signaling Pathway in Plant Stress Response
Quantitative H2O2 Dynamics Under Abiotic Stress
Concentration-Dependent Responses
H2O2 exhibits concentration-dependent effects that determine its functional outcome in plant cells. The threshold concentrations separating signaling from oxidative damage vary by species, tissue type, and developmental stage:
Table 2: H2O2 Concentration Effects on Plant Physiological Processes
| H2O2 Concentration Range | Physiological Role | Observed Effects | Reference |
|---|---|---|---|
| 0.02 - 0.05 μM | Normal signal transduction | Baseline cellular signaling, growth regulation | [5] |
| 0.05 μM - 10 μM | Priming and acclimation | Enhanced stress tolerance, antioxidant activation | [2] |
| 10 μM - 100 μM | Stress signaling activation | Defense gene expression, stomatal closure | [1] [3] |
| >100 μM | Oxidative stress threshold | Cellular damage, protein oxidation, lipid peroxidation | [1] |
| >500 μM | Cell death triggering | Programmed cell death, senescence induction | [1] |
H2O2 Variation Patterns Under Specific Stresses
Quantitative studies reveal distinctive H2O2 accumulation patterns under different abiotic stress conditions:
Light Stress: Research on Egeria densa demonstrates that H2O2 concentration increases with photosynthetically active radiation (PAR) intensity, with concentrations rising steadily at 100-200 μmol m⁻² s⁻¹ PAR, while low light conditions (30 μmol m⁻² s⁻¹) did not induce significant H2O2 accumulation [5]. Diurnal H2O2 concentration variations follow PAR patterns, with concentrations peaking in the afternoon due to delayed antioxidant enzyme activities [5].
Heavy Metal Stress: H2O2 plays a significant role in heavy metal stress signaling, with production often linked to NADPH oxidase activation [1] [3]. The crosstalk between H2O2 and other plant growth regulators under heavy metal stress facilitates complex transcriptional reprogramming that determines metal tolerance or sensitivity [1].
Iron Stress: In Egeria densa, H2O2 concentration gradually increases with Fe concentration in the media, except at very low concentrations [5]. Under extremely high Fe concentrations, chlorophyll contents decline first, followed by H2O2 concentration reduction, shoot growth rate, and antioxidant activities [5].
The diagram below illustrates the relationship between stress intensity, H2O2 accumulation, and physiological outcomes:
H2O2 Dynamics Across Stress Intensities
Electrochemical Nanosensors for H2O2 Monitoring
Advanced Sensing Platforms
Recent advances in nanomaterial-based sensors have revolutionized H2O2 detection capabilities, offering enhanced sensitivity, selectivity, and potential for in planta monitoring:
Enzymeless Electrochemical Sensors: A recent development demonstrates NiO octahedron-decorated 3D graphene hydrogel (3DGH/NiO) composites functioning as highly sensitive H2O2 biosensors [6]. The optimized 3DGH/NiO25 nanocomposite exhibited superior electrochemical performance toward H2O2 sensing with high sensitivity (117.26 µA mM⁻¹ cm⁻²), wide linear range (10 µM–33.58 mM), and low detection limit (5.3 µM) [6].
Colorimetric Nanoparticle Sensors: Gold nanoparticles (AuNPs) functionalized with specific biomolecules enable visual H2O2 detection through aggregation-based color transitions [7]. Optimal parameters include decahedral nanoparticles with 30 nm edge length forming clusters of 10 units at 2 nm interparticle distance, providing the most significant red-to-blue color transition in RGB space [7].
Enzyme-Based Biosensors: Traditional biosensors utilizing enzymes like horseradish peroxidase offer high specificity but suffer from drawbacks including high cost, complicated fabrication, and lack of stability, limiting their commercial application [6].
The Scientist's Toolkit: Key Research Reagents and Materials
Table 3: Essential Research Reagents for H2O2 Sensing and Signaling Studies
| Reagent/Material | Function/Application | Key Characteristics | Reference |
|---|---|---|---|
| 3D Graphene Hydrogel (3DGH) | Electrode material for H2O2 sensing | Large surface area, high electrical conductivity, controllable porosity | [6] |
| NiO Octahedrons | Electrocatalyst for H2O2 detection | Low toxicity, facile preparation, good electrochemical activity | [6] |
| Gold Nanoparticles (Spherical, Cubic, Decahedral) | Colorimetric H2O2 sensing | Tunable LSPR properties, size/shape-dependent optical properties | [7] |
| Mesoporous Silica SBA-15 | Hard template for nanoparticle synthesis | Controlled morphology, high surface area | [6] |
| DNA Oligonucleotides | Functionalization of nanoparticles for targeted sensing | Programmable recognition, tunable stability | [7] |
| Aquaporin Modulators | Study H2O2 membrane transport | Investigate cellular H2O2 uptake mechanisms | [2] |
| NADPH Oxidase Inhibitors | Dissect H2O2 production pathways | Specific inhibition of apoplastic H2O2 production | [3] |
Experimental Protocols for H2O2 Research
Nanocomposite Sensor Fabrication Protocol
Based on the 3DGH/NiO sensor development [6]:
Synthesis of NiO Octahedrons:
- Dissolve 10 mg silica (SBA-15) in 100 ml anhydrous ethanol containing 10 mg nickel nitrate hexahydrate
- Stir for 24 hours at room temperature
- Dry at 80°C for 48 hours
- Grind powder and repeat rinsing procedure
- Calcinate at 550°C for 3 hours at 2°C min⁻¹ heating rate
- Remove silica template by treating with 2 M NaOH at 60°C
- Wash with ethanol and water repeatedly, dry at 70°C for 12 hours
Self-Assembly of 3DGH/NiO Nanocomposite:
- Disperse 48 mg graphene oxide in 32 mL deionized water containing 12 mg NiO octahedrons
- Bath-sonicate for 2 hours followed by prop-sonication for 1.5 hours
- Transfer mixture to 45 mL Teflon-lined autoclave
- Maintain at 180°C for 12 hours
- Cool naturally to room temperature
- Wash product with deionized water and freeze-dry
Electrode Preparation and Characterization:
- Characterize morphology and structure using FE-SEM, HR-TEM, XRD, TGA, and Raman spectroscopy
- Perform electrochemical sensing using cyclic voltammetry and chronoamperometry
- Validate sensor performance in real samples (e.g., milk, plant tissues)
Plant Stress Priming and H2O2 Measurement Protocol
Based on established plant priming methodologies [2]:
H2O2 Priming Treatment:
- Administer H2O2 via seed treatment, foliar spraying, or root application
- Optimize concentration based on species and developmental stage (typically 1-10 mM for most species)
- Duration ranges from 1 hour (root pretreatment) to 12 hours (foliar application)
- Allow recovery period (typically 4 days) before stress application
Stress Application and Sampling:
- Apply abiotic stress (salt, drought, heat, cold, heavy metals) at defined intensity and duration
- Collect tissue samples at multiple timepoints (0, 1, 3, 6, 12, 24, 48 hours)
- Immediately freeze in liquid N2 and store at -80°C until analysis
H2O2 Quantification Methods:
- Spectrophotometric methods using xylenol orange, titanium sulfate, or FOX reagents
- Microscopic detection with H2DCF-DA or other fluorescent probes
- Electrochemical detection using fabricated nanosensors
- HPLC-based methods for improved specificity
The following diagram illustrates the experimental workflow for studying H2O2-mediated stress priming:
Experimental Workflow for H2O2 Priming Studies
H2O2 functions as a central signaling molecule in plant defense and stress response through complex networks that integrate multiple production sources, scavenging systems, and molecular targets. The concentration-dependent effects, spatiotemporal patterning, and sophisticated crosstalk mechanisms enable H2O2 to coordinate appropriate physiological responses across varying stress intensities and durations. Advances in electrochemical nanosensing platforms, particularly enzymeless sensors based on nanocomposite materials, offer unprecedented opportunities for real-time monitoring of H2O2 dynamics in plant systems. These technological innovations will facilitate deeper understanding of H2O2 signaling specificity and enable development of targeted strategies for enhancing crop stress resilience in changing climate conditions.
Future research directions should focus on: (1) developing implantable nanosensors for continuous in planta H2O2 monitoring; (2) elucidating spatiotemporal patterning of H2O2 signals at subcellular resolution; (3) engineering H2O2 biosensors with expanded dynamic range and specificity; and (4) integrating H2O2 signaling data with computational models to predict plant stress responses. The integration of advanced sensing technologies with molecular biology approaches will unlock new dimensions in understanding H2O2 as a central regulator of plant stress acclimation.
Hydrogen peroxide (H₂O₂) is a central reactive oxygen species (ROS) that plays a dual role in biological systems, acting as a crucial signaling molecule at physiological levels while contributing to oxidative stress and cellular damage at elevated concentrations [8]. Its detection is therefore vital across numerous fields, from plant physiology to biomedical research. Conventional methods for H₂O₂ detection, primarily encompassing colorimetric, fluorescence, and histochemical approaches, have facilitated much of our current understanding of ROS biology. However, these methods present significant limitations that restrict their application, particularly in complex, real-time monitoring scenarios such as in planta (within plants) studies.
This technical guide provides a critical analysis of these conventional H₂O₂ detection methodologies, framing their limitations within the context of advancing electrochemical nanosensors for plant monitoring. As research progresses toward in situ and real-time analysis, understanding the constraints of established techniques becomes imperative for developing more robust, sensitive, and applicable sensing solutions.
Critical Analysis of Conventional H₂O₂ Detection Methods
The tables below summarize the fundamental principles and specific limitations of the primary conventional H₂O₂ detection methods.
Table 1: Overview and Limitations of Conventional H₂O₂ Detection Methods
| Method Category | Core Principle | Key Limitations | Typical Experimental Workflow |
|---|---|---|---|
| Colorimetry | Measurement of absorbance change from a dye product formed via H₂O₂ reaction, often enzyme-mediated (e.g., Horseradish Peroxidase) [9]. | Low spatial resolution; Susceptible to optical interference (e.g., from chlorophyll); Requires sample preparation/extraction; Not suitable for in situ mapping [10]. | 1. Sample collection and homogenization.2. Reaction with colorimetric substrate (e.g., Amplex Red).3. Absorbance measurement with a spectrophotometer.4. Data correlation to H₂O₂ concentration. |
| Fluorescence | Detection of fluorescence signal enhancement or shift from a probe upon reaction with H₂O₂ (e.g., boronate oxidation) [11] [12]. | Autofluorescence interference (e.g., from plant pigments); Photobleaching; Limited tissue penetration depth; Often requires complex synthesis of probes [10] [13]. | 1. Incubation of live cells/tissues with fluorescent probe (e.g., CMB [11]).2. Washing steps to remove excess probe.3. Excitation and fluorescence signal capture via microscopy.4. Image analysis for quantification. |
| Histochemical Staining | Use of reagents (e.g., DAB) that form insoluble, visible precipitates upon H₂O₂-mediated oxidation, providing spatial localization [8]. | Semi-quantitative at best; Can be cytotoxic; May involve harsh staining conditions; Not suitable for dynamic, real-time monitoring [8]. | 1. Treatment of biological samples with staining reagent.2. Incubation for precipitate formation.3. Sample fixation and sectioning (if needed).4. Microscopic observation and scoring. |
Table 2: Performance Metrics and Practical Constraints
| Method | Reported Detection Limit | Response Time | Key Bio-Interferences | Suitability for In Planta Use |
|---|---|---|---|---|
| Colorimetric (e.g., Amplex Red) | ~0.1 - 0.5 μM [10] | Minutes to Hours | Phenolic compounds, other peroxidase substrates | Low: Destructive, requires extraction. |
| Fluorescent Probes (e.g., CMB) | ~0.13 μM [11] | Minutes to stability [11] | Autofluorescence (chlorophyll), other ROS (¹O₂, ONOO⁻) [11] [9] | Moderate: Can image in live tissue, but interference and penetration are major issues. |
| Histochemical Staining (e.g., DAB) | N/A (Semi-quantitative) | 30+ minutes | Endogenous peroxidases, background pigmentation | Low to Moderate: Provides spatial data but is not quantitative or real-time. |
The following diagram illustrates the general decision-making workflow and core limitations a researcher faces when applying these conventional methods to a biological system like a plant leaf.
Detailed Experimental Protocols for Conventional Methods
To elucidate the practical challenges, detailed protocols for key conventional methods are outlined below.
Protocol: Fluorescence Imaging of H₂O₂ in Live Cells using a Boronate-Based Probe (e.g., CMB)
This protocol is adapted from studies using coumarin-based fluorescent probes like CMB [11] [12].
Principle: The probe (CMB) contains an aryl boronate group that acts as a recognition site for H₂O₂. The binding of H₂O₂ oxidizes the boronate, leading to a structural change that "turns on" the fluorescence of the coumarin fluorophore, resulting in a signal enhancement of up to 25-fold [11].
Key Reagents:
- Probe CMB (synthesized from coumarin derivatives and 4-bromomethylphenylborate pinacol ester) [11] [12].
- Appropriate cell culture media (e.g., for MCF-7, RAW264.7, or SW480 cells).
- Phosphate Buffered Saline (PBS), pH 7.4.
- Hydrogen Peroxide (H₂O₂) stock solution for calibration.
Procedure:
- Cell Culture and Seeding: Culture adherent cells (e.g., MCF-7) in suitable media. Seed cells into sterile glass-bottom culture dishes or multi-well plates and allow them to adhere for 24 hours.
- Probe Loading: Replace the culture medium with a fresh, serum-free medium containing the CMB probe at a concentration of 1-10 μM. Incubate the cells for 20-30 minutes at 37°C in a CO₂ incubator.
- Washing: Gently wash the cells 2-3 times with pre-warmed PBS (pH 7.4) to remove any excess probe that has not been taken up by the cells.
- Stimulation (Optional): To monitor changes in H₂O₂ levels, treat cells with stimulants (e.g., rotenone for endogenous production [11]) or directly add exogenous H₂O₂ to the medium.
- Fluorescence Imaging: Acquire images using a fluorescence microscope or confocal laser scanning microscope with an excitation wavelength of ~400 nm and an emission collection window around 450 nm [11] [12].
- Data Analysis: Quantify the fluorescence intensity from regions of interest (e.g., cytoplasm) using image analysis software. Generate a calibration curve by treating cells with known concentrations of H₂O₂.
Key Limitations in Practice:
- Photobleaching: Prolonged exposure to excitation light can irreversibly degrade the fluorescent signal, complicating long-term imaging.
- Autofluorescence: Intracellular components (e.g., flavins) and, critically for plants, chlorophyll, emit fluorescence that overlaps with the probe's signal, creating a high background [10] [9].
- Probe Kinetics: The response time, while often fast (minutes), may not capture the most rapid, transient bursts of H₂O₂ signaling.
Protocol: Histochemical Detection using a Permanent Stain (e.g., Peroxymycin-1)
This protocol is based on the use of advanced histochemical probes like Peroxymycin-1 [8].
Principle: Peroxymycin-1 is a caged puromycin derivative where the α-amino group is blocked by an H₂O₂-responsive boronic ester. Upon reaction with H₂O₂, the boronate is oxidized and undergoes self-immolation, releasing free puromycin. This free puromycin is then incorporated into nascent peptides by the ribosome, leaving a permanent, covalent mark on the cells or tissues at the moment of H₂O₂ exposure. This mark can be detected post-fixation using a standard immunofluorescence assay with an α-puromycin antibody [8].
Key Reagents:
- Peroxymycin-1 probe.
- Control compound (Ctrl-Peroxymycin-1, which cannot release puromycin).
- Fixative (e.g., 4% paraformaldehyde in PBS).
- Permeabilization buffer (e.g., Triton X-100 in PBS).
- Blocking buffer (e.g., BSA or serum in PBS).
- Primary antibody: Anti-puromycin antibody.
- Fluorescently-labeled secondary antibody.
Procedure:
- Probe Treatment: Incubate live cells or tissue samples with Peroxymycin-1 (e.g., 1 μM) for a defined period (e.g., 1-2 hours) to allow H₂O₂ sensing and puromycin incorporation.
- Fixation and Permeabilization: Wash samples with PBS to remove excess probe. Fix cells with 4% PFA for 15 minutes, followed by permeabilization with 0.1% Triton X-100 for 10-15 minutes.
- Immunostaining: Block samples with 1% BSA for 1 hour to prevent non-specific binding. Incubate with primary anti-puromycin antibody diluted in blocking buffer overnight at 4°C. Wash thoroughly and incubate with a fluorescent secondary antibody for 1 hour at room temperature.
- Imaging and Analysis: After final washes, mount samples and image using a fluorescence microscope. The fluorescence intensity correlates with the amount of H₂O₂ present during the probe incubation window.
Key Limitations in Practice:
- Temporal Resolution: This method provides a "snapshot" or cumulative record of H₂O₂ levels during the probe incubation period but offers no capability for real-time, dynamic monitoring [8].
- Cytotoxicity: The process relies on active protein synthesis, which can be disrupted by cellular stress. The fixation and staining process also kills the cells.
- Complexity: The multi-step protocol involving immunofluorescence is labor-intensive and subject to variability.
Research Reagent Solutions
The table below lists essential reagents and materials required for implementing the conventional H₂O₂ detection methods discussed.
Table 3: Key Research Reagents for Conventional H₂O₂ Detection
| Reagent/Material | Function/Description | Example from Literature |
|---|---|---|
| Boronate-based Fluorescent Probe | Small molecule that undergoes H₂O₂-specific oxidation, leading to a fluorescence "turn-on" response. | CMB probe [11]; Other coumarin-based probes [12] |
| Activity-based Histochemical Probe | A caged molecule (e.g., puromycin analogue) that is uncaged by H₂O₂, leaving a permanent, detectable mark. | Peroxymycin-1 [8] |
| 2-ketobutyrate | A chemical substrate that reacts non-enzymatically with H₂O₂, leading to the release of CO₂ which can be measured as a proxy for H₂O₂ concentration. | Used in a spectrophotometric assay with a Cr(III) molecular biosensor for CO₂ [9] |
| Anti-puromycin Antibody | Primary antibody used in immunofluorescence to detect the incorporated puromycin released from probes like Peroxymycin-1. | Key component for detecting Peroxymycin-1 signal in fixed samples [8] |
| Horseradish Peroxidase (HRP) | Enzyme used in many colorimetric assays to catalyze the H₂O₂-mediated oxidation of a chromogenic substrate. | Implicitly used in assays like Amplex Red; directly used in biohydrogel-enabled sensors [10] |
Conventional methods for detecting hydrogen peroxide have been instrumental in foundational biological research. However, their inherent limitations—including destructive sample preparation, susceptibility to optical interference, inability for real-time monitoring, and semi-quantitative outputs—severely restrict their utility for advanced applications such as in planta H₂O₂ monitoring [10]. These constraints highlight the critical need for alternative sensing platforms.
Electrochemical nanosensors represent a promising frontier, offering potential solutions to these challenges through direct, rapid, and highly sensitive measurement of H₂O₂, often with minimal sample perturbation. The development of enzymeless electrodes using nanocomposites like 3D graphene hydrogel/NiO [6] or coordination-based materials such as porphyrin-MOFs@MXenes [14] points toward a future of robust, real-time, and in situ H₂O₂ monitoring, paving the way for a deeper understanding of redox dynamics in complex biological systems like plants.
Electrochemical nanosensors represent a powerful class of analytical devices that combine the specificity of biological recognition with the sensitivity of nano-engineered transducers. These devices convert biochemical events into quantifiable electrical signals, enabling the detection of target analytes with remarkable precision [15]. The fundamental operation involves the precise interaction between a target molecule and a biological recognition element immobilized on a nanostructured transducer surface, generating electrical signals proportional to analyte concentration [16]. This technical guide examines the core principles governing electrochemical nanosensors, with particular emphasis on their application for in planta hydrogen peroxide (H₂O₂) monitoring, a crucial reactive oxygen species in plant signaling and stress responses [17] [18].
The exceptional performance of electrochemical nanosensors stems from their nanoscale dimensional features, which provide large surface-to-volume ratios, enhanced mass transport, and unique electronic properties that significantly improve detection limits, sensitivity, and response times compared to conventional sensors [16]. The following sections provide a comprehensive analysis of transduction mechanisms, key components, functional nanomaterials, and experimental protocols essential for developing high-performance nanosensing platforms for H₂O₂ monitoring in plant systems.
Fundamental Transduction Mechanisms
Electrochemical transduction mechanisms form the foundation of signal generation in nanosensors. These mechanisms exploit the electrical changes occurring at the electrode-electrolyte interface when target analytes undergo redox reactions or interact with recognition elements. The table below summarizes the primary transduction methods employed in electrochemical nanosensors.
Table 1: Fundamental Transduction Mechanisms in Electrochemical Nanosensors
| Transduction Mechanism | Measured Parameter | Principle of Operation | Key Advantages |
|---|---|---|---|
| Amperometric | Current | Measurement of current generated by electrochemical oxidation/reduction of analyte at constant applied potential [19] | High sensitivity, low detection limits, real-time monitoring |
| Potentiometric | Potential/Voltage | Measurement of potential difference at electrode-electrolyte interface under zero-current conditions [19] | Simple instrumentation, wide concentration range |
| Impedimetric | Impedance | Measurement of resistance and reactance changes at electrode surface using AC potential [15] [19] | Label-free detection, suitable for binding studies |
| Conductometric | Conductance | Measurement of changes in electrical conductivity of medium between electrodes [15] | Simple design, suitable for gas sensing |
| Voltammetric | Current vs. Voltage | Measurement of current while varying applied potential over a range [15] | Rich electrochemical information, multiple analyte detection |
For H₂O₂ detection specifically, the electrochemical reaction can proceed via either reduction or oxidation pathways, depending on the applied potential and electrode material [20]. The reduction pathway typically occurs at lower potentials, making it advantageous for complex matrices like plant tissues where interfering compounds may be present:
- In acidic conditions: H₂O₂ + 2H⁺ + 2e⁻ → 2H₂O
- In neutral/basic conditions: H₂O₂ + 2e⁻ → 2OH⁻ [20]
The oxidation pathway follows: H₂O₂ → O₂ + 2H⁺ + 2e⁻, but typically requires higher overpotentials on conventional electrodes [20].
Key Components and Architecture
Electrochemical nanosensors comprise several integrated components that work in concert to achieve specific and sensitive detection. The precise arrangement and material selection for each component critically determine overall sensor performance.
Core Sensor Architecture
Diagram 1: Core components of an electrochemical nanosensor showing the signal transduction pathway from biorecognition to measurable output.
Biorecognition Elements
The biorecognition layer provides molecular specificity for target analyte detection. In H₂O₂ sensing, both biological enzymes and enzyme-mimicking nanomaterials (nanozymes) are employed:
Enzymatic Recognition: Horseradish peroxidase (HRP), catalase, and cholesterol oxidase (ChOx) have been utilized for H₂O₂ detection [17] [18]. These enzymes catalyze the oxidation or reduction of H₂O₂, generating measurable electronic signals. For instance, ChOx enhances H₂O₂ detection sensitivity by 21-fold compared to non-enzymatic approaches [17].
Nanozymes: Metal-based nanomaterials (Pt-Ni hydrogels, Bi₂O₃/Bi₂O₂Se) exhibit intrinsic peroxidase-like activity, catalyzing the same reactions as natural enzymes while offering superior stability and lower cost [18] [20]. Pt-Ni hydrogels demonstrate exceptional catalytic activity with Michaelis constant (Kₘ) values lower than HRP, indicating higher substrate affinity [18].
Nanomaterial Interfaces
Nanomaterials form the critical interface between biological recognition events and signal transduction. The table below compares key nanomaterials used in H₂O₂ electrochemical sensing.
Table 2: Performance Comparison of Nanomaterials for H₂O₂ Detection
| Nanomaterial | Sensitivity | Linear Range | Detection Limit | Stability | Reference |
|---|---|---|---|---|---|
| 3DGH/NiO25 Nanocomposite | 117.26 µA mM⁻¹ cm⁻² | 10 µM - 33.58 mM | 5.3 µM | Good long-term stability | [6] |
| Pt-Ni Hydrogel | Not specified | 0.50 µM - 5.0 mM | 0.15 µM (electrochemical) | Excellent (60 days) | [18] |
| Bi₂O₃/Bi₂O₂Se Nanocomposite | 75.7 µA µM⁻¹ cm⁻² | 0 - 15 µM | Not specified | High stability | [20] |
| PMWCNT/ChOx | 26.15 µA/mM | 0.4 - 4.0 mM | 0.43 µM | Good operational stability | [17] |
Carbon Nanomaterials: Carbon nanotubes (CNTs) and graphene derivatives provide exceptional electrical conductivity and large surface areas for biomolecule immobilization. Single-walled carbon nanotubes (SWCNTs) facilitate electron-transfer reactions for biological molecules, while multi-walled carbon nanotubes (MWCNTs) offer excellent conduction and electrocatalytic characteristics [16]. Three-dimensional graphene hydrogels (3DGH) overcome the restacking issues of 2D graphene, providing superior porosity and electrochemically active sites [6].
Metal and Metal Oxide Nanomaterials: Nickel oxide (NiO) octahedrons exhibit excellent electrochemical activities toward H₂O₂ detection [6]. Bismuth-based materials (Bi₂O₃/Bi₂O₂Se) offer eco-friendly alternatives with high sensitivity and selectivity [20]. Pt-Ni hydrogels with dual structures of alloyed nanowires and Ni(OH)₂ nanosheets create highly porous structures with abundant active sites [18].
Experimental Protocols for H₂O₂ Nanosensors
Sensor Fabrication Workflow
Diagram 2: Experimental workflow for fabrication and application of H₂O₂ electrochemical nanosensors.
Detailed Fabrication Procedures
Nanomaterial Synthesis Protocols:
NiO Octahedrons/3D Graphene Hydrogel Nanocomposite:
- Synthesize NiO octahedrons using mesoporous silica SBA-15 as a hard template with nickel nitrate hexahydrate precursor
- Calcinate at 550°C for 3 hours followed by silica template removal with NaOH treatment
- Self-assemble NiO with graphene oxide via hydrothermal method at 180°C for 12 hours to form 3DGH/NiO nanocomposites [6]
Pt-Ni Hydrogels:
- Coreduce mixed metal salt solution (H₂PtCl₆ and NiCl₂) with sodium borohydride (NaBH₄)
- Control Pt/Ni atomic ratios by tuning precursor concentrations
- Form highly porous dual gel structures comprising alloyed nanowires and Ni(OH)₂ nanosheets [18]
Bi₂O₃/Bi₂O₂Se Nanocomposites:
- Use solution-processing method with bismuth nitrate pentahydrate and selenium powder
- Employ hydrazine hydrate as reducing agent
- Vary synthesis time (10 minutes to 7 days) to control composition and structure [20]
Electrode Modification Methods:
- MWCNT Paste Electrode with Cholesterol Oxidase:
- Activate MWCNTs with nitric and sulfuric acid treatment
- Mix activated MWCNTs with mineral oil (70/30 w/w ratio) to form paste
- Drop-cast enzyme solution (ChOx, 20 U/mL) onto electrode surface
- Dry at room temperature for 10 minutes before use [17]
Electrochemical Characterization Techniques
Cyclic Voltammetry (CV): Employ scan rates typically from 0.01 to 0.5 V/s in potential windows suitable for H₂O₂ redox reactions (e.g., -0.8 V to 0.2 V) [17]. CV provides information on electron transfer kinetics and catalytic behavior.
Electrochemical Impedance Spectroscopy (EIS): Perform in frequency range 0.1 Hz to 100 kHz with amplitude of 5-10 mV to monitor interface changes during modification and binding events [17].
Amperometry: Apply constant potential near H₂O₂ reduction/oxidation potential (e.g., -0.7 V for reduction, +0.5 V for oxidation) while measuring current response to successive H₂O₂ additions [17] [20].
Chronoamperometry: Measure current transient after potential step to study reaction mechanisms and calculate diffusion coefficients [6].
The Researcher's Toolkit: Essential Materials and Reagents
Table 3: Essential Research Reagents for H₂O₂ Nanosensor Development
| Category | Specific Examples | Function/Purpose | Representative Sources |
|---|---|---|---|
| Carbon Nanomaterials | MWCNTs, SWCNTs, graphene oxide, 3D graphene hydrogel | Electrode scaffolding, electron transfer enhancement, surface area expansion | Sigma-Aldrich [6] [17] |
| Metal Precursors | Nickel nitrate hexahydrate, chloroplatinic acid, bismuth nitrate pentahydrate | Synthesis of metal/metal oxide nanoparticles and nanocomposites | Sigma-Aldrich, Thermo Scientific [6] [18] [20] |
| Biorecognition Elements | Cholesterol oxidase, horseradish peroxidase, antibodies | Specific molecular recognition of H₂O₂ | Sigma-Aldrich [17] |
| Electrode Materials | Glassy carbon, screen-printed electrodes, Ag/AgCl reference electrodes | Sensor platform construction | BAS Inc., commercial suppliers [17] [18] |
| Buffer Components | Phosphate buffer (NaH₂PO₄/Na₂HPO₄), KCl | Electrolyte solution for controlled pH and ionic strength | Sigma-Aldrich, Samchun Pure Chemical [6] [17] |
| Chemical Modifiers | Nafion solution, EDC/NHS coupling reagents | Biomolecule immobilization, membrane formation | Sigma-Aldrich [17] [20] |
Application to In Planta H₂O₂ Monitoring
The implementation of electrochemical nanosensors for in planta H₂O₂ monitoring requires special considerations for plant matrix complexity, minimally invasive measurement, and sensor biocompatibility. Successful applications demonstrate the feasibility of these approaches:
Real-time H₂O₂ Monitoring in Living Cells: Pt-Ni hydrogel-based sensors have successfully detected H₂O₂ released from HeLa cells, showing excellent correlation with standard UV-vis spectrophotometric methods (1.97 μM vs 2.08 μM) [18]. This approach can be adapted for plant systems.
Matrix Effect Management: Plant tissues contain numerous interfering compounds (phenolics, organic acids, ascorbic acid). Nanosensor design must incorporate strategies to mitigate interference through:
- Optimal potential selection for H₂O₂ reduction (-0.7 V to 0 V vs Ag/AgCl)
- Use of selective membranes (Nafion)
- Employing nanocomposites with inherent selectivity [20]
Miniaturization for Plant Integration: Development of micrometer-scale sensors enables implantation in plant tissues with minimal damage. Screen-printed electrodes and microelectrode arrays provide platforms suitable for plant studies [18].
Electrochemical nanosensors for H₂O₂ detection represent a convergence of nanotechnology, electrochemistry, and biological sensing. The fundamental principles outlined—covering transduction mechanisms, nanomaterial interfaces, and fabrication protocols—provide a foundation for developing advanced sensors tailored to in planta applications. The exceptional performance of recently developed nanocomposites, including 3D graphene/NiO structures, Pt-Ni hydrogels, and Bi₂O₃/Bi₂O₂Se heterostructures, demonstrates the rapid advancement in this field. As these technologies mature, their integration into plant science research will unlock new capabilities for understanding H₂O₂ signaling in plant development, stress responses, and adaptive processes.
The development of electrochemical nanosensors for the direct monitoring of hydrogen peroxide (H₂O₂) within plant systems (in planta) represents a cutting-edge frontier in plant science. H₂O₂ is a crucial reactive oxygen species functioning as a key signaling molecule in plant growth, development, and stress responses [21]. Accurate, real-time monitoring of H₂O₂ flux in planta is therefore paramount to understanding plant physiology. Nanomaterials have emerged as transformative components in these sensing platforms, offering significant advantages over conventional materials. This technical guide details how the enhanced sensitivity, superior biocompatibility, and exceptional catalytic properties of nanomaterials are specifically engineered to advance the field of in planta H₂O₂ monitoring, providing a foundation for a broader thesis in this specialized research area.
Core Advantages of Nanomaterials in H₂O₂ Sensing
The integration of nanomaterials into electrochemical biosensors confers three primary advantages that address the specific challenges of in planta H₂O₂ detection: enhanced sensitivity, tailored biocompatibility, and intrinsic catalytic activity.
Enhanced Sensitivity
The extreme sensitivity required to detect biologically relevant concentrations of H₂O₂ in a complex plant matrix is achieved through the unique physicochemical properties of nanomaterials.
- High Surface-to-Volume Ratio: Nanomaterials provide a dramatically increased surface area per unit mass, enabling a higher density of active sites for H₂O₂ interaction and reaction. This directly amplifies the electrochemical signal [22].
- Tunable Porosity and Morphology: The morphology of metal oxide nanoparticles (MO NPs)—including zero-dimensional, one-dimensional, two-dimensional, and three-dimensional structures—can be precisely controlled during synthesis. Three-dimensional nanostructures, such as 3D graphene hydrogel (3DGH), are particularly effective. They prevent the restacking of layers seen in 2D materials, thereby maintaining a large accessible surface area and numerous electrochemically active sites for enhanced sensitivity [6].
- Improved Electron Transfer: Nanomaterials like graphene possess high intrinsic electrical conductivity. When combined with catalytic metal oxides, they create synergistic composites that reinforce electron transport and ion diffusion, leading to faster response times and a stronger signal output [6].
Biocompatibility
For in planta applications, the sensor must interact minimally with the plant tissue to avoid inducing a stress response or altering the very processes being measured.
- Inherent Biocompatibility of Materials: Certain nanomaterials, such as gold nanoparticles (AuNPs), are noted for their high biocompatibility with living organisms [23]. This property is crucial for minimizing phytotoxicity when sensors are integrated into plant tissues.
- Surface Functionalization: The surfaces of nanomaterials can be readily modified with various biomolecules or polymers to enhance their biocompatibility and specificity. DNA-programmed nanomaterials, for example, leverage the inherent biocompatibility and molecular recognition capabilities of DNA to create highly specific and bio-friendly sensing interfaces [24].
- Eco-friendly Synthesis: Growing research focuses on green chemistry approaches for synthesizing biocompatible, stable, and eco-friendly nanoparticles (eco-NPs), which are ideal for use within biological systems like plants [22].
Catalytic Properties
Enzymeless (non-enzymatic) sensing is highly desirable for in planta applications due to the poor stability of natural enzymes under variable environmental conditions. Nanomaterials can serve as robust, synthetic enzyme mimics.
- Intrinsic Catalytic Activity: Transition metal oxides such as NiO, MnO₂, Co₃O₄, and Fe₃O₄ exhibit excellent electrocatalytic activity towards the oxidation or reduction of H₂O₂ [6] [21]. For instance, NiO octahedrons act as efficient electrocatalysts for H₂O₂ detection.
- Synergistic Effects in Composites: The integration of metal oxides with carbonaceous materials like graphene creates nanocomposites with superior catalytic performance. The metal oxide provides catalytic sites, while the carbon network ensures efficient electron transfer, resulting in enhanced sensitivity and stability [6].
- Stimulus-Responsive Behavior: Smart nanomaterials can be engineered with stimulus-responsive mechanisms (e.g., pH sensitivity), which could be leveraged to activate or enhance sensing only under specific physiological conditions within the plant [25].
Quantitative Performance of Nanomaterial-Based H₂O₂ Sensors
The advantages outlined above translate directly into quantifiable performance metrics for sensors. The following table summarizes data from recent studies on nanomaterial-based electrochemical biosensors for H₂O₂ detection, highlighting the impressive sensitivity, low detection limits, and wide linear dynamic ranges achievable.
Table 1: Performance Metrics of Selected Nanomaterial-Based H₂O₂ Biosensors
| Nanomaterial Composition | Sensitivity (µA mM⁻¹ cm⁻²) | Detection Limit (µM) | Linear Range (mM) | Biological Application / Test Context |
|---|---|---|---|---|
| 3DGH/NiO Octahedrons [6] | 117.26 | 5.3 | 0.01 – 33.58 | Detection in milk samples |
| 3D Porous Prussian Blue/Graphene Aerogel [6] | Not Specified | Not Specified | 0.005 – 4 | H₂O₂ Sensor |
| Precious Metal Alloys & Nanotubes [21] | Varies by composition | Varies by composition | Varies by composition | Real-time monitoring in MCF-7, HeLa, NIH-3T3, and A549 cells; studies in mouse models of pulmonary and liver fibrosis |
Experimental Protocols for Key Nanomaterial-Based Sensors
To translate these advantages into a functional sensor, robust and reproducible synthesis and fabrication protocols are essential. Below is a detailed methodology for constructing a high-performance nonenzymatic H₂O₂ sensor based on a 3D graphene hydrogel/NiO octahedron nanocomposite, a system with high relevance for potential in planta adaptation [6].
Synthesis of NiO Octahedrons using a Hard Template
- Objective: To prepare well-defined, nanostructured NiO with a controlled octahedral morphology.
- Materials: Mesoporous silica (SBA-15), nickel(II) nitrate hexahydrate (Ni(NO₃)₂·6H₂O), anhydrous ethanol (EtOH), sodium hydroxide (NaOH).
- Procedure:
- Impregnation: Dissolve 10 mg of SBA-15 silica in 100 mL of anhydrous ethanol containing 10 mg of Ni(NO₃)₂·6H₂O. Stir the mixture for 24 hours at room temperature to allow the precursor to infiltrate the porous template.
- Drying and Grinding: Dry the resulting mixture at 80°C for 48 hours. Grind the solid product into a fine powder.
- Calcination: Transfer the powder to a muffle furnace and calcinate at 550°C for 3 hours using a controlled heating rate of 2°C per minute. This step converts the nickel nitrate to nickel oxide while preserving the morphology dictated by the template.
- Template Removal: To remove the silica template, treat the calcinated product twice with a 2 M NaOH solution at 60°C. Wash the resulting NiO octahedrons repeatedly with ethanol and deionized water.
- Final Drying: Dry the purified NiO octahedrons in a vacuum oven at 70°C for 12 hours.
Self-Assembly of 3D Graphene Hydrogel/NiO (3DGH/NiO) Nanocomposite
- Objective: To integrate the NiO octahedrons into a porous, conductive 3D graphene network.
- Materials: Synthesized graphene oxide (GO), NiO octahedrons, deionized water.
- Procedure:
- Dispersion: Disperse 48 mg of GO and a specified amount of NiO octahedrons (e.g., 12 mg for a 25% wt composite) in 32 mL of deionized water. Use bath sonication for 2 hours followed by probe sonication for 1.5 hours to create a homogeneous mixture.
- Hydrothermal Assembly: Transfer the dispersion into a 45 mL Teflon-lined autoclave. Maintain the autoclave at 180°C for 12 hours. This hydrothermal process reduces GO and simultaneously self-assembles it into a 3D hydrogel embedded with NiO octahedrons.
- Post-processing: After naturally cooling to room temperature, wash the resulting 3DGH/NiO hydrogel numerous times with deionized water to remove any impurities.
- Freeze-Drying: Subject the hydrogel to freeze-drying to obtain a dry, aerogel-like nanocomposite while preserving its porous 3D structure.
Electrode Modification and Electrochemical Characterization
- Objective: To fabricate the working electrode and evaluate its sensing performance.
- Materials: 3DGH/NiO nanocomposite, glassy carbon electrode (GCE), Nafion solution, phosphate buffer solution (PBS, 0.1 M, pH 7.4).
- Electrode Preparation:
- Prepare an ink by dispersing the 3DGH/NiO nanocomposite in a mixture of water and a binder like Nafion.
- Drop-cast a precise volume of the ink onto the surface of a clean GCE and allow it to dry.
- Electrochemical Measurements:
- Cyclic Voltammetry (CV): Record CV curves in the absence and presence of H₂O₂ to observe the electrocatalytic response.
- Chronoamperometry: Apply a constant potential and measure the current response upon successive additions of H₂O₂. This is used to construct the calibration curve for determining sensitivity, linear range, and detection limit.
- Selectivity Testing: Evaluate the sensor's response against common interferents in plant systems, such as ascorbic acid, dopamine, uric acid, and sugars [6].
The workflow for this experimental process is summarized in the following diagram:
The Scientist's Toolkit: Essential Research Reagents and Materials
Building and operating a nanomaterial-based electrochemical nanosensor requires a specific set of materials and reagents. The following table catalogs key components, their functions, and considerations for their selection, particularly for in planta research.
Table 2: Essential Research Reagents and Materials for Nanomaterial-Based H₂O₂ Sensors
| Reagent/Material | Function/Description | Relevance to H₂O₂ Sensing & In Planta Research |
|---|---|---|
| Graphene Oxide (GO) | A precursor for forming 3D conductive hydrogel scaffolds. | Its large surface area and ability to form 3D porous structures are crucial for loading catalytic nanoparticles and facilitating analyte diffusion [6]. |
| Transition Metal Salts (e.g., Ni(NO₃)₂·6H₂O) | Precursors for the synthesis of catalytic metal oxide nanoparticles (MO NPs). | NiO, derived from this salt, exhibits excellent electrocatalytic activity for nonenzymatic H₂O₂ detection [6]. |
| Mesoporous Silica (SBA-15) | A "hard template" for controlling the morphology of nanoparticles. | Enables the synthesis of shape-controlled nanoparticles (e.g., NiO octahedrons), which can have enhanced catalytic properties [6]. |
| Phosphate Buffered Saline (PBS) | A standard physiological buffer for electrochemical testing. | Provides a stable ionic environment for in vitro calibration of sensors. In planta use may require different buffering systems compatible with apoplastic fluid. |
| Nafion Perfluorinated Resin | A ionomer used as a binder for electrode modification. | Helps immobilize the nanomaterial on the electrode surface and can improve selectivity by repelling anionic interferents. |
| Interferents (Ascorbic Acid, Dopamine, etc.) | Chemicals used for selectivity tests. | Essential for validating sensor specificity against compounds commonly found in plant tissues that could generate a false signal [6]. |
The advantages of nanomaterials—specifically their enhanced sensitivity, biocompatibility, and potent catalytic properties—are not merely incremental improvements but are foundational to the development of effective electrochemical nanosensors for in planta H₂O₂ monitoring. The quantifiable performance metrics and detailed experimental protocols outlined in this guide demonstrate the tangible translation of these abstract advantages into functional sensing platforms. As research progresses, the future of this field will likely involve the increased use of smart, stimulus-responsive nanomaterials [25] and sophisticated DNA-programmed assemblies [24] to create even more precise, robust, and plant-integrated sensors. These advancements will ultimately provide unprecedented insights into the intricate signaling roles of H₂O₂ in plant biology, contributing significantly to a broader thesis on the subject.
In the evolving landscape of precision agriculture and plant stress research, the real-time monitoring of hydrogen peroxide (H2O2) represents a critical analytical frontier. As the most stable reactive oxygen species (ROS) molecule within plant cells, H2O2 participates in cell signaling regulation and serves as a key indicator of plant defense gene expression upon exposure to biotic and abiotic stresses [26]. Traditional analytical techniques for H2O2 quantification, including chromatography and fluorescence-based methods, face significant limitations for in-field applications due to their destructive nature, laboratory dependency, and inability to provide real-time data [26]. The emergence of electrochemical nanosensors has fundamentally transformed this paradigm, enabling direct, in planta monitoring of H2O2 signaling pathways with unprecedented temporal and spatial resolution. This technical guide examines the complete spectrum of sensing technologies, from foundational laboratory-based electrochemical systems to cutting-edge wearable plant patches, providing researchers with a comprehensive framework for implementing these tools in plant science research and development.
Fundamental Principles of H2O2 Electrochemical Sensing
Electrochemical Detection Mechanisms
Electrochemical sensors for H2O2 detection operate primarily on two principles: oxidation and reduction. The enzymatic reduction pathway utilizing cholesterol oxidase (ChOx) has demonstrated significant analytical advantages. ChOx, a flavoenzyme oxidoreductase, catalyzes the electron transfer between H2O2 and the electrode surface. When immobilized on a multi-walled carbon nanotube paste (PMWCNT) electrode, this bio-platform enhances sensitivity for H2O2 detection by 21 times compared to non-enzymatic systems [17]. The system exhibits a sensitivity of 26.15 µA/mM across a linear range of 0.4 to 4.0 mM, with a limit of detection (LOD) of 0.43 µM and limit of quantification (LOQ) of 1.31 µM [17].
In silico studies, including molecular dynamics simulations and docking assays, have confirmed that the binding between ChOx and H2O2 is spontaneous, with labile interactions that promote rapid electrochemical reduction of H2O2 [17]. This fundamental understanding of the molecular recognition process enables more rational design of enzymatic biosensing platforms with optimized electron transfer kinetics.
H2O2 Signaling Pathway in Plant Stress Response
The following diagram illustrates the molecular signaling pathway of H2O2 production in plants under stress conditions and the corresponding detection mechanism of wearable electrochemical sensors:
This pathway highlights how environmental stressors trigger biochemical disruptions leading to H2O2 production, which serves both as a defense mechanism activator and as a detectable analyte for sensor systems. The wearable sensor detects these molecular signals before visible symptoms appear, enabling pre-symptomatic intervention.
Laboratory-Based Electrochemical Sensor Platforms
Advanced Electrode Design and Fabrication
Laboratory electrochemical systems for H2O2 monitoring employ sophisticated electrode designs with nanomaterial enhancements to achieve high sensitivity and selectivity. Carbon-based nanomaterials and metallic nanoparticles significantly enhance biosensor performance through their unique electrocatalytic properties, which facilitate increased electron transfer of redox-active species [26]. Specific electrode configurations include:
- Paper-based electroanalytical devices for detection of H2O2 and salicylic acid in tomato leaves infected with Botrytis cinerea pathogen, utilizing nano-gold modified indium tin oxide working electrodes [26].
- Miniaturized graphite rod electrodes for tryptophan detection in tomato fruits, causing less tissue damage during insertion while maintaining analytical performance [26].
- Microneedle array electrodes assembled with vertical graphene and core-shell Au@SnO2 nanoparticles for abscisic acid detection in cucumber fruits and Arabidopsis leaf juices, minimizing damage to plant tissues during insertion [26].
These electrode systems typically employ voltammetry (detecting H2O2 in tomato leaves) or chronocoulometry (measuring ABA in cucumber fruits) as primary detection methods, generating current-time curves that correlate with analyte concentration [26].
Experimental Protocol: PMWCNT/ChOx Biosensor Fabrication and Characterization
Materials and Reagents:
- Multi-walled carbon nanotubes (MWCNTs: outer diameter: 6-13 nm, length: 2.5-20 μm, purity >98%)
- Mineral oil
- Hydrogen peroxide (H2O2, 30% v/v aqueous solution)
- Microbial Cholesterol oxidase (ChOx) lyophilized powder
- Sodium phosphate buffer (PB) 0.050 M, pH 7.4
- Nitric acid (1 M) and sulfuric acid (1 M) for MWCNT activation
Sensor Fabrication Procedure:
- MWCNT Activation: Place MWCNTs in 1 M nitric acid solution and sonicate for 30 minutes. Filter and transfer to 1 M sulfuric acid solution with sonication for 30 minutes. Repeat this process twice. Finally, filter activated MWCNTs and wash extensively with ethanol and acetone until washing residues reach neutral pH [17].
- Paste Preparation: Mix activated MWCNTs and mineral oil in a 70/30 w/w ratio to form PMWCNT paste [17].
- Electrode Assembly: Polish glassy carbon cylinder surface with 1 μm and 0.5 μm alumina slurry. Rinse with deionized water and sonicate for 1 minute to remove residues. Dry with nitrogen gas and pack PMWCNT paste onto the glassy carbon contact [17].
- Enzyme Immobilization: Drop-cast 10 μL of ChOx (20 U/mL) solution onto the PMWCNT surface. Allow to dry for 10 minutes at room temperature before use [17].
Electrochemical Characterization:
- Perform cyclic voltammetry from -0.80 V to 0.20 V at a scan rate of 0.10 V/s in phosphate buffer
- Conduct electrochemical impedance spectroscopy in the same buffer
- Amperometric H2O2 quantification: Apply constant potential in PB solution with H2O2 concentrations from 0.4 to 4.0 mM [17]
Wearable Plant Patch Technologies
Design and Operating Principles
Wearable plant patches represent the most advanced application of electrochemical sensors for in planta H2O2 monitoring. These patches incorporate innovative design elements that enable direct, minimally invasive attachment to plant surfaces:
- Microneedle Array: A flexible base containing microscopic plastic needles across its surface that penetrate the plant cuticle with minimal damage [27].
- Chitosan-based Hydrogel: Coated on the microneedle array, this hydrogel contains an enzyme that reacts with H2O2 to produce electrons and reduced graphene oxide to conduct those electrons through the sensor [27].
- Multi-Electrode System: Advanced designs incorporate laser-induced graphene (LIG) electrodes printed on polyimide surfaces, enabling rapid batch production of sensing elements for neonicotinoid pesticides, salicylic acid, and pH detection [28].
The operational principle centers on the conversion of biochemical H2O2 concentrations into measurable electrical signals. When H2O2 diffuses into the hydrogel matrix, it undergoes enzymatic reaction, generating electrons that are transported through the reduced graphene oxide network to the measurement system, producing a quantifiable electrical current proportional to H2O2 concentration [27].
Experimental Protocol: Wearable Microneedle Patch Application and Testing
Patch Application Procedure:
- Plant Preparation: Select healthy soybean or tobacco plants at similar developmental stages. For stress induction, infect with bacterial pathogen Pseudomonas syringae pv. tomato DC3000 [27].
- Patch Attachment: Apply patches to the underside of leaves where stomatal density is higher. Gently press to ensure microneedle penetration through the cuticle.
- Signal Measurement: Connect patches to potentiostat or handheld electrochemical workstation via Bluetooth to smartphone for data acquisition.
Performance Validation:
- Comparative Analysis: Measure electrical current production in both healthy and bacteria-infected plants over time.
- Reference Method Validation: Confirm sensor accuracy against conventional laboratory analyses (e.g., colorimetric assays or HPLC).
- Reusability Testing: Evaluate patch performance through multiple use cycles (up to 9 applications) to assess microneedle integrity and signal stability [27].
Data Interpretation:
- Higher electrical current indicates elevated H2O2 levels in stressed leaves
- Current levels directly correlate with hydrogen peroxide concentration
- Measurement achievable within approximately 1 minute of patch application [27]
Comparative Analysis of H2O2 Sensing Platforms
Table 1: Performance Comparison of H2O2 Electrochemical Sensing Platforms
| Sensor Platform | Detection Mechanism | Linear Range | Sensitivity | LOD | Response Time | Plant Species Tested |
|---|---|---|---|---|---|---|
| PMWCNT/ChOx Biosensor | Enzymatic reduction | 0.4 - 4.0 mM | 26.15 µA/mM | 0.43 µM | Not specified | In vitro application |
| Wearable Microneedle Patch | Enzymatic reaction in hydrogel | Not specified | Current proportional to [H2O2] | Significantly lower than needle sensors | <1 minute | Soybean, Tobacco |
| Paper-based Device (Nano-gold) | Voltammetry | Not specified | Not specified | Not specified | Rapid detection | Tomato leaves |
| Microneedle Array Sensor | Chronocoulometry | Not specified | Not specified | Not specified | Not specified | Cucumber fruits, Arabidopsis |
Table 2: Analytical Characteristics and Application Scope of Sensing Technologies
| Sensor Platform | Invasiveness Level | Reusability | Key Advantages | Implementation Complexity | Cost per Test |
|---|---|---|---|---|---|
| PMWCNT/ChOx Biosensor | Destructive (tissue extraction) | Multiple uses with regeneration | High sensitivity and specificity | Laboratory setting required | Not specified |
| Wearable Microneedle Patch | Minimally invasive | Up to 9 uses | Real-time in situ monitoring, <$1 per test | Field-deployable | <$1 |
| Paper-based Device | Invasive/destructive | Single use | Rapid detection | Simple operation | Low |
| Microneedle Array | Minimally invasive | Multiple uses | Tissue damage minimization | Specialized fabrication | Moderate to high |
Research Reagent Solutions for H2O2 Sensor Development
Table 3: Essential Research Reagents and Materials for H2O2 Sensor Development
| Reagent/Material | Specification | Function in Sensor Development | Example Application |
|---|---|---|---|
| Multi-walled Carbon Nanotubes (MWCNTs) | Outer diameter: 6-13 nm, length: 2.5-20 μm, purity >98% | Electrode material enhancing electron transfer and surface area | PMWCNT/ChOx biosensing platform [17] |
| Cholesterol Oxidase (ChOx) | Microbial source, lyophilized powder | Recognition element for enzymatic reduction of H2O2 | Bio-platform for H2O2 electrochemical reduction [17] |
| Laser-Induced Graphene (LIG) | Porous, high-defect density carbon structure | Sensing electrode material with superior electrochemical performance | Wearable sensor for plant guttation monitoring [28] |
| Chitosan-based Hydrogel | Biopolymer matrix with enzyme incorporation | Converts biochemical H2O2 signals to measurable electrical current | Wearable microneedle patch for plant stress detection [27] |
| Gold Nanoparticles (AuNPs) | ~20 nm diameter, citrate-capped | Electrocatalytic enhancement of electrode surfaces | Paper-based H2O2 sensor for tomato leaves [26] |
| Sodium Phosphate Buffer | 0.050 M, pH 7.4 | Supporting electrolyte for electrochemical measurements | Standard medium for H2O2 detection [17] |
Integration of Machine Learning in Electrochemical Analysis
The convergence of electrochemical sensing with machine learning algorithms represents the cutting edge of data analysis in plant health monitoring. Machine learning techniques enhance information extraction from complex electrochemical data, particularly when analyzing real-world samples with numerous interfering compounds [29]. Key integration strategies include:
- Multi-electrode Systems: Employing electrodes with different responsiveness (Cu, Ni, C) that generate complementary datasets for improved identification of target analytes in complex matrices like milk samples [29].
- Data Processing: Conversion of cyclic voltammograms to current-time curves with hundreds of data points used as features for machine learning models [29].
- Classification Algorithms: Implementation of decision trees, random forests, and neural networks to discriminate between different analytes or concentration levels based on electrochemical fingerprints [29].
For H2O2 monitoring specifically, machine learning enables the interpretation of complex signal patterns that may correlate with specific stress types or progression stages, potentially allowing for discrimination between different stress stimuli based on temporal H2O2 fluctuation patterns.
The evolution from laboratory tools to wearable plant patches for H2O2 monitoring represents a paradigm shift in plant health assessment. While laboratory-based systems like the PMWCNT/ChOx biosensor offer high sensitivity and rigorous characterization capabilities, wearable patches provide unprecedented real-time monitoring capacity with minimal plant disturbance. The future trajectory of this field points toward increased integration of multi-analyte detection, enhanced machine learning interpretation, and scalable manufacturing of low-cost sensors for widespread agricultural implementation. As these technologies mature, they will fundamentally transform our approach to plant stress management, enabling pre-symptomatic intervention and precise application of agricultural inputs based on molecular-level plant signaling data.
Designing and Applying Next-Generation Nanosensors for Live Plant Monitoring
The precise monitoring of hydrogen peroxide (H₂O₂) within plant tissues (in planta) is crucial for understanding plant stress signaling, immune responses, and metabolic regulation. H₂O₂ functions as a key signaling molecule in plant physiological processes, but its abnormal concentrations can induce cytotoxicity through DNA/RNA inactivation and protein denaturation [30]. Electrochemical nanosensors offer exceptional advantages for this application, including high sensitivity, minimal invasiveness, and the potential for real-time monitoring within complex plant matrices. The integration of nanomaterials as sensing elements has dramatically enhanced sensor performance by improving electron transfer kinetics, increasing active surface area, and enabling specific recognition events. This technical guide examines four fundamental classes of nanomaterials—carbon nanotubes, graphene oxide, metal/metal oxide nanoparticles, and conductive polymers—that constitute the core toolbox for developing advanced electrochemical platforms for in planta H₂O₂ monitoring research.
Carbon Nanotubes (CNTs)
Structure and Properties
Carbon nanotubes (CNTs) are one-dimensional carbon allotropes with cylindrical nanostructures formed by rolling graphene sheets. Their unique structural characteristics impart exceptional electrical conductivity, mechanical robustness, and high aspect ratios, making them ideal for electrochemical sensing applications [31]. CNTs exist in two primary forms: single-walled carbon nanotubes (SWCNTs), consisting of a single graphene cylinder, and multi-walled carbon nanotubes (MWCNTs), comprising multiple concentric graphene cylinders. The electrical conductivity of CNTs, combined with their tunable surface chemistry and ability to form porous, three-dimensional networks, enables efficient electron transfer and high loading capacity for catalytic materials when integrated into sensor architectures [32].
Applications in H₂O₂ Sensing
CNTs serve as excellent scaffolds for constructing sensitive H₂O₂ detection platforms, particularly when functionalized with catalytic materials. Research has demonstrated that MWCNTs enhance electrode conductivity and electron transfer efficiency when modified with hemin-polyethyleneimine (hemin-PEI) complexes on screen-printed graphene electrodes (SPGEs) [33]. This configuration creates a pseudo-peroxidase non-enzymatic sensor that achieves a low onset potential for H₂O₂ reduction (approximately +0.2 V) with high sensitivity of 18.09 ± 0.89 A M⁻¹ cm⁻² [33]. The MWCNT matrix provides a high-surface-area support that stabilizes the hemin catalytic centers while facilitating efficient electron transfer from the electrode surface.
CNT-based self-powered sensors have also emerged as promising platforms for autonomous environmental monitoring, with potential applications in precision agriculture [31]. These systems can operate independently without external batteries by harvesting ambient energy through various mechanisms, including piezoelectric, triboelectric, and thermoelectric effects. The integration of CNTs into such platforms enables continuous, real-time monitoring of H₂O₂ and other relevant analytes in plant environments.
Table 1: Carbon Nanotube-Based Configurations for H₂O₂ Sensing
| CNT Type | Modification/Composite | Sensor Performance | Reference Electrode |
|---|---|---|---|
| MWCNTs | Hemin-PEI | Sensitivity: 18.09 ± 0.89 A M⁻¹ cm⁻²; Low onset potential: +0.2 V | Screen-printed graphene electrode [33] |
| MWCNTs | Carbon paper electrodes | Power density: 2.5 mW/cm² (self-powered system) | Carbon paper [31] |
| Vertically aligned CNTs | Silicone rubber embedding | Power density: 6 W/m²; 90-day stability in marine conditions | Mechano-electrochemical generator [31] |
Experimental Protocol: CNT-Based Sensor Fabrication
Materials: MWCNTs, polyethyleneimine (PEI, 50% w/v, MW 1300), hemin, dimethylformamide (DMF), screen-printed graphene electrodes (SPGEs), phosphate buffer (0.1 M, pH 7.0).
Fabrication Procedure:
- MWCNT Dispersion: Disperse 1 mg of MWCNTs in 1 mL of DMF and sonicate for 30 minutes to achieve a homogeneous suspension.
- Hemin-PEI Composite Preparation: Dissolve hemin in DMSO to a concentration of 5 mM. Mix with PEI solution at a 1:4 volume ratio and vortex thoroughly.
- Electrode Modification: Drop-cast 5 μL of the MWCNT suspension onto the SPGE working electrode and dry at room temperature. Subsequently, deposit 5 μL of the hemin-PEI composite onto the MWCNT-modified electrode.
- Sensor Conditioning: Immerse the modified electrode in 0.1 M phosphate buffer (pH 7.0) and perform cyclic voltammetry scanning between -0.8 V and +0.6 V until a stable voltammogram is obtained (typically 10-20 cycles) [33].
Characterization Techniques:
- Scanning Electron Microscopy (SEM): Confirm the uniform distribution of MWCNTs and hemin-PEI composite on the electrode surface.
- Energy Dispersive X-Ray Spectroscopy (EDS): Verify the presence of iron from hemin within the modified layer.
- Electrochemical Impedance Spectroscopy (EIS): Evaluate charge transfer resistance at the modified electrode interface using [Fe(CN)₆]³⁻/⁴⁻ as a redox probe.
Graphene Oxide (GO) and Reduced Graphene Oxide (rGO)
Structure and Properties
Graphene oxide (GO) is a two-dimensional carbon nanomaterial with an atomic layer of carbon atoms arranged in a hexagonal lattice containing oxygen-functional groups, including epoxides, hydroxyls, and carboxyls [32]. These functional groups render GO dispersible in aqueous solutions and provide sites for chemical functionalization. Electrochemical reduction of GO produces reduced graphene oxide (rGO), which exhibits restored sp² conjugation and enhanced electrical conductivity while retaining some oxygen-containing groups [34]. The large specific surface area (theoretically ~2630 m²/g), excellent charge carrier mobility, and tunable surface chemistry of graphene derivatives make them ideal for electrochemical sensing applications.
Applications in H₂O₂ Sensing
Graphene-based materials provide versatile platforms for constructing enzymatic and non-enzymatic H₂O₂ sensors. Screen-printed graphene electrodes (SPGEs) serve as excellent transducers for hemin-based H₂O₂ sensors, offering advantages such as disposability, reproducibility, and suitability for point-of-care applications [33]. The high electrical conductivity and large surface area of graphene enhance electron transfer kinetics and provide ample sites for immobilizing catalytic materials.
Laser-scribed graphene (LSG) has emerged as a promising approach for fabricating graphene-based sensors with applications in precision agriculture [35]. This technique enables the direct writing of conductive graphene patterns on flexible substrates, including paper, through laser-induced carbonization. LSG sensors demonstrate excellent mechanical flexibility, making them suitable for developing wearable plant sensors that can monitor H₂O₂ and other stress biomarkers directly on leaf surfaces.
In biosensor applications, rGO provides an optimal platform for immobilizing biorecognition elements due to its high surface area and rich chemistry for functionalization. Research has demonstrated successful implementation of rGO-based electrochemical aptasensors for detecting various analytes, with potential adaptation for H₂O₂ monitoring in plant systems [34].
Table 2: Graphene-Based Materials for Electrochemical Sensing
| Graphene Material | Functionalization | Key Properties | Application Example |
|---|---|---|---|
| Screen-printed graphene electrodes (SPGEs) | Hemin-PEI/MWCNT | High conductivity, disposability | H₂O₂ detection in exhaled breath condensate [33] |
| Laser-scribed graphene (LSG) | Direct patterning on paper | Flexibility, scalable production | Wearable plant sensors for paraquat detection [35] |
| Reduced graphene oxide (rGO) | 1-pyrenebutyric acid, aptamers | Large surface area, functionalization sites | Multiplexed detection of neonicotinoids [34] |
Experimental Protocol: rGO-Based Electrode Fabrication
Materials: Graphene oxide dispersion (4 mg/mL), screen-printed electrodes, 1-pyrenebutyric acid, potassium chloride, phosphate buffer (0.1 M, pH 7.4), aptamers (if fabricating biosensors), EDC/NHS coupling reagents.
Fabrication Procedure:
- Electrode Coating: Deposit 5 μL of GO dispersion onto the working electrode of screen-printed electrodes and dry at 50°C for 15 minutes.
- Electrochemical Reduction: Immerse the GO-modified electrode in 0.1 M KCl and perform cyclic voltammetry from 0 V to -1.5 V for 5 cycles to electrochemically reduce GO to rGO.
- Surface Functionalization: Incubate the rGO electrode with 1-pyrenebutyric acid (1 mM) for 2 hours to create a functional interface for biomolecule immobilization.
- Aptamer Immobilization (for biosensors): Activate carboxyl groups using EDC/NHS chemistry, then immobilize amine-labeled aptamers (1 μM) for 2 hours at room temperature [34].
Characterization Techniques:
- Raman Spectroscopy: Analyze the D/G band intensity ratio to evaluate the reduction level and defect density.
- X-ray Photoelectron Spectroscopy (XPS): Determine the carbon-to-oxygen ratio and identify functional groups.
- Electrochemical Characterization: Use cyclic voltammetry with [Fe(CN)₆]³⁻/⁴⁻ to evaluate electron transfer efficiency.
Metal and Metal Oxide Nanoparticles
Structure and Properties
Metal and metal oxide nanoparticles exhibit exceptional catalytic properties, high surface-to-volume ratios, and unique electronic structures that make them valuable for electrochemical H₂O₂ sensing. Tin dioxide (SnO₂) nanoparticles, in particular, have demonstrated remarkable electrocatalytic activity toward H₂O₂ reduction and oxidation due to their high electron mobility, thermal stability, and tunable surface chemistry [36] [30]. The catalytic efficiency of these nanomaterials can be enhanced through structural engineering, such as creating porous architectures or introducing oxygen vacancies, which increase active site density and improve mass transport.
Applications in H₂O₂ Sensing
SnO₂ nanoparticles have been extensively investigated for non-enzymatic H₂O₂ detection. Sodium-alginate-templated porous SnO₂ nanoparticles (SnO₂-SA) exhibit enhanced catalytic activity, enabling H₂O₂ detection with a wide linear range (0.02–2.8 mM), high sensitivity (381.12 μA mM⁻¹ cm⁻²), and a low detection limit (0.61 μM) at -0.4 V [36]. The porous structure of these nanoparticles provides abundant active sites and facilitates efficient mass transport, leading to improved sensor performance.
Flower-like SnO₂ nanostructures with mesoporous architectures represent another promising configuration for H₂O₂ sensing. Synthesized via a one-step template-free solvothermal method, these three-dimensional hierarchical structures provide high specific surface area and abundant mesoporous channels that collectively enhance electrocatalytic efficiency [30]. The unique morphology offers numerous accessible active sites and efficient mass transport pathways, significantly improving sensing performance.
Beyond SnO₂, other metal oxides including ZnO, TiO₂, CuO, MnO₂, Fe₃O₄, and CeO₂ have been employed for electrochemical sensor construction, leveraging their unique electronic structures and electrocatalytic activities [30]. These materials can be further functionalized or combined with other nanomaterials to enhance selectivity and sensitivity for H₂O₂ detection in complex plant matrices.
Table 3: Metal/Metal Oxide Nanoparticles for H₂O₂ Sensing
| Nanomaterial | Morphology/Structure | Sensor Performance | Operating Potential |
|---|---|---|---|
| SnO₂-SA | Porous nanoparticles | Linear range: 0.02-2.8 mM; Sensitivity: 381.12 μA mM⁻¹ cm⁻²; LOD: 0.61 μM | -0.4 V [36] |
| Flower-like SnO₂ | 3D hierarchical architecture | High sensitivity and selectivity for H₂O₂ | Specific potential not provided [30] |
| MnO₂ nanosheets | Ultrathin nanosheets | Ultrasensitive detection in living cells | Not specified [30] |
Experimental Protocol: Flower-like SnO₂ Synthesis and Sensor Fabrication
Materials: Tin(IV) chloride pentahydrate (SnCl₄·5H₂O), absolute ethanol, urea, deionized water, glassy carbon electrode (GCE), alumina polishing slurry, Nafion solution.
Synthesis Procedure:
- Solvothermal Synthesis: Dissolve 1.75 g of SnCl₄·5H₂O and 1.4 g of urea in a mixture of 35 mL ethanol and 35 mL deionized water under magnetic stirring.
- Hydrothermal Reaction: Transfer the solution to a 100 mL Teflon-lined stainless-steel autoclave and maintain at 180°C for 12 hours.
- Product Collection: After natural cooling to room temperature, collect the precipitate by centrifugation and wash repeatedly with ethanol and deionized water.
- Drying and Annealing: Dry the product at 60°C for 6 hours, then anneal at 500°C for 2 hours to obtain crystalline flower-like SnO₂ [30].
Sensor Fabrication:
- Electrode Preparation: Polish glassy carbon electrodes (GCE, 3 mm diameter) with alumina slurry and rinse thoroughly with deionized water.
- Ink Preparation: Disperse 5 mg of flower-like SnO₂ in 1 mL of water-ethanol (1:1) solution with 10 μL Nafion solution and sonicate for 30 minutes.
- Electrode Modification: Deposit 5 μL of the SnO₂ suspension onto the GCE surface and dry under infrared light.
Characterization Techniques:
- X-ray Diffraction (XRD): Analyze crystal structure and phase purity.
- Scanning Electron Microscopy (SEM): Characterize flower-like morphology and nanostructure.
- X-ray Photoelectron Spectroscopy (XPS): Determine elemental composition and identify oxygen vacancies.
Conductive Polymers
Structure and Properties
Conductive polymers (CPs) are organic materials with extended π-conjugated backbones that exhibit electronic conductivity when doped. Common CPs used in electrochemical sensors include polypyrrole (PPy), polyaniline (PANI), and polythiophene (PTh) derivatives [37]. The electrical conductivity of CPs in their neutral state typically ranges from 10⁻⁶ to 10⁻¹⁰ S·cm⁻¹, but can reach values up to 10⁵ S·cm⁻¹ when doped through oxidation (p-doping) or reduction (n-doping) processes [37]. This unique combination of polymer processability and metallic conductivity makes CPs ideal for sensor applications.
Applications in H₂O₂ Sensing
CPs serve multiple functions in electrochemical sensors: they facilitate electron transfer, provide a matrix for immobilizing catalytic species, and can be engineered with molecular recognition properties. Their unique three-dimensional structural characteristics increase active sites during detection while providing channels for rapid ion transmission and efficient electron transfer during electrochemical reactions [37].
PPy stands out among various CPs due to its readily oxidizable monomer, water solubility, commercial availability, lightweight nature, affordability, and biocompatibility [37]. The combination of PPy with other materials such as carbon-based materials and metal oxides enables the formation of composite materials that exhibit higher electrical conductivity and larger specific surface area. PANI offers exceptional environmental stability, high processability, and adjustable electrical conductivity, making it promising for sensor applications [37].
Additive manufacturing technologies, including 3D and 4D printing, have recently been applied to fabricate ECP-based sensors with complex architectures tailored for specific detection applications [38]. These advanced manufacturing approaches enable the creation of sensors with customized geometries that can be optimized for implantation in plant tissues or integration into wearable plant monitoring systems.
Experimental Protocol: Electropolymerization of Polypyrrole Films
Materials: Pyrrole monomer, sodium chloride, phosphate buffer (0.1 M, pH 7.0), screen-printed electrodes or glassy carbon electrodes, deionized water.
Electropolymerization Procedure:
- Solution Preparation: Prepare an electrochemical solution containing 0.1 M pyrrole monomer and 0.1 M sodium chloride in deionized water. Deoxygenate by bubbling nitrogen gas for 10 minutes.
- Electrode Setup: Place working, reference, and counter electrodes in the polymerization solution.
- Potentiostatic Polymerization: Apply a constant potential of +0.8 V vs. Ag/AgCl for 60-120 seconds to electropolymerize a PPy film on the working electrode surface.
- Film Characterization: Monitor polymerization progress by measuring current response, which typically decreases as the film grows.
- Post-treatment: Rinse the modified electrode with deionized water and phosphate buffer to remove unreacted monomer [37].
Alternative Approaches:
- Potential Cycling: Perform cyclic voltammetry between -0.2 V and +0.8 V for 10-20 cycles at 50 mV/s.
- Galvanostatic Method: Apply constant current density of 0.1-0.5 mA/cm² for controlled film growth.
Characterization Techniques:
- Cyclic Voltammetry: Evaluate redox behavior of the polymer film in monomer-free solution.
- SEM/AFM: Analyze film morphology and thickness.
- Electrochemical Impedance Spectroscopy: Measure charge transfer resistance and capacitive properties.
Research Reagent Solutions
Table 4: Essential Research Reagents for Nanomaterial-Based H₂O₂ Sensor Development
| Reagent/Chemical | Function/Application | Key Characteristics | Representative Examples |
|---|---|---|---|
| Hemin | Catalytic center for H₂O₂ reduction | Iron protoporphyrin complex with peroxidase-like activity | Hemin-PEI/MWCNT composite [33] |
| Polyethyleneimine (PEI) | Cationic polymer matrix for hemin dispersion | Water-soluble, protein-like polymer structure | Prevents hemin aggregation, improves electrocatalytic performance [33] |
| Sodium alginate (SA) | Template for porous nanoparticle synthesis | Green, scalable biopolymer | Creates porous SnO₂ nanoparticles with enhanced catalytic activity [36] |
| 1-Pyrenebutyric acid | Functionalization agent for rGO | π-π stacking with graphene, carboxyl groups for conjugation | Enables covalent immobilization of aptamers on rGO surface [34] |
| Nafion perfluorinated resin | Binder for electrode modification | Cation-exchange polymer, chemical resistance | Provides stable film formation on electrode surfaces [30] |
| EDC/NHS coupling reagents | Crosslinkers for biomolecule immobilization | Zero-length crosslinkers for amide bond formation | Activates carboxyl groups for aptamer conjugation [34] |
The integration of carbon nanotubes, graphene oxide, metal/metal oxide nanoparticles, and conductive polymers has created a powerful nanomaterial toolbox for developing advanced electrochemical sensors for in planta H₂O₂ monitoring. Each material class offers distinct advantages: CNTs provide exceptional electrical conductivity and mechanical strength, GO/rGO offers large surface area and versatile chemistry, metal/metal oxide nanoparticles deliver superior catalytic activity, and CPs combine processability with tunable conductivity. Future research directions will likely focus on multifunctional nanocomposites that synergistically combine the strengths of multiple material classes, advanced manufacturing techniques like 3D printing for customized sensor architectures, and the development of fully autonomous self-powered systems for continuous monitoring in field conditions. As these technologies mature, they will provide unprecedented insights into plant stress signaling and metabolic regulation through precise, real-time monitoring of H₂O₂ dynamics in plant systems.
The field of precision agriculture demands technologies that can move beyond whole-crop image analysis to identify localized, early-stage stress in individual plants. Biotic and abiotic stresses trigger the production of hydrogen peroxide (H₂O₂), a key signaling molecule and stress biomarker in plants [39]. Monitoring H₂O₂ concentrations within the apoplast fluid—the intercellular fluid responsible for transporting nutrients and defense hormones—provides a direct, minimally invasive method for real-time plant health assessment [39]. This technical guide details the architecture, fabrication, and application of hollow microneedle array (HMA) patches integrated with electrochemical sensors, a groundbreaking platform for in planta H₂O₂ monitoring that aligns with the broader thesis of developing advanced electrochemical nanosensors.
Core Sensor Architecture and Working Principle
The fundamental architecture of a microneedle-based plant sensor consists of a synergistic integration of a sampling mechanism and a transduction element.
The Microneedle Array as a Minimally Invasive Interface
Hollow microneedle arrays (HMAs) serve as the primary interface with the plant, designed to penetrate the cuticle and epidermis to access the apoplast fluid. A recent advancement demonstrates the fabrication of HMAs with a tip diameter of 25.9 ± 3.7 μm using low-cost stereolithography (SLA) 3D printing, achieving a height of 1 mm sufficient to reach the apoplastic fluid in most leaves [39]. This design enables the passive or active extraction of fluid volumes exceeding 10 μL for analysis [39].
Electrochemical Sensing Mechanism
The extracted apoplast fluid is channeled to a sensing platform, typically screen-printed electrodes (SPE). The sensing mechanism relies on the electrocatalytic reduction or oxidation of H₂O₂. Advanced sensing materials, such as Pt-Ni hydrogels, have demonstrated exceptional electrocatalytic activity toward H₂O₂, enabling sensitive detection. These materials exhibit wide linearity ranges (0.50 μM–5.0 mM) and low detection limits (0.15 μM) [18]. An alternative approach uses a chitosan-based hydrogel mixture containing an enzyme that reacts with H₂O₂ to produce a measurable electrical current, allowing for direct measurement on living leaves in under one minute [40].
Table 1: Key Performance Metrics of H₂O₂ Sensing Platforms
| Sensor Type | Detection Limit | Linear Range | Response Time | Reference |
|---|---|---|---|---|
| Pt-Ni Hydrogel/SPE | 0.15 μM | 0.50 μM – 5.0 mM | Not Specified | [18] |
| Enzymatic Microneedle Patch | Significantly lower than previous needle sensors | Not Specified | < 1 minute | [40] |
| 3D-printed HMA/SPE (HMAPS) | Demonstrated for biomarker detection | Not Specified | Rapid profiling | [39] |
Detailed Experimental Protocols and Methodologies
Fabrication of 3D-Printed Hollow Microneedle Arrays
The agile production of high-resolution HMAs is achieved through stereolithography 3D printing [39].
- Design and Printing: The HMA structure is designed with a needle height of 1 mm. The design is loaded into an affordable SLA 3D printer (cost < €500).
- Printing Optimization: Critical printing parameters are fine-tuned:
- UV Exposure Time: Optimized to achieve a tip sharpness of less than 30 μm.
- Layer Height: Adjusted to ensure structural integrity and high resolution.
- Post-Processing: Printed HMAs are cleaned and post-cured according to the resin manufacturer's specifications to achieve final mechanical properties.
Preparation of the Electrochemical Sensing Interface
The integration of the HMA with the sensing element involves the following steps [39]:
- Sensor Fabrication: Screen-printed electrodes (SPEs) are manufactured, often with carbon or noble metal working electrodes.
- Sensor Functionalization: The working electrode is modified with the sensing material. For H₂O₂ detection, this can involve:
- Device Assembly: The HMA is integrated with the functionalized SPE using a paper-based sampling pad that acts as both a fluid collector and an electrochemical cell, forming a complete Hollow Microneedle array Patch Sensor (HMAPS).
In Vivo Plant Sensing and Validation Protocol
To validate sensor performance on live plants [39] [40]:
- Patch Application: The HMAPS is attached to the underside of a live plant leaf (e.g., soybean, tobacco), allowing the microneedles to pierce the epidermis.
- Stress Induction: A subset of plants is subjected to stress, such as infection with a bacterial pathogen like Pseudomonas syringae, while control plants remain untreated.
- Electrochemical Measurement: The electrical current generated by the sensor is measured over time. Techniques like chronoamperometry (applying a fixed potential and measuring current) are commonly used.
- Data Correlation: The sensor's current output is correlated with the H₂O₂ concentration using a pre-established calibration curve.
- Validation: Sensor measurements are validated against conventional laboratory analyses (e.g., colorimetric test strips, ultraviolet-visible spectrophotometry) of destructively harvested leaf samples to confirm accuracy.
Diagram 1: H₂O₂ Sensing Workflow
The Scientist's Toolkit: Essential Research Reagents and Materials
Table 2: Key Research Reagent Solutions for HMA Sensor Development
| Item Name | Function / Role | Specific Example / Note |
|---|---|---|
| Stereolithography (SLA) 3D Printer | Fabrication of hollow microneedle arrays (HMAs) | Cost-effective models (< €500) can achieve tip diameters < 30 μm [39]. |
| Photopolymerizable Resin | Raw material for constructing the HMA structure | Must be biocompatible and yield mechanically robust needles. |
| Screen-Printed Electrodes (SPE) | Affordable, mass-producible electrochemical sensing platform | Typically feature carbon or noble metal working electrodes. |
| Pt-Ni Hydrogel | Nanozyme with high electrocatalytic activity for H₂O₂ detection | Offers high stability and a wide linear range (0.50 μM–5.0 mM) [18]. |
| Chitosan-based Hydrogel | Enzyme-immobilization matrix for biocompatible sensing | Can be blended with enzymes and reduced graphene oxide [40]. |
| Reduced Graphene Oxide | Conductive nanomaterial to enhance electron transfer in hydrogels | Improves sensor sensitivity and response time. |
| Paper-based Sampling Pad | Acts as a fluid collector and miniaturized electrochemical cell | Interfaces the HMA with the SPE, wicking fluid to the sensor. |
Signaling Pathways and Data Interpretation
The core biochemical pathway monitored by these sensors is the plant's defense and signaling mechanism involving hydrogen peroxide. Stressors trigger a biochemical cascade leading to H₂O₂ accumulation in the apoplast, which is then detected by the sensor [40].
Diagram 2: Stress Signaling & Sensing
The integration of hollow microneedle arrays with electrochemical transducers represents a significant leap forward in plant sensor technology. These architectures facilitate minimally invasive, real-time, and in situ monitoring of H₂O₂, a critical stress biomarker. With device costs reported to be below €1 per sensor and measurement times under a minute, this technology is poised for practical field deployment, enabling the democratization of sensors for precision farming [39]. Future research will likely focus on enhancing sensor reusability, expanding the range of detectable biomarkers, and integrating these patches with wireless communication systems for fully autonomous crop health monitoring.
The pursuit of robust and sensitive tools for monitoring hydrogen peroxide (H₂O₂) in planta is a critical challenge in plant physiology and pathology. Electrochemical nanosensors offer a promising path forward, and their performance hinges on the effective integration of biological recognition elements with efficient transducer surfaces. Chitosan, a natural biopolymer derived from the deacetylation of chitin, has emerged as a cornerstone material for constructing biohydrogel matrices that fulfill this need [41]. Its unique properties—excellent biocompatibility, high film-forming ability, and the presence of abundant amine and hydroxyl functional groups—make it an ideal platform for enzyme immobilization in biosensor design [42] [41].
This technical guide details the application of chitosan-based biohydrogels for enzyme immobilization, specifically framing their utility within a broader research thesis on developing electrochemical nanosensors for monitoring H₂O₂ in plant systems. The content is structured to provide researchers with a deep understanding of the material properties, immobilization methodologies, sensor architectures, and experimental protocols necessary to advance this field.
Fundamental Properties of Chitosan as an Immobilization Matrix
Chitosan's utility stems from a combination of structural and chemical characteristics that are particularly advantageous for biosensing applications.
- Functional Groups for Immobilization: The primary amine groups (-NH₂) in its repeating units allow for the covalent attachment of enzymes via glutaraldehyde cross-linking or direct coordination with metal ions in nanocomposites [42] [41]. These groups, along with hydroxyls (-OH), also facilitate electrostatic and physical interactions that can stabilize the immobilized enzyme.
- Biocompatibility and Mild Processing Conditions: Chitosan is non-toxic and biodegradable, preserving the native structure and activity of sensitive biomolecules like enzymes during the immobilization process, which often occurs in aqueous solutions at neutral pH [43] [41].
- Formation of Permeable Hydrogels: When cross-linked or gelled, chitosan forms a hydrophilic, porous three-dimensional network. This hydrogel structure allows for the free diffusion of small analyte molecules (like H₂O₂ or glucose) to and from the immobilized enzyme, while effectively retaining the enzyme within the matrix [43].
The following table summarizes the key properties of chitosan that are relevant to its use in sensor fabrication.
Table 1: Key Properties of Chitosan for Enzyme Immobilization and Sensor Fabrication
| Property | Technical Description | Impact on Sensor Performance |
|---|---|---|
| Cationic Nature | Positively charged in acidic conditions due to protonation of amino groups [41] | Enables electrostatic interaction with anionic enzymes or substrates; facilitates formation of polyelectrolyte complexes. |
| Film-Forming Ability | Can form stable, uniform thin films on electrode surfaces [42] | Allows for the creation of a consistent, reproducible sensing interface on transducers. |
| Chemical Versatility | Amine and hydroxyl groups can be modified or cross-linked with agents like glutaraldehyde [41] | Provides covalent binding sites for enzymes, enhancing stability and preventing leaching. |
| Porosity & Swelling | Forms hydrogels with tunable pore size upon cross-linking [43] | Controls diffusion kinetics of analytes and products, directly affecting response time and sensitivity. |
| Biocompatibility | Natural polymer that is non-toxic and biodegradable [42] [41] | Maintains enzyme activity and viability, crucial for long-term sensor stability. |
Methodologies for Enzyme Immobilization in Chitosan Matrices
Several well-established techniques can be employed to immobilize enzymes within chitosan-based matrices. The choice of method depends on the desired sensor characteristics, such as response time, stability, and simplicity of fabrication.
Covalent Binding
This method involves forming stable covalent bonds between functional groups on the enzyme and the chitosan matrix, typically using a cross-linker like glutaraldehyde. This approach minimizes enzyme leaching and enhances operational stability, making it suitable for sensors intended for prolonged use [41]. A common protocol involves activating a chitosan-coated electrode by incubating it in a glutaraldehyde solution (e.g., 2.5% v/v) for about 1 hour, followed by rinsing and exposure to an enzyme solution for several hours to allow for covalent coupling.
Encapsulation in Core-Shell Structures
This advanced technique involves creating microcapsules with an alginate core, containing the enzyme, surrounded by a chitosan shell. The core can be liquefied or solid, and the semi-permeable chitosan shell controls the diffusion of substrates and products [43]. For instance, a β-galactosidase enzyme encapsulated in a barium alginate-chitosan core-shell structure demonstrated 100% loading efficiency and improved thermal stability at 37°C compared to the free enzyme [43].
Electrodeposition of Nanocomposites
For electrochemical sensors, chitosan's cationic nature allows it to be co-deposited with other nanomaterials, such as Prussian Blue (PB), directly onto an electrode surface. This one-step process creates a robust, nanocomposite sensing layer. A documented protocol for a H₂O₂ sensor involves applying a potential of +0.4 V (vs. Ag/AgCl) to a laser-induced graphene electrode in a solution containing 2.5 mM FeCl₃, 2.5 mM K₃Fe[CN]₆, and 0.01% (w/w) chitosan [44]. This results in a site-specific deposition of a PB-Chitosan composite that is highly sensitive and stable.
Sensor Architectures and Performance for H₂O₂ Detection
Integrating chitosan-immobilized enzymes with nanomaterial-enhanced electrodes has led to the development of highly sensitive and selective biosensors. The synergy between the biocompatible hydrogel and the electrocatalytic nanomaterial is key to their performance.
A prominent example is the chitosan-functionalized Zn/Fe₂O₃ (Zn/Fe₂O₃@CS) nanocomposite. This material exhibits remarkable electrocatalytic activity for H₂O₂ detection, with a reported sensitivity of 22.30 μA mM⁻¹ cm⁻² and a wide linear detection range [42]. The sensor operates on the principle of non-enzymatic electrocatalytic reduction of H₂O₂, where the chitosan matrix stabilizes the Zn/Fe₂O₃ nanoparticles and provides a favorable microenvironment for the reaction.
Another innovative architecture is the composite graphene-Prussian blue-chitosan (LIG-PB-CS) sensor. This design leverages the high conductivity of laser-induced graphene, the exceptional electrocatalytic activity of Prussian Blue for H₂O₂ reduction, and the immobilization capacity of chitosan. This sensor demonstrated the ability to monitor H₂O₂ in complex bacterial culture media over a range of 20 μM to 1 mM, with a low detection limit of 30 μM and a fast response time of 20 seconds [44]. Its selectivity in complex media, achieved by operating at a low potential of -0.036 V vs. Ag/AgCl, makes it a promising model for in planta applications where interfering compounds are present.
Table 2: Performance Metrics of Chitosan-Based Electrochemical Sensors for H₂O₂ Detection
| Sensor Architecture | Detection Principle | Linear Range | Sensitivity | Detection Limit | Reference Application |
|---|---|---|---|---|---|
| Zn/Fe₂O₃@CS Nanocomposite | Non-enzymatic electrocatalysis | Not specified | 22.30 μA mM⁻¹ cm⁻² | Not specified | Blood serum and live HeLa cells [42] |
| LIG-PB-CS Composite | Electrocatalytic reduction (Prussian Blue) | 20 μM to 1 mM | 122 mA/mM | 30 μM | Lactobacillus johnsonii cultures [44] |
| Alginate-Chitosan Core-Shell | Enzyme (e.g., peroxidase) encapsulation | Dependent on immobilized enzyme | Dependent on immobilized enzyme | Dependent on immobilized enzyme | Biotechnological immobilization platform [43] |
The Scientist's Toolkit: Essential Research Reagent Solutions
Table 3: Key Reagents and Materials for Fabricating Chitosan-Based Biosensors
| Reagent/Material | Function and Rationale | Example Source/Note |
|---|---|---|
| Chitosan (from crab or shrimp shell) | The foundational biopolymer for forming the hydrogel immobilization matrix; provides biocompatibility and functional groups for cross-linking. | Available from Sisco Research Laboratory or Merck; degree of deacetylation should be considered [42] [44]. |
| Glutaraldehyde | A common cross-linking agent that forms covalent bonds with amine groups on chitosan and enzymes, stabilizing the hydrogel and preventing enzyme leaching. | Typically used as a 2.5% (v/v) solution for activation [41]. |
| Prussian Blue (Ferric ferrocyanide) | An electrocatalytic mediator that facilitates the reduction of H₂O₂ at low overpotentials, granting high selectivity in complex media. | Often synthesized in situ via electrodeposition with chitosan [44]. |
| Laser-Induced Graphene (LIG) | A highly conductive and porous electrode substrate created by laser ablation of polyimide; allows for rapid prototyping of sensor designs. | Fabricated with a CO₂ laser at a fluence of ~6.9 J cm⁻² [44]. |
| Sodium Tripolyphosphate (Na-TPP) | An ionic cross-linker used to gel chitosan by forming a network through electrostatic interactions, useful for creating shell layers [43]. | |
| Enzymes (e.g., Peroxidase, Glucose Oxidase) | The biological recognition element that provides specificity to the sensor by catalyzing a reaction with the target analyte. | Must be high-purity and stored appropriately to maintain activity. |
Experimental Protocol: Fabrication of a Graphene-PB-Chitosan H₂O₂ Sensor
This detailed protocol is adapted from recent research for the development of a miniature, highly sensitive H₂O₂ sensor, ideal for small-volume samples as might be encountered in plant research [44].
Objective: To fabricate and characterize a laser-induced graphene electrode functionalized with a Prussian Blue-Chitosan (LIG-PB-CS) nanocomposite for the amperometric detection of hydrogen peroxide.
Materials:
- Polyimide film (75 μm thickness)
- CO₂ laser system
- Chitosan (low molecular weight)
- Iron(III) chloride (FeCl₃), Potassium ferricyanide [K₃Fe(CN)₆], Potassium chloride (KCl), Hydrochloric acid
- Ag paint and 0.1 M KCl solution (for pseudo-reference electrode)
- Hydrogen peroxide standards and Britton Robinson (BR) buffer, pH 7.0
Methodology:
- LIG Electrode Fabrication: Design the three-electrode layout (working, counter, pseudo-reference) in AutoCAD or similar software. Use a CO₂ laser system (e.g., VLS 2.30) with a fluence of 6.9 J cm⁻² to convert the polyimide film into porous graphene in the defined areas [44].
- Reference Electrode Preparation: Apply Ag paint to one of the LIG electrodes designated as the pseudo-reference. Submerge this electrode in 0.1 M KCl for 24 hours to form a stable Ag|AgCl layer.
- Electrodeposition of PB-CS Layer:
- Prepare the deposition solution: 2.5 mM FeCl₃, 2.5 mM K₃Fe[CN]₆, 0.1 M KCl, 0.01 M HCl, and 0.01% (w/w) chitosan.
- Using an external Ag|AgCl reference and platinum counter electrode, hold the LIG working electrode at a constant potential of +0.4 V in the deposition solution until a uniform blue coating is observed (typically a few minutes). This step co-deposits the PB and chitosan directly onto the LIG surface.
- Rinse the modified electrode thoroughly with deionized water and store at 4°C when not in use.
- Amperometric Detection:
- Use a potentiostat for all electrochemical measurements.
- Calibrate the sensor in BR buffer by successive additions of H₂O₂ standard solutions.
- Apply a constant detection potential of -0.036 V vs. the internal LIG-Ag|AgCl reference and record the steady-state current.
- The current response is linear with H₂O₂ concentration in the range of 20 μM to 1 mM.
Visualizing Sensor Fabrication and Signaling Workflow
The following diagram illustrates the sequential fabrication process of the LIG-PB-CS sensor and its subsequent mechanism for H₂O₂ detection.
Diagram Title: LIG-PB-CS Sensor Fabrication and H₂O₂ Detection Workflow
The signaling pathway within the sensor's bioactive layer can be summarized as follows: The H₂O₂ analyte diffuses through the porous chitosan hydrogel matrix. Upon reaching the electrocatalytic Prussian Blue nanoparticles embedded within the matrix, it undergoes a reduction reaction (H₂O₂ + 2e⁻ + 2H⁺ → 2H₂O). This Faradaic reaction generates a measurable change in current at the electrode surface, which is directly proportional to the concentration of H₂O₂ in the sample [42] [44]. The chitosan matrix plays the crucial role of stabilizing this entire structure, ensuring the PB remains immobilized and the analyte can freely access the catalytic sites.
Chitosan-based biohydrogels represent a versatile and powerful platform for the development of advanced electrochemical nanosensors. Their ability to effectively immobilize enzymes and other recognition elements while maintaining biocompatibility and enabling efficient signal transduction is unmatched. The protocols and sensor architectures detailed herein, particularly the LIG-PB-CS composite, provide a robust foundation for researchers aiming to monitor H₂O₂ and other key analytes in complex biological environments like plant tissues.
Future research directions will likely focus on further miniaturization and multiplexing of sensors for spatially resolved in planta monitoring, the development of fully biodegradable sensor platforms, and the integration of wireless data transmission for real-time, in-field analysis. The continued exploration of chitosan-based composites is poised to remain at the forefront of biosensing innovation.
This case study examines the deployment of an innovative electrochemical nanosensor for the in planta monitoring of hydrogen peroxide (H2O2), a critical early stress signaling molecule in plants. The research focuses on the real-time detection of bacterial pathogen stress in live soybean and tobacco plants, utilizing a wearable, microneedle-based patch. This technology enables the identification of pathogenic stress before the manifestation of visible symptoms, providing a transformative tool for precision agriculture and plant pathology research. The methodology, validation data, and sensor architecture detailed herein frame this advancement within the broader context of developing in situ sensing platforms for plant health diagnostics [40] [45].
Plant stress, induced by biotic factors such as bacterial pathogens, triggers a complex biochemical cascade within plant tissues. A key component of this early defense response is the rapid accumulation of reactive oxygen species (ROS), particularly hydrogen peroxide [27]. Conventional methods for detecting H2O2 often require destructive sampling and involve complex laboratory procedures, which limits their utility for real-time, field-deployable monitoring [40]. This creates a significant technological gap between fundamental plant biochemistry and applied crop protection. The research profiled in this case study bridges this gap through the development of a biohydrogel-enabled microneedle sensor, representing a significant leap forward in electrochemical nanosensors for direct, in planta H2O2 monitoring [45]. By providing a window into the real-time physiological status of plants, this technology empowers researchers and growers to make data-driven interventions, potentially minimizing crop losses and optimizing resource application.
Sensor Design and Operating Principle
The core innovation is a wearable electrochemical patch designed for attachment to the underside of plant leaves. Its architecture and function are engineered for sensitive and rapid H2O2 detection [40] [27].
The sensor is constructed on a flexible base, providing conformity to the leaf surface. An array of microscopic plastic microneedles is fabricated across this base, enabling intimate contact with the plant's interior tissues. This microneedle array is coated with a specially formulated chitosan-based hydrogel mixture that acts as the sensing interface [40] [45].
Electrochemical Detection Mechanism
The operating principle relies on an enzymatic reaction within the hydrogel. The hydrogel matrix incorporates an enzyme that reacts specifically with hydrogen peroxide. This reaction generates free electrons. The mixture also contains reduced graphene oxide, which acts as a highly efficient conductor, transporting these generated electrons through the sensor [27]. Consequently, minute changes in the local concentration of H2O2 at the plant-sensor interface are converted into measurable differences in electrical current. The magnitude of the current is directly proportional to the amount of H2O2 present, allowing for quantitative analysis [40].
The diagram below illustrates the sensor's structure and its operational workflow.
Sensor H2O2 Detection Flow
Experimental Methodology
The following section details the protocols used to validate the sensor's performance in detecting bacterial pathogen stress.
Sensor Fabrication
Microneedle Array: A flexible base was created and patterned with an array of microscopic plastic needles [40] [27]. Hydrogel Formulation: A chitosan-based hydrogel mixture was prepared. The mixture was supplemented with an enzyme (e.g., horseradish peroxidase) for H2O2 reaction and reduced graphene oxide (rGO) for electron conduction. This hydrogel was coated onto the microneedle array [27] [45].
Plant Selection and Pathogen Challenge
Test Crops: Live, healthy soybean (Glycine max) and tobacco (Nicotiana tabacum) plants were selected as model organisms [40] [45]. Pathogen Inoculation: Experimental plants were infected with the bacterial pathogen Pseudomonas syringae pv. tomato DC3000. A control group of healthy plants was maintained for comparison [40] [27]. The pathogen was inoculated using standard phytopathological techniques, such as leaf infiltration or spraying, to simulate a natural infection process.
Data Acquisition and Validation
Sensor Measurement: The wearable patches were attached to the undersides of leaves on both healthy and infected plants. The electrical current produced by each sensor was measured and recorded. Each measurement was completed in approximately one minute [40] [27]. Reference Analysis: To confirm the accuracy of the sensor readings, leaf samples were analyzed using conventional laboratory methods (e.g., colorimetric or spectrophotometric assays) for H2O2 quantification. This provided a gold-standard validation of the sensor's output [40] [45].
Results and Data Analysis
The experimental results demonstrated the sensor's efficacy in distinguishing between healthy and stressed plants.
Quantitative Sensor Response: For both soybean and tobacco plants infected with the bacterial pathogen, the sensor produced a significantly higher electrical current on stressed leaves compared to healthy ones. The current levels were directly correlated with the concentration of H2O2 present in the leaf tissues [40] [27]. Measurement Accuracy: The sensor's measurement of H2O2 was confirmed to be accurate through correlation with conventional lab analyses, validating the patch as a reliable diagnostic tool [40]. Performance Metrics: The patches demonstrated a rapid response time, achieving direct measurements in about one minute. They were also found to be reusable, maintaining functional integrity for up to nine measurement cycles before the microscopic needles began to lose their form [40] [27]. The cost per test was estimated at less than one dollar [27].
Table 1: Key Performance Metrics of the Microneedle H₂O₂ Sensor
| Performance Parameter | Result | Context & Significance |
|---|---|---|
| Detection Time | ~60 seconds | Enables near real-time monitoring and swift decision-making [27]. |
| Cost per Test | < $1 USD | Makes the technology practical for widespread use in agriculture [27]. |
| Reusability | 9 cycles | Enhances cost-effectiveness and practicality for field use [40]. |
| Measurement Target | Hydrogen Peroxide (H2O2) | Detects a universal early stress signal, not just water deficit [40]. |
Table 2: Experimental Results: Sensor Response to Bacterial Stress
| Experimental Condition | Sensor Output (Relative Current) | H₂O₂ Level (Confirmed by Lab Assay) | Key Finding |
|---|---|---|---|
| Healthy Soybean Plants | Low baseline current | Low | Establishes a control baseline for comparison [40]. |
| Bacteria-Infected Soybean | Significantly elevated current | High | Sensor reliably indicates pathogen stress [40] [45]. |
| Healthy Tobacco Plants | Low baseline current | Low | Confirms sensor applicability across species [40]. |
| Bacteria-Infected Tobacco | Significantly elevated current | High | Demonstrates cross-species efficacy for pathogen detection [40]. |
The following diagram summarizes the experimental workflow from setup to data analysis.
Experimental Workflow
The Scientist's Toolkit: Research Reagent Solutions
This section catalogs the essential materials and reagents that form the basis of this sensing technology, as derived from the experimental details.
Table 3: Essential Research Reagents and Materials
| Reagent/Material | Function in the Experiment |
|---|---|
| Chitosan-based Hydrogel | Forms a biocompatible matrix that houses the enzyme and conductor; interfaces directly with plant tissue [27] [45]. |
| Reduced Graphene Oxide (rGO) | Serves as a highly conductive nanomaterial within the hydrogel to transport electrons generated by the enzymatic reaction [27]. |
| Specific Enzyme (e.g., HRP) | The catalytic element that reacts specifically with hydrogen peroxide, initiating the electron generation process [27]. |
| Pseudomonas syringae pv. tomato DC3000 | A model bacterial pathogen used to reliably induce biotic stress and H2O2 production in the test plants [40] [45]. |
| Microneedle Array (Plastic) | Provides a microscopic, minimally invasive structure to penetrate the leaf surface and deliver the hydrogel sensing matrix to the plant's apoplast [40] [27]. |
| Flexible Polymer Base | Allows the sensor to conform to the delicate and irregular surface of a live plant leaf, ensuring stable contact [40]. |
Discussion and Future Research Trajectories
The presented case study validates the microneedle sensor as a robust platform for the in situ monitoring of plant stress. The ability to detect hydrogen peroxide levels accurately and in real-time, as confirmed against traditional lab methods, marks a significant milestone in the field of electrochemical nanosensors for agriculture [40] [45]. The technology's low cost and rapid measurement time make it a promising tool not only for research but also for commercial crop management, potentially enabling pre-symptomatic application of targeted therapies.
Future research will focus on refining the technology, with a stated goal of enhancing its reusability beyond the current nine cycles [40] [27]. Further development includes expanding the sensor's capabilities to multiplexed detection of other key stress biomarkers and integrating wireless connectivity for continuous, remote monitoring in large-scale agricultural settings. This progression aligns with the broader thesis of developing comprehensive, real-time diagnostic systems for plant health, ultimately contributing to more resilient and sustainable agricultural practices.
The accurate in-situ monitoring of hydrogen peroxide (H₂O₂) in plant systems (in planta) is crucial for understanding its dual role as a signaling molecule in development and stress responses, and as a cytotoxic agent under oxidative stress [46] [47]. Electrochemical nanosensors are exceptionally suited for this task, offering the potential for real-time, non-destructive measurement of H₂O₂ fluxes with high spatial and temporal resolution. A sensor's analytical performance is defined by three core metrics: sensitivity (the ability to detect minute concentration changes), wide linear range (the span of concentrations over which the sensor responds reliably), and rapid response (the speed at which it delivers a reading). Achieving a superior balance of these metrics in planta presents significant challenges, including interference from complex plant matrices, the need for physiological pH operation, and the requirement for minimal invasiveness. This guide details the materials, mechanisms, and methodologies for developing electrochemical nanosensors that meet these demanding performance criteria for plant research.
Performance Metrics of Advanced Nanomaterial-Based Sensors
The integration of nanostructured materials into sensor design has dramatically enhanced performance. The table below summarizes key metrics achieved by recent non-enzymatic (nanozyme) electrochemical sensors, which offer superior stability over traditional enzyme-based systems [48] [49].
Table 1: Performance comparison of recent non-enzymatic H₂O₂ electrochemical sensors.
| Sensor Material | Sensitivity (µA mM⁻¹ cm⁻²) | Linear Range | Detection Limit | Reference / Application Context |
|---|---|---|---|---|
| Porous Ceria Hollow Microspheres (CeO₂-phm) | 2070.9 - 2161.6 | 0.5 - 450 µM | 0.017 µM | [48] |
| CeO₂-phm/cMWCNTs/SPCE | >2000 | 0.5 - 450 µM | 0.017 µM | Flexible sensor, high sensitivity [48] |
| NiO Octahedrons/3D Graphene Hydrogel (3DGH/NiO25) | 117.26 | 10 µM – 33.58 mM | 5.3 µM | Wide linear range, good for high concentrations [6] |
| Nanostructured Transition Metal Oxides | Varies | Varies | Sub-µM | General class; performance depends on specific composition and morphology [49] |
Interpreting Key Performance Metrics
- Sensitivity refers to the change in current (or other measurable signal) per unit change in analyte concentration. The exceptionally high sensitivity of the CeO₂-phm-based sensor is attributed to its large surface area (168.6 m²/g) and porous structure, which provide abundant active sites for H₂O₂ catalysis [48].
- Linear Range defines the concentration interval where the sensor's response is directly proportional to concentration. A wide linear range, as seen in the 3DGH/NiO25 sensor, is vital for monitoring H₂O₂ in diverse plant contexts, from basal signaling to oxidative burst events [6].
- Detection Limit (LOD) is the lowest detectable concentration of the analyte. A low LOD is essential for sensing subtle, physiologically relevant H₂O₂ fluctuations in the nanomolar range [48] [47].
Experimental Protocols for Sensor Fabrication and Validation
Detailed and reproducible protocols are fundamental to achieving high performance. The following sections outline a representative methodology for creating a high-performance, non-enzymatic H₂O₂ sensor.
Synthesis of Porous Ceria Hollow Microspheres (CeO₂-phm)
This protocol is adapted from the solvothermal synthesis method producing high-sensitivity CeO₂-phm [48].
- Precursor Solution Preparation: Dissolve 2.0 g of cerium nitrate hexahydrate (Ce(NO₃)₃·6H₂O) in 80 mL of ethylene glycol using ultrasonic agitation to ensure complete dissolution.
- Additive Introduction: Add 4 mL of deionized water and 4 mL of glacial acetic acid to the solution. Stir vigorously for 30 minutes to form a homogeneous precursor.
- Solvothermal Reaction: Transfer the solution into a Teflon-lined stainless-steel autoclave. Seal and maintain at 180 °C for 6 hours under static conditions.
- Product Recovery: After natural cooling to room temperature, isolate the yellow precipitate by centrifugation.
- Purification: Wash the collected solid repeatedly with deionized water and ethanol to remove residual ions and organic impurities.
- Drying: Dry the purified product in an oven at 80 °C overnight to obtain the final CeO₂-phm powder.
Sensor Electrode Fabrication and Modification
- Electrode Preparation: Clean and polish a screen-printed carbon electrode (SPCE) according to standard electrochemical practices.
- cMWCNTs Functionalization: Prepare a dispersion of carboxylated multi-walled carbon nanotubes (cMWCNTs) in a suitable solvent (e.g., water/ethanol mixture) and deposit a layer onto the SPCE working electrode. This layer enhances conductivity and provides a scaffold for the nanozyme [48].
- Nanozyme Immobilization: Prepare an ink by dispersing the synthesized CeO₂-phm powder in a solvent (e.g., with a binder like Nafion). Deposit a precise volume of this ink onto the cMWCNTs/SPCE surface and allow it to dry, forming the final CeO₂-phm/cMWCNTs/SPCE working electrode.
Electrochemical Characterization and H₂O₂ Sensing Protocol
- Setup: Use a standard three-electrode system with the modified SPCE as the working electrode, a platinum wire as the counter electrode, and an Ag/AgCl reference electrode in a 0.1 M phosphate buffer solution (PBS, pH 7.4).
- Cyclic Voltammetry (CV): Record CV curves in the absence and presence of H₂O₂ to observe the electrocatalytic redox behavior. A well-defined catalytic current confirms the material's activity.
- Amperometric Detection (i-t Curve):
- Apply a constant optimal reduction potential (e.g., -0.2 V to 0 V vs. Ag/AgCl for CeO₂-based sensors) [48].
- Under continuous stirring, successively add aliquots of H₂O2 standard solution into the PBS to create increasing concentrations.
- Record the current response over time. The steady-state current after each addition is plotted against H₂O₂ concentration to generate the calibration curve from which sensitivity, linear range, and LOD are derived.
- Interference and Stability Tests: Evaluate selectivity by adding common interferents (e.g., ascorbic acid, glucose, dopamine) and monitor the current response. Assess reproducibility and long-term stability by testing multiple electrodes and measuring signal retention over days.
Sensing Mechanisms and Material Design Logic
The exceptional performance of modern nanosensors is rooted in their nanomaterial design, which governs the underlying sensing mechanism. The following diagram illustrates the key operational principles.
The mechanism relies on the electrocatalytic reduction or oxidation of H₂O₂ at the nanomaterial surface. Metal oxide nanozymes like CeO₂ exploit the reversible Ce³⁺/Ce⁴+ redox couple to catalyze H₂O₂ decomposition, generating a measurable current [48]. Transition metal oxides like NiO act as direct catalysts [6] [49]. The material's nanostructure is critical: a porous, high-surface-area architecture (CeO₂-phm) maximizes active sites and analyte diffusion, directly boosting sensitivity and speed [48]. A 3D conductive scaffold (3D graphene hydrogel) prevents nanoparticle aggregation, facilitates electron transfer, and ensures structural stability, which is key to a wide linear range and low detection limit [6].
The Scientist's Toolkit: Essential Research Reagents and Materials
Successful development and implementation of these sensors require a carefully selected set of materials and reagents.
Table 2: Essential reagents and materials for H2O2 nanosensor development.
| Reagent/Material | Function in Sensor Development | Example from Literature |
|---|---|---|
| Cerium Nitrate Hexahydrate | Cerium precursor for synthesizing ceria (CeO₂) nanozymes. | Used in solvothermal synthesis of porous CeO₂ hollow microspheres [48]. |
| Carboxylated MWCNTs (cMWCNTs) | Conductive scaffold to enhance electron transfer; functional groups aid nanozyme immobilization. | Integrated with CeO₂-phm on SPCE to create a high-sensitivity sensor [48]. |
| Screen-Printed Carbon Electrodes (SPCE) | Portable, disposable, and customizable platform for flexible electrochemical sensor design. | Served as the base transducer for the CeO₂-phm/cMWCNTs sensor [48]. |
| Ethylene Glycol | Solvent and mild reducing agent in solvothermal synthesis. | Used in the synthesis of both CeO₂-phm [48] and 3D graphene hydrogel [6]. |
| Nickel Nitrate Hexahydrate | Nickel precursor for synthesizing NiO nanostructures. | Used with a silica template to create NiO octahedrons [6]. |
| Graphene Oxide (GO) | Starting material for creating 3D conductive hydrogel scaffolds. | Self-assembled with NiO octahedrons via hydrothermal method [6]. |
| Phosphate Buffered Saline (PBS) | Standard electrolyte solution for maintaining physiological pH during electrochemical testing. | Used (0.1 M, pH 7.4) for all amperometric detection experiments [6] [48]. |
Achieving high sensitivity, a wide linear range, and a rapid response in electrochemical nanosensors for in planta H₂O₂ monitoring is an attainable goal through rational nanomaterial design. The synergy between highly active nanozymes (e.g., porous CeO₂, NiO) and conductive 3D scaffolds (e.g., graphene hydrogels, cMWCNTs) creates a powerful platform for overcoming the challenges of complex plant environments. The performance metrics and detailed protocols outlined in this guide provide a roadmap for researchers to develop next-generation sensors. These advanced tools will be indispensable for elucidating the precise spatiotemporal dynamics of H₂O₂ in plant signaling, stress responses, and development, ultimately deepening our understanding of plant physiology.
Overcoming Practical Challenges: Biocompatibility, Stability, and Signal Integrity
Ensuring Biocompatibility and Minimizing Plant Tissue Damage During Long-Term Monitoring
The deployment of electrochemical nanosensors for in planta monitoring of hydrogen peroxide (H₂O₂) represents a transformative approach for understanding plant physiology in real-time. H₂O₂ serves as a crucial reactive oxygen species (ROS) signaling molecule involved in plant immune responses, stress signaling, and developmental regulation [50]. Traditional methods for H₂O₂ detection often require destructive sampling and laboratory-based analysis, which disrupts ongoing physiological processes and provides only snapshot data rather than continuous dynamic information [50]. The emerging paradigm of wearable plant sensors and implantable nanosensors offers unprecedented opportunities for continuous monitoring but introduces significant challenges related to biocompatibility and tissue damage minimization during long-term deployment.
This technical guide addresses the critical considerations for ensuring minimal adverse impact on plant systems while maintaining sensor functionality over extended periods. We focus specifically on material selection, sensor design principles, and implantation methodologies that collectively enable successful long-term in planta H₂O₂ monitoring, framed within the broader context of advancing precision agriculture and plant science research [51].
Material Selection for Biocompatibility
Nanomaterial Considerations
The foundation of biocompatible sensor design lies in the careful selection of nanomaterials that provide both electrochemical functionality and minimal tissue reactivity. Carbon-based nanomaterials have demonstrated exceptional properties for plant applications due to their favorable electrochemical characteristics and biocompatibility profile [50]. Specific materials showing promise include:
- Carboxylated multi-walled carbon nanotubes (cMWCNTs): These provide high conductivity while offering functional groups for further modification. Their integration in screen-printed carbon electrodes (SPCE) has enabled sensitive H₂O₂ detection with linear ranges from 0.5 to 450 μM [48].
- Three-dimensional graphene hydrogel (3DGH): This material architecture addresses the restacking problem of 2D graphene while providing a highly porous structure that enhances active site exposure and mass transport [6].
- Cerium oxide (CeO₂) nanomaterials: The redox reversibility (Ce³⁺/Ce⁴⁺) of porous ceria hollow microspheres (CeO₂-phm) enables excellent catalytic activity toward H₂O₂ while demonstrating minimal adverse effects on plant tissues [48].
Surface Modification Strategies
Surface functionalization plays a crucial role in modulating plant tissue response to implanted sensors. Key strategies include:
- Hydrophilic ligand exchange: This technique transfers hydrophobic surfactants from magnetic nanoparticles to hydrophilic ligands through dative chemistry, improving compatibility with aqueous plant environments [52].
- Polymer encapsulation: Biocompatible polymers such as polyvinyl alcohol can be used to create protective barriers between sensing elements and plant tissues while maintaining analyte permeability [53].
- Biomimetic coatings: Materials that mimic plant cell wall components can reduce recognition as foreign bodies, thereby minimizing defensive responses that could compromise sensor function or plant health.
Table 1: Nanomaterial Properties for Biocompatible H₂O₂ Sensing
| Material | Key Properties | Biocompatibility Advantages | Demonstrated Performance |
|---|---|---|---|
| Porous Ceria Hollow Microspheres (CeO₂-phm) | High surface area (168.6 m²/g), uniform pore size (3.4 nm), excellent redox reversibility | Low cytotoxicity, ROS scavenging ability | Sensitivity: 2070-2161 μA·mM⁻¹·cm⁻², LOD: 0.017 μM [48] |
| 3D Graphene Hydrogel/NiO Octahedrons | 3D porous structure, high intrinsic electrical conductivity | Minimal tissue irritation, mechanical flexibility | Sensitivity: 117.26 μA mM⁻¹ cm⁻², Linear range: 10 μM–33.58 mM [6] |
| Carboxylated MWCNTs | High conductivity, functionalizable surface | Enhanced electrolyte penetration, promotes charge transport | Wide linear detection range (0.5-450 μM) when combined with CeO₂-phm [48] |
Sensor Design and Structural Considerations
Miniaturization Approaches
Minimizing sensor footprint is paramount for reducing tissue damage and ensuring long-term viability of monitoring platforms. Recent advances have enabled significant progress in this domain:
- Microneedle-based arrays: These platforms allow minimal tissue invasion while providing direct access to apoplastic fluid and intracellular spaces. Research has demonstrated successful implantation of abscisic acid (ABA) sensors using microneedle arrays that can continuously monitor cucumber fruits with minimal damage [50].
- Inter-digitated microelectrode (IDME) arrays: These designs maximize surface area while minimizing physical dimensions. IDME arrays for salicylic acid detection have maintained functionality for up to one month when attached to cucumber leaves, demonstrating exceptional longevity with minimal tissue impact [50].
- Miniaturized graphite rod electrodes: Compared to conventional glass carbon electrodes, these smaller platforms enable insertion into delicate plant structures such as cherry tomatoes while causing significantly less tissue damage [50].
Flexible and Conformable Designs
Rigid sensor platforms inevitably cause tissue damage through mechanical mismatch with living plant structures. Flexible designs address this fundamental challenge:
- Screen-printed carbon electrodes (SPCE): These platforms offer mechanical adaptability and can conform to plant surfaces while maintaining electrochemical performance. The CeO₂-phm/cMWCNTs/SPCE biosensor demonstrates the successful implementation of this approach for H₂O₂ monitoring [48].
- Textile-based sensors: Emerging technologies integrate sensing elements directly into flexible fabrics that can wrap around stems or leaves, distributing mechanical stress and reducing pressure points that could damage tissues [51].
- Structural considerations: Optimal sensor design must account for plant growth and movement over time. Strategies include stretchable conductive elements and buckling-resistant layouts that maintain electrical connectivity during plant development.
Diagram 1: Workflow for developing biocompatible plant nanosensors, emphasizing iterative biocompatibility testing.
Implantation Techniques and Tissue Integration
Minimally Invasive Insertion Methods
The physical process of sensor implantation represents a critical juncture where tissue damage must be carefully managed:
- Precision insertion protocols: Controlled insertion speeds and angles minimize cell wall rupture and tissue compression. Research indicates that insertion parallel to leaf venation patterns reduces damage compared to perpendicular approaches.
- Micro-scalpel guidance: Creating microscopic access points with specialized tools prior to sensor insertion prevents tearing and crushing of epidermal layers that can occur with direct pressure-based insertion.
- Hydration control: Maintaining appropriate tissue turgor pressure during implantation prevents both desiccation damage and hydraulic shock to adjacent cells.
Wound Response Mitigation
Plants naturally respond to physical damage with complex biochemical cascades that can interfere with sensing accuracy and plant health:
- Antioxidant pre-treatment: Application of low-concentration ascorbate or glutathione to implantation sites can modulate ROS bursts that normally accompany wounding, thereby preserving normal H₂O₂ signaling dynamics.
- Timing considerations: Implantation during specific photoperiods or growth stages can capitalize on natural variations in plant regenerative capacity, with evidence suggesting reduced defensive responses during early vegetative stages.
- Localized cooling: Temporary reduction of tissue temperature at implantation sites can slow metabolic activity and defensive responses without causing permanent damage.
Performance Metrics and Validation Methods
Biocompatibility Assessment
Rigorous evaluation of plant tissue response to implanted sensors is essential for validating biocompatibility:
- Chlorophyll fluorescence imaging: Non-destructive assessment of photosynthetic efficiency provides insight into metabolic impacts of sensor implantation, with deviations from baseline indicating stress responses.
- Histological analysis: Microscopic examination of tissue sections surrounding implantation sites reveals cellular-level responses, including callus formation, cell death, and oxidative browning.
- Long-term viability staining: Viability indicators such as fluorescein diacetate can validate membrane integrity and cellular health in tissues adjacent to sensors over extended periods.
Table 2: Sensor Performance Metrics with Biocompatibility Considerations
| Performance Parameter | Target Values | Biocompatibility Correlation | Testing Methodology |
|---|---|---|---|
| Detection Limit | < 1 μM H₂O₂ | Higher sensitivity enables lower analyte disturbance | Chronoamperometry, standard addition methods [48] [6] |
| Stability | > 30 days continuous operation | Reduced need for replacement minimizes recurrent damage | Continuous operation in relevant plant matrices [50] |
| Response Time | < 5 seconds | Rapid response enables lower sensor concentration | Cyclic voltammetry, amperometric step tests [48] |
| Selectivity | > 100:1 (H₂O₂ vs interferents) | Reduced cross-reactivity minimizes false stress signaling | Interference testing with common plant metabolites [6] |
| Tissue Integration Score | < 10% reduction in photosynthetic efficiency | Direct measure of physiological impact | Chlorophyll fluorescence imaging, gas exchange measurements [51] |
Sensor Function Validation
Ensuring that sensors provide accurate physiological data while minimizing impact requires multifaceted validation:
- Multimodal correlation: Comparing sensor data with established destructive methods (e.g., HPLC, mass spectrometry) verifies accuracy without assuming sensor presence does not affect measurements [52].
- Stress response calibration: Controlled application of known stressors (e.g., mechanical wounding, pathogen elicitors) creates predictable H₂O₂ dynamics that validate sensor responsiveness against established physiological paradigms [50].
- Signal stability monitoring: Tracking signal variance over extended periods distinguishes between sensor drift and genuine physiological dynamics, with excessive drift indicating potential biofouling or tissue encapsulation.
The Scientist's Toolkit: Research Reagent Solutions
Table 3: Essential Materials for Biocompatible Plant Sensor Development
| Reagent/Material | Function | Example Application | Biocompatibility Role |
|---|---|---|---|
| Porous Ceria Hollow Microspheres | Nanozyme catalyst for H₂O₂ reduction | Non-enzymatic H₂O₂ sensing in SPCE platforms | Mimics natural enzyme activity without protein immunogenicity [48] |
| Carboxylated MWCNTs | Conductive network formation | Enhancing electron transfer in composite sensors | Functionalized surface reduces hydrophobic interactions with tissues [48] |
| Nickel Oxide Octahedrons | Electrocatalytic H₂O₂ detection | 3D graphene composite sensors | Template-controlled morphology reduces nanoparticle shedding [6] |
| Polyvinyl Alcohol (PVA) | Polymer matrix for sensor fabrication | "On-plant" wearable electrochemical sensors [53] | Hydrophilic polymer creates biocompatible interface [53] |
| Bismuth-based Electrodes | Heavy-metal-free electrode material | Stripping voltammetry for lead detection | Replacement for toxic mercury electrodes [53] |
| Solvothermal Synthesis Systems | Controlled nanomaterial fabrication | CeO₂-phm with uniform pore architecture | Enables precise morphology control for reduced tissue irritation [48] |
Diagram 2: Relationship between material properties and biocompatibility outcomes in plant nanosensors.
The successful integration of electrochemical nanosensors for long-term in planta H₂O₂ monitoring requires meticulous attention to biocompatibility and tissue damage minimization throughout the design, implantation, and validation process. The synergistic combination of advanced nanomaterials like porous ceria microspheres and 3D graphene hydrogels, miniaturized flexible designs, and minimally invasive implantation techniques creates a pathway toward ethically and scientifically valid plant monitoring platforms. As these technologies continue to evolve, their implementation will undoubtedly expand our understanding of plant signaling dynamics while supporting the development of precision agriculture systems capable of responding to plant needs in real-time. Future directions should focus on completely biodegradable sensor platforms and wireless data transmission to further reduce the long-term footprint of monitoring systems in plant tissues.
Addressing Sensor Fouling and Maintaining Stability in the Complex Plant Milieu
The real-time monitoring of hydrogen peroxide (H2O2) in plants using electrochemical nanosensors represents a transformative capability for understanding plant stress signaling, immunity, and physiological responses. However, the complex plant milieu presents significant challenges for reliable sensor operation, primarily through sensor fouling and performance degradation. The plant apoplast contains numerous interfering compounds—including phenolics, proteins, organic acids, and polysaccharides—that can adsorb to electrode surfaces, reducing sensitivity, selectivity, and operational stability. This technical guide examines the fundamental mechanisms of fouling, material solutions to enhance stability, and characterization methodologies essential for developing robust electrochemical nanosensors for prolonged in planta H2O2 monitoring.
Fouling occurs through multiple pathways in plant systems: biofouling from macromolecular adsorption, chemical fouling from oxidative species, and mechanical fouling from cellular debris. These processes diminish electron transfer kinetics, increase background noise, and ultimately compromise sensor reliability. Maintaining stability requires interdisciplinary approaches spanning materials science, electrochemistry, and plant physiology to create sensors that resist degradation while providing accurate, long-term measurements of H2O2 fluctuations in response to abiotic and biotic stresses.
Fouling Mechanisms in Plant Environments
Primary Fouling Pathways
The plant microenvironment presents unique challenges for electrochemical sensors, with fouling mechanisms that differ significantly from clinical or aquatic environments. The following diagram illustrates the major fouling pathways and their impacts on sensor function:
Plant tissues release various compounds that directly interfere with sensor operation. Phenolic compounds represent particularly challenging interferents due to their redox activity and strong adsorption tendencies. During pathogen attack or wounding, plants generate elevated H2O2 levels alongside other reactive oxygen species (ROS) that can oxidize electrode materials and sensing elements [54] [55]. Additionally, the release of salicylic acid during stress responses creates another redox-active molecule that can compete with H2O2 detection and foul electrode surfaces through polymerization products [55].
The physical structure of plant tissues contributes to mechanical fouling through abrasion and particulate accumulation. Sensor implantation often triggers wound responses, including the release of callose, lignin precursors, and oxidative cross-linking compounds that can encapsulate sensors [56]. This deposition creates diffusion barriers that slow H2O2 transport to the sensing interface, increasing response time and reducing temporal resolution.
Material Strategies for Fouling Resistance
Nanomaterial-Enhanced Electrodes
Nanomaterials provide exceptional advantages for fouling resistance through their tunable surface chemistry, enhanced electrocatalytic properties, and physical barrier capabilities. The integration of carbon-based nanomaterials, particularly carbon nanotubes (CNTs), has demonstrated significant improvements in sensor stability for in planta applications. CNT-based sensors maintain functionality for monitoring H2O2 and salicylic acid even in complex plant matrices [55] [57].
Table 1: Nanomaterial Solutions for Sensor Fouling Mitigation
| Material Class | Specific Materials | Anti-Fouling Mechanism | Performance Benefits | Demonstrated Applications |
|---|---|---|---|---|
| Carbon Nanomaterials | Single-walled carbon nanotubes (SWCNTs), Graphene oxide, Carbonized silk georgette | High conductivity, large surface area, selective permeability | Exceptional detection limit (0.03% strain), high stretchability (up to 100% strain), season-long durability [56] | Plant wearable sensors for growth monitoring, H2O2 detection in stress response [56] [57] |
| Metal Nanoparticles | Gold nanoparticles (AuNPs), Silver nanoparticles (AgNPs) | Electrocatalytic H2O2 detection at lower potentials, minimizing interference | Reduced overpotential, minimized surface passivation | Electrochemical sensing platforms, electrode modification [58] [59] |
| Polymer Coatings | Conductive polymers (PEDOT, polypyrrole), Hydrogels, Chitosan | Size-exclusion properties, hydrophilic surfaces resist protein adsorption | Enhanced biocompatibility, reduced non-specific adsorption | Implantable sensors, wearable plant sensors [60] [59] |
| Hybrid Materials | CNT-polymer composites, Metal-organic frameworks (MOFs) | Combined size exclusion and electrocatalytic enhancement | Synergistic fouling resistance, improved selectivity | Advanced electrochemical sensing platforms [58] [59] |
Surface Modification and Functionalization
Strategic surface modification represents another critical approach for mitigating fouling in plant sensors. Hydrophilic polymer coatings such as polyethylene glycol (PEG) and zwitterionic compounds create hydration barriers that reduce non-specific adsorption of plant macromolecules. These coatings can be applied through electrochemical deposition, self-assembled monolayers, or incorporation into nanocomposites [58] [59].
Biomimetic interfaces inspired by plant cell surfaces offer promising fouling resistance by presenting familiar chemical motifs that minimize defensive responses. Functionalization with plant cell wall components or membrane mimics can reduce the sensor's recognition as a foreign object, thereby diminishing encapsulation and fouling responses [60]. Additionally, size-selective membranes such as Nafion or cellulose derivatives can exclude interfering compounds while permitting H2O2 diffusion, significantly extending functional sensor lifetime [59].
Characterization and Validation Methods
Electrochemical Stability Assessment
Rigorous characterization protocols are essential for quantifying fouling resistance and sensor stability. Cyclic voltammetry provides critical information about electrode surface cleanliness and functionality through monitoring redox peak currents, peak separations, and background currents over time. Specifically, the stability of ferricyanide redox peaks before and after plant exposure indicates the degree of fouling-induced passivation [59].
Electrochemical impedance spectroscopy (EIS) offers sensitive detection of fouling layers by measuring charge transfer resistance (Rct) at the electrode-electrolyte interface. Increasing Rct values correlate with fouling progression, enabling quantitative assessment of anti-fouling strategies. For H2O2 sensors specifically, chronoamperometric stability tests at fixed potentials demonstrate operational reliability under continuous monitoring conditions [59].
Table 2: Standard Protocols for Evaluating Sensor Fouling and Stability
| Characterization Method | Key Parameters | Measurement Intervals | Acceptance Criteria | Fouling Indicators |
|---|---|---|---|---|
| Cyclic Voltammetry (CV) | Peak current (Ip), Peak separation (ΔEp), Capacitive current | Pre-implantation, 24h, 72h, 168h post-implantation | <15% decrease in Ip, <50mV increase in ΔEp | Significant Ip decrease, ΔEp widening |
| Electrochemical Impedance Spectroscopy (EIS) | Charge transfer resistance (Rct), Solution resistance (Rs), Constant phase element (CPE) | Pre-implantation, 24h, 72h, 168h post-implantation | <20% increase in Rct | Exponential increase in Rct |
| Chronoamperometry | Baseline current, Signal-to-noise ratio, Response stability | Continuous monitoring for 72h | <10% signal drift over 24h | Continuous baseline drift, noise increase |
| Calibration Verification | Sensitivity, Linear range, Limit of detection | Pre-implantation and post-explantation | <15% sensitivity change | Sensitivity loss, linear range compression |
Experimental Workflow for Stability Assessment
The following diagram outlines a comprehensive experimental workflow for evaluating fouling resistance and sensor stability in plant systems:
This systematic approach enables researchers to correlate electrochemical performance with surface fouling, identifying failure modes and optimizing material strategies. Post-experiment surface analysis using scanning electron microscopy (SEM) and Fourier-transform infrared spectroscopy (FTIR) provides visual and chemical evidence of fouling layers, complementing electrochemical data [60].
The Scientist's Toolkit: Research Reagent Solutions
Successful development of fouling-resistant H2O2 sensors requires specialized materials and reagents tailored to plant applications. The following table details essential research reagents and their functions in creating stable plant sensors:
Table 3: Essential Research Reagents for Fouling-Resistant H2O2 Sensor Development
| Reagent Category | Specific Examples | Function | Application Notes |
|---|---|---|---|
| Nanomaterials | Single-walled carbon nanotubes (SWCNTs), Graphene oxide, Gold nanoparticles (5-20nm) | Electrode modification for enhanced sensitivity and fouling resistance | SWCNTs enable real-time H2O2 detection with high sensitivity (~8 nm/ppm) [57] |
| Polymer Coatings | Nafion, Chitosan, Polyethylene glycol (PEG), Polyvinyl alcohol (PVA) | Anti-fouling barriers, selectivity enhancement | Nafion excludes negatively charged interferents; chitosan offers biocompatibility [59] |
| Crosslinkers | Glutaraldehyde, EDC-NHS, Genipin | Stabilization of biorecognition elements | Critical for enzyme-based H2O2 sensors; affects sensor longevity |
| Biorecognition Elements | Horseradish peroxidase (HRP), Prussian blue, Hemin | Catalytic H2O2 detection | Enzyme-free systems (Prussian blue) offer superior stability in complex media [61] |
| Stabilizers | BSA, Trehalose, Sucrose | Preservation of biorecognition element activity | Maintains sensor functionality during implantation and extended use |
Addressing sensor fouling and maintaining stability in the complex plant environment remains a significant challenge, but substantial progress has been made through nanomaterial engineering and surface chemistry strategies. The integration of carbon nanotubes with selective polymer coatings has demonstrated particularly promising results for extended in planta H2O2 monitoring [55] [57]. Future advancements will likely incorporate multifunctional coatings that combine fouling resistance with self-cleaning capabilities, potentially through enzyme-integrated surfaces or stimuli-responsive materials.
The growing integration of artificial intelligence with sensor systems presents opportunities for adaptive calibration that compensates for fouling-induced drift [57]. Additionally, wireless readout platforms enable sensor replacement before complete failure, while advances in biocompatible encapsulation may further extend functional sensor lifetimes. These developments will collectively enhance the reliability of H2O2 monitoring in plant systems, providing researchers with robust tools for unraveling plant signaling networks and stress response mechanisms.
As these technologies mature, standardization of stability assessment protocols and reporting metrics will facilitate comparative evaluation of anti-fouling strategies across research groups. Through continued interdisciplinary collaboration between materials science, electrochemistry, and plant biology, the next generation of electrochemical nanosensors will overcome current limitations, enabling unprecedented insights into plant physiological processes through stable, long-term H2O2 monitoring.
Optimizing Nanomaterial Functionalization and Enzyme Immobilization for Enhanced Selectivity
The development of robust and selective electrochemical nanosensors for the in-planta monitoring of hydrogen peroxide (H2O2) represents a frontier in plant science research. Hydrogen peroxide acts as a key signaling molecule in plant physiology; its precise, real-time detection can provide critical insights into early-stage stress responses and metabolic processes [62]. The core challenge lies in creating a stable, sensitive, and selective interface between the biological environment and the sensing electrode. This is achieved through the strategic functionalization of nanomaterials with specific enzymes, forming the basis of advanced nanobiocatalysts [63]. These systems overcome major limitations of native enzymes, such as poor stability, limited reusability, and low activity under operational conditions, by immobilizing them onto nanostructured supports [64]. This guide details the technical protocols and material considerations for optimizing these nanomaterial-enzyme complexes, with a specific focus on enhancing selectivity for H2O2 detection within the complex milieu of plant tissues. The ultimate goal is to enable the conversion of biochemical signals into reliable, machine-learnable data, such as distinctive thermal signatures, for advanced plant phenotyping [62].
Nanomaterial Synthesis and Functionalization Methodologies
The selection and preparation of the nanomaterial support are the first critical steps in constructing an effective nanosensor. The support material directly influences the immobilized enzyme's stability, activity, and reusability by providing a robust framework for enzyme binding and fostering an optimal microenvironment [63].
Synthesis Techniques for Nanomaterial Supports
Nanomaterials are synthesized via two principal methodologies, each with distinct advantages for sensor fabrication, as summarized in Table 1.
Table 1: Comparison of Top-Down and Bottom-Up Nanomaterial Synthesis Approaches
| Methodology | Description | Common Techniques | Advantages | Disadvantages |
|---|---|---|---|---|
| Top-Down | Fragmentation of bulk material into nanoscale particles [63]. | Ball milling, Laser ablation, Ion sputtering [63]. | Scalable, direct control over particle size. | Surface defects, high energy consumption, limited material diversity [63]. |
| Bottom-Up | Construction of nanomaterials from atomic or molecular components [63]. | Coprecipitation, Sol-gel, Hydrothermal methods [63]. | High uniformity, minimal defects, complex morphologies. | Can require complex purification, potentially lower yield [63]. |
For electrochemical nanosensors, bottom-up methods are often preferred due to the superior control over surface chemistry and morphology, which are crucial for subsequent enzyme immobilization.
Selection and Functionalization of Nanomaterials
The choice of nanomaterial is dictated by its intrinsic properties and compatibility with the electrochemical transducer and the biological enzyme. Key categories include:
- Magnetic Nanoparticles (MNPs): Typically iron oxides (e.g., Fe₃O₄) are prized for their easy separation from a reaction mixture using a magnetic field, high surface-to-volume ratio, and superparamagnetism [63]. Surface functionalization with groups like amines or carboxyls is essential for enzyme attachment.
- Porous Silica and Carbon-Based Nanomaterials: Mesoporous silica structures (e.g., SBA-15, MCM-41) offer high surface area and tunable pore sizes, which can encapsulate enzymes, enhancing stability and selectivity [63]. Carbon-based nanostructures (e.g., graphene oxide, carbon nanotubes) provide exceptional electrical conductivity, chemical stability, and large surface area, facilitating enhanced electron transfer in electrochemical sensing [63].
- Metal and Metal-Oxide Nanoparticles: Gold, platinum, and palladium nanoparticles, as well as metal-oxides like zinc oxide and titanium dioxide, are ideal due to their small size, unique quantum properties, and ability to facilitate charge transfer and modulate enzyme activity [63].
The functionalization process involves modifying the nanomaterial surface with specific chemical groups to enable strong and stable enzyme binding. A generalized workflow is provided in the diagram below.
Enzyme Immobilization Techniques for Enhanced Selectivity
Immobilization is not merely about attaching an enzyme; it is about orienting and stabilizing it to maximize its catalytic activity and specificity towards H2O2. The choice of immobilization technique profoundly impacts the sensor's selectivity, stability, and overall performance. A comparative overview of the primary techniques is provided in Table 2.
Table 2: Comparative Analysis of Enzyme Immobilization Techniques for H2O2 Nanosensors
| Immobilization Technique | Mechanism | Advantages | Disadvantages | Impact on Selectivity |
|---|---|---|---|---|
| Adsorption | Physical attachment via hydrophobic interactions, van der Waals forces, or hydrogen bonding [63]. | Simple, cost-effective, preserves native enzyme structure [63]. | Weak binding, enzyme leakage under changing conditions (pH, ionic strength) [63]. | Low; susceptible to interference from fouling. |
| Covalent Bonding | Formation of strong covalent bonds between enzyme functional groups (-NH₂, -COOH) and activated support [63]. | Very stable binding, minimal leakage, high reusability, allows for controlled orientation [63]. | Harsh conditions can reduce enzyme activity, complex procedure [63]. | High; stable linkage prevents displacement by interferents. |
| Entrapment/Encapsulation | Enclosing enzymes within a porous polymer matrix or semi-permeable membrane [63]. | Protects enzyme from harsh environments (e.g., proteases, shear forces) [63]. | Mass transfer limitations, potential for enzyme leakage, can increase response time [63]. | Moderate; matrix can filter out large interferents. |
| Cross-Linking | Enzymes are linked to each other or to a support via bifunctional cross-linkers (e.g., glutaraldehyde) to form aggregates (CLEAs) [63]. | High enzyme loading, no inert support needed, excellent stability [63]. | Can restrict substrate access, may use harsh chemicals [63]. | Moderate; dense aggregate can limit access to active site. |
For high-selectivity in-planta H2O2 sensing, covalent bonding is often the preferred method due to the robust and irreversible attachment it provides, which is crucial for maintaining sensor integrity in the dynamic plant apoplast.
Detailed Experimental Protocol: Covalent Immobilization of Horseradish Peroxidase (HRP) onto Aminated Magnetic Nanoparticles
This protocol is a representative example for creating a highly selective nanobiocatalyst for H2O2 detection.
Research Reagent Solutions & Essential Materials: Table 3: Key Reagents for Enzyme Immobilization
| Item | Function/Description |
|---|---|
| Horseradish Peroxidase (HRP) | The biological recognition element that catalyzes the oxidation of a substrate in the presence of H2O₂. |
| Aminated Magnetic Nanoparticles (NH₂-MNPs) | The nanostructured support; provides high surface area, easy separation, and functional groups for covalent attachment [63]. |
| Glutaraldehyde (25% solution) | A homobifunctional cross-linker that reacts with amine groups on both the NP and the enzyme to form a stable Schiff base [63]. |
| Phosphate Buffered Saline (PBS, 0.1M, pH 7.4) | A physiological buffer to maintain enzyme stability during the immobilization process. |
| Sodium Cyanoborohydride (NaBH₃CN) | A reducing agent to stabilize the Schiff base formed between glutaraldehyde and amines, converting it to a stable secondary amine linkage. |
| Ethanolamine (1M solution) | Used to "block" any remaining unreacted aldehyde groups on the support after immobilization to prevent non-specific binding. |
Methodology:
- Support Activation: Disperse 10 mg of NH₂-MNPs in 2 mL of PBS (0.1 M, pH 7.4). Add glutaraldehyde to a final concentration of 2.5% (v/v). Incubate the mixture with gentle agitation for 2 hours at room temperature.
- Washing: Separate the activated MNPs using a magnet and wash thoroughly with PBS to remove any unbound glutaraldehyde.
- Enzyme Coupling: Re-disperse the activated MNPs in 2 mL of PBS. Add 2 mg of HRP enzyme to the solution. Allow the coupling reaction to proceed with gentle agitation for 12 hours at 4°C.
- Stabilization (Optional but Recommended): Add a small amount of sodium cyanoborohydride (final concentration 1-5 mM) and incubate for 1 hour to reduce the Schiff bases and stabilize the linkages.
- Blocking: Separate the HRP-bound MNPs (MNPs-HRP) and wash with PBS. Re-disperse in 2 mL of 1M ethanolamine (in PBS, pH 8.0) and incubate for 1 hour to quench residual aldehyde groups.
- Final Wash and Storage: Wash the resulting nanobiocatalyst extensively with PBS to remove any physically adsorbed enzyme. The MNPs-HRP conjugate can be stored in PBS at 4°C until use.
The logical process for selecting an immobilization technique based on sensor requirements is outlined below.
Performance Evaluation and Data Presentation
After immobilization, the performance of the nanobiocatalyst must be rigorously quantified. Key metrics include activity, stability, reusability, and kinetic parameters.
Table 4: Key Performance Metrics for Immobilized Enzyme Systems in H₂O₂ Sensing
| Performance Metric | Description | Experimental Measurement | Target for In-Planta Sensors |
|---|---|---|---|
| Immobilization Yield | Percentage of enzyme successfully bound to the support. | (Total protein added - Free protein in supernatant) / Total protein added * 100% | > 80% |
| Activity Recovery | Percentage of catalytic activity retained after immobilization. | (Activity of immobilized enzyme / Activity of free enzyme) * 100% | Maximize (Target > 60-70%) |
| Thermal Stability | Retention of activity after exposure to elevated temperatures. | Incubate at 40-60°C over time; measure residual activity. | Significant improvement over free enzyme. |
| Operational Stability | Retention of activity over multiple catalytic cycles. | Measure activity over repeated use cycles (e.g., 10-20 cycles). | > 80% activity after 10 cycles. |
| Apparent Km (Michaelis Constant) | Measure of the enzyme-substrate affinity; a lower Km indicates higher affinity. | Kinetic assays with varying H₂O₂ concentrations. | Should be comparable to or lower than free enzyme. |
| Selectivity/Interference | Sensor response to H₂O₂ vs. other common biological molecules (e.g., ascorbic acid, uric acid). | Measure amperometric response in the presence of potential interferents. | High selectivity; < 5% signal change from interferents. |
The data from these evaluations should be visualized effectively. For instance, operational stability is best presented in a line chart showing percent activity remaining versus cycle number, while a bar chart can effectively compare the activity of different immobilization techniques. Adherence to visual accessibility guidelines, such as ensuring a minimum color contrast ratio of 3:1 for graphical elements, is essential for clear scientific communication [65] [66].
Strategies for Mitigating Interference from Chlorophyll and Other Plant Metabolites
Electrochemical nanosensors represent a transformative technology for the real-time, in vivo monitoring of hydrogen peroxide (H2O2) and other signaling molecules in living plants (phyto-monitoring). These sensors, defined as selective transducers with a characteristic dimension at the nanometre scale, offer exquisite sensitivity and versatility for studying plant signaling pathways and metabolism in ways that are non-destructive, minimally invasive, and capable of real-time analysis [67]. However, the complex chemical environment within plant tissues—characterized by an abundance of chlorophyll and numerous secondary metabolites—poses significant challenges to measurement accuracy through various interference mechanisms.
This technical guide synthesizes current methodologies for mitigating these interferents, framed within the broader context of advancing electrochemical nanosensor applications for in planta H2O2 monitoring. Successful implementation of these strategies is crucial for obtaining reliable data on H2O2 dynamics, which plays a key role as both a signaling molecule and a stress indicator in plant systems [68] [69]. The guidance herein is targeted toward researchers and scientists engaged in developing robust phytomonitoring platforms.
Understanding the Interference Challenge in Plant Systems
The interior of a plant cell is a chemically complex milieu. When deploying nanosensors, particularly electrochemical variants, several classes of endogenous compounds can generate confounding signals.
- Chlorophyll and Photosynthetic Pigments: These compounds present a significant challenge for optical sensor systems due to their strong absorption in the blue and red regions of the spectrum, which can overlap with the excitation or emission spectra of many fluorophores used in sensor design [67]. Their autofluorescence can severely obscure signal detection in fluorescence-based methodologies.
- Reactive Oxygen Species (ROS) and Antioxidants: The plant's own antioxidant systems, including enzymes like ascorbate peroxidase (APX) and catalases (CATs), continuously modulate H2O2 levels [68]. Other ROS, such as superoxide anion, may also undergo side reactions at the sensor surface, competing with the target H2O2 and leading to inaccurate readings.
- Phenolic Compounds and Secondary Metabolites: Many plant species synthesize a wide array of phenolic compounds, flavonoids, and quinones that can adsorb onto sensor surfaces, potentially fouling them and reducing sensitivity. Furthermore, some of these compounds are electroactive at similar potentials to H2O2, creating direct electrochemical interference in amperometric or voltammetric measurements.
- Ionic Variations and pH Fluctuations: Changes in the concentrations of ions such as Ca²⁺, H⁺, K⁺, and Na⁺ in the apoplast or cytoplasm can influence the electrochemical double layer at the sensor interface, potentially altering the faradaic current used for H2O2 quantification [67]. Intracellular and extracellular pH can vary significantly during signaling events or stress responses, affecting both sensor performance and H2O2 reactivity.
Table 1: Major Interfering Compounds in Plant Systems and Their Impact on Nanosensors
| Interferent Category | Specific Examples | Primary Interference Mechanism | Sensors Most Affected |
|---|---|---|---|
| Photosynthetic Pigments | Chlorophyll a & b, Carotenoids | Light absorption & autofluorescence | Optical (FRET, SERS) |
| Reactive Oxygen Species | Superoxide (O₂•⁻), Hydroxyl radical (•OH) | Cross-reactivity at sensor surface | Electrochemical, Optical |
| Antioxidants | Glutathione, Ascorbate, Catalase, Peroxiredoxin | Scavenging of target H2O2, direct oxidation | Electrochemical |
| Phenolic Compounds | Flavonoids, Lignin precursors, Quinones | Surface adsorption, direct electroactivity | Electrochemical |
| Ionic Fluctuations | Ca²⁺, H⁺, K⁺ | Alteration of electrochemical interface | Electrochemical |
H2O2 Signaling in Plants: A Complex Background
H2O2 serves dual roles in plant physiology: at low concentrations, it acts as a key signaling molecule in processes such as stomatal closure, acclimation to stress, and cellular development; at high concentrations, it contributes to oxidative damage [68] [69]. This duality necessitates precise measurement. The primary enzymatic sources of H2O2 in plants are respiratory burst oxidase homologs (RBOHs), such as ClRbohD identified in watermelon [69]. Major scavenging pathways involve catalases in peroxisomes and ascorbate peroxidases in other compartments [68]. Understanding these dynamics is essential for distinguishing true signaling from measurement artifact.
Optical Interference Mitigation Strategies
For sensors relying on optical detection, such as FRET-based or SERS nanosensors, chlorophyll presents the most significant challenge.
Spectral Resolution Techniques
- Wavelength Selection: Choosing reporter fluorophores with excitation and emission profiles that fall within the "green window" of plant tissue transparency (approximately 500-600 nm) can minimize absorption by chlorophyll. The HyPer sensor, a genetically encoded H2O2 probe, uses a circularly permuted YFP (cpYFP) with excitation peaks at 420 and 500 nm, which provides a ratiometric measurement that can be partially distinguished from chlorophyll autofluorescence [68].
- Ratiometric Measurements: Genetically encoded sensors like HyPer and cameleons (for Ca²⁺) are designed for ratiometric output [67] [68]. This self-referencing approach corrects for variations in probe concentration, path length, and, crucially, the static background signal from chlorophyll, significantly improving signal-to-noise ratio in intact tissues.
- Time-Gated Fluorescence: Utilizing lanthanide-doped nanoparticles or long-lifetime phosphors can allow for time-resolved detection. By delaying measurement after excitation until after the short-lived chlorophyll autofluorescence has decayed, the specific sensor signal can be isolated with high fidelity.
Physical and Computational Approaches
- Two-Photon Excitation Microscopy: This technique uses near-infrared light for excitation, which penetrates plant tissue more effectively and is less absorbed by chlorophyll. It also excites a much smaller focal volume, inherently reducing background autofluorescence from regions outside the plane of focus.
- Computational Background Subtraction: Advanced imaging software can characterize the spectral signature of chlorophyll autofluorescence from control tissues lacking the sensor. This reference spectrum can then be used to computationally subtract the background from images of sensor-expressing plants.
Table 2: Summary of Optical Interference Mitigation Strategies
| Strategy | Underlying Principle | Example Implementation | Advantages | Limitations |
|---|---|---|---|---|
| Wavelength Selection | Avoidance of chlorophyll absorption/emission bands | Use of cpYFP in HyPer sensor (Ex 500 nm) [68] | Simple, can be applied to many fluorophores | Limited by available fluorophores & plant transparency windows |
| Ratiometric Sensing | Self-calibration using ratio of two emission/excitation peaks | FRET-based nanosensors (e.g., cameleons for Ca²⁺) [67] | Corrects for background, probe concentration | Requires genetically encoded or dual-fluorophore systems |
| Time-Gated Detection | Separation of signals based on fluorescence lifetime | Lanthanide-doped nanoparticles | Effectively removes short-lived autofluorescence | Requires specialized probes and instrumentation |
| Two-Photon Microscopy | Reduced scattering & autofluorescence via NIR excitation | Deep-tissue imaging of GFP-based sensors | Superior tissue penetration, confined excitation volume | High cost of equipment, potential for photodamage |
Electrochemical Interference Mitigation Strategies
Electrochemical nanosensors, which report changes via electrical signals resulting from redox reactions, are highly susceptible to chemical interferents.
Sensor Surface Engineering
- Permselective Membranes: Coating the electrode surface with a thin polymer membrane (e.g., Nafion, chitosan, or poly-phenylenediamine) can be highly effective. These membranes are chosen for their selective permeability, often based on charge. For example, Nafion, a sulfonated polymer, is cation-selective due to its negative charges. It can repel negatively charged ascorbate and urate while allowing the neutral H2O2 molecule to diffuse to the electrode surface.
- Nanomaterial-Based Selectivity: The choice of nanomaterial for the working electrode fundamentally influences selectivity. Carbon nanomaterials like carbon nanotubes or graphene can be modified with specific metal or metal oxide nanoparticles (e.g., Pt, Pd, Au) that catalyze the oxidation or reduction of H2O2 at a distinct, overpotential-lowered potential. This allows the operating voltage to be set to a value where common interferents like phenolics do not yet undergo significant redox reactions.
- Molecularly Imprinted Polymers (MIPs): These synthetic polymers contain cavities tailored to the size, shape, and functional groups of the H2O2 molecule. MIPs coated on an electrode can act as a highly selective filter, recognizing and preconcentrating H2O2 while excluding larger or differently shaped molecules.
Electrochemical Protocols and Data Processing
- Potential Step Methods: Techniques like chronoamperometry, where the potential is held constant at the optimal value for H2O2 detection, are simple but vulnerable to interferents with similar redox potentials. More advanced pulsed techniques, such as pulsed amperometric detection (PAD), can periodically apply cleaning potentials to oxidatively desorb fouling agents from the electrode surface, restoring activity.
- Fast-Scan Cyclic Voltammetry (FSCV): By applying rapid potential sweeps (hundreds of V/s), FSCV can distinguish analytes based on their characteristic redox peak potentials and shapes. The resulting "electrochemical fingerprint" can help differentiate H2O2 from other compounds, even in a complex mixture.
Biological and Genetic Mitigation Strategies
Leveraging plant biology itself offers powerful pathways to cleaner measurements.
Subcellular Targeting
A highly effective strategy is to bypass the crowded cytoplasmic environment altogether by genetically targeting sensors to specific organelles. As demonstrated in research on plant peroxisomes, targeting the H2O2 sensor HyPer directly to the organelle of interest (using a C-terminal KSRM peroxisomal targeting sequence) allows for the direct measurement of H2O2 fluxes in a defined compartment [68]. This localizes the measurement to the site of action or production, minimizing interference from metabolites in other cellular compartments. This approach can be extended to mitochondria, chloroplasts, and the apoplast.
Use of Mutant or Transgenic Plant Lines
- Antioxidant Mutants: Conducting experiments in plant lines with knocked-down or knocked-out antioxidant enzymes (e.g., catalase, peroxiredoxin) can provide a cleaner background by reducing the rapid scavenging of H2O2, making it easier to detect. For instance, studies in Cl2-CP-silenced watermelon plants revealed alternative H2O2-activated antioxidant pathways [69].
- Sensor-Specific Transgenics: The generation of stable transgenic plant lines, such as Arabidopsis expressing peroxisome-targeted HyPer, ensures consistent and tissue-specific sensor expression, reducing the need for invasive delivery methods that can perturb the system and introduce artifacts [68].
Experimental Protocols for Validation
Protocol for Validating Sensor Specificity in Plant Extracts
Objective: To confirm that the nanosensor responds specifically to H2O2 in the presence of native plant metabolites.
- Preparation of Plant Extract: Homogenize plant tissue (e.g., leaf) in an appropriate buffer (e.g., phosphate buffer, pH 7.0) under liquid nitrogen to minimize metabolite degradation. Centrifuge at high speed (e.g., 15,000 x g, 20 min, 4°C) to remove debris. Filter the supernatant through a 0.22 µm filter.
- Control Measurements: Divide the extract into aliquots.
- Aliquot 1 (Baseline): Measure the initial sensor response in the extract.
- Aliquot 2 (H2O2 Spike): Spike with a known concentration of H2O2 (e.g., 10 µM) and measure the sensor response.
- Aliquot 3 (Enzymatic Control): Pre-incubate the extract with a high concentration of catalase (100 U/mL) for 15 minutes to scavenge endogenous H2O2. Then, spike with the same known H2O2 concentration and measure. A significantly attenuated signal confirms sensor specificity for H2O2.
- Aliquot 4 (Interferent Test): Spike with a relevant concentration of a known interferent (e.g., 100 µM ascorbate or a phenolic compound) and measure the sensor response relative to the H2O2 spike.
- Data Analysis: Calculate the recovery percentage of the H2O2 spike in the plant matrix. Compare the signal from the interferent spike to that of H2O2 to determine selectivity.
Protocol for In Planta Calibration using H2O2 Uncouplers
Objective: To perform an in-situ calibration of an H2O2 nanosensor within living plant tissue.
- Sensor Implantation/Imaging: Introduce the nanosensor into the target plant tissue (e.g., by pressure infiltration of nanoparticle-based sensors, microinjection, or using stable transgenic lines expressing genetically encoded sensors).
- Baseline Recording: Acquire a stable baseline signal (optical or electrochemical) from the sensor in the undisturbed plant.
- Application of Uncoupler: Gently perfuse the tissue with a solution containing an H2O2-generating system or an inhibitor of H2O2 scavenging. A common method is to use the catalase inhibitor 3-Amino-1,2,4-triazole (ATZ, 1-10 mM) to allow endogenous H2O2 to accumulate. Alternatively, a pulse of exogenous H2O2 can be applied, as was done in guard cell experiments [68].
- Signal Correlation: Correlate the measured sensor signal with the externally modulated H2O2 level. For example, the dose-dependence of the HyPer ratio change (ΔR/R0) on exogenous H2O2 can be established [68]. This generates a calibration curve specific to the in-plant environment.
The Scientist's Toolkit: Key Research Reagent Solutions
Table 3: Essential Reagents and Materials for In Planta H2O2 Sensing Research
| Reagent/Material | Function/Application | Example Use Case |
|---|---|---|
| Genetically Encoded H2O2 Sensor (e.g., HyPer) | Ratiometric, specific in vivo H2O2 detection [68] | Targeted to organelles (e.g., peroxisomes via KSRM signal) to study compartment-specific H2O2 dynamics. |
| Cameleon Ca²⁺ Indicators (e.g., D3cpv) | Ratiometric FRET-based Ca²⁺ sensing [67] [68] | Elucidating Ca²⁺-H2O2 cross-talk, e.g., Ca²⁺ activation of catalase in peroxisomes [68]. |
| Virus-Induced Gene Silencing (VIGS) Vectors | Transient knock-down of endogenous genes [69] | Functional studies of H2O2-generating (e.g., ClRbohD [69]) or scavenging (e.g., Cl2-CP [69]) enzymes. |
| Catalase & Ascorbate Peroxidase | Enzymatic H2O2 scavengers for control experiments | Validation of sensor specificity by quenching the H2O2 signal. |
| 3-Amino-1,2,4-triazole (ATZ) | Catalase inhibitor | To induce endogenous H2O2 accumulation for in-planta sensor calibration. |
| Permselective Membrane Materials (e.g., Nafion) | Electrode coating for improved selectivity | Rejection of anionic interferents (ascorbate) in electrochemical nanosensors. |
Visualizing the Workflow and Signaling Pathways
The following diagrams outline the core experimental workflow for deploying nanosensors and the key H2O2-Ca²⁺ signaling interplay that can be studied with these tools.
In Planta H2O2 Sensing Workflow
H2O2-Ca²⁺ Signaling Interplay in Plant Cells
Improving Sensor Lifespan and Reusability for Cost-Effective Agricultural Application
The integration of electrochemical nanosensors for in planta hydrogen peroxide (H2O2) monitoring represents a transformative approach for assessing plant stress responses in real-time. H2O2 is a key redox signalling molecule involved in numerous physiological and pathological processes in plants, and its accurate quantification can serve as a quantitative indicator of environmental stress [70] [71] [2]. However, the transition from laboratory demonstrations to viable, cost-effective agricultural applications hinges on overcoming significant challenges related to sensor longevity and reusability. This whitepaper provides an in-depth technical guide on the core principles, materials, and experimental methodologies essential for enhancing the operational lifespan and reusability of electrochemical nanosensors. By synthesizing recent advancements in nanomaterials design, substrate engineering, and system maintenance protocols, this document aims to equip researchers and scientists with the strategies needed to develop robust, durable sensing systems for sustained in-field plant health monitoring.
Hydrogen peroxide (H2O2) is a central reactive oxygen species (ROS) in plant systems, functioning as a critical signalling molecule in development and stress acclimation [2]. Its concentration within plant tissues fluctuates in response to various abiotic and biotic stresses, including salinity, drought, heat, and chilling. Consequently, the quantification of H2O2 provides a valuable window into a plant's physiological status and its ability to cope with adverse environmental conditions [71]. The ability to monitor H2O2 levels in planta, and in real-time, can thus inform precision agriculture practices, enabling targeted interventions to mitigate stress and optimize crop productivity.
Traditional methods for H2O2 detection, such as colorimetric assays or fluorescence microscopy, often lack the spatial and temporal resolution required for in-field monitoring and may introduce perturbations to native cellular physiology [70]. Electrochemical nanosensors offer a promising alternative, capable of quantitative, in-situ detection with high sensitivity and minimal invasiveness. Despite their potential, a key barrier to their widespread agricultural application is the limited lifespan and reusability of many sensor designs, which impacts long-term cost-effectiveness and practical deployment.
Core Principles for Enhancing Sensor Longevity
The lifespan of a sensor is determined by its ability to maintain performance specifications—such as sensitivity, selectivity, and response time—over time and through repeated use. Key determinants of longevity include the stability of the sensing materials, the integrity of the sensor substrate, and the conditions of the operational environment [72].
Material Selection and Nanostructure Design
The choice of electrocatalytic material and its nanostructure is paramount for both sensor performance and durability. Enzymeless sensors utilizing stable inorganic catalysts avoid the inherent fragility and limited lifespan of enzyme-based systems [6] [73].
- Stable Catalytic Materials: Transition metal oxides, such as nickel oxide (NiO) and cobalt phthalocyanine (CoPc), have demonstrated excellent electrocatalytic performance for H2O2 detection alongside high structural stability. For instance, NiO octahedrons decorated on 3D graphene hydrogel exhibit not only high sensitivity but also good long-term stability [6]. Similarly, CoPc modified electrodes show very good sensing performance with high selectivity and stability for quantitative detection [70].
- Robust Conductive Supports: Integrating active materials with three-dimensional (3D) conductive supports, such as 3D graphene hydrogel (3DGH), mitigates issues like agglomeration and restacking that plague two-dimensional materials. This preserves the electroactive surface area over repeated use, which is critical for maintaining sensor response [6]. The 3DGH/NiO nanocomposite demonstrates the benefit of this approach, showing superior electrochemical performance and stability [6].
Substrate and Mechanical Durability
For sensors deployed in agricultural settings, mechanical flexibility and durability are essential. The substrate forms the physical backbone of the flexible sensor and must be chosen carefully.
Table 1: Comparison of Flexible Substrates for H2O2 Sensors
| Substrate Material | Key Advantages | Limitations for Longevity | Suitability for Agri-Application |
|---|---|---|---|
| Carbonaceous (e.g., Carbon Cloth, Graphene Fibers) | High intrinsic conductivity, chemical stability, large surface area. | Can be prone to cracking under intense mechanical stress. | High - suitable for implantable or wearable plant sensors. |
| Polymeric Films | Good flexibility, tunable properties, low cost. | May swell or degrade in certain chemical environments. | Medium - requires careful polymer selection for soil/plant chemistry. |
| Paper | Ultra-low cost, disposable, biodegradable. | Low mechanical strength, susceptible to humidity. | Low - best for single-use diagnostic applications. |
| Thin Glass/Silicon | Excellent chemical and thermal stability. | Intrinsically brittle, limited flexibility. | Low - fragile for field deployment. |
As summarized in Table 1, carbonaceous and certain polymeric substrates offer the best balance of flexibility, chemical stability, and conductivity for long-lived agricultural sensors [73].
System-Level Design for Maintenance and Calibration
A sensor's functional lifespan is extended through proper maintenance and calibration. System design should incorporate features that facilitate these processes.
- Modular Software and Hardware: Utilizing a modular architecture, such as PXI or VXI for hardware, and software frameworks with standardized APIs (e.g., IVI drivers), allows for easier system expansion, component replacement, and code reuse. This extends the usable life of the entire test system [74].
- Regular Maintenance Protocols: Sensor performance is preserved through regular cleaning to remove environmental contaminants (e.g., dust, soil, biological fluids), checking of alignment and calibration, and updating of firmware and software [72].
- Cost of Capital and Replacement: An economic model comparing single-use versus reusable sensors in a medical context revealed that reusable clips generated massive cost savings and waste reduction compared to single-use stickers, even when accounting for cleaning workload and replacement due to loss or damage [75]. This principle translates directly to agriculture, where a reusable sensor strategy can significantly lower the total cost of ownership.
Experimental Protocols for Key Experiments
This section details methodologies for fabricating and characterizing a robust, reusable H2O2 sensor, drawing from validated approaches in recent literature.
Fabrication of a 3D Graphene Hydrogel/NiO Octahedron Nanocomposite Sensor
This protocol is adapted from the work on enzymeless electrochemical detection of H2O2 [6].
Objective: To synthesize a sensitive and stable nonenzymatic H2O2 sensor electrode.
Materials:
- Graphite powder (for graphene oxide synthesis)
- Nickel (II) nitrate hexahydrate (Ni(NO₃)₂·6H₂O)
- Mesoporous silica (SBA-15)
- Sodium hydroxide (NaOH) pellets
- Ethanol
- Ultrapure water
- Phosphate buffer solution (PBS, 0.1 M, pH 7.4)
Equipment:
- Teflon-lined autoclave
- Muffle furnace
- Freeze dryer
- Ultrasonicator
- Electrochemical workstation (for cyclic voltammetry and chronoamperometry)
Procedure:
- Synthesis of NiO Octahedrons:
- Dissolve 10 mg of SBA-15 silica in 100 mL of anhydrous ethanol containing 10 mg of Ni(NO₃)₂·6H₂O. Stir for 24 hours at room temperature.
- Dry the mixture at 80°C for 48 hours. Grind the resulting powder and repeat the dissolution and drying process once more.
- Calcinate the final dry product in a muffle furnace at 550°C for 3 hours with a heating rate of 2°C per minute.
- Remove the silica template by treating the product twice with 2 M NaOH at 60°C. Wash repeatedly with ethanol and water, then dry in a vacuum oven at 70°C for 12 hours.
Self-Assembly of 3DGH/NiO Nanocomposite:
- Disperse 48 mg of graphene oxide (synthesized via a modified Hummers' method) in 32 mL of deionized water containing 12 mg of the as-synthesized NiO octahedrons.
- Sonicate the mixture using a bath sonicator for 2 hours, followed by probe sonication for 1.5 hours to achieve a homogeneous dispersion.
- Transfer the mixture to a 45 mL Teflon-lined autoclave and maintain at 180°C for 12 hours for the hydrothermal reaction.
- After natural cooling to room temperature, wash the resulting 3DGH/NiO25 hydrogel numerous times with deionized water and dry using a freeze dryer.
Electrode Modification:
- The 3DGH/NiO25 nanocomposite can be directly used as a free-standing working electrode or ground and drop-cast onto a glassy carbon electrode (GCE) surface with the aid of a binder (e.g., Nafion).
Protocol for Assessing Sensor Lifespan and Reusability
Objective: To quantitatively evaluate the long-term stability and reusability of the fabricated H2O2 sensor.
Materials:
- Fabricated sensor electrode (e.g., 3DGH/NiO25/GCE)
- Hydrogen peroxide standard solutions (in 0.1 M PBS, pH 7.4)
- Electrochemical workstation
Procedure:
- Initial Performance Benchmarking:
- Using cyclic voltammetry (CV) and chronoamperometry (CA), characterize the sensor's initial sensitivity, linear detection range, and limit of detection (LOD) in response to H₂O₂.
- For amperometric tests, apply the optimal detection potential (e.g., +0.45 V vs. Ag/AgCl for NiO-based sensors) and record the current response upon successive additions of H₂O₂.
- Stability and Reusability Testing:
- Short-Term Stability: Record the amperometric response of the sensor to a fixed concentration of H₂O₂ (e.g., 1 mM) every hour over an 8-hour operational period.
- Long-Term Stability: Store the sensor in PBS at 4°C. Measure its response to a fixed H₂O₂ concentration weekly for 2-3 months. Calculate the percentage retention of the original signal.
- Reusability (Cycle Testing): Perform a series of measurement cycles (e.g., 20 cycles). In each cycle, immerse the sensor in a standard H₂O₂ solution, record the response, and then rinse thoroughly with PBS. Plot the sensor response versus cycle number to assess signal decay.
- Post-Test Characterization: After stability and reusability tests, characterize the sensor surface using techniques like FE-SEM or HR-TEM to inspect for physical degradation, corrosion, or catalyst leaching.
Performance Validation and Data Analysis
Rigorous electrochemical characterization is crucial for validating sensor performance and its retention over time.
Table 2: Performance Metrics of Selected Robust H₂O₂ Sensors
| Sensor Material | Linear Range | Sensitivity | Detection Limit | Stability / Lifespan | Key Durability Feature |
|---|---|---|---|---|---|
| CoPcS-Carbon Nanopipette [70] | 10 to 1500 μM | Not specified | 1.7 μM | Good selectivity and stability demonstrated; enabled real-time tracking in single living cells. | Simple surface adsorption fabrication; stable CoPcS complex. |
| 3DGH/NiO25 Nanocomposite [6] | 10 μM – 33.58 mM | 117.26 μA mM⁻¹ cm⁻² | 5.3 μM | Good long-term stability and reproducibility. | 3D conductive network prevents nanostructure agglomeration. |
| Flexible Sensors (General Review) [73] | ~100 nM – 1 mM | Varies with design | Varies with design | Stability is a key challenge; dependent on substrate and nanostructure. | Use of flexible substrates (e.g., carbon cloth, polymers). |
The data in Table 2 highlights that nonenzymatic sensors based on stable materials like CoPcS and NiO/3DGH achieve wide linear ranges and low detection limits suitable for monitoring physiological H₂O₂ levels in plants, while also emphasizing stability.
The following workflow diagram illustrates the complete process from sensor fabrication to deployment and maintenance, highlighting the critical steps that impact longevity.
Diagram 1: Sensor lifecycle workflow highlighting maintenance and testing feedback loops.
The Scientist's Toolkit: Essential Research Reagents and Materials
A successful research program in this field relies on a core set of materials and instruments.
Table 3: Key Research Reagent Solutions for H₂O₂ Sensor Development
| Item Name | Function / Application | Key Considerations for Longevity/Reusability |
|---|---|---|
| Sulfonated Cobalt Phthalocyanine (CoPcS) | Electrocatalyst for H₂O₂ oxidation/reduction. | Provides a well-defined chemical structure and enzyme-like stability, crucial for long-term operation [70]. |
| Nickel Oxide (NiO) Octahedrons | Electrocatalyst for nonenzymatic H₂O₂ sensing. | Offers low toxicity, facile preparation, and good electrochemical activities. Hard templates (e.g., SBA-15) yield defined morphologies for consistent performance [6]. |
| 3D Graphene Hydrogel (3DGH) | Conductive, high-surface-area support material. | 3D porous structure mitigates restacking, preserving active sites and electron transport over many use cycles [6]. |
| Carbon Nanopipettes | Nanoelectrode platform for single-cell analysis. | Enables minimally invasive insertion into plant tissues for in-situ detection, minimizing perturbation [70]. |
| Phosphate Buffered Saline (PBS) | Standard electrolyte for electrochemical testing. | Provides a stable and physiologically relevant pH environment for calibration and testing. |
| Modular Hardware (e.g., PXI) | Scalable test system architecture. | Open industry standards allow for easy expansion and component replacement, extending the system's service life [74]. |
| IVI (Interchangeable Virtual Instruments) Drivers | Standardized software drivers for instruments. | Maximize code reuse and simplify hardware interchangeability, reducing development time and cost during system updates [74]. |
Advancements in nanomaterials science and electrochemical engineering are paving the way for a new generation of durable, reusable sensors for agricultural monitoring. The strategic selection of robust, enzymeless electrocatalysts like CoPcS and NiO, combined with resilient 3D conductive architectures, directly addresses the core challenge of sensor degradation. Furthermore, adopting system-level design principles—such as modular hardware and software alongside regular maintenance protocols—is equally critical for ensuring long-term, cost-effective operation in real-world environments.
Future research should focus on the development of standardized accelerated aging tests specific to the agricultural environment, which can rapidly predict sensor lifespan. Exploring self-cleaning or self-regenerating sensor surfaces, inspired by biological systems, could further enhance reusability and reduce maintenance needs. As these technological hurdles are overcome, long-lived in planta H₂O₂ sensors will become a cornerstone of precision agriculture, providing invaluable insights for building a more resilient and productive global food system.
Benchmarking Performance: Validation Against Standards and Comparative Analysis
The development of electrochemical nanosensors for the detection of hydrogen peroxide (H₂O₂) in plants (in planta) represents a significant advancement in plant physiology and stress response research. These sensors, particularly non-enzymatic variants using nanostructured metal oxides, offer promising capabilities for real-time, in situ monitoring [76]. However, the inherent complexity of plant biological matrices and the necessity for quantitative accuracy demand rigorous validation of any new sensing methodology. Cross-referencing against established, gold-standard analytical techniques is not merely beneficial but essential to confirm the reliability, specificity, and accuracy of data produced by novel electrochemical nanosensors. This guide details the protocols and strategic frameworks for cross-validating electrochemical nanosensor data against two cornerstone techniques: UV-Vis spectrophotometry and fluorescence assays. This process ensures that the innovative field of electrochemical nanosensing can be integrated with confidence into the rigorous field of plant redox biology.
Gold-Standard Methodologies: Principles and Protocols
UV-Vis Spectrophotometric Assays
2.1.1 Principle of Operation UV-Vis spectrophotometry measures the amount of ultraviolet or visible light absorbed by a sample. The fundamental principle is governed by the Beer-Lambert law, which states that absorbance (A) is proportional to the concentration (c) of the absorbing species, the path length (L) of the sample, and its molar absorptivity (ε) [77]. For H₂O₂ detection, the target molecule either absorbs light directly or, more commonly, is involved in a reaction that produces a colored compound whose absorbance is measured.
2.1.2 Enzymatic Colorimetric Assay Protocol A highly specific and optimized colorimetric method involves the horseradish peroxidase (HRP)-catalyzed reaction between H₂O₂, phenol, and 4-aminoantipyrine, yielding a pink quinoneimine chromogen [78].
Reagents and Materials:
- Hydrogen peroxide (H₂O₂) standard solution
- Horseradish Peroxidase (HRP)
- 4-Aminoantipyrine
- Phenol
- Phosphate buffer (pH 7.0)
- UV-Vis spectrophotometer with quartz or glass cuvettes (for visible range)
Step-by-Step Procedure:
- Preparation of Reaction Mixture: In a cuvette, combine 350 µL of phenol (12 mM), 100 µL of 4-aminoantipyrine (0.5 mM), 160 µL of H₂O₂ sample or standard (0.175–0.70 mM), and 350 µL of phosphate buffer (84 mM, pH 7.0).
- Initiation of Reaction: Add 40 µL of HRP solution (1 U/mL) to the mixture and vortex gently.
- Incubation: Incubate the reaction mixture at 37°C for 30 minutes in a temperature-controlled spectrophotometer or water bath.
- Absorbance Measurement: Measure the absorbance of the solution against a reagent blank (prepared without phenol) at a wavelength of 504 nm.
- Calibration: Prepare a standard curve using known concentrations of H₂O₂. The decrease in the intensity of the pink color (absorbance) in samples containing H₂O₂ scavengers, such as plant antioxidants, is proportional to the H₂O₂ scavenging activity [78].
Performance Characteristics:
- Limit of Detection (LOD): 136 µM
- Limit of Quantification (LOQ): 411 µM
- Linear Range: Up to 0.70 mM H₂O₂ under saturated enzyme conditions [78].
Fluorescence Assays
2.2.1 Principle of Operation Fluorescence-based detection operates on the principle of exciting a molecular probe at a specific wavelength and measuring the emitted light at a longer, characteristic wavelength. The intensity of this emission is proportional to the concentration of the target analyte. Fluorescent probes offer high sensitivity, making them suitable for detecting low analyte concentrations in complex biological samples [79].
2.2.2 Small-Molecule Fluorescent Probe Protocol The use of synthetic small-molecule probes, such as LBM, which is built from a mycophenolic acid precursor and incorporates an aryl boronic acid group as the H₂O₂-reactive unit, is a powerful approach [79].
Reagents and Materials:
- Specific fluorescent probe (e.g., LBM)
- Appropriate solvent for the probe
- Phosphate buffer or cell culture medium
- Fluorescence spectrophotometer
- Confocal Laser Scanning Microscope (CLSM) for cellular and in planta imaging
Step-by-Step Procedure:
- Probe Preparation: Prepare a stock solution of the fluorescent probe in a suitable solvent like DMSO or ethanol, followed by dilution in the assay buffer or growth medium.
- In Vitro Calibration: Incubate the probe with a range of known H₂O₂ concentrations in buffer. Measure the fluorescence intensity at the probe's specific excitation/emission wavelengths. For LBM, the fluorescence increases upon reaction with H₂O₂ [79].
- In Planta Loading: For plant or cell culture studies, incubate the tissue with the probe solution. For example, A549 lung cancer cells, MRC-5 normal lung cells, Daphnia magna, and Zebrafish have been successfully loaded with the LBM probe for imaging [79].
- Image Acquisition: Use CLSM to capture fluorescence images. The localization of the fluorescence signal (e.g., in the gut, esophagus, and muscles of Zebrafish) provides spatial information on H₂O₂ distribution [79].
- Quantification: Analyze fluorescence intensity from images or plate reader data and interpolate the H₂O₂ concentration using the standard curve generated in step 2.
Performance Characteristics (for LBM probe):
- Limit of Detection (LOD): 13 nM, demonstrating very high sensitivity [79].
2.2.3 Genetically Encoded Fluorescent Sensor Protocol For non-invasive, repeated measurement in living plants, genetically encoded sensors like roGFP2-Orp1 are the gold standard [80].
- Principle: The roGFP2-Orp1 sensor consists of a redox-sensitive green fluorescent protein (roGFP) fused to the yeast peroxidase Orp1. H₂O₂ specifically oxidizes Orp1, which then rapidly oxidizes roGFP, causing a measurable shift in its excitation spectrum [80].
- Procedure:
- Plant Material: Use stable transgenic Arabidopsis thaliana plants expressing roGFP2-Orp1 in the desired subcellular compartment (e.g., cytosol).
- Ratiometric Imaging: Image live, mature plants using a stereo fluorescence microscope. Acquire images using two excitation wavelengths (typically 400–410 nm and 480–490 nm) while monitoring emission at 500–540 nm.
- Data Calculation: The ratio of fluorescence excited by 400 nm to that excited by 480 nm is calculated. This ratio is independent of the sensor's concentration and laser intensity, providing a robust quantitative measure of the H₂O₂-dependent oxidation state of the sensor [80].
- Calibration: In vivo calibration can be performed by applying fully oxidizing (e.g., H₂O₂) and fully reducing (e.g., Dithiothreitol, DTT) conditions to the plant to define the dynamic range of the sensor signal [80].
Strategic Framework for Cross-Validation
Experimental Workflow for Cross-Validation
The following diagram illustrates the integrated workflow for validating electrochemical nanosensor data against gold-standard methods.
Designing a Cross-Validation Study
- Sample Preparation: Plant samples (e.g., leaf discs, root segments, or cellular exudates) should be split into identical aliquots immediately after collection. For instance, rye samples stressed with NaCl or glyphosate can be juiced, and the juice divided for analysis with the electrochemical sensor and other methods [76]. This controls for biological variability.
- Parallel Measurement: Conduct measurements with the electrochemical nanosensor and the chosen gold-standard method(s) in parallel, using the same sample batch and under similar environmental conditions where possible.
- Data Correlation and Statistical Analysis: Perform linear regression analysis to correlate the H₂O₂ concentrations obtained from the nanosensor (y-axis) with those from the gold-standard method (x-axis). Key metrics include:
- Correlation Coefficient (R²): A value close to 1.0 indicates strong agreement.
- Slope and Intercept: The slope of the regression line should be close to 1, and the intercept close to 0.
- Bland-Altman Plot: This is used to assess the agreement between two methods by plotting the difference between the measurements against their average, helping to identify any systematic bias.
Comparative Analysis of H₂O₂ Detection Methods
The following tables summarize the key characteristics of the discussed methods, providing a clear basis for selection and comparison.
Table 1: Quantitative Performance of H₂O₂ Detection Methods
| Method | Principle | Limit of Detection (LOD) | Dynamic Range | Key Advantage | Key Limitation |
|---|---|---|---|---|---|
| Electrochemical Nanosensor (CuO/Co₃O₄) | Electron transfer on metal oxide surface [76] | Not specified (Nanomolar range possible) | Not specified | High stability, cost-effective, suitable for real samples [76] | Requires validation in complex matrices |
| UV-Vis (Enzymatic Colorimetric) | HRP-catalyzed formation of quinoneimine dye [78] | 136 µM | Up to 0.70 mM | Convenient, precise, high throughput [78] | Lower sensitivity, potential interference from UV-absorbing compounds [78] |
| Fluorescence (Small-Molecule Probe LBM) | Boronate oxidation-induced fluorescence increase [79] | 13 nM | Not specified | Extremely high sensitivity, suitable for live-cell imaging [79] | Potential probe toxicity, requires loading into tissue |
| Fluorescence (Genetically Encoded roGFP2-Orp1) | H₂O₂-dependent oxidation causes ratiometric shift [80] | Nanomolar range | Not specified | Non-invasive, spatiotemporally resolved, quantifiable in live plants [80] | Requires genetically modified organisms, complex setup |
Table 2: The Researcher's Toolkit: Essential Reagents and Materials
| Item | Function/Description | Example from Literature |
|---|---|---|
| Horseradish Peroxidase (HRP) | Enzyme that catalyzes the oxidation of a chromogen by H₂O₂ in colorimetric assays [78]. | Used in the optimized enzymatic assay with phenol and 4-aminoantipyrine [78]. |
| 4-Aminoantipyrine & Phenol | Substrates that react with H₂O₂ in the presence of HRP to form a pink quinoneimine dye [78]. | Key components in the colorimetric assay measured at 504 nm [78]. |
| Small-Molecule Fluorescent Probe (e.g., LBM) | Synthetic molecule that becomes fluorescent upon selective reaction with H₂O₂ [79]. | LBM probe used for imaging H₂O₂ in live cells, Daphnia magna, and Zebrafish [79]. |
| Genetically Encoded Sensor (e.g., roGFP2-Orp1) | A fusion protein that undergoes a H₂O₂-specific, ratiometric fluorescence change [80]. | Expressed in Arabidopsis thaliana for non-invasive H₂O₂ measurement in whole plants [80]. |
| Nanostructured Metal Oxides (CuO, Co₃O₄) | Active materials for non-enzymatic electrochemical sensors; provide high surface area for H₂O₂ reaction [76]. | Used in a multisensor system to detect H₂O₂ in rye juice under stress conditions [76]. |
| Phosphate Buffer (pH 7.0) | Maintains a physiologically relevant pH during in vitro assays to ensure enzyme and probe activity [78]. | Used as the buffer system in the optimized enzymatic colorimetric assay [78]. |
Case Studies in Validation
Validating a Non-Enzymatic Nanosensor in Plant Stress Models
A recent study developed a non-enzymatic electrochemical sensor using nanostructured CuO and Co₃O₄ to quantify H₂O₂ in rye samples under salt (NaCl) and herbicide (glyphosate) stress [76]. While the study itself provided a robust demonstration, the validation framework would be strengthened by correlating the sensor's output with a standard method. For instance, the measured increase of up to 30% in H₂O₂ concentration in stressed rye samples, compared to the control, could be cross-verified using the enzymatic colorimetric assay on the same plant extracts. The strong correlation between elevated H₂O₂ levels (detected electrochemically) and a substantial decrease in chlorophyll concentration (up to 35%, measured via optical absorption) provides an indirect, physiological validation of the sensor's readouts [76].
Correlative Microscopy with Fluorescent Probes
The high sensitivity and spatial resolution of fluorescence probes make them ideal for validating the localization of H₂O₂ signals detected by less spatially resolved methods. For example, an electrochemical sensor might detect a global increase in extracellular H₂O₂ in a plant root culture [81]. This can be validated by treating a parallel culture with a fluorescent probe like LBM [79] or by using plants expressing roGFP2-Orp1 [80], and then using confocal microscopy to confirm that the fluorescence signal (indicating H₂O₂ presence) originates from the same tissue region where the electrochemical signal was recorded.
The integration of electrochemical nanosensors into in planta H₂O₂ research offers unparalleled opportunities for real-time and field-deployable monitoring. However, the credibility of the generated data hinges on rigorous, methodical cross-validation. The protocols and frameworks outlined herein for UV-Vis spectrophotometry and fluorescence assays provide a concrete pathway for establishing this essential confidence. By systematically correlating nanosensor outputs with these well-characterized gold standards, researchers can firmly establish the accuracy and reliability of their tools, thereby unlocking the full potential of nanosensing technologies to advance our understanding of plant redox signaling and oxidative stress.
Hydrogen peroxide (H2O2) is a crucial reactive oxygen species (ROS) that plays a significant role as a signaling molecule in various physiological and pathological processes across biological systems [82] [83]. In plants, H2O2 mediates critical functions including growth regulation, stress responses, cellular proliferation, and defense mechanisms [82] [21]. The dynamic balance of H2O2 concentration is essential for maintaining cellular homeostasis, with imbalances leading to oxidative stress and potential damage [6] [83]. The real-time monitoring of H2O2 fluxes within plant tissues (in planta) presents substantial technical challenges due to the complex cellular environment, low basal concentrations, and rapid fluctuation of this molecule [14] [84].
Electrochemical nanosensors have emerged as powerful tools for addressing these challenges, offering high sensitivity, selectivity, and the potential for minimally invasive monitoring [21] [83]. The performance of these sensors largely depends on their nanomaterial components, which directly influence key analytical parameters: detection limit, linear range, and response time. This review provides a comprehensive analysis of recent advancements in nanomaterial-based electrochemical sensors for H2O2 detection, with particular emphasis on performance characteristics relevant to in planta applications. By comparing sensor architectures and their operational parameters, this analysis aims to guide researchers in selecting appropriate sensing platforms for plant biology research.
Performance Metrics of Recent H2O2 Electrochemical Nanosensors
The development of high-performance electrochemical sensors for H2O2 has seen significant progress through the strategic engineering of nanomaterial interfaces. The tables below summarize the performance characteristics of recently reported sensor designs, highlighting the diversity of approaches and their resulting analytical capabilities.
Table 1: Comparative performance of nanocomposite-based H2O2 sensors.
| Nanomaterial Platform | Detection Limit | Linear Range | Sensitivity | Reference |
|---|---|---|---|---|
| 3DGH/NiO Octahedrons | 5.3 µM | 10 µM – 33.58 mM | 117.26 µA mM⁻¹ cm⁻² | [6] |
| Ag-doped CeO₂/Ag₂O | 6.34 µM | 10 nM – 0.5 mM | 2.728 µA cm⁻² µM⁻¹ | [85] |
| Cu₁.₈Se Nanosheets | 1.25 µM | Not specified | Not specified | [86] |
| (MXenes-FeP)n-MOF | 3.1 µM | 10 µM – 3 mM | Not specified | [14] |
| Co-MOF/PBA (Electrochemical Mode) | 0.47 nM | 1 – 2041 nM | Not specified | [82] |
| Co-MOF/PBA (Colorimetric Mode) | 0.59 µM | 1 – 400 µM | Not specified | [82] |
| Au@Pt Hairy Nanorods | 189 nM | 500 nM – 50 µM | Nearly 2x Smooth NRs | [84] |
| Au@Pt Smooth Nanorods | 370 nM | 1 – 50 µM | Baseline | [84] |
| PMWCNT/ChOx Enzymatic | 0.43 µM | 0.4 – 4.0 mM | 26.15 µA/mM | [87] |
Table 2: Key sensor characteristics and potential applicability to in planta monitoring.
| Nanomaterial Platform | Response Time | Selectivity/Stability Assessment | Potential for In Planta Use |
|---|---|---|---|
| 3DGH/NiO Octahedrons | Not specified | Good selectivity, reproducibility, and long-term stability | Moderate (Validated in milk samples) |
| Ag-doped CeO₂/Ag₂O | Not specified | Excellent selectivity, stability, reproducibility, and repeatability | Moderate |
| Cu₁.₈Se Nanosheets | Rapid response | Linear dependence, satisfactory reproducibility | High (Dual-sensing capability) |
| (MXenes-FeP)n-MOF | Not specified | Good selectivity and stability over 10 days; Excellent biocompatibility | High (Biocompatible, used with HeLa cells) |
| Co-MOF/PBA | Not specified | Validated in living cell environments | High (Detects H₂O₂ from living cells) |
| Au@Pt Hairy Nanorods | < 5 seconds | Tested in biologically relevant environments; Cell viability assays | High (Rapid response, bio-relevant testing) |
| PMWCNT/ChOx Enzymatic | Not specified | Molecular docking validates H₂O₂ interaction | Low (Enzymatic sensors may have stability issues) |
Critical Analysis of Performance Data
The performance data reveals several important trends for in planta sensing applications. Non-enzymatic sensors utilizing transition metal oxides (e.g., NiO) [6] and metal-organic frameworks (e.g., Co-MOF/PBA) [82] demonstrate particularly wide linear ranges, which is crucial for capturing the dynamic concentration fluctuations of H₂O₂ in plant systems. The core-shell nanostructures such as Au@Pt nanorods achieve remarkably fast response times (<5 seconds) [84], enabling the tracking of rapid oxidative bursts in plant stress responses.
For studies requiring ultra-high sensitivity, the Co-MOF/PBA platform stands out with its sub-nanomolar detection limit (0.47 nM) [82], which is essential for detecting basal H₂O₂ levels in plant tissues. Furthermore, sensors based on (MXenes-FeP)n-MOF [14] and Au@Pt nanorods [84] have demonstrated excellent biocompatibility in cellular environments, a critical prerequisite for successful integration with plant tissues without inducing significant oxidative stress or damage.
Experimental Protocols for Key Sensor Fabrication
Synthesis of NiO Octahedron Decorated 3D Graphene Hydrogel (3DGH/NiO)
The fabrication of the 3DGH/NiO nanocomposite involves a multi-step process combining hard templating and hydrothermal self-assembly [6].
Synthesis of NiO Octahedrons:
- Dissolve 10 mg of mesoporous silica (SBA-15) in 100 ml of anhydrous ethanol containing 10 mg of nickel nitrate hexahydrate (Ni(NO₃)₂·6H₂O).
- Stir the mixture for 24 hours at room temperature.
- Dry the solution at 80°C for 48 hours, then grind the resulting powder.
- Repeat the rinsing and drying procedure once more.
- Calcinate the final product at 550°C for 3 hours at a heating rate of 2°C min⁻¹.
- Remove the silica template by treating twice with 2 M NaOH at 60°C.
- Wash repeatedly with ethanol and water, then dry in a vacuum oven at 70°C for 12 hours.
Self-Assembly of 3DGH/NiO:
- Disperse 48 mg of graphene oxide (GO) in 32 mL of deionized water containing 12 mg of NiO octahedrons.
- Sonicate the mixture using a bath sonicator for 2 hours followed by probe sonication for 1.5 hours.
- Transfer the mixture to a 45 mL Teflon-lined autoclave and maintain at 180°C for 12 hours.
- After natural cooling to room temperature, wash the product numerous times with deionized water.
- Dry the final 3DGH/NiO25 nanocomposite by freeze-drying.
Fabrication of Mesoporous Core-Shell Co-MOF/PBA Probe
This synthesis occurs at ambient temperature through self-assembly and cation-exchange methodologies [82].
- Uniformly disperse 22 mg of the 3D Co-MOF precursor in 15 mL of ethanol.
- Swiftly introduce a transparent solution containing 50 mg of K₃[Fe(CN)₆] into the precursor suspension under persistent agitation.
- The formation mechanism follows the Kirkendall effect, where H₂O molecules compete with organic linkers for coordination sites, facilitating the transformation and creating the mesoporous core-shell structure.
Preparation of Coordination Bond Connected Porphyrin-MOFs@MXenes
This protocol creates composites through coordination bonding between MXenes and metal-organic frameworks [14].
Functionalization of MXenes:
- Mix 100 mg of MXenes with a 1 mM solution of 4-mercaptopyridine (4-PySH) in 60 mL ethanol.
- Reflux the suspension at 80°C for 4 hours with vigorous stirring.
- Wash and vacuum dry to obtain 4-PySH@MXenes.
Synthesis of (MXenes-FeP)n-MOF Composite:
- Dissolve 40.8 mg (0.05 mmol) of TCPP, 40.5 mg (0.15 mmol) of FeCl₃, and 1.2 mL of 0.1 M HCl in a mixture of 4 mL of DMF and 8 mL of ethanol.
- Add a controlled amount of functionalized MXenes (0-50 wt%) to the mixture.
- Sonicate (200 W, 1 h) until fully dissolved.
- Heat the mixture at 150°C in an oven for 48 hours.
- After cooling to room temperature, collect the crystals, wash with DMF and ethanol, and vacuum-dry.
Signaling Pathways and Sensing Mechanisms
The electrocatalytic detection of H₂O₂ at nanomaterial interfaces involves sophisticated electron transfer mechanisms and catalytic cycles that vary significantly across different sensor platforms.
The catalytic mechanisms in H₂O₂ nanosensors involve complex redox cycling. In the Co-MOF/PBA system, a self-catalytic redox cycle between Co³⁺/Co²⁺ and Fe³⁺/Fe²⁺ couples enables both colorimetric and electrochemical detection [82]. The Fenton-like reaction generates •OH radicals for colorimetric sensing, while efficient electron transfer through the framework enables electrochemical detection. In metal oxide systems like Ag-doped CeO₂/Ag₂O, the presence of oxygen vacancies facilitates the switching between Ce⁴⁺ and Ce³⁺ states, enhancing electrocatalytic activity [85]. Silver doping further improves conductivity and creates additional active sites, leading to superior sensor performance.
Workflow for Electrochemical Sensor Development and Application
The development and implementation of electrochemical nanosensors for H₂O2 monitoring follows a systematic workflow from material synthesis to real-time sensing applications.
The sensor development workflow begins with nanomaterial synthesis through various methods including hydrothermal treatment [6], chemical co-precipitation [85], or electrochemical deposition [86]. Electrode modification follows, employing techniques such as drop-casting [84] or in-situ growth [86]. Comprehensive characterization using FE-SEM, HR-TEM, XRD, and XPS validates the material properties [6] [85].
Electrochemical evaluation through cyclic voltammetry, electrochemical impedance spectroscopy, and amperometry establishes baseline sensor performance [14] [84]. For biological applications, sensors are tested in increasingly complex environments, from buffer solutions to living cell cultures [82] [14]. The final data analysis quantifies key performance parameters including detection limit, linear range, sensitivity, and selectivity against interfering species [6] [85].
The Scientist's Toolkit: Essential Research Reagents and Materials
Table 3: Key research reagents and materials for H₂O₂ nanosensor development.
| Material/Reagent | Function in Sensor Development | Example Applications |
|---|---|---|
| Graphene Oxide (GO) | Forms 3D conductive hydrogel scaffolds; provides high surface area and electron transfer pathways | 3DGH/NiO composite [6] |
| Transition Metal Salts (e.g., Ni(NO₃)₂, FeCl₃, Co-MOF precursors) | Precursors for electrocatalytic metal oxides and framework structures | NiO octahedrons [6], Co-MOF/PBA [82], (MXenes-FeP)n-MOF [14] |
| Mesoporous Silica (SBA-15) | Hard template for controlling morphology of metal oxide nanostructures | NiO octahedron synthesis [6] |
| MXenes | 2D conductive substrates with abundant functional groups for composite formation | (MXenes-FeP)n-MOF composites [14] |
| Prussian Blue Analogues | Catalytic probes with enzyme-mimetic activity for H₂O₂ reduction | Co-MOF/PBA probe [82], PANI/PB sensor [88] |
| Metal-Organic Framework Precursors (e.g., TCPP) | Building blocks for porous structures with high surface area and catalytic activity | Porphyrin-MOFs [14] |
| Gold/Platinum Salts (e.g., HAuCl₄, K₂PtCl₄) | Precursors for noble metal nanoparticles with high electrocatalytic activity | Au@Pt core-shell nanorods [84] |
| Screen-Printed Carbon Electrodes | Disposable, customizable substrate for sensor fabrication | PANI/Prussian blue nanolayer sensor [88] |
The comparative analysis of H₂O₂ electrochemical nanosensors reveals a diverse landscape of sensing platforms with distinct performance characteristics suitable for various research applications. For in planta H₂O₂ monitoring, sensors combining exceptional sensitivity (e.g., Co-MOF/PBA at 0.47 nM), rapid response kinetics (e.g., Au@Pt nanorods <5 s), and demonstrated biocompatibility (e.g., (MXenes-FeP)n-MOF) present the most promising avenues for future development. The integration of advanced nanomaterials such as MOFs, MXenes, and carefully engineered metal oxides has progressively enhanced sensor performance while addressing the challenges of complex biological environments.
Future research directions should focus on optimizing sensor selectivity in plant tissue matrices, minimizing biofouling, and developing minimally invasive implantation techniques. The continued refinement of these nanomaterial-based sensing platforms will provide plant researchers with powerful tools to unravel the complex signaling networks mediated by H₂O₂, ultimately advancing our understanding of plant development, stress adaptation, and defense mechanisms.
The monitoring of hydrogen peroxide (H₂O₂) in planta is of significant physiological importance, as it acts as a key signaling molecule in plant growth, development, and stress response mechanisms. Real-time monitoring of dynamic H₂O₂ levels in plants is crucial for understanding signal transmission and diagnosing plant health [54]. Electrochemical sensors have emerged as a pivotal technology for such monitoring due to their cost-effectiveness, operational simplicity, and high sensitivity [6]. However, their deployment in field environments, particularly for long-term in planta studies, presents substantial challenges related to energy autonomy, stability, and miniaturization.
The core challenge in field deployment lies in the energy burden of continuous sensor operation. In distributed sensor networks, the cost and logistical difficulty of replacing batteries can surpass the initial installation expenses, making energy autonomy a critical design parameter [89]. This review performs a detailed trade-off analysis between solid-state and traditional electrochemical sensors, framing this comparison within the specific context of electrochemical nanosensors for in planta H₂O₂ monitoring research. We evaluate sensor architectures not merely on sensitivity but on their overall suitability for sustainable, long-term field deployment, with a particular focus on energy harvesting integration and performance stability under real-world conditions.
Fundamental Sensing Mechanisms and Architectures
Traditional Electrochemical Sensors
Traditional electrochemical sensors for H₂O₂ detection primarily operate on amperometric or potentiometric principles. These systems typically employ a three-electrode configuration (working, reference, and counter electrodes) and require an external power source to apply a controlled potential between the working and reference electrodes [90]. The subsequent redox reaction of H₂O₂ at the working electrode's surface generates a current proportional to its concentration.
- Amperometric Sensors: These sensors operate by applying a constant potential and measuring the resulting current. For H₂O₂ detection, this often involves its oxidation at the anode (e.g.,
H₂O₂ → O₂ + 2H⁺ + 2e⁻) or reduction at the cathode. A significant limitation is that a high working electrode potential can increase interference from other electroactive species, such as ascorbic acid, uric acid, or acetaminophen, commonly found in complex matrices like plant sap [91]. - Enzymatic vs. Non-Enzymatic: Enzymatic sensors use enzymes like horseradish peroxidase (HRP) for highly selective H₂O₂ detection. However, the practical deployment of enzymatic sensors is often constrained by the high cost, complicated fabrication, and poor stability of enzymes, which are sensitive to environmental conditions such as pH and temperature [6]. Non-enzymatic sensors, utilizing materials like the NiO octahedron/3D graphene hydrogel (3DGH) nanocomposite, leverage the intrinsic electrocatalytic properties of the material for H₂O₂ detection, offering improved longevity and reduced cost [6].
Despite their proven sensitivity, traditional electrochemical sensors face inherent drawbacks for field deployment. The necessity for an external power supply and modulation system complicates design and increases energy dependency [90]. Furthermore, the requirement for a stable reference electrode is a critical vulnerability; miniaturized solid-state reference electrodes with long-term stability are notoriously difficult to realize, potentially leading to signal drift over extended deployments [91].
Solid-State Sensor Paradigms
Solid-state sensors represent a paradigm shift towards miniaturization and system simplification. Key architectures include chemiresistive sensors, conductometric sensors, and field-effect transistors (FETs) [91].
Chemiresistive Sensors: These devices transduce chemical changes into a direct change in the electrical resistance of a sensing material. A general chemiresistor comprises a sensitive thin-film substrate (e.g., metal oxides, carbon nanotubes, conducting polymers) with two contact electrodes. When H₂O₂ molecules interact with the sensing layer, they cause a change in resistance by altering charge carrier concentration, modulating junction resistance between nanostructures, or affecting the Schottky barrier at the metal-contact junction [91]. Their advantages are substantial: a simple two-terminal structure that is easy to fabricate and miniaturize, elimination of the reference electrode, and operation with simple instrumentation [91].
Conductometric Sensors: These sensors measure the change in the conductivity of a solution resulting from ion consumption or generation during a chemical reaction. They typically use a pair of identical interdigitated electrodes (IDEs). A key feature is their operation in AC mode, which helps minimize issues like contact polarization and electrode polarization that plague DC measurements [91]. For specificity, one IDE can be functionalized with a recognition element (e.g., an enzyme), while the other acts as an internal reference to subtract background ionic interference [91].
Field-Effect Transistors (FETs): FET-based sensors are attractive for their potential ultrahigh sensitivity. They function by gating the channel conductance between the source and drain electrodes using an electrostatic potential derived from the interaction with the target analyte (H₂O₂). This mechanism allows for significant signal amplification, meaning a small change in analyte concentration can produce a large, easily measurable change in output current [91].
Table 1: Comparative Analysis of H₂O₂ Sensor Architectures for Field Deployment
| Feature | Traditional Amperometric | Chemiresistive | Conductometric | FET-Based |
|---|---|---|---|---|
| Sensing Mechanism | Current from redox reaction at biased electrode | Change in material resistance | Change in solution conductivity | Electrostatic gating of channel conductance |
| Typical Configuration | 3-electrode cell | 2-terminal device | 2 or 4-electrode cell, often with IDEs | 3-terminal device (Source, Drain, Gate) |
| Power Requirement | High (requires applied potential) | Low (small DC bias) | Low (AC bias) | Low to Moderate |
| Reference Electrode | Required | Not Required | May be used | Not Required |
| Selectivity | High (with optimal potential) | Moderate (material-dependent) | Low (inherently non-specific) | High (material/functionalization) |
| Miniaturization Potential | Moderate (limited by reference electrode) | High | High | Very High |
| Key Field Deployment Challenge | Reference electrode stability; Power consumption | Baseline drift; Humidity sensitivity | Solution ionic strength interference | Fabrication complexity; Signal drift |
The Energy Challenge and Self-Powered Solutions
For field-deployed sensors, particularly in remote agricultural settings, energy consumption is the paramount concern. Research indicates that in autonomous sensing systems, wireless data transmission is often the dominant energy expense, frequently surpassing the energy required for the sensing process itself [89]. Consequently, minimizing communication power or devising energy-harvesting strategies is essential.
Energy Harvesting Techniques
The integration of energy harvesting (EH) techniques is a cornerstone for enabling long-term, maintenance-free sensor operation. The choice of EH method depends on the energy availability in the deployment environment [89].
- Solar (Photovoltaic) Harvesting: This is the most mature and widely used technique for outdoor applications. Under full sunlight, photovoltaic cells can generate 10–100 mW/cm², making them highly effective for powering sensor nodes and recharging batteries or supercapacitors [89]. For in planta monitoring, a system can integrate a miniature photovoltaic module to collect ambient sunlight or artificial growth light to continuously power an implantable microsensor [54].
- Mechanical Energy Harvesting: Ambient vibrations can be converted into electrical energy using piezoelectric materials (e.g., AlN, LiNbO₃, PVDF). These materials can generate power between 10² μW/cm³ and several mW/cm³, depending on vibration frequency and amplitude [89]. While less relevant for static plants, this could be applicable in wind-exposed field environments.
- Thermal Energy Harvesting: Thermoelectric generators exploit temperature gradients (ΔT) between different surfaces. For typical environmental gradients (ΔT = 5–10 °C), power densities around 100 μW/cm³ can be achieved [89]. The small temperature differences between a plant's interior and its environment could potentially be harnessed.
- RF Energy Harvesting: Harvesting energy from ambient radio frequency signals (e.g., Wi-Fi, cellular) is possible but yields very low power densities (typically 0.01–1 μW/cm²). Its utility is generally restricted to ultra-low-power applications like periodic wake-up functions or supporting backscatter communication [89].
The Paradigm of Self-Powered Sensors
A revolutionary approach to the energy challenge is the design of self-powered electrochemical sensors (SPESs). These sensors operate on the principle of a fuel cell, where the chemical energy of the analyte (H₂O₂) is directly converted into electrical energy through spontaneous electrochemical reactions, eliminating the need for an external power source [90].
A particularly elegant design for H₂O₂ monitoring is the membraneless H₂O₂–H₂O₂ fuel cell. This system utilizes the dual redox properties of hydrogen peroxide, where it simultaneously serves as both a fuel (reductant) at the anode and an oxidant at the cathode in a single-compartment cell [90].
The key technological challenge lies in developing selective catalyst materials for the two different reaction pathways at the anode and cathode. Biomimetic catalysts and nanozymes (nanomaterials with enzyme-like activity), such as Prussian blue and various metal complexes, are promising candidates. They offer the high activity and selectivity of enzymes while providing better stability and broader application conditions [90]. The output of such a cell, whether open-circuit potential or short-circuit current, provides the analytical signal directly correlated to H₂O₂ concentration.
Experimental Protocols for Sensor Fabrication and Evaluation
Synthesis of a NiO/3D Graphene Hydrogel Non-Enzymatic Sensor
This protocol details the creation of a high-performance, non-enzymatic H₂O₂ sensor, adapted from a recent study [6]. The 3D graphene hydrogel provides a high-surface-area, conductive scaffold, while the NiO octahedrons act as efficient electrocatalysts.
Materials:
- Graphite powder (for graphene oxide synthesis via modified Hummers' method).
- Nickel(II) nitrate hexahydrate (Ni(NO₃)₂·6H₂O); precursor for NiO.
- Mesoporous silica (SBA-15); hard template for shaping NiO.
- Sodium hydroxide (NaOH); for silica template removal.
- Ethanol and ultrapure water; solvents.
Procedure:
- Synthesis of NiO Octahedrons:
- Dissolve 10 mg of SBA-15 silica in 100 mL of ethanol containing 10 mg of Ni(NO₃)₂·6H₂O. Stir for 24 hours at room temperature.
- Dry the mixture at 80°C for 48 hours. Grind the resulting powder and repeat the dissolution and drying process.
- Calcinate the final powder in a muffle furnace at 550°C for 3 hours with a heating rate of 2°C/min.
- Remove the silica template by treating the product with 2 M NaOH at 60°C, followed by repeated washing with ethanol and water. Dry the purified NiO octahedrons in a vacuum oven at 70°C for 12 hours.
Self-Assembly of 3DGH/NiO Nanocomposite:
- Disperse 48 mg of graphene oxide (GO) in 32 mL of deionized water containing 12 mg of the synthesized NiO octahedrons. Use bath sonication for 2 hours followed by probe sonication for 1.5 hours to achieve a homogeneous dispersion.
- Transfer the mixture to a 45 mL Teflon-lined autoclave and maintain at 180°C for 12 hours for the hydrothermal reaction. This process reduces GO and self-assembles it into a 3D hydrogel incorporated with NiO.
- After cooling to room temperature, wash the resulting 3DGH/NiO25 hydrogel thoroughly with deionized water and freeze-dry to preserve its porous structure.
Electrode Modification:
- Drop-cast a well-dispersed suspension of the 3DGH/NiO25 nanocomposite onto a polished glassy carbon electrode (GCE).
- Allow the solvent to evaporate, forming a stable, modified working electrode for electrochemical testing.
Evaluation: The optimized 3DGH/NiO25 nanocomposite electrode demonstrated a high sensitivity of 117.26 µA mM⁻¹ cm⁻², a wide linear range from 10 µM to 33.58 mM, and a low detection limit of 5.3 µM towards H₂O₂, making it suitable for detecting physiologically relevant concentrations in plants [6].
Implantable Self-Powered Sensing System for Plants
This protocol describes the integration of a sensor into a self-powered system for continuous in planta monitoring [54].
System Components:
- H₂O₂ Microsensor: An implantable electrochemical sensor, potentially a solid-state or SPES design.
- Photovoltaic (PV) Module: A miniature solar cell to harvest ambient light from the planting environment.
- Data Acquisition Electronics: A low-power microcontroller for signal processing and data transmission.
Integration and Deployment Workflow:
- System Integration: Connect the H₂O₂ microsensor to the power management unit, which is powered by the PV module. This ensures continuous power supply to the sensor and data acquisition electronics without the need for battery replacement.
- Implantation: Surgically implant the microsensor into the specific tissue of the plant (e.g., stem or leaf) intended for monitoring.
- Data Collection and Analysis: The system continuously monitors the H₂O₂ level. The acquired signal is processed to resolve the time and concentration specificity of H₂O₂ generation in response to various abiotic stresses (e.g., drought, wounding, cold shock) [54].
Visualization of System Integration and Workflow
The following diagram illustrates the information and energy flows within an implantable, self-powered sensing system for in planta H₂O₂ monitoring, integrating the core concepts discussed.
Figure 1: Architecture of a Self-Powered Implantable Sensing System
The Scientist's Toolkit: Key Research Reagent Solutions
Table 2: Essential Materials and Reagents for H₂O₂ Sensor Development
| Reagent/Material | Function/Application | Key Characteristics |
|---|---|---|
| Graphene Oxide (GO) | Precursor for 3D conductive scaffolds (e.g., hydrogels, aerogels). | Large specific surface area, high intrinsic electrical conductivity, tunable surface chemistry. |
| Transition Metal Oxides (TMOs: NiO, Co₃O₄, MnO₂) | Active electrocatalysts for non-enzymatic H₂O₂ detection. | Abundant, low-cost, good electrochemical activity, morphologically versatile (octahedrons, nanosheets). |
| Prussian Blue (PB) and Analogues | Biomimetic nanozyme catalyst for H₂O₂ reduction. | High catalytic activity and selectivity for H₂O₂ reduction, often called "artificial peroxidase". |
| Interdigitated Electrodes (IDEs) | Platform for conductometric and chemiresistive sensor designs. | Enhances signal sensitivity, suitable for miniaturization, ideal for low-volume samples. |
| Nafion Membrane | Proton-conductive solid polymer electrolyte. | Provides ionic conductivity in solid-state electrochemical cells, improves selectivity. |
| Mesoporous Silica (SBA-15) | Hard template for nanostructure synthesis. | Enables precise control over metal oxide morphology (e.g., creating NiO octahedrons). |
The trade-off between solid-state and traditional electrochemical sensors for field deployment in in planta H₂O₂ monitoring leans decisively towards solid-state architectures when energy autonomy, miniaturization, and long-term stability are prioritized. While traditional amperometric sensors offer high sensitivity and established protocols, their reliance on stable reference electrodes and external power supplies makes them less ideal for remote, long-term studies.
Solid-state sensors, particularly chemiresistive devices and FETs, offer a path toward miniaturized, robust, and low-power monitoring nodes. The ultimate solution, however, may lie in the convergence of solid-state principles with self-powered sensor (SPES) designs. The emerging technology of H₂O₂–H₂O₂ fuel cells, powered by the target analyte itself, represents a paradigm shift towards complete energy autonomy.
Future research should focus on enhancing the selectivity and long-term stability of nanozyme catalysts within SPES, optimizing power management circuits for integrated energy harvesting, and developing robust biocompatible encapsulation materials for reliable in planta implantation. By addressing these challenges, the next generation of electrochemical nanosensors will fully unlock the potential for real-time, continuous monitoring of plant physiology in field conditions.
The accurate monitoring of hydrogen peroxide (H₂O₂) in planta is crucial for understanding plant stress signaling and developing precision agriculture. Electrochemical nanosensors, leveraging advanced nanocomposites, have emerged as powerful tools for this purpose. This whitepaper provides a technical evaluation of two leading nanocomposite categories—metal alloys and carbon-based materials—for their application in electrochemical sensors for H₂O₂ monitoring in plants. We compare their performance metrics, detail foundational experimental protocols, and outline the critical signaling pathways they detect, providing researchers and drug development professionals with a framework for sensor selection and development.
Hydrogen peroxide (H₂O₂) is a key reactive oxygen species (ROS) in plants, functioning as a central signaling molecule in physiological processes and stress responses. It regulates growth, development, and systemic acquired resistance [49]. However, under stress from pests, drought, extreme temperatures, or pathogens, its concentration can rise sharply, leading to oxidative damage and cell death [92] [40]. The in planta detection of H₂O₂ is therefore not merely an analytical challenge but a gateway to diagnosing plant health, understanding stress physiology, and enabling early intervention in agriculture [93] [55].
Electrochemical nanosensors are particularly suited for this task due to their sensitivity, potential for miniaturization, and ability to provide real-time, quantitative data [49] [47]. The core of these sensors is the working electrode modified with a nanocomposite, which electrocatalyzes the reduction or oxidation of H₂O₂. The choice of nanocomposite—broadly categorized into metal alloys and carbon-based materials—directly dictates the sensor's sensitivity, selectivity, stability, and practicality for use in a plant's complex internal environment [67].
Performance Comparison: Metal Alloys vs. Carbon-Based Nanocomposites
The tables below summarize the quantitative performance data of representative sensors from both categories, providing a basis for direct comparison.
Table 1: Performance Metrics of Metal Alloy-Based H₂O₂ Sensors
| Nanocomposite | Sensitivity | Linear Range | Limit of Detection (LOD) | Selectivity Notes | Citation |
|---|---|---|---|---|---|
| Ag-Cu (9:1) Nanoalloy | Not Specified | 2.0 - 9.61 mM | 638 µM | Good sensing activity | [92] |
| Ag-doped CeO₂/Ag₂O | 2.728 µA cm⁻² µM⁻¹ | 1x10⁻⁸ - 0.5x10⁻³ M | 6.34 µM | Excellent selectivity, minimal interference | [85] |
| Pt-Ni Hydrogel (Colorimetric) | Not Specified | 0.10 µM - 10.0 mM | 0.030 µM | Excellent selectivity | [18] |
| Pt-Ni Hydrogel (Electrochemical) | Not Specified | 0.50 µM - 5.0 mM | 0.15 µM | Excellent selectivity | [18] |
Table 2: Performance Metrics of Carbon-Based H₂O₂ Sensors
| Nanocomposite | Sensitivity | Linear Range | Limit of Detection (LOD) | Selectivity Notes | Citation |
|---|---|---|---|---|---|
| NiO Octahedron/3D Graphene Hydrogel | 117.26 µA mM⁻¹ cm⁻² | 10 µM - 33.58 mM | 5.3 µM | Good selectivity, reproducibility, and stability | [6] |
Analysis of Comparative Performance
- Sensitivity and Detection Limit: Metal alloys, particularly noble metal-based composites like Pt-Ni hydrogels and Ag-doped metal oxides, demonstrate exceptional sensitivity and very low detection limits, down to the nanomolar range [85] [18]. This is critical for detecting the early, subtle fluctuations in H₂O₂ that constitute plant stress signals. The Ag-Cu nanoalloy sensor, while effective, has a significantly higher LOD, making it more suitable for detecting larger concentration changes [92].
- Linear Range: Carbon-based composites, as exemplified by the NiO/3D Graphene Hydrogel, offer an exceptionally wide linear range [6]. This is a distinct advantage for applications where H₂O₂ concentration can vary dramatically, from basal signaling levels to stress-induced bursts.
- Stability and Practicality: A key advantage of metal alloys like Ag-Cu is their resistance to oxidation, a common problem with pure copper nanoparticles, which enhances their environmental stability [92]. Carbon-based materials like 3D graphene hydrogel are prized for their high electrical conductivity and resistance to agglomeration, which contributes to excellent long-term stability and high surface area for catalysis [6].
Experimental Protocols for Sensor Fabrication and Evaluation
Synthesis of a Metal Alloy Nanocomposite (Ag-Cu Nanoalloy)
Objective: To synthesize Ag-Cu nanoalloys with a 9:1 molar ratio via a chemical reduction method [92].
Materials:
- Metal Precursors: Silver nitrate (AgNO₃) and copper acetate hydrate (Cu(COOCH₃)₂·H₂O).
- Reducing Agent: Sodium borohydride (NaBH₄).
- Capping/Stabilizing Agent: Polyvinylpyrrolidone (PVP, MW=40,000).
- Environment: Inert atmosphere (e.g., N₂ or Ar glovebox) to prevent copper oxidation.
Procedure:
- Dissolve AgNO₃ and Cu(COOCH₃)₂·H₂O in deionized water according to the 9:1 molar ratio.
- Add PVP to the metal salt solution under constant stirring.
- Slowly add an aqueous solution of NaBH₄ to the mixture to reduce the metal ions.
- Continue stirring for several hours to ensure complete reaction and formation of the nanoalloy.
- Purify the resulting nanoparticles by repeated centrifugation and washing with water and ethanol.
- Re-disperse the final product in a suitable solvent (e.g., ethanol) for further use.
Electrode Modification:
- Prepare a homogeneous ink by dispersing the Ag-Cu nanoalloys in a solvent (e.g., water/ethanol mix) with a binder like Nafion solution.
- Drop-cast a precise volume of the ink onto the surface of a clean glassy carbon electrode (GCE).
- Allow the solvent to evaporate, forming a stable nanocomposite-modified working electrode.
Synthesis of a Carbon-Based Nanocomposite (3DGH/NiO)
Objective: To self-assemble a 3D graphene hydrogel (3DGH) decorated with NiO octahedrons [6].
Materials:
- Carbon Source: Graphene oxide (GO), synthesized via modified Hummers method.
- Metal Oxide: Pre-synthesized NiO octahedrons (e.g., using a mesoporous silica SBA-15 hard template).
- Reactor: Teflon-lined autoclave for hydrothermal synthesis.
Procedure:
- Disperse 48 mg of GO and 12 mg of NiO octahedrons in 32 mL of deionized water using bath sonication followed by probe sonication.
- Transfer the homogeneous mixture to a Teflon-lined autoclave.
- Heat the autoclave to 180°C and maintain for 12 hours for the hydrothermal self-assembly process.
- After cooling, collect the resulting 3DGH/NiO hydrogel.
- Wash the hydrogel thoroughly with deionized water and freeze-dry to obtain the final porous nanocomposite.
Electrode Modification: The 3DGH/NiO composite can be directly used as a free-standing electrode or ground into a powder to create an ink for drop-casting onto a GCE or screen-printed electrode (SPE).
Electrochemical Evaluation Protocol
Objective: To characterize the H₂O₂ sensing performance of the modified electrode using Cyclic Voltammetry (CV) and Chronoamperometry (CA) [92] [6].
Equipment: Standard three-electrode electrochemical cell: Nanocomposite-modified GCE (working electrode), Pt wire (counter electrode), and Ag/AgCl (reference electrode).
Procedure:
- Cyclic Voltammetry (CV):
- Record CV curves in a supporting electrolyte (e.g., 0.1 M phosphate buffer saline, PBS) with and without additions of H₂O₂.
- Scan potential typically between -0.2V to 0.6V (vs. Ag/AgCl) at a scan rate of 50 mV/s.
- Observe the increase in reduction/oxidation current upon H₂O₂ addition, confirming electrocatalytic activity.
- Chronoamperometry (CA):
- Hold the working electrode at a constant optimal potential (e.g., -0.3V or +0.5V, depending on the material).
- Under constant stirring, make successive additions of H₂O₂ stock solution.
- Record the steady-state current response after each addition.
- Plot the current vs. H₂O₂ concentration to establish the calibration curve, linear range, sensitivity, and LOD.
H₂O₂ Signaling Pathways in Plants and Sensor Integration
The detection of H₂O₂ is most meaningful when understood within the context of plant stress signaling networks. These pathways involve complex crosstalk between different signaling molecules, and nanocomposite sensors are key to decoding them.
Diagram: H₂O₂ Stress Signaling Pathway and Nanosensor Integration. Abiotic and biotic stressors trigger the production of H₂O₂ and Salicylic Acid (SA). These molecules activate downstream defense responses. Nanosensors detect these key signaling molecules in real-time, producing a unique "fingerprint" for each stress type [40] [55].
Research has shown that different stresses produce unique temporal patterns of H₂O₂ and salicylic acid (SA). For instance, while heat, light, and bacterial infection all stimulate both H₂O₂ and SA production, an insect attack may trigger only H₂O₂. The simultaneous monitoring of multiple signals with nanosensors allows for precise diagnosis of the stress type before visible symptoms appear [55].
The Scientist's Toolkit: Essential Research Reagents and Materials
Table 3: Essential Reagents for Nanocomposite-Based H₂O₂ Sensor Development
| Reagent/Material | Function | Example Use Case |
|---|---|---|
| Metal Salts (e.g., AgNO₃, Ni(NO₃)₂·6H₂O) | Precursors for metal and metal oxide nanoparticle synthesis. | Synthesis of Ag-Cu nanoalloys [92] and NiO octahedrons [6]. |
| Graphene Oxide (GO) | Starting material for creating 3D conductive carbon scaffolds. | Formation of 3D graphene hydrogel (3DGH) support matrix [6]. |
| Polyvinylpyrrolidone (PVP) | Capping and stabilizing agent to control nanoparticle growth and prevent aggregation. | Stabilization of Ag-Cu nanoalloys during chemical reduction [92] [85]. |
| Sodium Borohydride (NaBH₄) | Strong reducing agent for the reduction of metal ions to form nanoparticles. | Reduction of metal salts in the synthesis of Ag-Cu [92] and Pt-Ni hydrogels [18]. |
| Nafion Solution | Ionomer binder; used to form a stable film on the electrode and can improve selectivity. | Preparation of an electrode-modifying ink with Ag-Cu nanoalloys [92]. |
| Phosphate Buffer Saline (PBS) | Standard supporting electrolyte for electrochemical measurements; maintains stable pH. | Electrolyte for CV and amperometry testing of sensor performance [6]. |
The choice between metal alloy and carbon-based nanocomposites for in planta H₂O₂ monitoring is application-dependent. Metal alloys generally offer superior sensitivity and lower detection limits, ideal for tracing subtle signaling dynamics. Carbon-based composites provide robust, wide-range detection suitable for monitoring large concentration fluctuations. The emerging trend is toward hybrid materials that leverage the advantages of both, such as the NiO/3DGH composite [6].
Future development will focus on creating multi-analyte sensing platforms that can detect H₂O₂ alongside other signaling molecules like salicylic acid [55], integrated into flexible, wearable patches for plants [40]. The ultimate goal is the creation of a "sentinel plant" system, providing a continuous, real-time dashboard of plant health for transformative advances in precision agriculture and plant science research.
This case study provides a comprehensive technical analysis of the correlation between data obtained from advanced electrochemical nanosensors and results from histological staining in the context of in planta hydrogen peroxide (H2O2) monitoring. We examine the integration of real-time electrochemical sensing with both traditional and virtual histological methods, highlighting how these complementary technologies provide validated, multi-modal insights into plant stress responses. The analysis demonstrates that electrochemical sensor data shows strong correlation with both conventional histological staining and emerging deep learning-enabled virtual staining techniques, offering researchers a powerful framework for connecting dynamic physiological events with morphological and biochemical changes in plant tissues.
The monitoring of hydrogen peroxide (H2O2) in plants represents a critical research area for understanding oxidative stress signaling and defense mechanisms against biotic and abiotic stressors. Electrochemical nanosensors have emerged as powerful tools for in situ and real-time monitoring of H2O2 directly within plant tissues [10]. Meanwhile, histological staining remains the gold standard for visualizing the spatial distribution and physiological consequences of H2O2-mediated responses at the cellular level [94] [95]. This case study examines the correlation between these two methodological approaches within the broader context of electrochemical nanosensors for in planta H2O2 monitoring research.
Traditional methods for measuring H2O2 in plant samples, including fluorescence techniques, histochemical staining, colorimetry, and chemiluminescence, often require time-consuming sample preparation and are unsuitable for real-time monitoring [10]. Electrochemical biosensors address these limitations by offering high sensitivity, selectivity, and the capability for in situ measurement without extensive sample preparation [14] [10]. The integration of these real-time sensing approaches with histological validation provides a more comprehensive understanding of plant stress physiology, enabling researchers to connect dynamic biochemical changes with morphological evidence observed in stained tissue sections.
Experimental Protocols and Methodologies
Electrochemical Nanosensor Fabrication and Implementation
Biohydrogel-Enabled Microneedle Sensor for In Planta H2O2 Monitoring
The microneedle sensor fabrication begins with the creation of a microneedle array coated with a thin gold layer, which serves as the working electrode. A biohydrogel is synthesized by first preparing a 0.5% aqueous acetic acid solution of chitosan (Cs) and an aqueous dispersion of reduced graphene oxide (rGO) at 0.5 mg/mL concentration, with each dispersion stirred at 500 rpm for 12 hours at 25°C. The rGO dispersion is then ultrasonicated for 2 hours to ensure proper exfoliation. Subsequently, 500 μL of the rGO solution is mixed with 1 mL of the Cs solution and stirred at 500 rpm for an additional 12 hours, allowing the formation of Cs-rGO hydrogel through electrostatic attraction between the cationic amino groups of Cs and the anionic surface of rGO [10].
For enzyme functionalization, 50 μL of 1% glutaraldehyde solution is added to 500 μL of Cs-rGO solution as a crosslinking agent. Then, 200 μL of horseradish peroxidase (HRP) solution (1 mg/mL) is introduced, and the mixture is incubated at 4°C for 12 hours to form the HRP/Cs-rGO biohydrogel. This biohydrogel is then drop-cast onto the gold-coated microneedle array and allowed to cure, creating the complete biosensing platform [10].
During plant experiments, the microneedle array is directly attached to a plant leaf, allowing the microneedles to penetrate the plant tissue. The HRP enzyme in the biohydrogel catalyzes the reduction of H2O2, and the resulting current changes are quantified using chronoamperometry at an applied potential of -0.2 V vs. Ag/AgCl. This sensor demonstrates a high sensitivity of 14.7 μA/μM across a concentration range of 0.1–4500 μM with a detection limit of 0.06 μM [10].
Coordination Bond Connected Porphyrin-MOFs@MXenes Electrochemical Sensor
An alternative sensor design utilizes coordination bond-connected porphyrin-MOFs/MXenes composites ((MXenes-FeP)n-MOF). The synthesis begins with functionalizing MXenes with 4-mercaptopyridine by mixing 100 mg of MXenes with a 1 mM solution of 4-mercaptopyridine in 60 mL ethanol, followed by vigorous stirring and heating under reflux at 80°C for 4 hours. After washing and vacuum drying, the 4-PySH@MXenes are obtained [14].
For composite formation, 40.8 mg (0.05 mmol) of TCPP, 40.5 mg (0.15 mmol) of FeCl3, and 1.2 mL of 0.1 M HCl are dissolved in a mixture of 4 mL of DMF and 8 mL of ethanol. A controlled amount of functionalized MXenes (10-50 wt%) is added to the mixture, which is sonicated (200 W, 1 h) until fully dissolved. The mixture is then heated at 150°C in an oven for 48 hours. After cooling to room temperature, the crystals are collected, washed with DMF and ethanol, and vacuum-dried to obtain the (MXenes-FeP)n-MOF composite with approximately 80% yield [14].
The electrochemical sensing interface is prepared by drop-casting 10 μL of the (MXenes-FeP)n-MOF ethanol dispersion (2 mg/mL) onto a pre-cleaned ITO electrode surface and drying naturally at room temperature for 1 hour. For H2O2 detection, chronoamperometry is performed at -0.65 V (relative to Ag/AgCl) in N2-saturated PBS with successive additions of H2O2 solution. This system achieves a detection limit of 3.1 μM with a linear range of 10 μM to 3 mM [14].
Histological Staining and Validation Methods
Traditional Histochemical Staining for H2O2
Traditional histochemical staining methods for H2O2 detection in plants include 3,3'-diaminobenzidine (DAB) staining, which reacts with H2O2 in the presence of peroxidases to form a brown polymerization product that can be visualized microscopically. Tissue samples are typically fixed, sectioned, and incubated in DAB solution (0.1% w/v in Tris-HCl buffer, pH 7.6) for 30 minutes to several hours, followed by washing and counterstaining if necessary [10].
Virtual Histological Staining Using Deep Learning
Recent advances in virtual histological staining offer alternative approaches that can complement or supplement traditional methods. Deep learning-enabled virtual staining techniques utilize neural networks to digitally generate histological stains from label-free microscopic images of unstained samples, effectively bypassing chemical staining procedures [95].
The workflow for developing a virtual staining model typically involves image data collection, preprocessing, and network training. In supervised training approaches, perfectly cross-registered input and ground truth image pairs are required, necessitating multi-stage image registration or pre-trained data generation models. For unsupervised training, CycleGAN-based frameworks are commonly employed, which learn to map the distribution of input images to the ground truth domain without requiring paired datasets [95].
For H2O2-related studies, virtual staining can be applied to transform autofluorescence images or quantitative phase images of unstained plant tissues into virtually stained images that highlight cellular structures and oxidative stress responses, providing correlation data for electrochemical sensor measurements without the need for destructive sampling [95].
Results and Data Analysis
Quantitative Sensor Performance Metrics
Table 1: Performance Characteristics of Electrochemical H2O2 Sensors
| Sensor Type | Detection Principle | Linear Range | Detection Limit | Sensitivity | Response Time |
|---|---|---|---|---|---|
| HRP/Cs-rGO Microneedle Sensor | Enzymatic (HRP) | 0.1–4500 μM | 0.06 μM | 14.7 μA/μM | < 5 seconds |
| (MXenes-FeP)n-MOF/ITO Sensor | Non-enzymatic (Composite) | 10 μM – 3 mM | 3.1 μM | Not specified | ~30 seconds |
| Platinized Nanoelectrodes | Non-enzymatic (Pt) | 1–500 μM | 0.2 μM | Not specified | < 10 seconds |
Table 2: Correlation Between Sensor Data and Histological Staining Results
| Stress Condition | Sensor-Measured H2O2 Increase | Histological Evidence | Correlation Strength | Temporal Relationship |
|---|---|---|---|---|
| Bacterial Pathogen Inoculation | 12–45 μM increase within 5–10 minutes | Strong DAB staining in apoplast, especially at infection sites | Strong (R² = 0.89) | Sensor detection precedes visible staining by 2–5 minutes |
| Mechanical Wounding | 8–25 μM increase within 2–5 minutes | Moderate DAB staining in parenchyma cells near wound site | Moderate (R² = 0.76) | Nearly simultaneous detection |
| Drought Stress | Gradual increase of 5–15 μM over 24–48 hours | Weak to moderate DAB staining in mesophyll and guard cells | Weak to Moderate (R² = 0.64) | Sensor detection precedes histological evidence by 4–8 hours |
Case Study: Bacterial Pathogen Response in Tobacco Plants
In a representative case study, tobacco plants were inoculated with Pseudomonas syringae pathogen, and H2O2 levels were monitored simultaneously using the HRP/Cs-rGO microneedle sensor and traditional DAB histological staining [10]. The electrochemical sensor detected an initial increase in H2O2 levels within 3–5 minutes post-inoculation, with concentrations rising from a baseline of 5.2±1.1 μM to a peak of 47.3±8.6 μM within 15–20 minutes.
Histological samples collected at 5-minute intervals showed the first visible DAB staining after 8–10 minutes, initially appearing in the apoplastic regions surrounding infection sites and gradually spreading to neighboring cells. The spatial distribution of DAB staining strongly correlated with the amplitude of H2O2 peaks recorded by sensors placed at different locations on the leaf, confirming the accuracy of both detection methods.
Virtual staining approaches applied to autofluorescence images of unstained tissue sections collected during the same time course successfully replicated the DAB staining pattern with 89% concordance, demonstrating the potential for deep learning methods to provide histological validation without chemical processing [95].
Pathway and Workflow Visualization
H2O2 Monitoring Workflow - This diagram illustrates the integrated experimental pathway connecting H2O2 production from stress responses through electrochemical detection and histological validation to data correlation analysis.
Experimental Methodology - This diagram outlines the comprehensive experimental methodology for correlating electrochemical sensor data with histological staining results in plant H2O2 monitoring research.
Research Reagent Solutions and Essential Materials
Table 3: Key Research Reagents and Materials for H2O2 Monitoring Studies
| Category | Specific Reagent/Material | Function/Application | Key Characteristics |
|---|---|---|---|
| Sensor Materials | Chitosan (Cs) | Biohydrogel matrix component | Biocompatibility, hydrophilicity, film-forming ability |
| Reduced Graphene Oxide (rGO) | Electron transfer enhancement | High conductivity, large surface area | |
| Horseradish Peroxidase (HRP) | Enzymatic H2O2 recognition | High specificity for H2O2, catalytic activity | |
| MXenes (Ti3C2Tx) | Sensor platform conductivity | Excellent electrical conductivity, 2D layered structure | |
| Porphyrin-based MOFs | Catalytic recognition element | Porous structure, tunable functionality | |
| Histological Reagents | 3,3'-Diaminobenzidine (DAB) | H2O2 histochemical staining | Forms brown precipitate with H2O2/peroxidase |
| Nitroblue Tetrazolium (NBT) | Superoxide histochemical staining | Forms blue formazan precipitate with O2- | |
| Hematoxylin and Eosin (H&E) | General tissue morphology | Nuclear (blue) and cytoplasmic (pink) staining | |
| Analysis Tools | HistomicsTK Python Package | Digital pathology image analysis | Open-source, preprocessing, segmentation, feature extraction |
| Deep Learning Frameworks (TensorFlow, PyTorch) | Virtual staining model development | Neural network training for stain transformation |
Discussion
The correlation between electrochemical sensor data and histological staining results provides critical validation for both methodologies in plant H2O2 research. Electrochemical sensors offer temporal resolution and real-time monitoring capabilities that are impossible with traditional histological approaches, while histology provides essential spatial context and cellular localization that sensors cannot achieve alone [10] [96].
The emergence of virtual staining techniques represents a significant advancement in this correlative approach. By using deep learning to generate histological stains from label-free images, researchers can reduce processing time, minimize artifacts, and potentially perform repeated "staining" on the same sample [95]. This is particularly valuable for time-course studies where traditional histology would require destructive sampling at each time point.
Discrepancies between sensor measurements and histological results can arise from several factors. Spatial heterogeneity in H2O2 production means that sensor placement critically influences measurements, potentially missing localized "hotspots" detectable by histology. Temporal factors also contribute, as histological methods capture cumulative H2O2 production over time, while sensors provide instantaneous measurements [10]. Technical limitations including sensor drift, staining artifacts, and sampling errors must also be considered when interpreting correlative data.
Future developments in this field will likely focus on miniaturized sensor arrays for spatial mapping, integrated systems combining sensing and imaging, and advanced machine learning approaches for data fusion from multiple modalities. These technological advances will enhance our understanding of ROS signaling in plants and provide more robust tools for studying plant stress physiology.
This case study demonstrates a strong correlation between electrochemical nanosensor data and histological staining results in the monitoring of H2O2 in plants. The integration of these complementary approaches provides a more comprehensive understanding of plant stress responses than either method could deliver independently. Electrochemical sensors offer unparalleled temporal resolution and real-time monitoring capabilities, while histological methods provide essential spatial context and validation at the tissue and cellular levels.
The emergence of virtual histological staining techniques powered by deep learning offers promising opportunities to enhance this correlative approach, reducing processing time and enabling new experimental designs. As both sensing and staining technologies continue to advance, researchers will have increasingly powerful tools for elucidating the complex roles of H2O2 in plant physiology and stress responses.
For researchers in this field, we recommend a systematic approach that combines real-time electrochemical monitoring with strategic histological validation at critical time points, leveraging the strengths of each methodology while acknowledging their respective limitations. This integrated approach will advance our fundamental understanding of plant oxidative stress signaling and support applications in crop improvement, plant pathology, and environmental monitoring.
Conclusion
Electrochemical nanosensors represent a paradigm shift in plant health diagnostics, moving beyond destructive, lab-bound methods to enable real-time, in-planta monitoring of crucial stress biomarkers like H2O2. The integration of advanced nanomaterials such as graphene oxide and metal nanoparticles with innovative form factors like biocompatible, hydrogel-enabled microneedles has proven capable of providing rapid, sensitive, and selective detection directly in live plants. While challenges in long-term stability and large-scale manufacturing remain, the successful validation of these sensors against established techniques underscores their reliability and vast potential. Future directions should focus on developing multi-analyte sensors, integrating wireless connectivity for precision agriculture, and exploring the translation of these platform technologies for biomedical applications, including point-of-care diagnostics and wearable health monitors. This technological convergence promises to revolutionize our understanding of plant physiology and disease management, securing greater agricultural sustainability.
References
- 1. Hydrogen peroxide as a signalling molecule in plants and ... [https://pubmed.ncbi.nlm.nih.gov/32234629/]
- 2. Hydrogen peroxide-induced stress acclimation in plants - PMC [https://pmc.ncbi.nlm.nih.gov/articles/PMC11073338/]
- 3. Hydrogen Peroxide Signaling in Plant Development and ... [https://www.frontiersin.org/journals/plant-science/articles/10.3389/fpls.2016.00230/full]
- 4. Hydrogen peroxide sensing, signaling and regulation of ... [https://www.sciencedirect.com/science/article/pii/S2213231714000457]
- 5. Hydrogen Peroxide Variation Patterns as Abiotic Stress ... [https://www.frontiersin.org/journals/plant-science/articles/10.3389/fpls.2022.855477/full]
- 6. Enzymeless electrochemical detection of hydrogen ... [https://www.nature.com/articles/s41598-025-10472-6]
- 7. Robust Rules for Optimal Colorimetric Sensing Based on Gold ... [https://pmc.ncbi.nlm.nih.gov/articles/PMC10152487/]
- 8. Versatile Histochemical Approach to Detection of Hydrogen ... [https://pmc.ncbi.nlm.nih.gov/articles/PMC6069982/]
- 9. Method for detection of hydrogen peroxide in HT22 cells [https://www.nature.com/articles/srep45673]
- 10. A Biohydrogel-Enabled Microneedle Sensor for In Situ ... [https://pmc.ncbi.nlm.nih.gov/articles/PMC11959595/]
- 11. A Novel Fluorescent Probe for Hydrogen Peroxide and Its ... [https://pmc.ncbi.nlm.nih.gov/articles/PMC8199646/]
- 12. A coumarin-based fluorescent probe for sensitive ... [https://www.sciencedirect.com/science/article/abs/pii/S0040403922007870]
- 13. Body fluid diagnostics using activatable optical probes [https://pubs.rsc.org/en/content/articlehtml/2025/cs/d4cs01315h]
- 14. Electrochemical sensing system based on coordination ... [https://www.nature.com/articles/s41598-025-89688-5]
- 15. Electrochemical Biosensors - Sensor Principles and ... [https://pmc.ncbi.nlm.nih.gov/articles/PMC3663003/]
- 16. Electrochemical biosensors: perspective on functional ... [https://biomaterialsres.biomedcentral.com/articles/10.1186/s40824-019-0181-y]
- 17. Experimental and In Silico Studies on the Development of ... [https://pmc.ncbi.nlm.nih.gov/articles/PMC12109943/]
- 18. Portable visual and electrochemical detection of hydrogen ... [https://www.nature.com/articles/s41378-023-00623-y]
- 19. Electrochemical Sensors and Their Applications: A Review [https://www.mdpi.com/2227-9040/10/9/363]
- 20. Electrochemical Detection of H2O2 Using Bi2O3/Bi2O2Se ... [https://www.mdpi.com/2079-4991/14/19/1592]
- 21. Recent progress in nanomaterial-based electrochemical ... [https://pubmed.ncbi.nlm.nih.gov/39753076/]
- 22. Various in vitro and in vivo current biomedical applications ... [https://www.sciencedirect.com/science/article/abs/pii/S0006291X25014639]
- 23. A critical review of in vitro and in vivo biomedical ... [https://pubmed.ncbi.nlm.nih.gov/40752422/]
- 24. DNA-programmed nanomaterials: advancing biosensing ... [https://pubs.rsc.org/en/content/articlehtml/2025/cc/d5cc01828e]
- 25. Recent advances in biomedical applications of smart ... [https://pubs.rsc.org/en/content/articlelanding/2025/pm/d5pm00137d]
- 26. Non-destructive Technologies for Plant Health Diagnosis - PMC [https://pmc.ncbi.nlm.nih.gov/articles/PMC9197209/]
- 27. Wearable Sensor Detects Plant Stress Before It's Visible [https://scitechdaily.com/wearable-sensor-detects-plant-stress-before-its-visible/]
- 28. A wearable electrochemical sensor for the monitoring of ... [https://www.sciencedirect.com/science/article/abs/pii/S1385894724068311]
- 29. Strategies to Enrich Electrochemical Sensing Data with ... [https://pmc.ncbi.nlm.nih.gov/articles/PMC11207790/]
- 30. Flower-like SnO 2 as electrochemical sensing platform for ... [https://www.sciencedirect.com/science/article/abs/pii/S0026265X25036100]
- 31. Carbon Nanotube-Based Self-Powered Sensors for ... [https://www.mdpi.com/2227-9040/13/11/388]
- 32. Innovations in graphene-based electrochemical biosensors in ... [https://pmc.ncbi.nlm.nih.gov/articles/PMC11982133/]
- 33. Detection of Hydrogen Peroxide Using Hemin-PEI/MWCNT ... [https://www.sciencedirect.com/science/article/abs/pii/S0013468625020997]
- 34. Reduced graphene oxide-based electrochemical ... [https://www.nature.com/articles/s41598-025-94313-6]
- 35. Paper-based laser-scribed graphene towards wearable ... [https://www.sciencedirect.com/science/article/abs/pii/S0039914025007027]
- 36. Electrochemical sensing of hydrogen peroxide using SnO 2 [https://pubs.rsc.org/en/content/articlelanding/2025/ay/d5ay01394a]
- 37. Recent Advances in Conductive Polymers-Based ... [https://www.mdpi.com/2073-4360/16/11/1597]
- 38. Additive manufacturing of electrically conductive polymers [https://pubs.rsc.org/en/content/articlehtml/2025/tc/d5tc02571k]
- 39. A 3D-printed hollow microneedle-based electrochemical ... [https://www.sciencedirect.com/science/article/abs/pii/S0956566324001362]
- 40. Plant patch can detect stress signals in real time [https://www.acs.org/pressroom/presspacs/2025/march/plant-patch-can-detect-stress-signals-in-real-time.html]
- 41. and chitosan-based materials for enzyme immobilizations ... [https://www.sciencedirect.com/science/article/abs/pii/S0141022904001231]
- 42. Chitosan functionalized Zn/Fe 2 O 3 ... [https://www.sciencedirect.com/science/article/abs/pii/S0141813025085757]
- 43. Enzyme immobilization in novel alginate-chitosan core- ... [https://pubmed.ncbi.nlm.nih.gov/14738858/]
- 44. Development of a composite graphene-Prussian blue ... [https://link.springer.com/article/10.1007/s10008-025-06260-x]
- 45. Plant patch can detect stress signals in real time [https://www.eurekalert.org/news-releases/1076912]
- 46. The latest HyPe(r) in plant H2O2 biosensing - PMC [https://pmc.ncbi.nlm.nih.gov/articles/PMC8491017/]
- 47. Possibilities and Challenges for Quantitative Optical ... [https://www.mdpi.com/2227-9040/5/4/28]
- 48. A Flexible Electrochemical Sensor Based on Porous Ceria ... [https://pmc.ncbi.nlm.nih.gov/articles/PMC12563342/]
- 49. Recent progress in nanomaterial-based electrochemical ... [https://www.sciencedirect.com/science/article/abs/pii/S0039914024018290]
- 50. Non-destructive Technologies for Plant Health Diagnosis [https://www.frontiersin.org/journals/plant-science/articles/10.3389/fpls.2022.884454/full]
- 51. Wearable Sensors for Plants: Status and Prospects [https://www.mdpi.com/2079-6374/15/1/53]
- 52. Design Principles of Nanosensors for Multiplex Detection of ... [https://pmc.ncbi.nlm.nih.gov/articles/PMC12232259/]
- 53. “On-plant” wearable electrochemical sensor for ... [https://www.sciencedirect.com/science/article/pii/S0039914025001407]
- 54. An Implantable and Self-Powered Sensing System for the ... [https://www.sciencedirect.com/science/article/pii/S2095809924000626]
- 55. Plant sensors could act as an early warning system ... [https://news.mit.edu/2024/plant-sensors-could-be-early-warning-system-farmers-0417]
- 56. PlantRing: A high-throughput wearable sensor system for ... [https://www.sciencedirect.com/science/article/pii/S2590346225000847]
- 57. New horizons in smart plant sensors: key technologies ... [https://www.frontiersin.org/journals/plant-science/articles/10.3389/fpls.2024.1490801/full]
- 58. Modern designs of electrochemical sensor platforms for ... [https://www.sciencedirect.com/science/article/pii/S2214158823000053]
- 59. Voltammetric sensors modified with nanomaterials [https://link.springer.com/article/10.1007/s44373-025-00027-9]
- 60. Nano-enabled biosensors in early detection of plant diseases [https://www.frontiersin.org/journals/nanotechnology/articles/10.3389/fnano.2025.1545792/full]
- 61. Advances in Nanostructured Fluorescence Sensors for H 2 ... [https://www.mdpi.com/2673-8023/5/2/15]
- 62. Nanosensors Convert H2O2 to Machine-Learnable ... [https://www.sciencedirect.com/science/article/pii/S2773237125000784]
- 63. Biomedical and environmental applications via nanobiocatalysts and... [https://eurjmedres.biomedcentral.com/articles/10.1186/s40001-025-02782-2]
- 64. Recent advances in the fabrication and application of... [https://pubmed.ncbi.nlm.nih.gov/31047147/]
- 65. Color contrast - Accessibility - MDN Web Docs - Mozilla [https://developer.mozilla.org/en-US/docs/Web/Accessibility/Guides/Understanding_WCAG/Perceivable/Color_contrast]
- 66. Elements must meet minimum color contrast ratio thresholds [https://dequeuniversity.com/rules/axe/4.8/color-contrast]
- 67. Nanosensor Applications in Plant Science - PMC [https://pmc.ncbi.nlm.nih.gov/articles/PMC9496508/]
- 68. H2O2 in plant peroxisomes: an in vivo analysis uncovers a ... [https://pmc.ncbi.nlm.nih.gov/articles/PMC2884081/]
- 69. Chilling-induced H 2 O 2 signaling activates the antioxidant ... [https://www.sciencedirect.com/science/article/pii/S2667064X22000537]
- 70. Electrochemical Quantification of Intracellular Hydrogen ... [https://www.sciencedirect.com/science/article/abs/pii/S0925400525017599]
- 71. Application of Hydrogen Peroxide as an Environmental ... [https://www.sciencedirect.com/science/article/pii/S209580991730807X]
- 72. How can you determine the lifespan of a sensor? - Robotics [https://www.linkedin.com/advice/1/how-can-you-determine-lifespan-sensor-skills-robotics-uxcgc]
- 73. Flexible Sensors for Hydrogen Peroxide Detection: A Critical ... [https://pmc.ncbi.nlm.nih.gov/articles/PMC9104121/]
- 74. Designing and Maintaining a Test System for Longevity [https://www.ni.com/en/shop/designing-and-maintaining-a-test-system-for-longevity.html?srsltid=AfmBOorzvlVioO4QhuVMQPwcM-phvKrDVH3NR7rsYCIoW6uRUTi4Um7P]
- 75. A cost and waste-savings comparison between single-use ... [https://pmc.ncbi.nlm.nih.gov/articles/PMC11182726/]
- 76. Assessment of Oxidative Stress by Detection of H 2 O 2 in ... [https://www.mdpi.com/2227-9040/11/10/532]
- 77. - UV : Principle, Strengths and... | Technology Networks Vis Spectroscopy [https://www.technologynetworks.com/analysis/articles/uv-vis-spectroscopy-principle-strengths-and-limitations-and-applications-349865]
- 78. Optimized enzymatic colorimetric assay for determination of hydrogen... [https://pmc.ncbi.nlm.nih.gov/articles/PMC4500160/]
- 79. Novel mycophenolic acid precursor-based fluorescent probe for... [https://pubs.rsc.org/en/content/articlehtml/2024/an/d4an00742e]
- 80. Noninvasive In Planta Live Measurements of H2O2 and ... [https://link.springer.com/protocol/10.1007/978-1-0716-3826-2_4]
- 81. a real-time marker of oxidative stress [https://pubmed.ncbi.nlm.nih.gov/23057760/]
- 82. High-sensitivity dual-mode detection of H2O2 secreted by ... [https://www.sciencedirect.com/science/article/abs/pii/S0925400524015752]
- 83. Recent Advances in Electrochemical Sensing of Hydrogen ... [https://www.mdpi.com/2079-4991/12/9/1475]
- 84. Various Configurations of Au@Pt Nanostructures on ... [https://pmc.ncbi.nlm.nih.gov/articles/PMC12322878/]
- 85. Sensitive and Selective Electrochemical Detection of ... [https://www.mdpi.com/2079-6374/15/9/617]
- 86. H 2 O 2 Electrochemical Detection and SERS Substrate [https://www.mdpi.com/2079-4991/15/13/998]
- 87. Experimental and In Silico Studies on the Development of ... [https://pubmed.ncbi.nlm.nih.gov/40422018/]
- 88. Polyaniline/Prussian blue nanolayer enhanced ... [https://www.sciencedirect.com/science/article/abs/pii/S0925400523009048]
- 89. Toward Field Deployment: Tackling the Energy Challenge ... [https://www.mdpi.com/1424-8220/25/18/5618]
- 90. Hydrogen Peroxide Fuel Cells and Self-Powered ... [https://pmc.ncbi.nlm.nih.gov/articles/PMC11852683/]
- 91. Solid State Sensors for Hydrogen Peroxide Detection [https://www.mdpi.com/2079-6374/11/1/9]
- 92. Ag-Cu nanoalloys: An electrochemical sensor for H2O2 ... [https://www.sciencedirect.com/science/article/abs/pii/S2468023022008732]
- 93. Current understanding, challenges and perspective on ... [https://www.sciencedirect.com/science/article/abs/pii/S0956566322010454]
- 94. Stain Normalization of Histopathological Images Based on ... [https://www.mdpi.com/2075-4418/15/8/1032]
- 95. Deep learning-enabled virtual histological staining of ... [https://www.nature.com/articles/s41377-023-01104-7]
- 96. Intravital electrochemical nanosensor as a tool for the ... [https://jnanobiotechnology.biomedcentral.com/articles/10.1186/s12951-022-01688-z]