Differential Expression Analysis of NBS Genes: Uncovering the Genetic Basis of Disease Resistance in Crops
This article provides a comprehensive guide for researchers and scientists on conducting and interpreting differential expression analysis of Nucleotide-Binding Site-Leucine Rich Repeat (NBS-LRR) genes in resistant versus susceptible plant cultivars.
Differential Expression Analysis of NBS Genes: Uncovering the Genetic Basis of Disease Resistance in Crops
Abstract
This article provides a comprehensive guide for researchers and scientists on conducting and interpreting differential expression analysis of Nucleotide-Binding Site-Leucine Rich Repeat (NBS-LRR) genes in resistant versus susceptible plant cultivars. It covers the foundational principles of NBS-LRR gene families and their role in effector-triggered immunity, explores advanced methodological approaches from transcriptomics to genome-wide association studies, addresses common troubleshooting and optimization challenges in data analysis, and outlines robust validation techniques for confirming gene function. By synthesizing current research and methodologies, this resource aims to accelerate the identification of key resistance genes for crop improvement and sustainable agriculture.
Understanding NBS-LRR Gene Families and Their Role in Plant Immunity
The Nucleotide-Binding Site Leucine-Rich Repeat (NBS-LRR) gene family represents the largest and most crucial class of plant resistance (R) genes, forming the core of the plant immune system's second layer known as Effector-Triggered Immunity (ETI). These genes encode intracellular receptor proteins that detect pathogen effector proteins, initiating robust defense responses often accompanied by a localized programmed cell death termed the hypersensitive response (HR) [1] [2]. The NBS-LRR proteins are characterized by a conserved nucleotide-binding site (NBS) domain responsible for ATP/GTP binding and hydrolysis, which acts as a molecular switch for immune signaling, and a C-terminal leucine-rich repeat (LRR) domain that confers pathogen recognition specificity through its high sequence variability [3] [1]. The N-terminal domain, which can be a Toll/Interleukin-1 receptor (TIR) domain, a coiled-coil (CC) domain, or a Resistance to Powdery Mildew 8 (RPW8) domain, provides the basis for classifying NBS-LRR proteins into major subfamilies (TNL, CNL, and RNL) with distinct signaling pathways [1] [2].
The "gene-for-gene" model, documented since the 1950s, describes the specific interaction between a single pathogen effector (Avirulence or Avr gene) and its cognate plant NBS-LRR immune receptor (R gene) [4]. Upon effector recognition, NBS-LRR proteins undergo conformational changes from ADP-bound inactive states to ATP-bound active states, triggering downstream defense signaling cascades [5]. Recent advances have revealed non-canonical ETI mechanisms, including immune receptor pairs and networks, as well as R genes encoding only partial NLR domains or non-NLR proteins such as tandem kinases, broadening our understanding of the plant immune receptor repertoire [4].
Genomic Organization and Evolution of NBS-LRR Genes
Genomic Distribution and Cluster Analysis
NBS-LRR genes are distributed unevenly across plant genomes, often forming gene-rich clusters primarily driven by tandem duplications and genomic rearrangements [3] [6]. These dynamic clusters facilitate rapid evolution of resistance genes through recombination and diversifying selection, enabling plants to keep pace with evolving pathogens.
Table 1: Genomic Distribution of NBS-LRR Genes Across Plant Species
| Plant Species | Total NBS-LRR Genes | Clustered Genes (%) | Main Subfamily Composition | Reference |
|---|---|---|---|---|
| Capsicum annuum (Pepper) | 252 | 54% (47 clusters) | 248 nTNL, 4 TNL | [3] |
| Eucalyptus grandis | 1,215 | 76% (clusters of ≥3 genes) | TIR and CC classes | [6] |
| Broussonetia papyrifera | 328 | Information not specified | 92 N, 47 CN, 54 CNL, 29 NL, 55 TN, 51 TNL | [7] |
| Solanum phureja (Potato) | Information not specified | Information not specified | Information not specified | [8] |
| Manihot esculenta (Cassava) | 228 full NBS-LRR + 99 partial | 63% (39 clusters) | 34 TNL, 128 CNL | [9] |
| Salvia miltiorrhiza | 196 | Information not specified | 61 CNL, 1 RNL, 2 TNL | [2] |
| Nicotiana benthamiana | 156 | Information not specified | 5 TNL, 25 CNL, 23 NL, 2 TN, 41 CN, 60 N | [5] |
Structural Diversity and Conserved Motifs
The structural architecture of NBS-LRR genes exhibits remarkable diversity, with variations in domain composition leading to distinct classification schemes. Based on their domain structures, NBS-LRR genes are categorized into:
- Typical NBS-LRRs: Contain complete N-terminal, NBS, and LRR domains (TNL, CNL, RNL)
- Atypical NBS-LRRs: Lack one or more domains (N, TN, CN, NL types) [5] [2]
The NBS domain contains several conserved motifs of 10-30 amino acids that are crucial for signal initiation, including the P-loop (involved in ATP/GTP binding), RNBS-A, kinase-2, RNBS-B, RNBS-C, and GLPL motifs essential for resistance signaling [3]. These conserved sequences within the NBS domain are widely used to identify and isolate plant Resistance Gene Analogs (RGAs) through degenerate primer design [3].
Table 2: Conserved Motifs in the NBS Domain of Pepper NBS-LRR Genes
| Motif Name | Function | Conserved Sequence |
|---|---|---|
| P-loop/kin1 | ATP/GTP binding | GIGKST/GVGKTT/GAGKTT |
| RNBS-A-non-TIR | Domain specificity | VLLEVIGCISNTND/VVVWVTVPK |
| Kinase-2 | Signal transduction | KGPRYLVVVDDIWRID/EKSFLLILDDVWKGIN |
| RNBS-B | Structural stability | NGSRILLTTRETKVAMYAS/SKVIITTRSLEVCRQMR |
| RNBS-C | Nucleotide binding | LLNLENGWKLLRDKVF/VTTLNEDESWELFVKNAG |
| GLPL | Resistance signaling | CQGLPL/CGGLPLA/CEGLPL |
Application Notes: Differential Expression Analysis in Resistant vs. Susceptible Cultivars
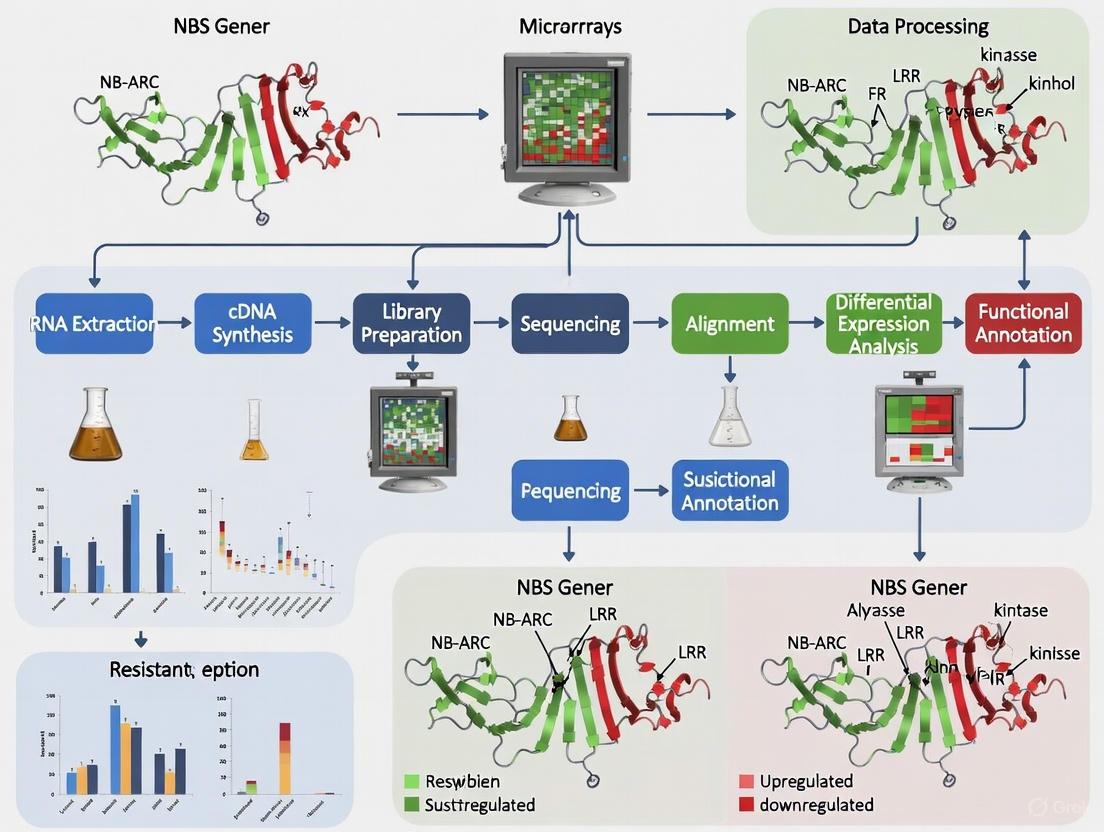
Experimental Workflow for Comparative Transcriptomics
The following diagram illustrates the integrated genomic and transcriptomic approach for identifying candidate NBS-LRR genes involved in disease resistance:
Protocol: Identification of Differentially Expressed NBS-LRR Genes
Objective: To identify candidate NBS-LRR genes conferring resistance by comparing transcriptomic profiles between resistant and susceptible cultivars under pathogen challenge.
Materials and Reagents:
- Plant materials: Resistant and susceptible genotypes (e.g., potato clones with contrasting resistance to Globodera rostochiensis) [8]
- Pathogen inoculum (e.g., nematode eggs and juveniles)
- RNA extraction kit (e.g., TRIzol-based methods)
- RNA-seq library preparation kit (Illumina-compatible)
- Bioinformatics software: HMMER, Pfam, DESeq2/edgeR, ClustalW, MEME suite
Procedure:
Plant Material Preparation and Inoculation
- Select genetically characterized resistant and susceptible accessions with contrasting disease response phenotypes [8].
- For nematode resistance studies, propagate pathogen populations on susceptible hosts under controlled conditions. Extract cysts from soil using flotation techniques [8].
- Inoculate roots of both resistant and susceptible genotypes with standardized pathogen suspension (e.g., 1 ml water suspension with approximately 1500 nematode eggs and juveniles) [8].
- Maintain control (mock-inoculated) plants for baseline gene expression analysis.
Tissue Collection and RNA Extraction
- Collect root tissues at multiple time points post-inoculation (e.g., 0, 6, 12, 24, 48 hours) to capture early and late immune responses.
- Immediately freeze tissues in liquid nitrogen and store at -80°C until RNA extraction.
- Extract total RNA using established protocols, ensuring RNA Integrity Number (RIN) >8.0 for high-quality sequencing libraries.
Library Preparation and Sequencing
- Prepare RNA-seq libraries using standard Illumina protocols with poly-A selection for mRNA enrichment.
- Sequence libraries on an appropriate Illumina platform (e.g., NovaSeq) to generate 150 bp paired-end reads with minimum 30 million reads per sample.
Bioinformatic Identification of NBS-LRR Genes
- Use Hidden Markov Model (HMM) searches with the NB-ARC domain (PF00931) from the Pfam database to identify NBS-containing genes in the reference genome [5] [9].
- Perform HMMER searches with an E-value cutoff of <1×10⁻²⁰ to identify candidate NBS-LRR homologs [5].
- Confirm domain architecture using PfamScan, SMART, and NCBI Conserved Domains Database with E-value <0.01 [5] [9].
- Classify identified genes into subfamilies (TNL, CNL, RNL, TN, CN, NL, N) based on presence/absence of TIR, CC, RPW8, and LRR domains.
Differential Expression Analysis
- Process raw RNA-seq reads: quality control (FastQC), adapter trimming (Trimmomatic), and alignment to reference genome (HISAT2/STAR).
- Generate count matrices for each gene using featureCounts.
- Perform differential expression analysis with DESeq2 or edgeR, comparing inoculated resistant vs. inoculated susceptible genotypes at each time point.
- Identify significantly differentially expressed NBS-LRR genes using adjusted p-value (FDR) <0.05 and log2 fold change >1 or <-1.
Candidate Gene Prioritization
- Select candidate genes showing consistent differential expression across multiple time points.
- Prioritize genes located in known resistance QTL regions or with homology to functionally characterized R genes.
- Validate expression patterns of top candidates using quantitative RT-PCR on independent biological samples.
Troubleshooting Tips:
- If few NBS-LRR genes show differential expression, consider additional time points or different inoculation methods.
- For high background expression in controls, include more biological replicates to improve statistical power.
- If RNA quality is poor from inoculated tissues, optimize collection time points or use pathogen elicitors instead of live pathogens.
The Scientist's Toolkit: Essential Research Reagents
Table 3: Key Research Reagent Solutions for NBS-LRR Gene Analysis
| Reagent/Resource | Function | Example Application |
|---|---|---|
| HMMER Suite | Identification of NBS-domain containing proteins using hidden Markov models | Genome-wide mining of NBS-LRR genes with NB-ARC domain (PF00931) [6] [9] |
| Pfam Database | Protein family classification and domain annotation | Verification of NBS, TIR, CC, LRR, and RPW8 domains [5] [9] |
| MEME Suite | Discovery of conserved protein motifs | Identification of P-loop, kinase-2, RNBS, and GLPL motifs in NBS domains [7] [5] |
| DESeq2/edgeR | Differential expression analysis from RNA-seq data | Statistical analysis of NBS-LRR gene expression in resistant vs. susceptible cultivars [8] |
| Phytozome/EnsemblPlants | Genomic data repository | Access to genome sequences and annotations for comparative analysis [1] |
| PlantCARE Database | Identification of cis-regulatory elements | Analysis of promoter regions of differentially expressed NBS-LRR genes [5] |
Signaling Pathways in NBS-LRR Mediated Immunity
The following diagram illustrates the core signaling mechanisms in NBS-LRR-mediated Effector-Triggered Immunity:
Case Study: NBS-LRR Genes in Sugarcane Disease Resistance
A comprehensive genome-wide analysis of NBS-LRR genes in sugarcane revealed fascinating evolutionary patterns and functional specialization. Research comparing Saccharum spontaneum and Saccharum officinarum demonstrated that more differentially expressed NBS-LRR genes in modern sugarcane cultivars were derived from S. spontaneum than from S. officinarum, with the proportion significantly higher than expected [1]. This finding indicates that S. spontaneum contributes more substantially to disease resistance in modern sugarcane cultivars, providing valuable genetic resources for breeding programs.
Transcriptome analysis of sugarcane responses to multiple diseases identified 125 NBS-LRR genes responding to multiple diseases, with seven genes showing allele-specific expression under leaf scald infection [1]. These findings highlight the complex regulation of NBS-LRR genes and their potential roles in broad-spectrum resistance, enabling more targeted approaches for crop improvement.
The NBS-LRR gene superfamily represents a critical component of plant immunity, with its dynamic genomic organization and regulated expression patterns contributing to pathogen recognition and defense activation. The integration of comparative genomics with transcriptomic analyses of resistant and susceptible cultivars provides a powerful approach for identifying functional R genes for crop improvement.
Future research directions should focus on:
- Elucidating the specific recognition mechanisms between NBS-LRR receptors and pathogen effectors
- Understanding the coordination between different NBS-LRR subfamilies in immune signaling networks
- Developing efficient genome editing strategies to enhance resistance by modifying NBS-LRR genes
- Exploring natural variation in NBS-LRR genes across wild relatives and landraces for breeding applications
The protocols and application notes presented here provide a framework for investigating the role of NBS-LRR genes in plant-pathogen interactions, contributing to the development of durable disease resistance in crop species.
Genomic Architecture and Classification of NBS-LRR Genes Across Species
Nucleotide-binding site and leucine-rich repeat (NBS-LRR) genes constitute the largest family of plant disease resistance (R) genes, playing a critical role in the innate immune system against diverse pathogens including fungi, bacteria, viruses, and nematodes [10] [11] [12]. These genes encode proteins that detect pathogen effectors and trigger robust defense responses, often accompanied by a hypersensitive reaction (HR) to confine pathogens at infection sites [10] [13]. The NBS-LRR family is characterized by a central conserved NBS (nucleotide-binding site) domain and a C-terminal LRR (leucine-rich repeat) domain, with variable N-terminal domains defining major subclasses [12] [14]. Understanding the genomic architecture and classification of these genes across species provides fundamental insights into plant-pathogen co-evolution and facilitates the development of disease-resistant crop varieties through marker-assisted breeding and biotechnological approaches.
Classification and Domain Architecture of NBS-LRR Genes
Major Subclasses and Structural Characteristics
Based on N-terminal domain configurations, NBS-LRR genes are classified into three principal subclasses:
- TNL (TIR-NBS-LRR): Characterized by an N-terminal Toll/Interleukin-1 receptor (TIR) domain [12] [14].
- CNL (CC-NBS-LRR): Featuring an N-terminal coiled-coil (CC) domain [12] [14].
- RNL (RPW8-NBS-LRR): Containing an N-terminal Resistance to Powdery Mildew 8 (RPW8) domain [11] [12].
The central NBS domain binds and hydrolyzes nucleotides (ATP/GTP), serving as a molecular switch for immune signaling, while the C-terminal LRR domain mediates protein-protein interactions and determines pathogen recognition specificity [11] [14]. Additionally, truncated variants lacking complete domain structures exist, including CC-NBS, TIR-NBS, NBS-LRR, and NBS-only forms [15] [16].
Table 1: Classification of NBS-LRR Genes in Various Plant Species
| Plant Species | Total NBS-LRR | CNL | TNL | RNL | Other/Truncated | Reference |
|---|---|---|---|---|---|---|
| Euryale ferox (early angiosperm) | 131 | 40 | 73 | 18 | - | [10] |
| Solanum melongena (eggplant) | 269 | 231 | 36 | 2 | - | [14] |
| Nicotiana tabacum (tobacco) | 603 | ~45% of total | ~2.5% of total | - | ~45.5% NBS-only, ~23.3% CC-NBS | [15] |
| Vernicia fordii (tung tree) | 90 | 12 CC-NBS-LRR | 0 | - | 66 without LRR | [16] |
| Vernicia montana (tung tree) | 149 | 9 CC-NBS-LRR | 3 TIR-NBS-LRR | - | 125 without LRR | [16] |
| Fragaria vesca (strawberry) | 144 | Majority non-TNL | 23 (15.97%) | - | - | [17] |
| Malus × domestica (apple) | 748 | Majority non-TNL | 219 (29.28%) | - | - | [17] |
Genomic Distribution and Organization
NBS-LRR genes typically display uneven chromosomal distribution with a strong tendency to cluster in multigene arrays. In Euryale ferox, 87 of 131 NBS-LRR genes (66.4%) are clustered at 18 multigene loci, while 44 genes exist as singletons [10]. Similarly, in eggplant, NBS-LRR genes predominantly cluster on chromosomes 10, 11, and 12 [14]. These clustered arrangements facilitate the generation of diversity through unequal crossing over and gene conversion, enabling rapid evolution to counter emerging pathogen strains [18].
Evolutionary Dynamics and Expansion Mechanisms
Evolutionary Patterns Across Plant Families
The NBS-LRR gene family exhibits remarkable evolutionary dynamism with significant variation in family size and composition across plant taxa. Several distinct evolutionary patterns have been identified:
- Expansion and Contraction: Observed in Rubus occidentalis, Potentilla micrantha, Fragaria iinumae, and Gillenia trifoliata (Rosaceae) [12].
- Continuous Expansion: Exemplified by Rosa chinensis [12].
- Complex Fluctuation: Displayed by F. vesca with "expansion followed by contraction, then further expansion" [12].
- Early Expansion and Abrupt Contraction: Shared by three Prunus and three Maleae species [12].
Comparative genomics reveals that TNL genes show different evolutionary dynamics compared to non-TNL genes (CNLs and RNLs), with significantly higher Ks values and Ka/Ks ratios, suggesting more rapid evolution, potentially reflecting adaptation to different pathogen pressures [17].
Mechanisms of Gene Family Expansion
Multiple genetic mechanisms drive NBS-LRR gene family expansion and diversification:
- Segmental Duplications: Major mechanism for CNL and TNL expansions in Euryale ferox and Nicotiana tabacum [10] [15].
- Tandem Duplications: Primary driver for recent NBS-LRR expansions in eggplant and other species [17] [14].
- Ectopic Duplications: Implicated in RNL gene expansions in Euryale ferox [10].
- Whole-Genome Duplication (WGD): Significant contributor to NBS-LRR expansions in sugarcane and Nicotiana species [11] [15].
Table 2: Evolutionary Mechanisms Driving NBS-LRR Expansion in Different Species
| Species | Major Expansion Mechanisms | Key Findings | Reference |
|---|---|---|---|
| Euryale ferox | Segmental duplications (CNL/TNL), Ectopic duplications (RNL) | RNL genes scattered without synteny | [10] |
| Nicotiana tabacum | Whole-genome duplication, Segmental duplication | 76.62% of NBS genes traceable to parental genomes | [15] |
| Solanum melongena (eggplant) | Tandem duplication | Primary mechanism for recent expansion | [14] |
| Five Rosaceae species | Species-specific duplications | 37.01-66.04% of NBS-LRRs from species-specific duplication | [17] |
| Sugarcane | Whole-genome duplication | Main cause of NBS-LRR numbers in sugarcane | [11] |
Experimental Protocols for NBS-LRR Gene Identification and Analysis
Genome-Wide Identification Pipeline
Materials and Software Requirements:
- High-quality genome assembly and annotation files
- HMMER software (v3.1b2 or later)
- BLAST suite
- PFAM and CDD databases
- Programming environment (Python/Perl) for data processing
Step-by-Step Protocol:
Domain Search:
Candidate Gene Refinement:
Classification and Annotation:
- Classify genes into subclasses based on domain architecture.
- Map chromosomal locations using genome annotation files.
- Identify gene clusters (NBS-LRR genes within 250kb genomic regions) [10].
Figure 1: Workflow for genome-wide identification of NBS-LRR genes
Differential Expression Analysis in Resistant vs. Susceptible Cultivars
Experimental Design:
- Select paired genotypes with contrasting resistance phenotypes [13] [16].
- Implement pathogen inoculation under controlled conditions.
- Collect tissue samples at multiple time points post-inoculation.
- Include appropriate biological replicates.
RNA-Seq and Expression Analysis:
Sample Preparation and Sequencing:
- Extract total RNA using standardized protocols.
- Prepare RNA-seq libraries (stranded, poly-A selection recommended).
- Sequence on Illumina platform (minimum 20 million reads per sample).
Transcriptome Analysis:
NBS-LRR Expression Filtering:
- Extract expression values for identified NBS-LRR genes.
- Apply statistical thresholds (e.g., FDR < 0.05, log2FC > 1).
- Identify consistently differentially expressed NBS-LRR candidates.
Figure 2: Differential expression analysis workflow for identifying NBS-LRR candidates
Functional Validation Protocols
Virus-Induced Gene Silencing (VIGS)
The following protocol is adapted from functional characterization of VmNBS-LRR in Vernicia montana [16]:
Reagents and Materials:
- TRV-based VIGS vectors (pTRV1, pTRV2)
- Agrobacterium tumefaciens strain GV3101
- Antibiotics for selection (kanamycin, rifampicin)
- Acetosyringone solution
- Infiltration buffer (10 mM MgCl₂, 10 mM MES, 200 μM acetosyringone)
Procedure:
Vector Construction:
- Clone 300-500bp fragment of target NBS-LRR gene into pTRV2 vector.
- Verify insertion by sequencing.
Agrobacterium Preparation:
- Transform recombinant pTRV2 and pTRV1 into Agrobacterium.
- Culture bacteria in LB with antibiotics at 28°C.
- Resuspend in infiltration buffer to OD₆₀₀ = 1.5.
Plant Infiltration:
- Mix pTRV1 and pTRV2 cultures in 1:1 ratio.
- Incubate 3-4 hours at room temperature.
- Infiltrate into expanded leaves using needleless syringe.
- Maintain plants under controlled conditions for 3-4 weeks.
Phenotypic Assessment:
- Challenge silenced plants with target pathogen.
- Compare disease symptoms with control plants.
- Verify silencing efficiency by qRT-PCR.
Transcriptional Regulation Analysis
To investigate NBS-LRR gene regulation, particularly promoter analysis:
Promoter Isolation and Analysis:
- Isolate 1.5-2.0kb genomic region upstream of NBS-LRR start codon.
- Identify cis-regulatory elements using PlantCARE or similar tools.
- Specifically examine W-box elements (binding sites for WRKY transcription factors) [16].
Transient Expression Assays:
- Clone promoter sequence into reporter vector (e.g., pGreen0800-LUC).
- Co-transform with effector plasmid (e.g., WRKY transcription factor).
- Measure reporter activity (luciferase, GUS) after 48-72 hours.
Table 3: Essential Research Reagents for NBS-LRR Functional Studies
| Reagent/Category | Specific Examples | Function/Application | Reference |
|---|---|---|---|
| HMM Profiles | PF00931 (NB-ARC) | Identification of NBS domains | [10] [12] |
| Software Tools | HMMER, MCScanX, MEME, TBtools | Bioinformatics analysis | [12] [15] |
| VIGS Vectors | pTRV1, pTRV2 | Functional gene silencing | [16] |
| Agrobacterium Strains | GV3101 | Plant transformation | [16] |
| Reporter Systems | Luciferase, GUS | Promoter activity analysis | [16] |
| RNA-Seq Tools | HISAT2, Cufflinks, DESeq2 | Expression analysis | [15] [13] |
Applications in Disease Resistance Breeding
The characterization of NBS-LRR genes enables multiple applications in crop improvement:
Marker Development: Polymorphisms in NBS-LRR genes facilitate development of molecular markers for marker-assisted selection [13] [14].
Candidate Gene Identification: Differential expression analysis identifies NBS-LRR genes with potential resistance function. In Solanum phureja, comparative transcriptomics of resistant and susceptible genotypes identified candidate R genes against Globodera rostochiensis [13].
Functional Stacking: Multiple R genes can be pyramided to provide durable resistance. Modern gene editing tools enable precise integration of NBS-LRR genes into susceptible cultivars.
Promoter Engineering: Modifying promoter elements (e.g., W-box sequences) can enhance resistance gene expression, as demonstrated in the Vf11G0978-Vm019719 orthologous pair in tung trees [16].
The genomic architecture of NBS-LRR genes reveals a dynamic and rapidly evolving family characterized by diverse structural configurations, complex genomic organization, and species-specific evolutionary patterns. The integrated protocols for identification, expression analysis, and functional validation provide a comprehensive framework for elucidating R gene function in the context of plant-pathogen interactions. These approaches facilitate the discovery and deployment of resistance genes in breeding programs, contributing to the development of sustainable crop protection strategies with reduced reliance on chemical pesticides.
Comparative Analysis of NBS-LRR Repertoires in Resistant vs. Susceptible Genotypes
Within the context of a broader thesis on the differential expression analysis of NBS genes in resistant versus susceptible cultivars, this application note provides a detailed protocol for the comparative analysis of NBS-LRR gene repertoires. NBS-LRR genes constitute the largest class of plant disease resistance (R) proteins and are pivotal intracellular immune receptors that initiate effector-triggered immunity (ETI) [19] [20]. A comprehensive comparison of the NBS-LRR repertoire between resistant and susceptible genotypes enables the identification of key genes governing disease resistance, which can be leveraged for marker-assisted breeding. This document outlines a standardized workflow for genome-wide identification, phylogenetic classification, expression profiling, and functional validation of NBS-LRR genes, with a focus on discerning critical differences between resistant and susceptible phenotypes.
Key Concepts and Biological Significance
The NBS-LRR family is characterized by a conserved nucleotide-binding site (NBS) domain and a C-terminal leucine-rich repeat (LRR) domain [20]. The NBS domain binds and hydrolyzes nucleotides, providing energy for activation, while the LRR domain is primarily involved in pathogen recognition and determining specificity [19] [20]. Based on the variable N-terminal domain, NBS-LRR proteins are classified into several major subfamilies:
- TNL (TIR-NBS-LRR): Contains a Toll/Interleukin-1 Receptor (TIR) domain.
- CNL (CC-NBS-LRR): Contains a Coiled-Coil (CC) domain.
- RNL (RPW8-NBS-LRR): Contains a Resistance to Powdery Mildew 8 (RPW8) domain and often acts as a "helper" in signaling cascades [19] [10].
Additionally, atypical forms that lack a complete LRR or N-terminal domain (denoted as N, TN, CN, NL) are also common and may function as adaptors or regulators [5]. The distribution of these subfamilies varies significantly among plant lineages; for instance, TNLs are absent in monocots like rice and have undergone marked reduction in some eudicots, such as Salvia miltiorrhiza [16] [19].
These proteins function as molecular switches within the plant immune system. In their resting state, they are auto-inhibited. Upon direct or indirect recognition of pathogen effector proteins, they undergo conformational changes, transitioning from an ADP-bound to an ATP-bound state [5]. This triggers a robust defense response, often including a hypersensitive response (HR) and programmed cell death at the infection site, effectively limiting pathogen spread [19] [10].
Workflow for Comparative NBS-LRR Repertoire Analysis
The following diagram illustrates the comprehensive experimental and computational workflow for comparing NBS-LRR repertoires between resistant and susceptible genotypes.
Comparative Case Studies: Data Presentation
Genome-wide studies across diverse species consistently reveal differences in the size and composition of the NBS-LRR repertoire between resistant and susceptible genotypes or closely related species. The table below summarizes key findings from several studies.
Table 1: Comparative NBS-LRR Repertoire Analysis in Selected Plant Species
| Species (Genotype) | Resistance Status | Total NBS-LRRs | CNL | TNL | RNL | Key Findings | Citation |
|---|---|---|---|---|---|---|---|
| Vernicia montana | Resistant to Fusarium wilt | 149 | 98 (65.8%) | 12 (8.1%) | Not specified | Ortholog Vm019719 (CNL) conferred resistance; activated by VmWRKY64. | [16] |
| Vernicia fordii | Susceptible to Fusarium wilt | 90 | 49 (54.4%) | 0 | Not specified | Allele Vf11G0978 had a promoter W-box deletion, leading to ineffective defense. | [16] |
| Euryale ferox | Early-diverging angiosperm | 131 | 40 (30.5%) | 73 (55.7%) | 18 (13.7%) | High proportion of TNLs; RNL subfamily likely expanded via ectopic duplication. | [10] |
| Salvia miltiorrhiza | Medicinal plant | 62 (typical) | 61 (98.4%) | 0 | 1 (1.6%) | Marked degeneration of TNL and RNL subfamilies. | [19] |
| Nicotiana benthamiana | Model plant | 156 | 25 (CNL) | 5 (TNL) | 4 (various) | 60 N-type proteins identified, suggesting many atypical regulators. | [5] |
| Potato (Resistant Somatic Hybrids) | Resistant to Late Blight | Not specified | Up-regulated | Not specified | Not specified | CC-NBS-LRR and NBS-LRR genes were among highly up-regulated DEGs in resistant hybrids. | [21] |
Detailed Experimental Protocols
Protocol 1: Genome-Wide Identification of NBS-LRR Genes
This protocol is adapted from multiple studies [16] [10] [5].
Objective: To comprehensively identify all NBS-LRR encoding genes in a plant genome.
Materials:
- Genome Data: High-quality genome assembly and annotation file (in GFF/GTF format).
- Software: HMMER (v3.3+), PfamScan, NCBI CDD database, Biopython, TBtools.
Procedure:
- HMMER Search:
- Download the HMM profile for the NB-ARC domain (Pfam: PF00931).
- Use the
hmmsearchcommand against the entire proteome of the target species. - Set an E-value cutoff (e.g., < 1e-04) to retrieve a initial set of candidate sequences.
- Optional: Build a species-specific HMM profile from high-confidence hits and repeat the search for greater sensitivity.
Domain Verification:
- Submit all candidate protein sequences to PfamScan and the NCBI Conserved Domain Database (CDD).
- Confirm the presence of the NBS (NB-ARC) domain with a strict E-value (e.g., < 0.001).
- Identify additional domains: TIR (PF01582), CC (predicted by COILS or MARCO), RPW8 (PF05659), and LRR (PF00560, PF07723, etc.).
Classification and Nomenclature:
- Classify each gene into subfamilies (TNL, CNL, RNL, TN, CN, NL, N) based on the presence/absence of N-terminal and LRR domains.
- Assign systematic names (e.g., prefix "Vm" for Vernicia montana followed by "NBS" and a number).
Troubleshooting Tip: Manually inspect proteins with weak E-values or atypical domain structures, as they may represent divergent but genuine NBS-LRRs or pseudogenes.
Protocol 2: Differential Expression Analysis via RNA-seq
This protocol is based on methodologies used in studies of tung tree and potato [16] [21].
Objective: To identify NBS-LRR genes that are differentially expressed in resistant versus susceptible genotypes upon pathogen challenge.
Materials:
- Plant Materials: Resistant and susceptible genotypes, grown under controlled conditions.
- Pathogen: Target pathogen (e.g., Fusarium oxysporum, Phytophthora infestans).
- Reagents: RNA extraction kit (e.g., TRIzol), Illumina-compatible library prep kit.
- Software: HiSAT2/StringTie/DESeq2 pipeline or other RNA-seq aligners and differential expression tools.
Procedure:
- Experimental Design and Inoculation:
- Use a minimum of three biological replicates per genotype per condition (mock and pathogen-inoculated).
- Inoculate plants at a consistent developmental stage. Use mock treatment (e.g., water) as a control.
- Harvest tissue from the infection site at critical time points post-inoculation (e.g., 0, 6, 12, 24, 48 hours). Immediately freeze tissue in liquid nitrogen.
RNA Sequencing:
- Extract total RNA using a reliable kit, ensuring RNA Integrity Number (RIN) > 8.0.
- Prepare stranded cDNA libraries and sequence on an Illumina platform (e.g., 2x150 bp reads).
Bioinformatic Analysis:
- Quality Control: Use FastQC to check read quality. Trim adapters and low-quality bases with Trimmomatic.
- Alignment: Map clean reads to the reference genome using HiSAT2 or STAR.
- Quantification: Assemble transcripts and estimate gene-level counts using StringTie or featureCounts.
- Differential Expression: Import count matrices into R/Bioconductor and use DESeq2 to identify statistically significant (p-adjusted < 0.05) DEGs with a defined fold-change threshold (e.g., |log2FC| > 2).
Troubleshooting Tip: Include a time-series analysis to capture dynamic expression patterns, as some key NBS-LRR genes may be induced early during infection.
Protocol 3: Functional Validation by Virus-Induced Gene Silencing (VIGS)
This protocol is adapted from the functional characterization of Vm019719 in tung tree [16].
Objective: To rapidly assess the function of a candidate NBS-LRR gene in plant defense.
Materials:
- VIGS Vector: A TRV-based (Tobacco Rattle Virus) VIGS vector (e.g., pTRV1, pTRV2).
- Agrobacterium tumefaciens strain GV3101.
- Reagents: Acetosyringone, MgCl2, Silwet L-77.
- Target Gene: A unique ~200-300 bp fragment from the candidate NBS-LRR gene.
Procedure:
- Vector Construction:
- Clone the target gene fragment into the pTRV2 vector to create the pTRV2::Candidate construct.
Agrobacterium Preparation:
- Transform pTRV1 and pTRV2::Candidate into A. tumefaciens.
- Grow cultures, pellet cells, and resuspend in an induction buffer (10 mM MgCl2, 10 mM MES, 200 µM acetosyringone) to an OD600 of ~1.5.
- Incubate the suspensions at room temperature for 3-4 hours.
Plant Infiltration:
- Mix the pTRV1 and pTRV2::Candidate suspensions in a 1:1 ratio.
- Infiltrate the mixture into the leaves of young plants (e.g., at the 4-leaf stage for tung tree) using a needleless syringe. Include plants infiltrated with an empty pTRV2 vector as a control.
Phenotypic Assay:
- After 2-3 weeks, when silencing is established, challenge the silenced plants with the target pathogen.
- Monitor and record disease symptoms over time. Compare the disease progression in candidate-silenced plants versus control plants.
Troubleshooting Tip: Always confirm the silencing efficiency of the target gene in inoculated tissues using qRT-PCR before pathogen challenge.
The Scientist's Toolkit: Research Reagent Solutions
Table 2: Essential Reagents and Resources for NBS-LRR Research
| Reagent / Resource | Function / Application | Example Use in Protocol |
|---|---|---|
| HMMER Software Suite | Profile hidden Markov model-based sequence search. | Identifying NBS domain-containing proteins from a whole proteome (Protocol 1). |
| Pfam & NCBI CDD Databases | Repository of protein family and domain annotations. | Verifying the presence of NBS, TIR, LRR, and other domains (Protocol 1). |
| MEME Suite | Discovery and analysis of sequence motifs. | Identifying conserved protein motifs within NBS-LRR subfamilies. |
| DESeq2 R Package | Differential expression analysis of RNA-seq count data. | Statistically identifying NBS-LRR genes up-/down-regulated in resistant genotypes (Protocol 2). |
| TRV-based VIGS Vectors | Virus-Induced Gene Silencing for rapid functional genomics. | Knocking down candidate NBS-LRR gene expression in planta (Protocol 3). |
| Illumina RNA-seq Library Prep Kits | Preparation of sequencing libraries for transcriptome analysis. | Constructing libraries from mock- and pathogen-inoculated plant RNA (Protocol 2). |
Signaling Pathways in NBS-LRR Mediated Immunity
The intracellular immune signaling initiated by NBS-LRR proteins can be visualized as a simplified pathway. The following diagram illustrates the core steps from pathogen recognition to defense activation, highlighting the roles of different NBS-LRR subfamilies.
The comparative analysis of NBS-LRR repertoires is a powerful approach for elucidating the genetic basis of disease resistance in plants. The integrated workflow presented here—encompassing bioinformatic identification, phylogenetic classification, expression profiling, and functional validation—provides a robust framework for pinpointing key resistance genes. As demonstrated in the case studies, loss or gain of specific NBS-LRR genes, sequence variations in promoter elements (e.g., W-boxes), and dramatic differences in gene expression can underlie susceptibility or resistance. The application of these protocols will empower researchers to discover candidate R genes that can be directly deployed in marker-assisted breeding programs to develop durable disease-resistant crop varieties, ultimately enhancing global food security.
This application note provides a structured framework for investigating the evolutionary dynamics of Nucleotide-Binding Site Leucine-Rich Repeat (NBS-LRR) genes within the context of plant disease resistance. It details protocols for identifying NBS-LRR gene candidates and validating their function, with a specific focus on leveraging comparative analysis between resistant and susceptible plant cultivars. The guidance emphasizes the role of tandem duplications and domain loss events in shaping the repertoire of these crucial resistance genes, providing researchers with a clear pathway from genomic analysis to functional characterization.
NBS-LRR genes constitute the largest family of plant disease resistance (R) genes, encoding intracellular proteins that detect pathogen effectors and trigger robust immune responses, known as Effector-Triggered Immunity (ETI) [19] [22]. These genes are classified into major subclasses—TNL (TIR-NBS-LRR), CNL (CC-NBS-LRR), and RNL (RPW8-NBS-LRR)—based on their variable N-terminal domains [12] [5].
The evolution of NBS-LRR genes is predominantly driven by tandem duplication events and frequent domain losses, leading to the formation of complex gene clusters and substantial variation in gene number and structure across plant species [12] [23] [24]. This dynamic evolution is a critical response to the selective pressure exerted by rapidly evolving pathogens. Analyzing the differential expression of these genes in resistant versus susceptible cultivars provides a powerful strategy for identifying functional R genes against specific pathogens [8].
The tables below summarize the variation in NBS-LRR gene number and composition across various plant species, highlighting the impact of evolutionary dynamics.
Table 1: Evolutionary Patterns of NBS-LRR Genes in Rosaceae Species
| Species | Evolutionary Pattern | Key Genomic Driver |
|---|---|---|
| Rosa chinensis | "Continuous expansion" | Independent gene duplication events [12] |
| Fragaria vesca | "Expansion, then contraction, then further expansion" | Independent gene duplication/loss events [12] |
| Rubus occidentalis | "First expansion and then contraction" | Independent gene duplication/loss events [12] |
| Three Prunus species | "Early sharp expanding to abrupt shrinking" | Independent gene duplication/loss events [12] |
Table 2: NBS-LRR Gene Distribution and Subfamily Loss Across Plant Families
| Species | Total NBS-LRR Genes | CNL | TNL | RNL | Notable Subfamily Loss |
|---|---|---|---|---|---|
| Solanum melongena (Eggplant) | 269 | 231 | 36 | 2 | - [14] |
| Dioscorea rotundata (Yam) | 167 | 166 | 0 | 1 | TNL subclass absent [23] |
| Salvia miltiorrhiza | 196 (62 typical) | 61 | 0 | 1 | Marked reduction in TNL/RNL [19] |
| Nicotiana benthamiana | 156 | 25 CNL-type | 5 TNL-type | 4 with RPW8 domain | - [5] |
| Vernicia montana | 149 | 98 (with CC domain) | 12 (with TIR domain) | - | - [24] |
| Vernicia fordii | 90 | 49 (with CC domain) | 0 | - | Complete absence of TIR domains [24] |
Detailed Experimental Protocols
Protocol 1: Genome-Wide Identification and Evolutionary Analysis of NBS-LRR Genes
This protocol is adapted from established methods used in multiple studies [12] [23] [14].
1. Principle Identify all NBS-LRR gene candidates from a plant genome sequence using the conserved NB-ARC domain, followed by classification, structural analysis, and assessment of evolutionary patterns like tandem duplications.
2. Reagents and Equipment
- High-quality genome assembly and annotation file (GFF3/GTF)
- HMMER software suite (v.3.3.2)
- Pfam HMM profile for NB-ARC domain (PF00931)
- Software: BLAST+, MEME suite, TBtools, MEGA (for phylogeny)
- Computing infrastructure (Linux server or high-performance computing cluster)
3. Step-by-Step Procedure Step 1: Identification of Candidate Genes.
- Use
hmmsearchfrom the HMMER suite with the NB-ARC domain (PF00931) against the proteome. Set an E-value threshold (e.g., < 10⁻²⁰ or < 10⁻⁴) to retrieve initial candidates [14]. - Perform a complementary BLASTP search using a set of known NBS-LRR proteins as queries.
- Combine results and remove redundant entries.
Step 2: Domain Verification and Classification.
- Validate the presence of NBS domains in candidate proteins using Pfam and NCBI's Conserved Domain Database (CDD).
- Identify N-terminal domains (TIR, CC, RPW8) and C-terminal LRR domains using Pfam, SMART, and coiled-coil prediction tools (e.g., COILS) [14].
- Classify genes into subfamilies (TNL, CNL, RNL) and atypical types (TN, CN, NL, N) based on domain architecture [5].
Step 3: Phylogenetic and Structural Analysis.
- Perform multiple sequence alignment of the NBS domain regions using ClustalW or MAFFT.
- Construct a phylogenetic tree with the Maximum Likelihood method in MEGA software (bootstrap value: 1000) [5].
- Analyze conserved motifs within the protein sequences using the MEME suite [5].
- Visualize gene structures (exons/introns) using TBtools based on the GFF3 annotation file.
Step 4: Analysis of Evolutionary Dynamics.
- Map the genomic locations of all NBS-LRR genes using TBtools to identify clusters.
- Investigate tandem duplication events by searching for NBS-LRR genes physically clustered on chromosomes, often with high sequence similarity [23] [14].
- Analyze syntenic regions between resistant and susceptible genotypes or related species to identify gene loss events, as demonstrated in Vernicia [24].
4. Data Analysis and Interpretation
- A high density of NBS-LRR genes in specific genomic regions suggests tandem duplication clusters, a major driver for the expansion and diversification of this gene family [23] [14].
- The absence of entire subfamilies (e.g., TNLs in yam or V. fordii) indicates significant domain loss events during evolution [23] [24].
- Atypical NBS-LRR genes (lacking LRR or N-terminal domains) may function as adaptors or regulators in the resistance signaling network [5].
Protocol 2: Differential Expression Analysis of NBS-LRR Genes in Resistant vs. Susceptible Cultivars
This protocol is based on approaches used to identify R genes against pathogens like the potato cyst nematode and Fusarium wilt [24] [8].
1. Principle Identify NBS-LRR genes with significantly different expression levels between resistant and susceptible cultivars under pathogen challenge, pinpointing candidate genes for further functional validation.
2. Reagents and Equipment
- Plant Materials: Resistant and susceptible cultivars (e.g., eggplant 'R76' and 'S91' for bacterial wilt) [14].
- Pathogen Inoculum: e.g., Ralstonia solanacearum suspension (10⁸ CFU/mL) for bacterial wilt [14].
- RNA Extraction Kit (e.g., TRIzol)
- RNA-Seq Library Prep Kit or SYBR Green qRT-PCR Master Mix
- Platform: Next-Generation Sequencer or Real-Time PCR System
3. Step-by-Step Procedure Step 1: Plant Growth and Pathogen Inoculation.
- Grow resistant and susceptible plants under controlled conditions.
- At an appropriate growth stage (e.g., four-true-leaves stage for eggplant), inoculate the plants with the pathogen. Use mock-inoculated plants as controls [14].
- Collect tissue samples (e.g., roots, leaves) at multiple time points post-inoculation (e.g., 0, 24, 48 hours). Immediately freeze samples in liquid nitrogen.
Step 2: RNA Extraction and Transcriptome Sequencing.
- Extract total RNA from the frozen samples using a standard protocol (e.g., TRIzol).
- Assess RNA quality and integrity.
- Prepare RNA-Seq libraries and perform high-throughput sequencing on an Illumina platform. Alternatively, synthesize cDNA for qRT-PCR analysis.
Step 3: Bioinformatic Analysis of RNA-Seq Data.
- Process raw sequencing reads: quality control, trimming, and alignment to the reference genome.
- Quantify the expression levels (e.g., FPKM or TPM) of all genes, focusing on the previously identified NBS-LRR genes.
- Perform differential expression analysis (e.g., using DESeq2) to identify NBS-LRR genes significantly upregulated in the resistant cultivar compared to the susceptible one after inoculation.
Step 4: Quantitative RT-PCR (qRT-PCR) Validation.
- Design gene-specific primers for candidate NBS-LRR genes from the RNA-Seq analysis.
- Perform qRT-PCR on the same RNA samples to validate the expression patterns of the shortlisted candidates [14].
- Use stable reference genes (e.g., Actin, Ubiquitin) for normalization. Analyze data using the comparative Ct (2^(-ΔΔCt)) method.
4. Data Analysis and Interpretation
- NBS-LRR genes that are constitutively highly expressed in the resistant cultivar or strongly induced upon pathogen challenge are prime candidates for mediating resistance [8].
- As demonstrated in Vernicia, an orthologous NBS-LRR gene pair where the gene is upregulated in the resistant V. montana but downregulated in the susceptible V. fordii provides strong evidence for its role in resistance [24].
The Scientist's Toolkit: Research Reagent Solutions
Table 3: Essential Reagents and Resources for NBS-LRR Gene Analysis
| Reagent/Resource | Function/Application | Example Use Case |
|---|---|---|
| HMMER Suite | Identifies protein domains using hidden Markov models; crucial for initial genome-wide scan for NBS-LRR genes [12]. | Finding NBS-encoding genes with the NB-ARC (PF00931) profile [5]. |
| Pfam & SMART Databases | Provides curated protein domain families; used to verify and classify NBS, TIR, CC, RPW8, and LRR domains [23]. | Differentiating between CNL, TNL, and RNL subclasses post-identification [14]. |
| MEME Suite | Discovers conserved motifs in protein or DNA sequences; reveals conserved motif structures within NBS-LRR proteins [12]. | Identifying Kinase 1, Kinase 2, and other motifs within the NBS domain. |
| TBtools | Integrates multiple biological data analysis utilities; visualizes gene structures, chromosomal locations, and collinearity [12]. | Mapping NBS-LRR gene clusters on chromosomes to infer tandem duplications. |
| Virus-Induced Gene Silencing (VIGS) | Knocks down gene expression in plants; functional validation of candidate NBS-LRR genes [24]. | Validating the role of Vm019719 in Fusarium wilt resistance in Vernicia montana [24]. |
| R Gene-specific Molecular Markers | Tracks the presence/absence of R genes in populations; used for marker-assisted selection [8]. | Screening for known nematode resistance genes Gro1-4 and H1 in potato [8]. |
Advanced Methodologies for NBS Gene Expression Profiling and Analysis
A critical step in understanding plant disease resistance is the comparative analysis of gene expression between resistant and susceptible cultivars. Genes encoding nucleotide-binding site and leucine-rich repeat (NBS-LRR) proteins constitute the largest family of plant disease resistance (R) genes and play a vital role in effector-triggered immunity [25] [1]. This protocol provides a structured framework for selecting appropriate plant cultivar pairs and pathogen systems for investigating the differential expression of NBS-LRR genes, with application notes for designing robust experiments within a broader thesis on plant-pathogen interactions.
Selection of Cultivar Pairs
The foundation of a successful differential expression study is the selection of well-characterized cultivar pairs with clearly contrasting resistance phenotypes.
Key Criteria for Selection
- Clearly Documented Resistance Phenotypes: Cultivars should have established and consistent resistance or susceptibility to the target pathogen, verified through standardized disease scoring systems [26] [27].
- Genetic Relatedness: Ideally, cultivars should be genetically similar to minimize background genetic variation that could confound transcriptomic analyses. Isogenic lines differing only at a specific resistance locus are optimal.
- Availability of Genomic Resources: Reference genome sequences and annotations for the species significantly enhance the accuracy of RNA-seq read mapping and NBS-LRR gene identification.
Documented Cultivar Pair Examples
Table 1: Documented Cultivar Pairs for Disease Resistance Studies
| Plant Species | Resistant Cultivar | Susceptible Cultivar | Pathogen | Phenotypic Evidence |
|---|---|---|---|---|
| Chickpea (Cicer arietinum) | CDC Corinne, CDC Luna | ICCV 96029 | Ascochyta rabiei | Disease scores of 4.8-5.4 (partially resistant) vs. 8.8 (susceptible) on a 0-9 scale [26] |
| Tung Tree (Vernicia spp.) | Vernicia montana | Vernicia fordii | Fusarium wilt | Effective resistance in V. montana vs. high susceptibility in V. fordii [16] |
| Sugarcane (Saccharum spp.) | Modern hybrid cultivars | - | Multiple diseases | Higher contribution of NBS-LRR alleles from wild resistant S. spontaneum [1] |
| Cotton (Gossypium hirsutum) | Mac7 | Coker 312 | Cotton leaf curl disease (CLCuD) | Tolerant vs. highly susceptible reaction [28] |
Application Note: The chickpea-Ascochyta rabiei system is a robust model for necrotrophic fungal pathogens. The documented partial resistance in CDC Corinne and CDC Luna, characterized by delayed disease development and smaller lesions, allows for the investigation of early defense responses [26].
Selection of Pathogen Systems
The choice of pathogen should align with the research objectives and the biology of the host plant.
Pathogen Considerations
- Life History and Infection Strategy: Consider whether the pathogen is biotrophic, necrotrophic, or hemibiotrophic, as this influences the host's defense strategy and the expected timing of NBS-LRR gene expression.
- Genetic Characterization: Pathogen isolates with known Avirulence (Avr) genes are valuable for studies aiming to link specific NBS-LRR genes to effector recognition.
- Controlled Inoculation: The pathogen must be culturable and applicable in a controlled manner (e.g., spore suspension, bacterial culture) to ensure reproducible infection across biological replicates.
Representative Pathogen Systems
Table 2: Pathogen Systems for Eliciting NBS-LRR Responses
| Pathogen | Type | Host Example | Key Recognized Effector(s) | Interaction Mechanism |
|---|---|---|---|---|
| Pseudomonas syringae | Bacterium | Arabidopsis thaliana | AvrRps4, AvrRpt2, AvrPphB | Effectors detected indirectly via guardee proteins (e.g., RIN4, PBS1) [25] |
| Ascochyta rabiei | Fungus (Necrotroph) | Chickpea | Not fully characterized | Transcriptome profiling reveals differential defense gene expression [26] |
| Fusarium wilt | Fungus | Tung Tree, Cotton | Not fully characterized | Resistant and susceptible genotypes show differential NBS-LRR expression [16] [28] |
| Magnaporthe oryzae | Fungus | Rice | AVR-Pita | Direct physical binding to the LRR domain of the Pi-ta NBS-LRR protein [25] |
Application Note: The well-studied Arabidopsis thaliana-Pseudomonas syringae pathosystem is ideal for mechanistic studies due to the extensive knowledge of specific NBS-LRR and effector pairs, such as RPS4/RRS1 recognizing AvrRps4 and RPS2 guarding RIN4 against AvrRpt2 [25] [29].
Experimental Workflow and Protocol
This section outlines a standard workflow from plant growth and inoculation to RNA-seq analysis, specifically tailored for NBS-LRR gene expression studies.
Detailed Experimental Protocol
Part 1: Plant Growth and Pathogen Preparation
Plant Material Growth:
- Grow selected resistant and susceptible cultivars under controlled environmental conditions (light, temperature, humidity).
- Use a randomized block design to account for environmental variation within the growth facility.
- For Arabidopsis, 5-week-old plants are commonly used [27]. For chickpea, the flowering-to-early-podding stage is often most vulnerable [26].
Pathogen Inoculum Preparation:
- For fungi like A. rabiei, prepare a spore suspension in a sterile buffer with a defined concentration (e.g., 10⁵ spores/mL) [26].
- For bacteria like P. syringae, grow cultures to mid-log phase, centrifuge, and resuspend in a suitable buffer (e.g., 10 mM MgCl₂) to a defined OD₆₀₀ (e.g., 0.002 for ~10⁷ CFU/mL in dip inoculations) [27].
Part 2: Inoculation and Tissue Sampling
Inoculation:
- For whole-plant inoculation, use a sprayer to evenly coat aerial parts with the inoculum.
- For leaf infiltration, use a needleless syringe to pressure-infiltrate the inoculum through the stomata on the abaxial leaf surface (common for bacterial pathogens).
- Include mock-inoculated controls treated with the suspension buffer only.
Tissue Sampling for RNA-seq:
- Sample tissue at critical early time points post-inoculation (hpi) to capture the initiation of the defense response. For example, sample at 24 hpi (max spore germination), 48 hpi (penetration), and 72 hpi (necrotic lesion development) [26].
- Flash-freeze collected tissue samples in liquid nitrogen and store at -80°C until RNA extraction.
Part 3: RNA Sequencing and Bioinformatic Analysis
RNA Extraction and Library Preparation:
- Extract total RNA using a validated kit (e.g., Qiagen RNeasy Plant Mini Kit) with on-column DNase treatment to remove genomic DNA.
- Assess RNA integrity (RIN > 8.0) using an Agilent Bioanalyzer.
- Prepare stranded RNA-seq libraries for Illumina sequencing from rRNA-depleted total RNA.
Bioinformatic Analysis of NBS-LRR Genes:
- Quality Control and Mapping: Process raw reads with tools like FastQC and Trimmomatic. Map high-quality cleaned reads to the host reference genome using HISAT2 or STAR [26].
- Differential Expression Analysis: Quantify gene expression (e.g., using featureCounts and FPKM/TPM). Identify differentially expressed genes (DEGs) between resistant and susceptible cultivars at each time point using tools like DESeq2 or edgeR. A threshold of |log2FoldChange| > 1 and adjusted p-value < 0.05 is commonly applied.
- NBS-LRR Identification and Profiling:
- Create a custom NBS-LRR gene set for the host species using HMMER software to search the genome with the NB-ARC (PF00931) domain HMM profile [16] [30].
- Subclassify NBS-LRRs into TNL, CNL, and RNL based on the presence of TIR (PF01582), CC (predicted by Coiled-coil programs), and RPW8 (PF05659) domains, respectively [30].
- Extract and analyze the expression matrix of the identified NBS-LRR genes from the overall DEG list.
The following diagram illustrates the core workflow of this experimental design.
The Scientist's Toolkit: Key Research Reagents and Materials
Table 3: Essential Research Reagents and Materials for NBS-LRR Expression Studies
| Item | Function/Application | Examples/Specifications |
|---|---|---|
| Plant Cultivars | Provide contrasting genetic backgrounds for resistance comparison. | Genetically defined pairs like chickpea CDC Corinne (resistant) vs. ICCV 96029 (susceptible) [26]. |
| Pathogen Strains | To elicit the defense response; strains with known effectors are optimal. | P. syringae pv tomato DC3000 expressing AvrRps4 [29]; A. rabiei isolate AR170 [26]. |
| RNA Extraction Kit | Isolation of high-quality, intact total RNA for transcriptome studies. | Qiagen RNeasy Plant Mini Kit, with on-column DNase I digestion. |
| Library Prep Kit | Construction of sequencing-ready RNA-seq libraries. | Illumina TruSeq Stranded Total RNA Library Prep Kit with Ribo-Zero Plant for rRNA depletion. |
| HMMER Software | Bioinformatics identification of NBS-LRR genes from a genome. | Used with NB-ARC (PF00931) HMM profile to identify candidate genes [16] [30]. |
| Differential Expression Tools | Statistical analysis of gene expression from RNA-seq count data. | DESeq2, edgeR; used to find NBS-LRR genes differentially expressed between cultivars [26]. |
| Virus-Induced Gene Silencing (VIGS) System | Functional validation of candidate NBS-LRR genes in planta. | Tobacco rattle virus (TRV)-based vectors to knock down target gene expression [16] [28]. |
| qPCR Reagents | Validation of RNA-seq results for selected candidate genes. | SYBR Green or TaqMan chemistry with gene-specific primers [26]. |
Transcriptome Sequencing (RNA-seq) for Comprehensive NBS Gene Expression Profiling
Within the framework of research on the differential expression analysis of Nucleotide-Binding Site-Leucine-Rich Repeat (NBS-LRR) genes in resistant versus susceptible cultivars, Transcriptome Sequencing (RNA-seq) has emerged as a pivotal tool. NBS genes, which constitute the largest family of plant resistance (R) genes, encode intracellular receptors that are crucial for effector-triggered immunity (ETI), enabling plants to recognize specific pathogen effectors and initiate hypersensitive responses [31] [28]. The expression profiles of these genes are often dynamically regulated in response to pathogen attack, and comparing these profiles between resistant and susceptible cultivars provides key insights into the molecular mechanisms of disease resistance [32] [33] [34].
This Application Note provides a detailed protocol for employing RNA-seq to comprehensively profile NBS gene expression, specifically designed for experiments comparing resistant and susceptible plant lines. The methodology covers everything from experimental design and library preparation to bioinformatics analysis and functional validation, with a focus on generating reproducible and biologically significant data.
Key Research Reagent Solutions
The table below outlines essential reagents and tools commonly used in RNA-seq studies for plant NBS gene expression profiling, as evidenced by recent literature.
Table 1: Key Research Reagent Solutions for RNA-seq based NBS Gene Profiling
| Reagent/Tool Name | Function in Workflow | Specific Example from Literature |
|---|---|---|
| NEBNext Poly(A) mRNA Magnetic Isolation Module | Enrichment of polyadenylated mRNA from total RNA for library preparation. | Used in transcriptome studies of pueraria and clinical rare diseases [32] [35]. |
| NEBNext Ultra II Directional RNA Library Prep Kit | Construction of strand-specific cDNA libraries for sequencing on Illumina platforms. | Employed in transcriptome analyses of banana blood disease and murine macrophages [36] [34]. |
| PicoPure RNA Isolation Kit | Extraction of high-quality RNA from small quantities of tissue or sorted cells. | Utilized for RNA isolation from sorted alveolar macrophages in a murine transplant model [36]. |
| RNeasy Plant Kit | Isolation of total RNA from plant tissues, including challenging samples like roots. | Used for RNA extraction from banana root samples inoculated with Ralstonia syzygii [34]. |
| STAR (AlignER) | Spliced Transcripts Alignment to a Reference genome for fast and accurate read mapping. | Applied in the alignment of reads to a reference genome in clinical RNA-seq analyses [35]. |
| DESeq2 | Differential gene expression analysis based on a negative binomial distribution model. | Used to identify differentially expressed genes (DEGs) in banana blood disease resistance study [34]. |
| Salmon | Alignment-free, rapid quantification of transcript abundance from RNA-seq data. | Employed for transcript quantification in the banana blood disease study [34]. |
Experimental Design & Comparative Analysis
A well-designed comparative experiment is the foundation for identifying NBS genes associated with resistance. The design must account for biological replication, appropriate controls, and strategic sampling times.
Cultivar Selection and Pathogen Inoculation
The core of the design involves selecting well-characterized resistant and susceptible cultivars and a defined pathogen inoculation protocol.
- Cultivar Phenotyping: Resistant and susceptible cultivars should be definitively identified prior to transcriptomic analysis. For example, in a study on pueraria pseudo-rust resistance, the resistant cultivar 'GUIGE18' (average disease index 0.04) was compared to the susceptible 'GUIGE8' (average disease index 31.98) [32]. Similarly, in tomato bacterial spot research, the resistant line 'PI 114490' was contrasted with the susceptible line 'OH 88119' [33].
- Pathogen Challenge: Inoculation methods should mimic natural infection. For the tomato-Xanthomonas pathosystem, plants were spray-inoculated with a bacterial suspension (∼3x10⁸ CFU/mL) containing a surfactant (0.025% Silwet L77) to ensure adequate leaf coverage [33]. For banana blood disease, a root wounding inoculation method with Ralstonia syzygii (10⁸ CFU/mL) was employed [34].
- Time-Course Sampling: Capturing the early and sustained immune response is critical. Sampling should include a baseline (0 hours post-inoculation, hpi) and multiple time points post-inoculation. The pueraria study sampled at 0, 1, and 3 days post-inoculation (dpi) [32], while the banana study collected samples at 12 hours, 1 day, and 7 days post-inoculation to capture both immediate and later responses [34].
The following table synthesizes key parameters from published studies for guidance.
Table 2: Summary of Experimental Parameters from Comparative Transcriptome Studies
| Parameter | Pueraria - Pseudo-rust [32] | Tomato - Bacterial Spot [33] | Banana - Blood Disease [34] |
|---|---|---|---|
| Resistant Cultivar | GUIGE18 | PI 114490 | Khai Pra Ta Bong |
| Susceptible Cultivar | GUIGE8 | OH 88119 | Hin |
| Inoculation Method | Not Specified | Spray-inoculation | Root wounding + pouring |
| Pathogen Concentration | Not Specified | ~3 × 10⁸ CFU/mL | 10⁸ CFU/mL |
| Sampling Time Points | 0, 1, 3 dpi | 6 hpi, 6 dpi | 12 hpi, 1 dpi, 7 dpi |
| Tissue Sampled | Leaves | Leaves | Roots |
| Key Finding | More DEGs in resistant cultivar; NBS genes upregulated. | More DEGs in resistant cultivar at later time point; Defense pathways enriched. | Key defense genes upregulated early (12 hpi) in resistant cultivar. |
Detailed Wet-Lab Protocol
RNA Isolation and Quality Control
High-quality, intact RNA is non-negotiable for a successful RNA-seq experiment.
- Tissue Harvesting: Flash-freeze tissue samples (e.g., 100 mg of leaf or root) in liquid nitrogen and store at -80°C.
- RNA Extraction: Use kits designed for plant tissues, such as the RNeasy Plant Kit, which effectively handles polysaccharides and phenolic compounds. Follow the manufacturer's protocol, including an on-column DNase I digestion step to remove genomic DNA contamination [34].
- Quality Control: Assess RNA concentration using a spectrophotometer (e.g., NanoDrop). Evaluate RNA integrity using an Agilent Bioanalyzer or TapeStation; an RNA Integrity Number (RIN) > 7.0 is generally recommended [36] [35]. High-quality RNA will show distinct ribosomal RNA peaks and no significant degradation.
Library Preparation and Sequencing
This protocol is based on the widely used NEBNext kit series.
- mRNA Enrichment: From 100 ng - 1 µg of total RNA, isolate mRNA using the NEBNext Poly(A) mRNA Magnetic Isolation Module, which selectively binds to poly-A tails [36] [35].
- Library Construction: Construct sequencing libraries using the NEBNext Ultra II Directional RNA Library Prep Kit for Illumina. This protocol includes cDNA synthesis, end repair, dA-tailing, adapter ligation, and library amplification to create strand-specific libraries [35].
- Library QC and Sequencing: Quantify the final library using qPCR (e.g., KAPA Library Quantification Kit). Assess size distribution with a TapeStation D1000 High Sensitivity Screen. Sequence the libraries on an Illumina platform (e.g., NovaSeq 6000) to generate a minimum of 20-30 million paired-end (e.g., 150 bp) reads per sample to ensure sufficient coverage for differential expression analysis [35] [34].
Bioinformatics Analysis Workflow
Pre-processing and Alignment/Quantification
- Quality Control and Trimming: Use
FastQCfor initial quality assessment of raw sequencing reads. Then, use a tool likefastpto perform adapter trimming, quality filtering, and polyG tail removal (common in NovaSeq data) [35]. - Alignment to Reference Genome:
- If a high-quality reference genome is available, use the STAR aligner in two-pass mode for sensitive splice junction detection. This generates a BAM file of aligned reads [35].
- Alternatively, for NBS gene focus: Consider using
Salmonin alignment-free mode for transcript quantification. This is often faster and can be more accurate, especially for genes with multiple isoforms [34].
Differential Expression and NBS Gene Identification
- Read Count Generation: For alignment-based methods, use
featureCountsorHTSeqto generate a raw count matrix, counting reads that overlap with gene features [36]. - Differential Expression Analysis: Input the raw count matrix into
DESeq2in R. Perform analysis by comparing conditions (e.g., Resistant6hpi vs Susceptible6hpi). Identify Differentially Expressed Genes (DEGs) using an adjusted p-value (FDR) threshold of < 0.05 and a |log2FoldChange| > 1 [34]. - NBS Gene Identification and Profiling:
- HMMER Search: Extract the protein sequences from the genome annotation. Use
hmmsearchfrom the HMMER suite with the NB-ARC domain (Pfam: PF00931) profile (E-value < 1e-50) to identify all putative NBS-encoding genes [31] [28] [30]. - Subclassification: Use the NCBI Conserved Domain Database (CDD) and tools like
coiledcoilto classify identified NBS genes into subfamilies (TNL, CNL, RNL) based on their N-terminal domains (TIR, CC, RPW8) [31] [30]. - Expression Profiling: Extract the normalized expression values (e.g., TPM or counts from
DESeq2) for the identified NBS genes. Create a heatmap to visualize their expression patterns across your experimental conditions, highlighting those significantly upregulated in the resistant cultivar post-inoculation.
- HMMER Search: Extract the protein sequences from the genome annotation. Use
Validation and Functional Characterization
qRT-PCR Validation
Confirm the RNA-seq expression patterns of selected candidate NBS genes using quantitative real-time PCR (qRT-PCR).
- cDNA Synthesis: Synthesize cDNA from the same RNA samples used for RNA-seq using a reverse transcription kit (e.g., Superscript II Reverse Transcriptase) with oligo(dT) or random hexamer primers [32].
- qPCR Amplification: Design gene-specific primers for target NBS genes. Perform qPCR reactions in triplicate using a SYBR Green master mix on a real-time PCR instrument. Include reference genes (e.g., Actin, Ubiquitin) that are stable across your experimental conditions for normalization.
- Data Analysis: Calculate relative gene expression using the 2^(-ΔΔCt) method. The expression trends from qRT-PCR should correlate significantly with the RNA-seq data, validating the sequencing results [32] [31].
Functional Validation via VIGS
To establish a direct causal link between a candidate NBS gene and resistance, functional validation is essential. Virus-Induced Gene Silencing (VIGS) is a powerful technique for this purpose.
- Vector Construction: Clone a ~200-300 bp fragment of the target NBS gene into a VIGS vector (e.g., TRV-based pYL156).
- Plant Inoculation: Inoculate resistant plants with Agrobacterium tumefaciens carrying the VIGS construct. Include control plants inoculated with an empty vector.
- Phenotyping: After confirming gene silencing, challenge the plants with the pathogen. A loss of resistance (i.e., increased disease symptoms) in the silenced plants, but not in the controls, demonstrates the functional role of the NBS gene in resistance. This approach has been successfully used to validate the role of an NBS gene in cotton leaf curl disease resistance [28].
Bioinformatics Pipelines for NBS Gene Identification and Annotation
Nucleotide-binding site-leucine-rich repeat (NBS-LRR) genes represent the largest family of plant disease resistance (R) genes, playing crucial roles in effector-triggered immunity (ETI) by recognizing pathogen effectors and activating robust defense responses [19] [37]. With the rapid advancement of sequencing technologies, bioinformatics approaches have become indispensable for genome-wide identification, annotation, and evolutionary analysis of NBS genes. This protocol details comprehensive bioinformatics pipelines for NBS gene identification and annotation, framed within the context of differential expression analysis of NBS genes in resistant versus susceptible cultivars. The methodologies outlined here integrate recent findings from multiple plant species, including grass pea, Salvia miltiorrhiza, and Dendrobium officinale, providing researchers with standardized workflows for comparative analysis of R-gene repertoires and their expression patterns under pathogen stress [31] [19] [38].
Computational Workflow for NBS Gene Identification
Data Retrieval and Preparation
The initial step involves acquiring high-quality genomic and transcriptomic data. For the grass pea study, genomic data for genotype LS007 was retrieved from NCBI with specific parameters: genome size of 8.12 Gbp, 60X coverage, and N50 of 59,728 bp [31]. Transcriptomic sequences totaling 103.3 Mbp were obtained from NCBI BioProject PRJNA258356 to augment genomic annotations.
Essential Tools and Databases:
- NCBI Genome Database: Primary source for genomic sequences
- NCBI BioProject: Repository for transcriptomic datasets
- Local data management: Secure storage and organization of large datasets
Sequence Similarity Searches
Initial identification of potential NBS-LRR genes employs sequence similarity approaches. In the grass pea study, researchers used Local TBLASTN with a sequence similarity threshold of 90% and a sequence length of 600 nucleotides against previously characterized NBS-LRR genes from chickpea, apple, and Brassica napus [31].
Key Parameters:
- E-value cutoff: Typically 1e-5 for initial screening
- Sequence coverage: >70% for candidate identification
- Reference dataset: Curated NBS-LRR sequences from related species
Domain Identification and Verification
Candidate sequences must be verified for the presence of characteristic NBS domains. The following workflow ensures comprehensive domain identification:
Table 1: Domain Identification Tools and Parameters
| Tool | Version | Function | Key Parameters |
|---|---|---|---|
| TransDecoder | v5.5.0 | Predicts coding regions | Minimum protein length: 100 amino acids |
| HMMER/hmmsearch | v3.1b2 | Domain identification using HMM | HMM profile: Pfam00931 (NBS domain) |
| NCBI-CDD | - | Conserved domain verification | Default parameters with manual curation |
| AUGUSTUS | v3.3 | Gene structure prediction | Species-specific training parameters |
For Salvia miltiorrhiza, researchers identified 196 genes containing the NBS domain, accounting for 0.42% of all annotated protein-coding genes. Among these, only 62 were predicted as typical NLR proteins with complete N-terminal and LRR domains [19].
Classification and Phylogenetic Analysis
NBS proteins are classified based on their N-terminal domains into distinct subfamilies: CNL (CC-NBS-LRR), TNL (TIR-NBS-LRR), and RNL (RPW8-NBS-LRR). The following workflow illustrates the classification process:
In the Dendrobium study, researchers identified 655 NBS genes across six orchid species and Arabidopsis thaliana. Phylogenetic analysis revealed significant degeneration of TNL-type genes in monocots, with no TNL-type genes identified in any of the six examined orchid species [38].
Table 2: NBS-LRR Gene Distribution Across Plant Species
| Plant Species | Total NBS Genes | CNL-Type | TNL-Type | RNL-Type | Atypical |
|---|---|---|---|---|---|
| Arabidopsis thaliana | 210 | 40 | 121 | 12 | 37 |
| Dendrobium officinale | 74 | 10 | 0 | 2 | 62 |
| Salvia miltiorrhiza | 196 | 61 | 0 | 1 | 134 |
| Grass pea (Lathyrus sativus) | 274 | 150 | 124 | - | - |
| Dendrobium nobile | 169 | 18 | 0 | 4 | 147 |
Differential Expression Analysis of NBS Genes
Experimental Design for Resistant vs Susceptible Cultivars
Differential expression analysis requires carefully designed experiments comparing resistant and susceptible genotypes under pathogen challenge. Key considerations include:
Time-course experiments: Multiple time points post-inoculation to capture dynamic expression changes. In the rice-Xoc study, researchers analyzed transcriptomes at 12, 24, and 48 hours post-inoculation (hpi) [39].
Replication: Biological and technical replicates to ensure statistical robustness. The strawberry-Colletotrichum study included three biological replicates per time point and treatment [37].
Control conditions: Mock-inoculated plants for baseline expression comparison.
RNA Sequencing and Quality Control
The soybean cyst nematode resistance study provides an exemplary workflow for RNA-seq analysis:
Library Preparation and Sequencing:
- RNA extraction from root tissues of resistant (S54) and susceptible (S67) wild soybean genotypes
- Illumina sequencing generating 244.6 million raw reads across twelve libraries
- Quality control yielding 99.2% to 99.6% high-quality reads per library [40]
Read Mapping and Quantification:
- Alignment to reference genome using TopHat (85.5% to 93.0% mapping efficiency)
- Gene expression quantification with Cufflinks
- Identification of differentially expressed genes (DEGs) using appropriate statistical thresholds (FDR < 0.05, log2FC > 1)
In the resistant wild soybean genotype, 2,290 DEGs were identified upon SCN infection, compared to only 555 DEGs in the susceptible genotype, highlighting the more extensive transcriptional reprogramming in resistant plants [40].
Expression Analysis of NBS-LRR Genes
The following workflow outlines the process for NBS-specific expression analysis:
In the Dendrobium officinale study, salicylic acid treatment identified 1,677 DEGs, with six NBS-LRR genes significantly up-regulated. Weighted Gene Co-expression Network Analysis (WGCNA) revealed that one key NBS-LRR gene (Dof020138) was closely associated with pathogen recognition pathways, MAPK signaling, plant hormone signal transduction, and energy metabolism pathways [38].
Functional Annotation and Enrichment Analysis
DEGs should be subjected to comprehensive functional annotation:
Gene Ontology (GO) Enrichment: Identify overrepresented biological processes, molecular functions, and cellular components. In the soybean study, GO terms included "plant responses to abiotic stress," "biotic stress," "hormone signaling," and "metabolic processes" [40].
KEGG Pathway Analysis: Map DEGs to known metabolic and signaling pathways. The rice BLS resistance study revealed enrichment in lignin biosynthesis, diterpenoid phytoalexin production, and jasmonic acid/salicylic acid signaling pathways [39].
Promoter Analysis: Identify cis-regulatory elements in NBS gene promoters. In S. miltiorrhiza, promoter analysis demonstrated abundant cis-acting elements related to plant hormones and abiotic stress [19].
Table 3: Key Research Reagent Solutions for NBS Gene Analysis
| Reagent/Resource | Function | Example/Specification |
|---|---|---|
| Genomic DNA Extraction Kits | High-molecular-weight DNA isolation for genome sequencing | CTAB-based methods, commercial kits (e.g., Qiagen DNeasy) |
| RNA Isolation Reagents | High-quality RNA extraction for transcriptome studies | TRIzol reagent, RNA stabilization solutions |
| Library Prep Kits | RNA/DNA library preparation for sequencing | Illumina TruSeq, NEBNext Ultra II DNA |
| Domain Databases | Identification and verification of NBS domains | Pfam (PF00931), NCBI-CDD, SMART |
| Reference Sequences | Curated NBS-LRR sequences for comparative analysis | RGA database, PlantRGD |
| Multiple Alignment Tools | Phylogenetic and evolutionary analysis | MUSCLE, MAFFT, Clustal Omega |
| Phylogenetic Software | Evolutionary relationship reconstruction | RAxML, MrBayes, IQ-TREE |
| Expression Analysis Tools | Differential expression quantification | DESeq2, edgeR, Cufflinks |
| Pathway Databases | Functional annotation and pathway mapping | KEGG, GO, PlantCyc |
| qPCR Reagents | Experimental validation of expression patterns | SYBR Green master mixes, reverse transcription kits |
Protocol for Integrated NBS Gene Identification and Expression Analysis
Comprehensive Workflow
This protocol integrates identification and expression analysis phases:
Phase I: Identification and Annotation (Steps 1-7)
- Genome assembly assessment and quality control
- TBLASTN search with known NBS-LRR sequences
- HMMER search with PF00931 profile
- Domain architecture verification with NCBI-CDD
- Gene structure prediction with AUGUSTUS
- Multiple sequence alignment with MUSCLE
- Phylogenetic classification with RAxML
Phase II: Expression Analysis (Steps 8-12)
- RNA sequencing of resistant/susceptible cultivars under pathogen challenge
- Quality control with FastQC and read alignment with STAR
- Read counting with featureCounts
- Differential expression analysis with DESeq2
- Functional enrichment with clusterProfiler
Quality Control Metrics
Critical quality checkpoints throughout the pipeline:
- Genome assembly: N50 > 50 kb, complete BUSCO scores > 90%
- RNA-seq: Q30 > 85%, rRNA contamination < 5%
- Alignment rates: >80% uniquely mapped reads
- Differential expression: FDR correction, independent biological replicates
Validation Methods
Experimental Validation:
- Quantitative PCR (qPCR) for key NBS-LRR genes
- Reverse transcription PCR for alternative splicing detection
- Western blotting for protein-level confirmation when antibodies available
In silico Validation:
- Cross-reference with published expression atlases
- Co-expression network analysis
- Promoter motif conservation analysis
This bioinformatics pipeline provides a comprehensive framework for NBS gene identification, annotation, and expression analysis in the context of disease resistance. The integration of genomic and transcriptomic approaches enables researchers to identify key R-genes contributing to resistant phenotypes and understand their regulation under pathogen stress. As sequencing technologies continue to advance, these protocols will facilitate the discovery of novel NBS-LRR genes with potential applications in crop improvement and sustainable agriculture.
Differential expression analysis (DEA) is a cornerstone of modern molecular biology, enabling researchers to identify genes with significant expression changes between biological conditions. In the context of plant-pathogen interactions, DEA provides crucial insights into the molecular mechanisms of disease resistance. For studies focusing on Nucleotide-Binding Site Leucine-Rich Repeat (NBS-LRR) genes—the largest class of plant disease resistance (R) proteins—rigorous statistical frameworks and appropriate significance thresholds are particularly vital. These genes mediate effector-triggered immunity (ETI), often conferring race-specific resistance in a gene-for-gene manner [41] [19]. The complex nature of plant immune responses, combined with technical variability in transcriptome profiling, necessitates careful experimental design and statistical analysis to reliably distinguish true biological signals from noise. This application note outlines established protocols and statistical considerations for DEA of NBS genes in resistant versus susceptible cultivars, providing a framework for robust identification of candidate resistance genes.
Statistical Frameworks for Differential Expression Analysis
Foundational Models and Assumptions
Most statistical methods for RNA-seq differential expression analysis are based on the negative binomial distribution, which effectively models count data with over-dispersion—a common characteristic of sequencing data where variance exceeds the mean [42]. This distribution accounts for both technical variability from the sequencing process and biological variability between replicates. Tools implementing this model include DESeq2 and edgeR, which have become standards in the field [42]. These frameworks test the null hypothesis that a gene's expression level does not differ significantly between experimental conditions (e.g., resistant vs. susceptible cultivars) after proper normalization.
Normalization Techniques
Normalization is a critical preprocessing step that removes systematic technical biases to enable valid comparisons between samples. The table below summarizes common normalization methods and their appropriate use cases:
Table 1: RNA-Seq Normalization Methods
| Method | Sequencing Depth Correction | Gene Length Correction | Library Composition Correction | Suitable for DE Analysis | Key Characteristics |
|---|---|---|---|---|---|
| CPM | Yes | No | No | No | Simple scaling by total reads; biased by highly expressed genes. |
| RPKM/FPKM | Yes | Yes | No | No | Enables within-sample comparison; not for cross-sample DE. |
| TPM | Yes | Yes | Partial | No | Improves on RPKM/FPKM for cross-sample comparison. |
| Median-of-Ratios (DESeq2) | Yes | No | Yes | Yes | Robust to composition bias; uses a geometric mean-based pseudo-reference. |
| TMM (edgeR) | Yes | No | Yes | Yes | Trims extreme genes to minimize composition effects. |
For differential expression analysis, median-of-ratios (DESeq2) and TMM (edgeR) are generally recommended as they account for library composition differences that can arise when a few genes are extremely highly expressed in one condition [42].
Significance Thresholds and Multiple Testing Correction
In a standard DEA, expression levels of thousands of genes are tested simultaneously. This multiple testing problem greatly increases the likelihood of false positives. For instance, using a nominal p-value threshold of 0.05 when testing 20,000 genes would yield approximately 1,000 false positive genes by chance alone. To address this, False Discovery Rate (FDR) control methods such as the Benjamini-Hochberg procedure are widely applied [42]. The FDR represents the expected proportion of false positives among all genes declared significant.
A common practice is to set an FDR threshold of 0.05 or 0.01, providing a balance between discovery and false positive control. However, the choice of threshold involves a trade-off between sensitivity (power to detect true differences) and specificity (avoiding false positives), and should be guided by the research goals. Exploratory studies might use a more lenient threshold (e.g., FDR < 0.1), while validation-focused studies require stricter thresholds (e.g., FDR < 0.01). Additionally, applying a minimum fold-change threshold (e.g., ≥ 2-fold) alongside significance filters can help prioritize biologically meaningful changes [42].
Experimental Design for NBS Gene Studies
Replication and Sequencing Depth
A well-designed experiment is the foundation of reliable differential expression results. Key considerations include:
- Biological Replicates: These are essential for capturing natural biological variation within a population or treatment group. While three replicates per condition is often considered a minimum, higher variability may necessitate more replicates (e.g., 5-6) to achieve sufficient statistical power [42].
- Sequencing Depth: For standard differential expression analyses in plants, 20-30 million reads per sample is often sufficient, though this may vary with genome size and complexity [42].
Case Study: Wheat-Leaf Rust Interaction
A study on wheat-leaf rust interaction provides a exemplary model for NBS gene research. Researchers used near-isogenic wheat lines (NILs) differing only in the Lr10 leaf rust resistance gene (susceptible Thatcher vs. resistant ThatcherLr10) [41]. This powerful design minimizes background genetic noise, allowing focused analysis of the gene's effects. Key experimental steps included:
- Plant Growth and Infection: Seedlings were grown under controlled conditions (16h light/20°C, 8h dark/16°C, 70-80% humidity) and infected at 10 days old with an avirulent leaf rust race.
- Sample Collection: Tissue was collected at multiple time points post-inoculation (0, 8, 16, 20, 48 hours) to capture dynamic expression changes [41].
- Library Construction: Two cDNA libraries were constructed from RNA extracted 20 hours after infection, enabling comparative EST analysis [41].
This careful design enabled the identification of differentially expressed genes, including a 14-3-3 protein and an actin-depolymerization factor in the resistant line, which were validated via RT-PCR [41].
Analytical Workflow and Visualization
A robust DEA workflow extends beyond statistical testing to include quality control and visualization, which are critical for detecting potential issues and interpreting results.
Comprehensive Workflow Diagram
The following diagram illustrates the key stages of a differential expression analysis, from raw data to biological insight:
Visualization for Quality Assessment
Effective visualization methods are indispensable for verifying analysis quality and interpreting results:
- Parallel Coordinate Plots: These display each gene as a line connecting its expression values across samples. In ideal data, replicates show flat, clustered lines, while distinct patterns emerge between treatment groups, visually confirming differential expression [43].
- Scatterplot Matrices: These plot read count distributions across all samples, allowing researchers to confirm that variability between treatments exceeds variability between replicates [43].
Interactive versions of these plots enable researchers to identify outliers, detect normalization issues, and select genes of interest for further investigation.
The Scientist's Toolkit: Research Reagent Solutions
Table 2: Essential Reagents and Tools for NBS Gene DEA Studies
| Category/Item | Specific Examples | Function/Application in DEA |
|---|---|---|
| RNA Extraction Kits | Plant-specific RNA isolation kits | Obtain high-quality, intact RNA from resistant/susceptible plant tissues. |
| Library Prep Kits | Stranded mRNA-seq kits | Convert RNA to sequenceable cDNA libraries; maintain strand information. |
| Sequencing Platforms | Illumina NovaSeq, NextSeq | Generate high-throughput transcriptome data (20-30M reads/sample). |
| Alignment Software | STAR, HISAT2 | Map sequencing reads to a reference genome. |
| Pseudoalignment Tools | Salmon, Kallisto | Rapid transcript quantification without full alignment. |
| DEA Software | DESeq2, edgeR | Perform statistical testing for differential expression. |
| Validation Reagents | qPCR master mixes, gene-specific primers | Confirm RNA-seq results for key NBS-LRR genes. |
Signaling Pathways in NBS-LRR Mediated Immunity
Plant immunity involving NBS-LRR genes operates through a complex signaling network. The following diagram summarizes the key molecular pathways in effector-triggered immunity:
This pathway illustrates how NBS-LRR proteins (e.g., Sr6, Sr13) recognize pathogen effectors and activate downstream defense responses through multiple signaling components, culminating in the hypersensitive response and expression of pathogenesis-related (PR) genes [19] [44].
Robust differential expression analysis of NBS genes requires careful integration of experimental design, appropriate statistical frameworks, and rigorous validation. The protocols outlined here provide a foundation for identifying candidate resistance genes with greater confidence. As plant immunity research advances, particularly with the growing availability of medicinal and crop genome sequences [19], these methodologies will enable deeper exploration of NBS-LRR gene families and their roles in pathogen defense. By adhering to these best practices in statistical testing and significance thresholding, researchers can generate more reliable data to support the development of disease-resistant crop varieties through both traditional breeding and modern biotechnological approaches.
The integration of multi-omics data represents a transformative approach for unraveling the complex molecular interactions that underpin disease resistance in plants. This is particularly relevant for understanding the role of nucleotide-binding site and leucine-rich repeat (NBS-LRR) genes, which constitute the largest family of plant disease resistance (R) genes [34]. These genes are crucial components of effector-triggered immunity (ETI), providing specific recognition of pathogen effectors and activating robust defense responses [39]. However, characterizing the functional mechanisms of NBS-LRR genes remains challenging due to their genetic complexity and dynamic expression patterns.
Multi-omics approaches enable researchers to move beyond single-layer analyses by simultaneously exploring genomic, transcriptomic, epigenomic, and proteomic data layers. This integration provides unprecedented insights into how genetic variations in NBS genes translate into regulatory networks that determine resistance outcomes. As demonstrated in recent studies of banana blood disease and rice bacterial leaf streak, transcriptome analysis of resistant versus susceptible cultivars can reveal key defense genes and regulatory pathways activated during pathogen infection [34] [39]. These approaches are revolutionizing plant pathology research by connecting mutation profiles to functional expression networks, ultimately accelerating the development of disease-resistant crop varieties through molecular breeding.
Key Concepts and Biological Significance
NBS-LRR Genes in Plant Immunity
NBS-LRR proteins represent a critical class of intracellular immune receptors that directly or indirectly recognize pathogen effector proteins, triggering robust defense responses [34]. These genes are categorized into five functional classes with distinct recognition mechanisms: detoxifying enzymes, intracellular kinases, intracellular and cell-surface receptors, and receptor kinases [34]. The N gene in tobacco, for instance, shares a conserved TIR domain with innate immune receptors in animals, highlighting evolutionary parallels across kingdoms [34].
In resistant cultivars, NBS-LRR genes activate effector-triggered immunity (ETI), which is characterized by a hypersensitive response (HR) and programmed cell death at infection sites, effectively limiting pathogen spread [39]. This rapid and highly specific immune response is often accompanied by the accumulation of antimicrobial compounds, changes in hormone signaling, and reinforcement of structural barriers [39]. Understanding the differential expression and regulation of these genes between resistant and susceptible cultivars provides crucial insights for developing broad-spectrum disease resistance in crops.
Multi-Omics Integration Framework
Multi-omics integration involves combining data from multiple molecular layers to construct comprehensive networks that capture the flow of genetic information from DNA to RNA to proteins and metabolites. This approach directly addresses the limitations of single-omic studies that offer only partial understanding of complex biological systems [45]. In the context of plant-pathogen interactions, multi-omics enables researchers to connect genotypic variations in NBS genes to phenotypic resistance outcomes through analysis of transcriptomic dynamics, protein interactions, and metabolic reprogramming.
Advanced computational methods like MINIE (Multi-omIc Network Inference from timE-series data) have been developed specifically to infer regulatory networks from multi-omic time-series data [45]. These approaches can model the timescale separation between molecular layers—for instance, the rapid turnover of metabolites (minutes) versus the slower dynamics of mRNA (hours)—using sophisticated mathematical frameworks such as differential-algebraic equations (DAEs) [45]. This capability is essential for accurately reconstructing the causal relationships between NBS gene expression and downstream defense responses.
Experimental Protocols
Plant Material Preparation and Pathogen Inoculation
Materials:
- Resistant and susceptible cultivars (e.g., 'Khai Pra Ta Bong' (AAA genome, resistant) and 'Hin' (ABB genome, susceptible) for banana blood disease research) [34]
- Tissue culture equipment for plantlet multiplication
- Pathogen strain (e.g., Ralstonia syzygii subsp. celebesensis isolate MY4101 for banana; Xanthomonas oryzae pv. oryzicola strain gx01 for rice) [34] [39]
- CPG medium for bacterial culture
- Controlled environment greenhouse
Procedure:
- Multiply plantlets using tissue culture techniques under sterile conditions [34].
- Transplant plantlets to pots and maintain in a controlled environment greenhouse until reaching appropriate age (e.g., 20 days for banana) [34].
- Prepare bacterial inoculum by culturing pathogens in appropriate medium (e.g., CPG at 28°C for 3 days) and adjusting concentration to 10⁸ colony-forming units per milliliter (CFU/mL) [34].
- Water plants one day prior to inoculation.
- For root inoculation, use a sterile cutter to create wounds near roots (approximately 2 cm from base, 5 cm depth) [34].
- Apply 10 mL of inoculum per plant around the wounded root area; for mock inoculation controls, apply sterile water instead.
- Maintain inoculated plants under controlled conditions and monitor disease symptoms, severity scores, and disease index over a 14-day period [34].
RNA Extraction and Sequencing
Materials:
- RNase-free mortar and pestle
- Liquid nitrogen
- RNeasy Plant Kit (QIAGEN) or equivalent
- NanoDrop Lite spectrophotometer (Thermo Fisher Scientific) or equivalent
- Equipment for gel electrophoresis
- NovaSeq 6000 system (Illumina) or equivalent sequencing platform
Procedure:
- Collect tissue samples (e.g., roots, leaves) at multiple time points post-inoculation (e.g., 12 h, 24 h, 7 days) with appropriate biological replicates (minimum n=3 per group) [34].
- Flash-freeze samples in liquid nitrogen and store at -80°C until RNA extraction.
- Grind 0.1 g frozen tissue to a fine powder in liquid nitrogen using mortar and pestle.
- Transfer powder to 1.5-mL tube, add 450 µL RLT buffer, and vortex immediately.
- Transfer mixture to QIA shredder spin column and centrifuge at 8000 g for 2 minutes at room temperature.
- Transfer supernatant to new tube, add half volume of 96% ethanol, mix, and transfer to new spin column.
- Centrifuge at 8000 g for 15 seconds, discard flow-through.
- Add 700 µL RW1 buffer, centrifuge at 8000 g for 15 seconds, discard flow-through.
- Add 500 µL RPE buffer, centrifuge at 8000 g for 15 seconds, discard flow-through.
- Add 50 µL RNase-free water to column and centrifuge at 8000 g for 15 seconds to elute RNA.
- Assess RNA purity and concentration using NanoDrop spectrophotometer and confirm integrity by gel electrophoresis.
- Prepare RNA libraries and sequence using Illumina NovaSeq 6000 system or equivalent platform to generate approximately 6 GB data per sample with quality score Q30 > 80% [34].
Transcriptome Data Analysis Pipeline
Computational Tools:
- MultiQC for quality assessment report generation [34]
- Fastqc for initial quality control [34]
- Salmon (version 1.9.0) for alignment-free transcript quantification [34]
- DESeq2 (version 1.42.0) in R (version 4.2.1) for differential expression analysis [34]
- Reference transcriptome: M. acuminata DH Pahang (version 4.3) from banana genome hub or relevant species-specific database [34]
Procedure:
- Perform quality control on raw sequencing data using Fastqc and aggregate reports with MultiQC.
- Index reference transcriptome and quantify transcripts using Salmon with alignment-free algorithm.
- Import quantification data into R environment and perform differential expression analysis with DESeq2.
- Identify differentially expressed genes (DEGs) using threshold of |log₂ fold change| > 1 and Benjamini-Hochberg adjusted p-value ≤ 0.05 [34].
- Visualize results using MA plots and volcano plots.
- Annotate single-copy predicted genes in each DEG set using BLASTP hits to NCBI RefSeq plant protein database.
- Perform Gene Ontology (GO) enrichment analysis and pathway analysis to identify biological processes, molecular functions, and pathways significantly enriched in DEGs.
Multi-Omic Network Inference with MINIE
Computational Requirements:
- MINIE software package for multi-omic network inference [45]
- Time-series transcriptomic and metabolomic data
- Curated prior knowledge network of molecular interactions
Procedure:
- Format input data as time-series measurements of both transcriptomic (preferably single-cell RNA-seq) and metabolomic (typically bulk) data [45].
- Incorporate timescale separation across omic layers using a model of differential-algebraic equations (DAEs), with slow transcriptomic dynamics captured by differential equations and fast metabolic dynamics encoded as algebraic constraints [45].
- Perform transcriptome-metabolome mapping inference using the algebraic component, approximating metabolic dynamics as linear functions to infer gene-metabolite and metabolite-metabolite interaction matrices [45].
- Conduct regulatory network inference via Bayesian regression to identify causal interactions both within and across omic layers [45].
- Constrain nonzero elements in interaction matrices using curated lists of known metabolic reactions documented in literature to address high-dimensionality limitations [45].
- Validate inferred networks using both synthetic datasets and experimental data from relevant disease models.
Data Presentation
Quantitative Analysis of Differential Expression
Table 1: Temporal Dynamics of Differentially Expressed Genes (DEGs) in Resistant vs. Susceptible Cultivars
| Time Point | Total DEGs | Upregulated | Downregulated | Key Enriched Pathways | Significant NBS-LRR Genes |
|---|---|---|---|---|---|
| 12 hpi | 218 [39] | 142 [39] | 76 [39] | Lignin biosynthesis, Flagellin recognition, Wound healing [39] | 5 [39] |
| 24 hpi | 170 [39] | 115 [39] | 55 [39] | Diterpenoid phytoalexins, JA/SA signaling, HSP90B, PR1 [39] | 3 [39] |
| 48 hpi | 329 [39] | 202 [39] | 127 [39] | Monoterpene synthesis, Isoquinoline alkaloids, Cell wall reinforcement [39] | 8 [39] |
| 7 dpi | 412 [34] | 278 [34] | 134 [34] | Xyloglucan metabolism, Receptor-like kinase signaling, Glycine-rich proteins [34] | 12 [34] |
Table 2: Key Defense Mechanisms Activated in Resistant Cultivars
| Defense Mechanism | Key Molecular Players | Onset Timing | Omics Layer | Functional Significance |
|---|---|---|---|---|
| Structural Barrier Formation | Lignin biosynthesis genes, Cell wall proteins | 12 hpi [39] | Transcriptomic | Prevents pathogen penetration and spread [39] |
| Pathogen Recognition | Receptor-like kinases (RLKs), Receptor-like proteins (RLPs) | 12 hpi [39] | Transcriptomic | Recognizes PAMPs and initiates PTI [39] |
| Phytoalexin Production | Diterpenoid biosynthesis genes, Monoterpene synthases | 24-48 hpi [39] | Transcriptomic, Metabolomic | Antimicrobial activity directly inhibits pathogen growth [39] |
| Hormone Signaling | JA and SA biosynthesis genes, Signaling regulators | 24 hpi [39] | Transcriptomic, Metabolomic | Coordinates defense response timing and amplitude [39] |
| ETI Activation | NBS-LRR genes, Disease resistance proteins | 12-48 hpi [34] [39] | Genomic, Transcriptomic | Specific recognition of pathogen effectors triggers hypersensitive response [34] [39] |
Research Reagent Solutions
Table 3: Essential Research Reagents for Multi-Omics Studies of NBS Genes
| Reagent/Resource | Specification | Application | Function |
|---|---|---|---|
| RNeasy Plant Kit | QIAGEN | RNA extraction | High-quality total RNA isolation from plant tissues [34] |
| NovaSeq 6000 System | Illumina | RNA sequencing | High-throughput transcriptome profiling [34] |
| CPG Medium | Standard formulation | Pathogen culture | Optimal growth of Ralstonia and Xanthomonas species [34] |
| DESeq2 | Version 1.42.0 | Differential expression analysis | Statistical analysis of RNA-seq count data [34] |
| MINIE | Latest version | Multi-omic network inference | Bayesian regression framework integrating transcriptomic and metabolomic data [45] |
| M. acuminata DH Pahang v4.3 | Banana Genome Hub | Reference transcriptome | Alignment and quantification reference for Musa spp. [34] |
| Salicylic Acid | Molecular grade | Defense hormone analysis | Quantification of SA-mediated signaling pathways [39] |
| Jasmonic Acid | Molecular grade | Defense hormone analysis | Quantification of JA-mediated signaling pathways [39] |
Visualization of Signaling Pathways and Workflows
NBS-Mediated Defense Signaling Network
NBS-Mediated Defense Signaling Network
Multi-Omics Experimental Workflow
Multi-Omics Experimental Workflow
MINIE Multi-Omic Network Inference
MINIE Multi-Omic Network Inference
Discussion and Future Perspectives
The integration of multi-omics approaches has fundamentally transformed our ability to decipher the complex regulatory networks centered on NBS-LRR genes in plant immunity. By connecting mutation profiles to expression networks, researchers can now identify key regulatory hubs and temporal patterns that distinguish resistant from susceptible cultivars. The protocols outlined here provide a comprehensive framework for conducting such analyses, from experimental design through computational network inference.
Future developments in this field will likely focus on enhancing temporal resolution through more frequent sampling points, incorporating single-cell multi-omics technologies to address cellular heterogeneity, and developing more sophisticated computational methods that can integrate additional data layers such as epigenomics and proteomics. The MINIE framework represents a significant advancement in addressing timescale separation between molecular layers, but further methodological innovations are needed to fully capture the dynamic nature of plant-pathogen interactions [45].
As these technologies mature, their application in crop improvement programs will accelerate the development of durable disease-resistant varieties. By identifying key NBS-LRR genes and their regulatory networks, breeders can employ marker-assisted selection and gene editing approaches to enhance resistance while maintaining favorable agronomic traits. The integration of multi-omics data thus represents not only a powerful research tool but also a bridge between basic plant immunity research and applied crop improvement.
Overcoming Challenges in NBS Gene Expression Studies
Addressing Technical Variation and Batch Effects in Multi-Cultivar Experiments
In plant genomics research, comparing gene expression between resistant and susceptible cultivars is essential for identifying key resistance genes. However, technical variation and batch effects introduced during multi-sample processing can obscure true biological signals, leading to inaccurate conclusions [46]. This challenge is particularly acute in the study of Nucleotide-Binding Site-Leucine-Rich Repeat (NBS-LRR) genes, the largest class of plant disease resistance (R) genes that play crucial roles in effector-triggered immunity [11] [47]. Without proper correction, batch effects stemming from different processing times, reagent lots, instrumentation, or personnel can confound the differential expression patterns researchers seek to identify between resistant and susceptible genotypes.
This Application Note provides a structured framework for identifying, quantifying, and correcting technical variation in multi-cultivar experiments focused on NBS gene expression analysis. We present standardized protocols and analytical workflows to enhance data reliability and biological validity in plant resistance research.
Understanding Batch Effects in Multi-Cultivar Experiments
Batch effects constitute systematic technical variations that can be introduced at multiple experimental stages:
- Sample Collection: Cultivar-specific tissue properties, harvesting time differences, and operator variability
- RNA Processing: RNA extraction kits, reagent lots, and laboratory environmental conditions
- Library Preparation: Different library preparation kits, personnel, and protocol versions
- Sequencing: Different flow cells, sequencing instruments, and run conditions [46]
These technical variations are particularly problematic in NBS-LRR gene expression studies because they can:
- Create false differential expression signals between cultivars
- Mask true biological differences in resistance mechanisms
- Reduce statistical power for detecting genuinely responsive NBS genes
- Compromise the identification of candidate resistance genes for breeding programs [11]
Quantitative Assessment of Batch Effects
Proper identification of batch effects begins with quantitative assessment of data distribution patterns. Key metrics for evaluating potential batch effects include:
Table 1: Quantitative Metrics for Batch Effect Assessment
| Metric | Calculation Method | Interpretation | Threshold for Concern |
|---|---|---|---|
| Principal Component Analysis (PCA) | Dimension reduction on expression matrix | Clear batch clustering on PC1 or PC2 indicates strong batch effect | Batch separation explains >10% of variance |
| Inter-quartile Range (IQR) | Difference between 75th and 25th percentile of expression values | Higher IQR differences between batches suggest technical variation | IQR ratio >1.5 between batches |
| Median Absolute Deviation (MAD) | Median of absolute deviations from the median | Measures variability robustness to outliers | MAD ratio >2.0 between batches |
| Reference Sample Correlation | Pearson correlation with a reference sample across batches | Lower correlations indicate stronger batch effects | Correlation coefficient <0.9 between technical replicates |
Distribution visualization through histograms and boxplots should be employed to examine expression value patterns across batches [48] [49]. The distribution of quantitative data should be described by its shape and summarised numerically by computing the average value, the amount of variation, and identifying outliers [48].
Experimental Design Strategies for Batch Effect Minimization
Strategic Blocking and Randomization
Effective experimental design can substantially reduce batch effects before data collection:
- Cultivar Balancing: Distribute resistant and susceptible cultivars evenly across sequencing batches
- Randomization: Randomize sample processing order to avoid confounding cultivar and time effects
- Reference Samples: Include common reference samples across all batches for normalization
- Replication: Incorporate both technical and biological replicates to disentangle variation sources
Power Analysis for Sample Size Determination
Adequate sample sizing is critical for detecting true biological effects amidst technical variation:
Table 2: Recommended Sample Sizes for Multi-Cultivar NBS Gene Studies
| Experimental Goal | Minimum Biological Replicates per Cultivar | Recommended Technical Replicates | Total Samples per Batch |
|---|---|---|---|
| Preliminary Screening | 4-5 | 1 | 16-20 |
| Differential Expression | 6-8 | 2 | 24-32 |
| Time-Course Studies | 5-6 per time point | 1-2 | 30-36 per batch |
| Multi-Pathogen Response | 6-8 per treatment | 2 | 36-48 per batch |
Computational Correction Methods
Batch Effect Correction Algorithms
Several computational approaches exist for correcting batch effects in gene expression data:
Batch Effect Correction Workflow
Implementation of ComBat and iComBat
The ComBat (Combining Batches) method employs an empirical Bayes framework for batch effect correction:
ComBat Model Formulation: The method assumes the following model for expression values: Yijg = αg + Xijᵀβg + γig + δigεijg Where:
- Yijg represents the expression value for batch i, sample j, and gene g
- αg is the gene-specific intercept
- Xijᵀβg represents the covariate effects
- γig and δig are the additive and multiplicative batch effects
- εijg is the error term [46]
Protocol 1: Standard ComBat Implementation
- Input Preparation: Format expression data as a matrix with genes as rows and samples as columns
- Batch Information: Create a batch vector specifying batch membership for each sample
- Model Fitting: Estimate batch effect parameters using empirical Bayes estimation
- Parameter Adjustment: Apply location and scale adjustments to remove batch effects
- Output Generation: Return the batch-corrected expression matrix
For longitudinal studies with incremental data addition, the iComBat extension provides a valuable approach:
Protocol 2: iComBat for Incremental Data Correction
- Initial Correction: Apply standard ComBat to the existing dataset
- Parameter Storage: Save the estimated batch effect parameters (γig, δig)
- New Batch Processing: For new batches, apply the previously estimated parameters without re-estimation
- Consistent Output: Generate corrected values for new batches consistent with previously corrected data [46]
Case Study: NBS-LRR Gene Expression in Musa spp.
Experimental Design and Batch Challenges
A recent study of NBS-LRR genes in Musa acuminata (banana) provides a relevant case study for batch effect management. The research aimed to identify NBS-LRR genes associated with resistance to Fusarium wilt by comparing resistant and susceptible cultivars [47].
Experimental Conditions:
- Cultivars: Resistant and susceptible banana cultivars
- Pathogen: Fusarium oxysporum f. sp. cubense (Foc)
- Time Points: Multiple post-inoculation time points
- Sample Size: 97 NBS-LRR genes identified in M. acuminata [47]
Batch Challenges Encountered:
- Samples processed across multiple sequencing runs
- Different library preparation dates for resistant vs. susceptible cultivars
- Varying RNA quality metrics between processing batches
Correction Workflow and Outcomes
The implementation of a comprehensive batch correction protocol yielded significant improvements:
Table 3: Batch Effect Correction Impact on Musa NBS-LRR Study
| Analytical Metric | Pre-Correction | Post-Correction | Improvement |
|---|---|---|---|
| PCA Batch Separation | 38% variance on PC1 | 6% variance on PC1 | 84% reduction |
| Inter-Cultivar Correlation | 0.72 ± 0.15 | 0.91 ± 0.06 | 26% increase |
| Differential NBS Genes Identified | 47 | 62 | 32% increase |
| False Discovery Rate | 0.18 | 0.07 | 61% reduction |
The study successfully identified key NBS-LRR genes (MaNBS85, MaNBS89, and MaNBS92) with differential expression between resistant and susceptible cultivars after implementing batch correction. Functional validation through RNA interference assays confirmed that MaNBS89 contributes significantly to pathogen resistance [47].
The Scientist's Toolkit: Research Reagent Solutions
Table 4: Essential Research Reagents for Multi-Cultivar NBS Gene Studies
| Reagent/Category | Specific Examples | Function in Experiment | Considerations for Multi-Cultivar Studies |
|---|---|---|---|
| RNA Extraction Kits | RNeasy Mini Kit, TRIzol | High-quality RNA isolation from plant tissues | Consistent yield across diverse cultivar tissues; effective polysaccharide removal |
| Library Prep Kits | Illumina Stranded mRNA Prep | cDNA library construction for transcriptome | Reproducibility across batches; compatibility with inhibitor-resistant enzymes |
| NBS Gene Databases | MusaRgeneDB, PlantRGD | Reference sequences for NBS-LRR identification | Comprehensive annotation of NBS subfamilies (CNL, TNL, RNL) [50] |
| qPCR Assays | TaqMan assays, SYBR Green master mixes | Validation of NBS gene expression | Primer compatibility across cultivar genomes; detection of NBS gene family members |
| Batch Correction Tools | ComBat, iComBat, SVA | Computational removal of technical variation | Compatibility with RNA-seq data; preservation of biological signals [46] |
| Reference Genes | EF1α, UBQ, ACTIN | Expression normalization in qPCR | Stable expression across cultivars and treatment conditions; minimal variability |
Quality Control and Validation Protocols
Pre-Correction Quality Assessment
Implement rigorous QC metrics before applying batch correction:
Protocol 3: Pre-Correction Data Quality Assessment
- Sequencing Metrics: Evaluate reads per sample, alignment rates, and library complexity
- Sample Similarity: Calculate inter-sample correlations and identify outliers
- Batch Effect Visualization: Generate PCA plots colored by batch and cultivar
- Negative Controls: Assess expression of housekeeping genes across batches
- Positive Controls: Verify expected differential expression of known responsive genes
Post-Correction Validation Methods
Validate batch correction effectiveness without removing biological signals of interest:
Protocol 4: Batch Correction Validation
- PCA Re-examination: Confirm reduced batch clustering in visualization
- Statistical Testing: Use ANOVA to test for residual batch effects
- Biological Signal Preservation: Confirm known cultivar differences remain
- Negative Control Check: Verify stable expression of housekeeping genes
- Positive Control Verification: Ensure expected treatment effects are enhanced
Batch Correction Validation Protocol
Addressing technical variation and batch effects is essential for robust differential expression analysis of NBS genes in resistant versus susceptible cultivars. The integration of careful experimental design with computational correction methods significantly enhances the reliability of identifying candidate resistance genes.
Key recommendations for multi-cultivar experiments include:
- Implement balanced experimental designs that distribute cultivars across batches
- Apply appropriate normalization methods before batch correction
- Utilize empirical Bayes frameworks like ComBat for robust batch effect removal
- Validate correction effectiveness through both technical and biological metrics
- Maintain detailed records of all processing batches for proper adjustment
Following these protocols will enhance data quality and biological validity in plant resistance gene research, ultimately supporting more accurate identification of NBS-LRR genes for crop improvement programs.
Optimizing Bioinformatics Parameters for Accurate NBS Domain Identification
Within the field of plant-pathogen interactions, the nucleotide-binding site (NBS)-leucine-rich repeat (LRR) gene family represents a critical line of defense, encoding proteins that recognize pathogen effectors and activate effector-triggered immunity (ETI) [51] [1]. Research focused on differential expression analysis of NBS genes between resistant and susceptible cultivars provides a powerful strategy for identifying key candidate resistance genes [13]. The foundation of this research, however, relies on the accurate and comprehensive identification of NBS domain-encoding genes from plant genomes. This protocol details a optimized bioinformatics workflow for NBS domain identification, integrating robust parameter settings and validation steps essential for generating reliable data for subsequent differential expression analyses.
Background and Significance
The NBS-LRR Gene Family in Plant Immunity
Plant NBS-LRR genes constitute one of the largest and most critical resistance gene families, with over 60% of cloned disease resistance genes belonging to this class [52] [24]. These genes are modular proteins typically consisting of a variable N-terminal domain, a conserved NBS (NB-ARC) domain, and C-terminal LRR repeats [28] [24]. Based on their N-terminal domains, they are primarily classified into TIR-NBS-LRR (TNL), CC-NBS-LRR (CNL), and RPW8-NBS-LRR (RNL) subfamilies [1] [28]. Additionally, irregular types lacking the LRR domain (e.g., TN, CN, N-type) often function as adaptors or regulators for typical NBS-LRR proteins [5].
The functional characterization of specific NBS-LRR genes has revealed their direct involvement in resistance mechanisms. For instance, in Vernicia montana, the gene Vm019719 (a CNL-type) was shown to confer resistance to Fusarium wilt, while its allelic counterpart in susceptible V. fordii contained a promoter deletion that rendered it ineffective [24]. Similarly, in roses, specific TNL genes demonstrated significant upregulation in response to fungal pathogens like Marssonina rosae, the causative agent of black spot [51].
Bioinformatics Challenges in NBS Gene Identification
Accurate identification of NBS genes presents several computational challenges. Their characteristic rapid evolution, clustered genomic arrangement, and sequence variability often lead to fragmented or incomplete annotations in automated gene prediction pipelines [53]. Furthermore, their frequent misclassification as repetitive elements and typically low expression levels complicate prediction based solely on RNA-Seq evidence [53]. These factors necessitate a specialized, multi-step bioinformatics approach with carefully optimized parameters to ensure comprehensive and accurate gene discovery.
Protocol: Optimized Workflow for NBS Domain Identification
Stage 1: Initial Domain Identification via HMMER
Objective: To perform a sensitive genome-wide scan for sequences containing the conserved NBS (NB-ARC) domain.
- Software: HMMER v3.1b2 or later [52] [28]
- HMM Profile: PF00931 (NB-ARC) downloaded from the Pfam database [5] [52] [28]
- Critical Parameters:
- E-value cutoff:
< 1e-20for initial search stringency [5] - Database: The complete proteome or translated genome sequence of the target species.
- Command example:
hmmsearch -E 1e-20 --cpu 4 Pfam_NB-ARC.hmm proteome.fa > hmmsearch_results.txt
- E-value cutoff:
Stage 2: Domain Verification and Classification
Objective: To confirm the presence of the NBS domain and classify candidate genes into subfamilies based on domain architecture.
- Tools:
- PfamScan: Re-scan candidates with the full Pfam-A HMM library to confirm the NBS domain and identify associated domains (E-value
< 0.01) [5] [28]. - NCBI Conserved Domain Database (CDD): Perform batch CD-search to corroborate domain predictions [52].
- SMART tool: Further validate complex domain architectures [5].
- PfamScan: Re-scan candidates with the full Pfam-A HMM library to confirm the NBS domain and identify associated domains (E-value
- Classification Schema: Classify candidate genes based on the presence of specific domains as detailed in Table 1.
Table 1: NBS-LRR Gene Classification Based on Domain Architecture
| Classification | N-Terminal Domain | Central Domain | C-Terminal Domain | Representative Count in N. benthamiana [5] |
|---|---|---|---|---|
| TNL | TIR (PF01582) | NBS (PF00931) | LRR | 5 |
| CNL | Coiled-Coil (CC) | NBS (PF00931) | LRR | 25 |
| NL | - | NBS (PF00931) | LRR | 23 |
| RNL | RPW8 | NBS (PF00931) | LRR | 4 (with RPW8) |
| TN | TIR (PF01582) | NBS (PF00931) | - | 2 |
| CN | Coiled-Coil (CC) | NBS (PF00931) | - | 41 |
| N | - | NBS (PF00931) | - | 60 |
Stage 3: Motif and Gene Structure Analysis
Objective: To identify conserved motifs within the NBS domain and analyze gene structure, supporting functional predictions.
- Conserved Motif Identification:
- Gene Structure Analysis:
Application in Differential Expression Studies
Objective: To utilize the curated list of NBS genes for expression profiling in resistant vs. susceptible cultivars.
- Transcriptome Analysis:
- Map RNA-Seq reads from inoculated and control samples of resistant and susceptible genotypes to the reference genome using HISAT2 [52] or STAR [54].
- Quantify reads mapping to the identified NBS genes using HTSeq [54] or featureCounts.
- Perform differential expression analysis with tools like Cuffdiff [52] or DESeq2 to identify NBS genes significantly upregulated in the resistant cultivar post-inoculation.
- Functional Validation:
The following workflow diagram summarizes the complete integrated protocol from identification to validation.
The Scientist's Toolkit: Research Reagent Solutions
Table 2: Essential Research Reagents and Resources for NBS Gene Analysis
| Reagent/Resource | Function/Application | Specification/Example |
|---|---|---|
| Pfam HMM Profile (PF00931) | Core model for identifying the NBS domain in HMMER searches. | NB-ARC domain profile; accessed via Pfam database [5] [52]. |
| Reference Genome & Annotation | Baseline for gene identification, structural annotation, and RNA-Seq mapping. | Species-specific, high-quality assembly (e.g., from Sol Genomics Network [5]). |
| RNA-Seq Datasets | Profiling gene expression in resistant/susceptible cultivars under pathogen stress. | Paired-end reads from inoculated vs. mock-treated root/leaf tissues [51] [13]. |
| VIGS Vector System | Functional validation through transient gene silencing in resistant plants. | Agrobacterium-based system (e.g., TRV-based) for candidate NBS gene knockdown [28] [24]. |
| Domain Database (CDD, SMART) | Verification of NBS domain and identification of associated domains (TIR, CC, LRR). | Used for batch classification of candidate genes [5] [52]. |
A meticulous and optimized bioinformatics pipeline is the cornerstone of successful NBS gene discovery and characterization. The protocol outlined herein, emphasizing stringent HMMER parameters, multi-tool domain verification, and systematic classification, provides a robust framework for building a comprehensive catalog of NBS genes in any plant genome. When integrated with transcriptomic data from resistant and susceptible cultivars, this pipeline effectively narrows down candidate resistance genes for subsequent functional studies. This holistic approach, from in silico prediction to in planta validation, significantly accelerates the identification of agronomically important resistance genes and informs modern marker-assisted breeding strategies.
In genomic research, accurately resolving complex gene families is a cornerstone for understanding the molecular basis of disease resistance in plants. This challenge is particularly acute when studying nucleotide-binding site-leucine-rich repeat (NBS-LRR) genes in wheat, which play critical roles in pathogen recognition and defense activation. The genomic architecture of wheat, with its large, repetitive, and polyploid genome, presents substantial obstacles for distinguishing between true paralogs (genes related by duplication) and alternative splice isoforms, and for the correct assembly of these complex loci [55] [41]. These difficulties are compounded when investigating the differential expression of NBS genes between resistant and susceptible cultivars, as misassembly or misclassification can lead to erroneous biological interpretations. This Application Note provides detailed protocols for overcoming these challenges, framed within the context of a broader thesis on the differential expression analysis of NBS genes in resistant versus susceptible wheat cultivars.
The Computational Toolkit: Paralog Discrimination with PIC-Me
Accurately distinguishing paralogs from isoforms is a critical first step in resolving gene families. The PIC-Me (Paralogs and Isoforms Classifier based on Machine-learning approaches) tool addresses this challenge using a random forest model trained on specific RNA-seq features [55].
Key Bioinformatic Features for Classification
The PIC-Me classifier utilizes five genomic and transcriptomic features to discriminate between paralogs and isoforms. The performance and application of these features are summarized in Table 1.
Table 1: Key Features for Discriminating Paralogs and Isoforms in PIC-Me
| Feature Name | Description | Calculation Method | Interpretation in Classification |
|---|---|---|---|
| Sequence Similarity (SS) | Fraction of matches in the sequence alignment | Number of matching positions divided by alignment length | Higher similarity suggests isoforms; lower suggests paralogs |
| Inverse Count of Consecutive Blocks (ICCB) | Reciprocal of blocks with consecutive matches/mismatches | 1 / (number of consecutive identical or non-identical blocks) | Lower ICCB indicates more complex alignment patterns typical of paralogs |
| Match-Mismatch Fraction (MMF) | Normalized number of consecutive matches and mismatches | (Sum of lengths-1 of all consecutive blocks) / alignment length | Higher MMF suggests isoforms with conserved exonic regions |
| Twilight Zone (TZ) | Protein sequence identity range (20-35%) that distinguishes functional similarity | Applied as a cutoff; pairs with <20% SS are excluded | Filters out unrelated sequences before classification |
| Expression Level Difference (ELD) | Absolute difference in expression between two transcripts | log-transformed absolute value of FPKM difference | Larger differences suggest paralogs with divergent regulation |
Experimental Protocol: Implementing PIC-Me for NBS Gene Analysis
Purpose: To distinguish paralogous NBS genes from alternative isoforms in RNA-seq data from resistant and susceptible wheat cultivars.
Materials and Reagents:
- High-quality RNA from infected and mock-treated wheat leaves
- Trinity software (v2.2.0 or later) for de novo transcriptome assembly
- TransDecoder (v3.0.0 or later) for coding sequence prediction
- BLAST+ suite for sequence annotation
- PIC-Me software package
Procedure:
Transcriptome Assembly and Processing
- Isolate total RNA from resistant and susceptible wheat cultivars at multiple time points post-inoculation with pathogen (e.g., 0, 8, 16, 20, and 48 hours) [41].
- Perform quality control using Trimmomatic (v0.36) to remove adapter sequences and low-quality reads [55].
- Conduct de novo assembly using Trinity with default parameters for each sample separately.
- Predict coding sequences using TransDecoder aided by BLASTP searches against the UniProt/Swiss-Prot database (E-value cutoff 10⁻⁵).
Sequence Alignment and Feature Calculation
- Extract putative NBS gene sequences from assemblies based on domain annotation.
- Perform pairwise alignments of sequences using MAFFT package (fftnsi program) with default parameters [55].
- Calculate the five classification features (SS, ICCB, MMF, TZ, ELD) for each sequence pair.
- Exclude sequence pairs with less than 20% sequence similarity (Twilight Zone filter).
Classification and Validation
- Input calculated features into the pre-trained random forest model in PIC-Me.
- Classify sequence pairs as paralogs or isoforms based on model output.
- Validate classifications using known gene families from Ensembl Compara homology database as reference.
Troubleshooting Tip: If classification accuracy is low for your specific wheat cultivar, consider retraining the PIC-Me model with known NBS gene pairs from wheat-specific databases to improve performance.
Experimental Framework: Transcriptomic Analysis of NBS Genes
Workflow for Differential Expression Analysis
The following diagram illustrates the integrated experimental and computational workflow for analyzing NBS gene expression in resistant and susceptible wheat lines.
Research Reagent Solutions for Wheat-Pathogen Studies
Table 2: Essential Research Reagents for Wheat-Pathogen Transcriptomics
| Reagent/Resource | Function/Application | Example Specifications |
|---|---|---|
| Near-Isogenic Lines (NILs) | Control genetic background while studying specific resistance genes | Thatcher (susceptible) and ThatcherLr10 (resistant) for leaf rust [41] |
| Pathogen Strains | Specific elicitation of defense responses | Puccinia triticina race BRW 97512-19 (AvrLr10) for leaf rust [41] |
| RNA Extraction Kits | High-quality RNA from pathogen-infected tissues | Protocols optimized for fungal-infected wheat leaves [41] [56] |
| Trinity Assembler | De novo transcriptome assembly without reference genome | Version 2.2.0 with default parameters [55] |
| TransDecoder | Coding sequence prediction from transcriptomes | Version 3.0.0 with BLASTP support [55] |
| WGCNA Package | Weighted gene co-expression network analysis | R package version 1.7 for identifying correlated gene modules [57] |
| DESeq2 | Differential expression analysis from count data | R package for statistical analysis of RNA-seq data [57] |
Advanced Applications in Disease Resistance Research
Case Study: Network Analysis of Wheat-Ptr Interactions
Weighted Gene Co-expression Network Analysis (WGCNA) has proven valuable for identifying coordinated host responses to pathogens. In a study of wheat resistance to Pyrenophora tritici-repentis (tan spot), researchers applied WGCNA to RNA-seq data from resistant (Robigus) and susceptible (Hereward) wheat lines [57].
Protocol: WGCNA for NBS Gene Co-expression Analysis
Data Preparation
- Obtain normalized count data from RNA-seq experiments (e.g., using DESeq2's variance stabilizing transformation).
- Select the top 95% most variant transcripts (e.g., 2,114 transcripts) for network construction.
- Convert genotype and treatment metadata into binary numeric arrays for trait correlation.
Network Construction
- Use the WGCNA R package (v1.7) to construct a signed network.
- Set parameters: power = 16, mergeCutHeight = 0.25, minModuleSize = 30.
- Calculate module eigengenes (first principal component of each module's expression matrix).
Module-Trait Correlation
- Calculate Pearson correlation and hierarchical clustering between module eigengenes and trait data.
- Select modules with significant correlations (>0.6, p-value < 0.05) for further analysis.
Hub Gene Identification
- Calculate module membership (correlation between module eigengenes and gene expression).
- Calculate gene-trait significance (correlation between gene expression and traits).
- Filter transcripts with absolute values of gene-trait significance > 0.6 and module membership > 0.8.
- Visualize networks using Cytoscape (v3.8.2) with topological overlap matrix > 0.1.
This approach successfully identified a resistance-associated module enriched with chloroplast ribosomal machinery genes and transcriptional regulators, highlighting the importance of maintaining chloroplast function during defense responses [57].
NBS Gene Identification and Assembly Strategy
Protocol: Targeted Assembly of NBS-LRR Genes
Reference-Based Identification
- Download known NBS-LRR protein sequences from public databases (e.g., Ensembl Plants).
- Perform tBLASTn searches against your transcriptome assemblies with E-value cutoff 10⁻¹⁰.
- Extract significant hits and confirm the presence of characteristic NBS domains.
Domain Annotation and Classification
- Annotate identified sequences using InterProScan to identify protein domains.
- Classify NBS genes into subfamilies (TNL, CNL, RNL) based on N-terminal domains.
- Use multiple sequence alignment (MUSCLE) and phylogenetic analysis to identify paralogous groups.
Expression Profiling
- Quantify expression levels using RNA-seq read mapping (Bowtie2) and estimation (RSEM).
- Calculate FPKM values for each NBS gene in resistant and susceptible backgrounds.
- Perform statistical testing for differential expression using DESeq2.
This approach enabled the identification of key NBS genes, such as the recently cloned Ym1 and Ym2 genes, which confer resistance to wheat yellow mosaic virus and are characterized as CC-NBS-LRR proteins specifically expressed in roots [58].
Integrated Data Analysis Framework
The following diagram illustrates the logical relationship between computational discrimination of paralogs and the biological interpretation of NBS gene function in disease resistance.
Resolving complex gene families, particularly NBS-LRR genes, requires an integrated approach combining robust computational classification of paralogs with sophisticated transcriptomic analysis. The protocols detailed in this Application Note provide a comprehensive framework for accurately discriminating paralogs from isoforms, correctly assembling complex NBS gene loci, and analyzing their expression patterns in resistant and susceptible wheat cultivars. By implementing these methods, researchers can overcome the significant challenges posed by wheat's complex genome and gain meaningful insights into the molecular mechanisms of disease resistance, ultimately facilitating the development of more resilient crop varieties.
Strategies for Handling Co-Expression and Functional Redundancy in NBS Clusters
Nucleotide-binding site-leucine rich repeat (NBS-LRR) genes form the largest family of plant disease resistance (R) genes, frequently organized in genetically linked clusters that pose significant challenges for functional analysis due to co-expression and functional redundancy. This application note provides a comprehensive framework for dissecting these complex genomic regions within the context of differential expression studies comparing resistant and susceptible cultivars. We present integrated bioinformatic, molecular, and functional validation strategies to resolve individual gene contributions to immunity, enabling more accurate identification of candidate R genes for crop improvement.
In plant genomes, NBS-LRR genes are notoriously clustered, with studies reporting 54% of pepper NBS-LRR genes forming 47 physical clusters [59] and 64% of Akebia trifoliata NBS genes residing in clustered arrangements [60]. This genomic organization, driven primarily by tandem duplications [28] [60] [59], creates two primary analytical challenges in differential expression analyses. First, sequence similarity among cluster members complicates the unique mapping of RNA-seq reads, potentially obscuring true expression patterns. Second, functional redundancy allows genetically distinct family members to perform overlapping immune functions, masking phenotypic consequences when individual genes are silenced.
Overcoming these limitations is essential for advancing R gene discovery, particularly in multi-copy subfamilies. For instance, research in Salvia miltiorrhiza revealed a striking reduction in TNL and RNL subfamily members compared to other angiosperms, with the CNL subfamily dominating the NBS-LRR repertoire [19]. Similar lineage-specific expansions and contractions reported across species [28] [59] highlight the need for tailored approaches to dissect locally duplicated NBS clusters.
Core Strategies and Methodological Framework
Bioinformatics Approaches for Resolving Co-Expression
High-Resolution Expression Profiling
Accurate transcript quantification within NBS clusters requires specialized bioinformatic workflows. The following protocol outlines key steps for resolving expression patterns in these complex genomic regions:
Table 1: Bioinformatic Solutions for Co-Expression Challenges
| Challenge | Solution | Implementation | Expected Outcome |
|---|---|---|---|
| Ambiguous Read Mapping | Personalized reference creation | Create cluster-specific pseudo-genomes; Use selective alignment tools (Salmon, kallisto) | 20-30% improvement in uniquely mapped reads to NBS clusters |
| Expression Quantification | Orthogroup-based analysis | Group NBS genes into orthogroups using OrthoFinder; Quantify expression at orthogroup level | Identification of coregulated NBS gene sets across genotypes |
| Temporal Resolution | Time-course experimental design | Sample at multiple time points post-inoculation (e.g., 12 hpi, 24 hpi, 48 hpi) [39] | Identification of early vs. late responding NBS genes in defense cascades |
Protocol 1.1: Cluster-Aware RNA-seq Analysis
- Reference Preparation: Extract genomic sequences for entire NBS clusters plus flanking regions (minimum 5 kb upstream/downstream) from reference genome.
- Personalized Transcriptome: Create a cluster-specific reference by combining standard annotation with alternative transcript models for clustered NBS genes.
- Selective Alignment: Map RNA-seq reads using alignment-free tools like Salmon [34] with bias correction flags enabled.
- Expression Validation: Flag genes with ambiguous mapping for orthogonal validation (e.g., NanoString, qPCR with junction-spanning primers).
Orthogroup-Based Comparative Analysis
Large-scale comparative studies have identified conserved NBS orthogroups across plant species [28], providing an evolutionary framework for functional inference. This approach is particularly valuable when studying non-model crops with less characterized genomes.
Protocol 1.2: Cross-Species Orthogroup Mapping
- Orthogroup Identification: Process NBS protein sequences from target species and related taxa using OrthoFinder v2.5.1 [28].
- Expression Integration: Map RNA-seq expression data (FPKM/TPM values) to orthogroups rather than individual genes.
- Conserved Response Identification: Identify orthogroups consistently differentially expressed in resistant cultivars across multiple studies (e.g., OG2, OG6, OG15 [28]).
- Functional Inference: Transfer functional annotations from well-characterized orthologs in model species to guide candidate prioritization.
Experimental Approaches for Addressing Functional Redundancy
High-Resolution Mutagenesis Strategies
Functional redundancy in NBS clusters can be addressed through targeted genetic interventions that overcome compensatory mechanisms among paralogs.
Table 2: Experimental Approaches for Functional Redundancy
| Approach | Mechanism | Applications | Considerations |
|---|---|---|---|
| Virus-Induced Gene Silencing (VIGS) | Sequence-specific transcript degradation | Validation of individual NBS genes (e.g., GaNBS in cotton) [28] | Off-target silencing of homologous genes; transient effect |
| CRISPR/Cas9 Multiplex Editing | Simultaneous knockout of multiple cluster members | Functional dissection of entire NBS subfamilies | Design challenges due to sequence similarity; transformation efficiency |
| TILLING Populations | Identification of natural mutations in NBS clusters | Forward genetics in polyploid species [61] | Requires extensive screening; background mutation effects |
Protocol 2.1: Multiplex CRISPR for NBS Clusters
- Target Selection: Identify conserved domains (P-loop, RNBS-A, kinase-2) [59] and variable regions (LRR) for guide RNA design.
- Guide RNA Design: Create 3-5 gRNAs targeting both conserved functional domains and gene-specific variable regions.
- Vector Assembly: Use Golden Gate or similar modular cloning to assemble multiplex CRISPR constructs.
- Transformation and Screening: Generate transgenic lines and screen for editing events using NGS-based methods like amplicon sequencing.
- Phenotypic Validation: Challenge edited lines with target pathogens and quantify disease symptoms compared to wildtype.
Protein Interaction and Localization Studies
Functional characterization of NBS proteins extends beyond genetic analysis to include protein-level interactions and subcellular localization.
Protocol 2.2: Protein-Ligand Interaction Analysis
- Heterologous Expression: Express recombinant NBS proteins (full-length or individual domains) in E. coli or insect cells.
- Molecular Docking: Perform in silico docking studies with ADP/ATP molecules to assess nucleotide binding capacity [28].
- Surface Plasmon Resonance (SPR): Quantify binding kinetics between NBS proteins and pathogen effectors or host guardees.
- Interaction Validation: Confirm key interactions through yeast two-hybrid or co-immunoprecipitation assays.
Integrated Workflow for NBS Cluster Analysis
The following diagram illustrates a comprehensive workflow integrating bioinformatic and experimental approaches to resolve co-expression and functional redundancy in NBS clusters:
Diagram 1: Integrated workflow for NBS cluster functional analysis (Width: 760px)
Case Studies and Applications
Successful Implementation in Crop Species
Case Study 1: Rice Bacterial Leaf Streak Resistance Transcriptome analysis of rice near-isogenic lines responding to Xanthomonas oryzae pv. oryzicola infection revealed temporal regulation of defense responses [39]. Resistant lines showed enhanced expression of PTI- and ETI-related genes across multiple time points, with early induction of flagellin sensing (12 hpi), followed by phytoalexin biosynthesis (24 hpi), and structural reinforcement (48 hpi). This study demonstrates the importance of time-course experiments for resolving expression patterns of tightly regulated NBS genes.
Case Study 2: Cotton Leaf Curl Disease Resistance Comparative analysis of susceptible (Coker 312) and tolerant (Mac7) cotton accessions identified 6,583 unique variants in NBS genes of the resistant genotype [28]. VIGS-mediated silencing of GaNBS (OG2) confirmed its role in virus resistance, establishing a direct link between sequence variation and function. This exemplifies how genetic diversity in NBS clusters can be harnessed for disease resistance breeding.
The Scientist's Toolkit: Essential Research Reagents
Table 3: Key Research Reagent Solutions for NBS Cluster Analysis
| Reagent/Category | Specific Examples | Function/Application | Considerations |
|---|---|---|---|
| Sequencing Platforms | Illumina NovaSeq 6000, Oxford Nanopore GridION X5 [62] | Hybrid genome assembly; full-length NBS-LRR transcript sequencing | Long-read technologies resolve complex cluster regions |
| Specialized Software | OrthoFinder v2.5.1, MEME Suite, Salmon v1.9.0 [62] [28] [34] | Orthogroup analysis; motif discovery; transcript quantification | Tool-specific parameters optimize NBS gene analysis |
| Functional Validation | VIGS vectors (TRV-based), CRISPR/Cas9 systems, yeast two-hybrid | In planta gene silencing; targeted mutagenesis; interaction studies | VIGS efficiency varies by species; optimize delivery method |
| Expression Analysis | NanoString nCounter, qRT-PCR reagents, DESeq2 [34] | Multiplex gene expression; candidate validation; differential expression | Orthogonal validation required for ambiguous cluster regions |
Dissecting the functional contributions of individual NBS genes within co-expressed, redundant clusters remains challenging but increasingly tractable through integrated methodologies. The strategies outlined here—combining cluster-aware bioinformatics, temporal expression profiling, and targeted functional validation—provide a roadmap for advancing beyond correlative expression studies to establish causal relationships between specific NBS genes and disease resistance phenotypes.
Future methodological developments will likely include single-cell transcriptomics to resolve cell-type-specific NBS expression, base editing for precise functional dissection without complete gene knockout, and improved structural prediction algorithms to infer function from sequence. As these tools mature, they will further accelerate the identification and deployment of NBS-LRR genes in crop improvement programs, ultimately enhancing agricultural sustainability through genetic disease resistance.
Validating NBS Gene Function and Translating Findings to Applications
qRT-PCR Validation of Candidate NBS Gene Expression Patterns
Within the field of plant-pathogen interactions, the characterization of Nucleotide-Binding Site Leucine-Rich Repeat (NBS-LRR) genes represents a critical research focus due to their fundamental role in plant immune responses. These genes constitute the largest family of disease resistance (R) genes in plants and are responsible for recognizing specific pathogen effectors, thereby initiating robust defense mechanisms known as effector-triggered immunity (ETI) [39] [63]. Transcriptome-wide expression analyses often identify numerous NBS-LRR genes as differentially expressed between resistant and susceptible cultivars following pathogen challenge [64] [65]. However, validating these expression patterns through quantitative real-time reverse transcription PCR (qRT-PCR) remains an essential step for confirming the involvement of specific NBS genes in resistance mechanisms. This Application Note provides detailed protocols for the design and execution of qRT-PCR experiments to validate the expression patterns of candidate NBS genes identified in differential expression studies, framed within the context of plant disease resistance research.
Background and Significance
NBS-LRR genes encode proteins that typically contain a conserved nucleotide-binding site (NBS) domain and a leucine-rich repeat (LRR) domain. These molecular sensors can directly or indirectly recognize pathogen-derived effectors, leading to the activation of defense responses that often include a hypersensitive response (HR) characterized by localized cell death at infection sites [66]. Recent studies on cloned NBS-LRR genes demonstrate their critical functions across various pathosystems. For instance, the wheat Ym1 gene, which confers resistance to wheat yellow mosaic virus (WYMV), encodes a typical CC-NBS-LRR-type R protein that is specifically expressed in roots and induced upon WYMV infection [66]. Similarly, in rice, the Xo1 gene provides resistance against bacterial leaf streak (BLS) by encoding an NBS-LRR protein that recognizes transcription activator-like effectors (TALEs) secreted by Xanthomonas oryzae pv. oryzicola (Xoc) [39] [63].
High-throughput RNA sequencing (RNA-seq) technologies have revolutionized the identification of differentially expressed NBS genes in resistant versus susceptible plant cultivars under pathogen stress [64] [67] [68]. However, the accuracy and sensitivity of qRT-PCR make it the gold standard for validating transcriptome data due to its superior quantification capabilities, wide dynamic range, and enhanced sensitivity compared to other methods [64]. This protocol outlines a comprehensive approach for confirming the expression patterns of candidate NBS genes initially identified through transcriptomic analyses, enabling researchers to prioritize key targets for further functional characterization.
Experimental Design
Plant Materials and Pathogen Inoculation
The foundation of reliable qRT-PCR validation begins with careful experimental design of plant-pathogen interactions. Studies should include both resistant and susceptible cultivars with clearly documented phenotypic differences in disease response. For time-course experiments, sample collection should encompass multiple post-inoculation time points to capture dynamic expression patterns of NBS genes.
- Plant Cultivars: Utilize well-characterized resistant and susceptible cultivars. For example, in banana blood disease research, 'Khai Pra Ta Bong' (resistant) and 'Hin' (susceptible) provide ideal comparisons [64]. In rice bacterial leaf streak studies, near-isogenic lines (NILs) differing at a single resistance locus, such as NIL-bls2 (resistant) and NIL-BLS2 (susceptible), are particularly valuable as they minimize background genetic variation [39] [63].
- Pathogen Preparation and Inoculation: Use standardized inoculation methods appropriate for the pathogen. For bacterial pathogens like Ralstonia syzygii subsp. celebesensis in banana or Xanthomonas oryzae in rice, prepare suspensions at consistent concentrations (e.g., 10⁸ CFU/mL) and apply using methods that ensure reproducible infection, such as root wounding or leaf infiltration [64] [39].
- Sample Collection: Collect tissue samples from both inoculated and mock-inoculated (control) plants at critical time points post-inoculation. Include an early time point (e.g., 12 hours post-inoculation) to capture initial recognition events, as NBS-LRR genes are often rapidly induced during ETI activation [64] [63]. Immediately freeze samples in liquid nitrogen and store at -80°C until RNA extraction to preserve RNA integrity.
Table 1: Example Experimental Design for Time-Course Sampling
| Plant Type | Treatment | Time Points (hpi) | Tissue Sampled | Replicates |
|---|---|---|---|---|
| Resistant Cultivar | Pathogen Inoculated | 0, 12, 24, 48, 72 | Roots/Leaves | 3-5 biological |
| Resistant Cultivar | Mock Inoculated | 0, 12, 24, 48, 72 | Roots/Leaves | 3-5 biological |
| Susceptible Cultivar | Pathogen Inoculated | 0, 12, 24, 48, 72 | Roots/Leaves | 3-5 biological |
| Susceptible Cultivar | Mock Inoculated | 0, 12, 24, 48, 72 | Roots/Leaves | 3-5 biological |
Selection of Candidate NBS Genes and Reference Genes
The selection of appropriate candidate genes from transcriptome data and validation of stable reference genes are crucial for generating reliable qRT-PCR data.
- Candidate NBS Gene Selection: Prioritize NBS-LRR genes that show significant differential expression in RNA-seq data, particularly those with large fold-change differences between resistant and susceptible cultivars after pathogen challenge [64] [65]. Focus on genes with high read counts and statistical significance. Genes located within known resistance quantitative trait loci (QTL) are of particular interest [66].
- Reference Gene Validation: Select and validate multiple candidate reference genes for normalization. Common housekeeping genes include Ubiquitin, Actin, GAPDH, and EF1α. However, their expression stability must be empirically tested across all experimental conditions (tissues, treatments, time points) using algorithms such as geNorm, NormFinder, or BestKeeper [64]. Using multiple validated reference genes increases normalization accuracy.
Diagram 1: Workflow for qRT-PCR validation of candidate NBS genes from transcriptome data.
Materials and Reagents
Research Reagent Solutions
Table 2: Essential Reagents and Kits for qRT-PCR Validation
| Category | Specific Product/Kit | Function | Example Usage |
|---|---|---|---|
| RNA Extraction | RNeasy Plant Kit (QIAGEN) | High-quality total RNA isolation from plant tissues; includes DNase digestion to remove genomic DNA contamination. | Used in banana root RNA extraction for transcriptome and qRT-PCR analysis [64]. |
| RNA Quality Assessment | NanoDrop Lite Spectrophotometer (Thermo Fisher) | Quantifies RNA concentration and assesses purity (A260/A280 and A260/A230 ratios). | Standard equipment for RNA QC prior to library prep and qRT-PCR [64]. |
| Experion Automated Electrophoresis System (Bio-Rad) | Provides RNA Integrity Number (RIN); essential for verifying non-degraded RNA. | Used to check RNA quality before wheat transcriptome sequencing; RIN >7 recommended [67]. | |
| cDNA Synthesis | High-Capacity cDNA Reverse Transcription Kit (Applied Biosystems) | Converts purified RNA into stable cDNA for use as qPCR template. | Standard for first-strand cDNA synthesis. |
| qPCR Master Mix | SYBR Green PCR Master Mix (Applied Biosystems) | Contains optimized buffers, dNTPs, polymerase, and SYBR Green dye for fluorescence-based detection of amplified products. | Common choice for dye-based qPCR; allows melt curve analysis. |
| Primers | Gene-specific oligonucleotides (designed in-house) | Amplifies specific target (NBS genes) and reference gene transcripts. | Must be designed and validated for each candidate gene. |
Step-by-Step Protocols
RNA Extraction and Quality Control
- Homogenization: Grind approximately 100 mg of frozen plant tissue to a fine powder in liquid nitrogen using a sterile mortar and pestle.
- RNA Extraction: Follow the manufacturer's instructions for commercial RNA extraction kits, such as the RNeasy Plant Kit. This typically involves lysing the powdered tissue in a guanidine-thiocyanate-containing buffer (e.g., RLT buffer) to inactivate RNases, followed by purification through silica-based membrane columns [64].
- DNase Treatment: Perform on-column DNase digestion using the RNase-free DNase set to eliminate genomic DNA contamination, a critical step for accurate gene expression analysis [67].
- Quality Control:
- Spectrophotometry: Measure RNA concentration and purity using a NanoDrop. Acceptable A260/A280 and A260/A230 ratios are ~2.0.
- Integrity Check: Assess RNA integrity using agarose gel electrophoresis (sharp 18S and 28S rRNA bands) or automated electrophoresis systems (e.g., Experion, Bio-Rad) to obtain an RNA Integrity Number (RIN). Proceed only with samples having RIN > 7.0 [67].
cDNA Synthesis
- Use 1 µg of total high-quality RNA as input for reverse transcription reactions.
- Utilize reverse transcriptase kits according to the manufacturer's protocol. A standard 20 µL reaction should include reaction buffer, dNTPs, random hexamers/oligo(dT) primers, reverse transcriptase enzyme, and RNase inhibitor.
- Run the reaction in a thermal cycler with conditions typically including a primer annealing step (e.g., 25°C for 10 min), reverse transcription (e.g., 37°C for 120 min), and enzyme inactivation (e.g., 85°C for 5 min).
- Dilute the synthesized cDNA with nuclease-free water to a consistent concentration (e.g., 1:10 dilution) before use in qPCR.
Quantitative Real-Time PCR
Primer Design:
- Design primers using software (e.g., Primer-BLAST) to generate amplicons of 80-200 bp.
- Ensure primers span an intron-exon boundary where possible to further preclude genomic DNA amplification.
- Verify primer specificity by in silico PCR against the host genome and by analyzing melt curves for a single peak post-amplification.
qPCR Reaction Setup:
- Prepare reactions in a total volume of 10-20 µL containing 1X SYBR Green Master Mix, forward and reverse primers (typically 200-400 nM each), and cDNA template (equivalent to 10-100 ng of original RNA).
- Include no-template controls (NTC) for each primer pair to check for contamination.
- Run all samples and controls in technical triplicates to account for pipetting error.
Thermocycling Conditions:
- Use a standard two-step amplification protocol:
- Initial Denaturation: 95°C for 10 min
- 40 Cycles of:
- Denaturation: 95°C for 15 sec
- Annealing/Extension: 60°C for 1 min (acquire fluorescence)
- Melt Curve Analysis: 65°C to 95°C, increment 0.5°C for 5 sec each
- Use a standard two-step amplification protocol:
Data Analysis
- Calculate Ct Values: Determine the mean Ct value for each sample-primer set combination from the technical replicates.
- Normalize to Reference Genes: Calculate the ∆Ct for each sample: ∆Ct = Ct(target NBS gene) - Ct(reference gene). Use the geometric mean of multiple validated reference genes if available.
- Calculate Relative Expression: Use the 2^(-∆∆Ct) method [64]:
- ∆∆Ct = ∆Ct(treated sample) - ∆Ct(calibrator sample, e.g., mock-inoculated resistant cultivar at 0 hpi)
- Relative Expression = 2^(-∆∆Ct)
- Statistical Analysis: Perform appropriate statistical tests (e.g., Student's t-test, ANOVA followed by post-hoc tests) on ∆Ct values to determine significant differences in gene expression between resistant and susceptible lines or across time points.
Diagram 2: Simplified plant immunity pathway showing NBS-LRR gene role in ETI.
Anticipated Results and Interpretation
Successful validation will demonstrate a significant upregulation of candidate NBS genes in the resistant cultivar following pathogen inoculation, with expression levels either remaining unchanged or showing a delayed and weaker induction in the susceptible cultivar. For example, in the banana blood disease study, qRT-PCR confirmed the significant upregulation of key defense-related genes, including receptor-like kinases, in resistant 'Khai Pra Ta Bong' as early as 12 hours post-inoculation [64].
Table 3: Example Anticipated qRT-PCR Results (Relative Expression Fold-Change)
| Candidate NBS Gene | Resistant 12 hpi | Resistant 24 hpi | Susceptible 12 hpi | Susceptible 24 hpi | Biological Interpretation |
|---|---|---|---|---|---|
| NBS-LRR01 | 15.5 ± 1.2* | 8.3 ± 0.9* | 1.5 ± 0.3 | 2.1 ± 0.4 | Strong, early response in resistant cultivar only. |
| NBS-LRR02 | 5.2 ± 0.6* | 22.7 ± 2.1* | 1.1 ± 0.2 | 3.5 ± 0.5* | Sustained and amplified response in resistant cultivar. |
| NBS-LRR03 | 1.8 ± 0.4 | 2.1 ± 0.3 | 0.9 ± 0.1 | 1.2 ± 0.2 | Not significantly induced; unlikely major player. |
Values are mean ± SD (n=3-5); * indicates statistically significant difference (p < 0.05) from mock-inoculated control.
The expression dynamics can provide clues about the gene's role in the defense hierarchy. Early and transient induction may suggest involvement in initial pathogen recognition, while sustained upregulation might indicate a role in downstream signaling or amplification of the defense response. Correlation between the expression levels of validated NBS genes and the activation of downstream defense markers (e.g., PR1, PR5) strengthens the evidence for their functional role in resistance [63] [68].
Troubleshooting and Technical Notes
- High Variation Among Replicates: Ensure consistent RNA quality, accurate pipetting, and proper homogenization of starting plant material. Biological variation can be minimized by pooling tissue from multiple plants.
- Primer-Dimer Formation in NTC: Redesign primers if primer-dimers are observed. Optimize primer concentrations and ensure the use of a hot-start polymerase.
- No Amplification or Late Ct Values: Check RNA quality and cDNA synthesis efficiency. Verify primer specificity and optimize annealing temperature.
- Inconsistent Reference Gene Expression: Always validate reference gene stability under your specific experimental conditions. Do not rely on housekeeping genes used in unrelated studies.
- Discrepancy with RNA-seq Data: This can occur due to different sensitivities of the platforms or issues with probe specificity. Verify the accuracy of gene models and primer design. qRT-PCR is generally considered more accurate for quantifying specific transcripts.
By rigorously following this detailed protocol, researchers can reliably validate the expression patterns of candidate NBS genes, thereby strengthening the conclusions drawn from transcriptomic studies and identifying high-priority targets for subsequent functional analysis, such as gene silencing or transgenic complementation experiments.
Functional Characterization Through Virus-Induced Gene Silencing (VIGS)
Virus-Induced Gene Silencing (VIGS) has emerged as a powerful functional genomics tool for characterizing nucleotide-binding site-leucine-rich repeat (NBS-LRR) genes identified through differential expression analyses in resistant versus susceptible plant cultivars. This rapid, transient silencing approach enables researchers to directly link specific NBS-LRR genes to disease resistance phenotypes, bypassing the need for stable transformation which remains challenging in many crop species [69] [70]. The integration of VIGS into the study of plant immunity mechanisms provides an efficient platform for validating candidate resistance genes discovered through transcriptomic studies, significantly accelerating the identification of genetic determinants underlying resistant phenotypes observed in comparative expression analyses [71] [1].
The biological foundation of VIGS lies in harnessing the plant's innate post-transcriptional gene silencing (PTGS) machinery, an antiviral defense mechanism. When recombinant viral vectors carrying target gene fragments are introduced into plants, the system processes the viral RNA into small interfering RNAs (siRNAs) that guide sequence-specific degradation of complementary endogenous mRNA transcripts, leading to knock-down of the target gene and potentially revealing its function through observable phenotypic changes [70]. This mechanism is particularly valuable for studying NBS-LRR genes, which constitute the largest class of plant resistance genes and play critical roles in effector-triggered immunity (ETI) against diverse pathogens [1] [14].
VIGS Experimental Workflow for NBS-LRR Gene Validation
The following diagram illustrates the complete experimental workflow for functional characterization of NBS-LRR genes using Tobacco Rattle Virus (TRV)-based VIGS, from vector construction to phenotypic analysis:
Molecular Mechanism of VIGS-Mediated Silencing
The diagram below illustrates the molecular mechanism of VIGS-induced silencing of target NBS-LRR genes at the cellular level:
Key Research Reagents and Solutions
Table 1: Essential Research Reagents for VIGS-Based Functional Characterization of NBS-LRR Genes
| Reagent/Solution | Function/Purpose | Specifications/Concentrations | Application Notes |
|---|---|---|---|
| TRV Vectors (pTRV1, pTRV2) | Bipartite viral vector system for silencing | pTRV1: Represents replication machinery; pTRV2: Carries target gene fragment [70] | Most widely adopted VIGS system; broad host range including Solanaceae and legumes [69] [70] |
| Agrobacterium tumefaciens GV3101 | Delivery vehicle for TRV constructs | OD₆₀₀ = 0.3-1.0 in infiltration buffer [69] | Preferred strain for VIGS; optimized for plant transformation with minimal phytotoxicity |
| Silencing Target Fragment | Specific sequence for NBS-LRR knockdown | 200-500 bp gene-specific region with <70% similarity to non-targets [70] | Clone into pTRV2 using EcoRI/XhoI restriction sites; avoid conserved domains to ensure specificity [69] |
| Infiltration Buffer | Medium for agroinfiltration | 10 mM MES, 10 mM MgCl₂, 150 μM acetosyringone, pH 5.6 [69] | Acetosyringone enhances T-DNA transfer; critical for efficient infection |
| Positive Control Construct (e.g., PDS) | Visual marker for silencing efficiency | TRV2-PDS vector targeting phytoene desaturase [69] | Photobleaching phenotype confirms system functionality; appears 2-3 weeks post-infiltration |
| Negative Control Construct (e.g., empty TRV2) | Control for viral and procedure effects | TRV2 without insert or with non-plant sequence [69] | Essential for distinguishing silencing phenotypes from viral infection symptoms |
Detailed VIGS Protocol for NBS-LRR Gene Validation
Vector Construction and Agrobacterium Preparation
Step 1: Target Fragment Selection and Amplification
- Identify a unique 200-500 bp fragment from the candidate NBS-LRR gene with low similarity to other gene family members to ensure silencing specificity [70]
- Design gene-specific primers with appropriate restriction enzyme sites (e.g., EcoRI and XhoI) for directional cloning into the TRV2 vector [69]
- Amplify the target fragment using high-fidelity DNA polymerase with the following PCR conditions: initial denaturation at 94°C for 3 min; 35 cycles of 94°C for 30s, 55-65°C for 30s, 72°C for 45s; final extension at 72°C for 5-7 min [69]
Step 2: TRV2 Vector Ligation and Transformation
- Digest both the PCR product and pTRV2 vector with selected restriction enzymes (e.g., EcoRI and XhoI) and purify using gel extraction kits [69]
- Perform ligation reaction at 16°C for 16 hours using a 3:1 insert:vector molar ratio
- Transform ligation product into E. coli DH5α competent cells and select on LB plates with appropriate antibiotics (e.g., kanamycin, 50 μg/mL) [69]
- Verify positive clones by colony PCR and Sanger sequencing before plasmid extraction
Step 3: Agrobacterium Transformation and Culture
- Introduce verified recombinant pTRV2 plasmids and pTRV1 into Agrobacterium tumefaciens strain GV3101 through electroporation or freeze-thaw method [69]
- Select transformed colonies on LB medium with appropriate antibiotics (kanamycin 50 μg/mL, rifampicin 25 μg/mL, gentamycin 50 μg/mL)
- For inoculation culture, inoculate 5 mL of liquid LB with antibiotics and incubate at 28°C with shaking at 200 rpm for 24 hours
- Subculture 1 mL of the starter culture into 50 mL of fresh LB with antibiotics and acetosyringone (150 μM) and grow to OD₆₀₀ = 0.4-0.8 [69]
Plant Material Selection and Inoculation
Step 4: Plant Material Preparation
- Select both resistant and susceptible cultivars identified through previous transcriptomic analysis [71]
- For soybean: Use 7-10 day old seedlings with fully expanded cotyledons [69]
- For Solanaceae species (pepper, tomato, eggplant): Use 2-4 true leaf stage plants [70]
- Ensure optimal plant health with adequate nutrition and water before inoculation
Step 5: Agroinfiltration Methods
- Harvest bacterial cells by centrifugation at 3,000 × g for 15 min and resuspend in infiltration buffer (10 mM MES, 10 mM MgCl₂, 150 μM acetosyringone, pH 5.6) to final OD₆₀₀ = 0.3-1.0 [69]
- Mix pTRV1 and pTRV2 (with target insert) cultures in 1:1 ratio and incubate at room temperature for 3-4 hours without shaking
- For cotyledon node method (soybean): Bisect swollen sterilized seeds longitudinally, immerse fresh explants in Agrobacterium suspension for 20-30 minutes [69]
- For leaf infiltration (Solanaceae): Use needleless syringe to infiltrate bacterial suspension through abaxial leaf surface
- Maintain inoculated plants at 19-22°C in high humidity conditions for 2-3 days to facilitate infection, then return to normal growth conditions [70]
Silencing Validation and Phenotypic Analysis
Step 6: Silencing Efficiency Assessment
- Monitor positive control (TRV2-PDS) plants for photobleaching symptoms appearing 14-21 days post-inoculation (dpi) [69]
- At 21 dpi, harvest tissue from silenced and control plants for molecular validation of target gene knock-down
- Extract total RNA and synthesize cDNA for qRT-PCR analysis using gene-specific primers
- Calculate silencing efficiency using the 2^(-ΔΔCt) method comparing TRV2-target gene plants to TRV2-empty controls [69]
Step 7: Pathogen Challenge and Disease Phenotyping
- Prepare pathogen inoculum according to appropriate concentrations:
- Inoculate silenced and control plants using appropriate methods (spray inoculation, leaf clipping, or root dipping)
- Maintain high humidity conditions post-inoculation to promote disease development
- Monitor disease progression and score symptoms using standardized scales:
Table 2: Quantitative Assessment Parameters for VIGS-Mediated Resistance Phenotyping
| Assessment Parameter | Measurement Method | Timing Post-Pathogen Challenge | Expected Outcomes in Susceptible NBS-LRR Silencing |
|---|---|---|---|
| Disease Incidence | Percentage of infected plants | 7, 14, 21 days | Significant increase in susceptible cultivars |
| Disease Severity | Standardized rating scales (0-5 or 0-9) | 7, 14, 21 days | Higher severity scores in silenced resistant cultivars |
| Lesion Size | Measurement of necrotic areas (mm²) | 5, 10, 15 days | Larger lesions in silenced plants |
| Bacterial Population | CFU/g tissue by dilution plating | 3, 7, 14 days | 10-100 fold increase in silenced resistant cultivars |
| Host Gene Expression | qRT-PCR of defense-related genes | 24, 48, 72 hours | Altered expression of defense markers in silenced plants |
| Biomass Reduction | Fresh/dry weight comparison | 21 days | Significant reduction in silenced plants under pathogen pressure |
Step 8: Data Analysis and Interpretation
- Compare disease parameters between silenced and control plants in both resistant and susceptible genetic backgrounds
- Perform statistical analysis (ANOVA followed by Tukey's HSD test) to determine significant differences between treatments
- Correlate the degree of silencing (determined by qRT-PCR) with the magnitude of phenotypic changes
- Interpret results in context of original transcriptomic data: if silencing a NBS-LRR gene that was highly expressed in resistant cultivars converts them to susceptible phenotypes, this provides strong evidence of its essential role in resistance [71] [1]
Troubleshooting and Optimization Strategies
Low Silencing Efficiency:
- Optimize fragment length (200-500 bp) and position within the target gene [70]
- Test different agroinfiltration methods (cotyledon node vs. leaf infiltration) based on species [69]
- Adjust Agrobacterium concentration (OD₆₀₀ = 0.3-1.0) and acetosyringone concentration (100-200 μM) [69]
- Extend the incubation period with Agrobacterium suspension (up to 30 minutes for cotyledon node method) [69]
High Phytotoxicity:
- Reduce Agrobacterium density (OD₆₀₀ = 0.3-0.5)
- Shorten incubation time with bacterial suspension
- Include additional control (empty vector) to distinguish viral symptoms from silencing phenotypes [70]
Variable Silencing Between Plants:
- Standardize plant growth conditions and developmental stage at inoculation
- Ensure consistent infiltration technique and bacterial culture conditions
- Increase sample size to account for biological variation (minimum 10-15 plants per construct) [69]
Rapid Recovery from Silencing:
- Maintain plants at optimal temperatures (19-22°C) to prolong silencing duration [70]
- Schedule pathogen challenge at peak silencing period (14-21 dpi for most systems)
The integration of VIGS technology into the functional characterization pipeline for NBS-LRR genes provides researchers with a powerful approach to rapidly validate candidates identified through differential expression analyses. The protocol outlined here enables direct connection of gene to function, allowing for efficient prioritization of breeding targets. When properly optimized, TRV-based VIGS can achieve 65-95% silencing efficiency [69], sufficient to elicit clear phenotypic changes that demonstrate the functional importance of NBS-LRR genes in disease resistance. This approach is particularly valuable for crop species where stable transformation remains challenging or time-consuming, significantly accelerating the translation of transcriptomic discoveries into practical breeding applications.
Plant immunity often relies on a sophisticated two-layered immune system. The second layer, known as effector-triggered immunity (ETI), is primarily mediated by nucleotide-binding site leucine-rich repeat (NBS-LRR or NLR) proteins, which constitute the largest class of plant resistance (R) proteins [19]. These intracellular receptors recognize pathogen-secreted effectors, triggering a robust immune response frequently accompanied by a hypersensitive response [19]. Association mapping, particularly genome-wide association studies (GWAS), has emerged as a powerful tool for linking polymorphisms in NBS-LRR genes to disease resistance phenotypes across diverse plant species. This approach leverages historical recombination events within natural populations to identify genetic variants associated with resistance, providing higher mapping resolution compared to traditional biparental mapping [72] [73]. The integration of association mapping with transcriptomic analyses of resistant and susceptible cultivars offers a comprehensive framework for identifying functional NBS gene candidates for crop improvement.
Key Concepts and Terminology
Table 1: Glossary of Key Terms in NBS Gene Association Mapping
| Term | Definition | Relevance |
|---|---|---|
| NBS-LRR (NLR) | Nucleotide-binding site leucine-rich repeat proteins; largest class of plant R proteins that function as intracellular immune receptors [19]. | Primary gene family of interest for studying disease resistance mechanisms. |
| Association Mapping (GWAS) | Genome-wide association study; method to identify associations between molecular markers and traits by leveraging linkage disequilibrium in diverse panels [74] [72]. | Core methodology for linking NBS gene polymorphisms to resistance phenotypes. |
| Effector-Triggered Immunity (ETI) | Second layer of plant immunity mediated by R proteins (often NLRs) that recognize specific pathogen effectors [19] [39]. | Key defense mechanism activated by NBS-LRR genes. |
| Quantitative Trait Locus (QTL) | Genomic region associated with variation in a quantitative trait. | Association mapping identifies QTLs often containing NBS-LRR genes [74] [73]. |
| Transcriptome Analysis | Profiling of gene expression levels for all genes in a genome under specific conditions. | Used to compare NBS gene expression in resistant vs. susceptible cultivars [39] [75]. |
| Differentially Expressed Genes (DEGs) | Genes showing statistically significant expression differences between experimental groups. | NBS-LRR genes are frequently identified as DEGs in resistance studies [39] [75]. |
Experimental Protocols and Workflows
Genome-Wide Identification of NBS-LRR Genes
Principle: Comprehensive identification of NBS-LRR gene family members within a plant genome is the foundational step for subsequent association mapping and expression studies.
Protocol:
- Data Retrieval: Obtain the reference genome sequence (e.g., FASTA file) and its corresponding annotation file (GFF/GTF format) for the target species.
- HMMER Search: Use the Hidden Markov Model (HMM) profile of the NB-ARC domain (PF00931) from the Pfam database to scan the proteome with tools like
HMMER(e.g.,hmmsearch). Use an E-value cutoff (e.g., 10⁻⁴) to identify initial candidate genes [19] [14]. - Domain Validation: Submit candidate protein sequences to domain databases (Pfam, SMART) and coiled-coil prediction tools (COILS, DeepCoil) to confirm the presence of characteristic NBS-LRR domains (NBS, LRR, TIR, CC, RPW8) and classify genes into subfamilies (TNL, CNL, RNL) [19] [14].
- Gene Characterization: Analyze the chromosomal location, gene structure (intron/exon), and conserved protein motifs of the identified NBS-LRR genes. Tools like TBtools can be used for visualization [14].
Genome-Wide Association Mapping for Disease Resistance
Principle: This protocol identifies genetic markers (e.g., SNPs) within or near NBS-LRR genes that are statistically associated with disease resistance variation in a diverse panel of genotypes.
Protocol:
- Plant Materials & Phenotyping:
- Assemble an association mapping panel of 200-500 genetically diverse genotypes [74] [72].
- Evaluate resistance using replicated trials across multiple environments and/or with multiple pathogen isolates.
- Record disease severity using standardized scales for both seedling (all-stage resistance) and adult plant resistance [74] [72].
- Genotyping:
- GWAS Analysis:
- Quality Control: Filter markers based on minor allele frequency (e.g., MAF > 5%), missing data (e.g., < 20%), and significant deviation from Hardy-Weinberg equilibrium.
- Population Structure: Account for population stratification using a Kinship (K) matrix and Principal Components (PCs) as covariates in mixed linear models (MLM) to reduce false positives [72] [73].
- Association Testing: Perform association analysis between genotype and phenotype data using models such as MLM. Set a significance threshold, for example, using the Bonferroni correction for multiple testing [72] [73].
- Identification of NBS-LRR Candidates:
- Annotate significantly associated markers by mapping them to the reference genome.
- Identify markers that fall within the genomic regions of previously identified NBS-LRR genes or within a defined linkage disequilibrium decay distance from these genes [73].
Transcriptomic Analysis of NBS-LRR Genes in Resistant vs. Susceptible Cultivars
Principle: This protocol compares the expression patterns of NBS-LRR genes in resistant and susceptible genotypes before and after pathogen challenge to identify candidates with potential functional roles in immunity.
Protocol:
- Experimental Design and Inoculation:
- Select near-isogenic lines (NILs) or cultivars with contrasting resistance (R and S) to the target pathogen [39] [75].
- Grow plants under controlled conditions. Inoculate treatment groups with the pathogen (e.g., by root-dipping, spray-inoculation) and maintain mock-inoculated controls.
- Collect tissue samples at multiple time points post-inoculation (e.g., 0, 12, 24, 48, 72 hours) with biological replicates [39] [75].
- RNA Sequencing:
- Extract total RNA with high integrity (RIN > 7.0) from all samples.
- Prepare RNA-seq libraries and perform high-throughput sequencing on an Illumina platform to generate paired-end reads.
- Bioinformatic Analysis:
- Preprocessing & Mapping: Quality-trim raw reads and map them to the reference genome using aligners like HISAT2 or STAR.
- DEG Identification: Quantify gene expression (e.g., as FPKM or TPM) and identify Differentially Expressed Genes (DEGs) between R and S groups at each time point using tools like DESeq2 or edgeR. A common threshold is |log2FoldChange| > 1 and adjusted p-value < 0.05 [39] [75].
- NBS-LRR Expression Profiling: Cross-reference the list of DEGs with the genome-wide inventory of NBS-LRR genes to identify which NBS-LRRs are differentially expressed.
- Functional Enrichment:
- Perform Gene Ontology (GO) and Kyoto Encyclopedia of Genes and Genomes (KEGG) enrichment analysis on all DEGs to identify over-represented biological processes and pathways, such as "plant-pathogen interaction," "phytohormone signaling," or "phenylpropanoid biosynthesis" [39].
Diagram 1: Integrated Workflow for Linking NBS Genes to Disease Resistance. This diagram outlines the key experimental phases, from gene identification to functional validation, showing how association mapping and transcriptomic analysis converge to identify candidate genes. VIGS: Virus-Induced Gene Silencing.
The Scientist's Toolkit: Research Reagent Solutions
Table 2: Essential Reagents and Tools for NBS Gene Research
| Category / Reagent | Specific Example | Function / Application in Research |
|---|---|---|
| Genotyping | Genotyping-by-Sequencing (GBS) [73] | A cost-effective method for discovering and genotyping large numbers of SNPs in an association mapping panel. |
| Illumina SNP Arrays [72] | Pre-designed arrays (e.g., 9K, 90K wheat arrays) for high-throughput, uniform genome-wide SNP genotyping. | |
| Pathogen Inoculation | Ralstonia solanacearum strain GMI1000 [14] | A bacterial pathogen used for inoculating eggplant in studies of bacterial wilt resistance mediated by NBS genes. |
| Pyrenophora teres f. teres isolates [74] | Fungal pathogen used to screen barley association panels for Net Form Net Blotch (NFNB) resistance. | |
| Expression Analysis | RNA-seq Library Prep Kits | For constructing cDNA libraries from plant RNA for transcriptome sequencing to identify differentially expressed NBS-LRR genes [39] [75]. |
| qRT-PCR Reagents | For validating the expression levels of candidate NBS-LRR genes identified from RNA-seq data [14]. | |
| Functional Validation | Virus-Induced Gene Silencing (VIGS) Vectors | Tobacco rattle virus (TRV)-based vectors used to knock down the expression of candidate NBS genes in plants to test their function in disease resistance [28]. |
| Bioinformatics Tools | HMMER Suite [19] [14] | For identifying NBS-LRR genes in genome sequences using Hidden Markov Models of conserved domains. |
| DESeq2 / edgeR [39] [75] | R/Bioconductor packages for statistical analysis of differential gene expression from RNA-seq count data. | |
| OrthoFinder [28] | For classifying NBS-LRR genes into orthogroups to study evolutionary relationships across species. |
Data Analysis and Interpretation
Integrating data from association mapping and transcriptomics significantly strengthens the case for a NBS-LRR gene's role in resistance. A compelling candidate is one that is both genetically associated with the resistance trait and shows differential expression in response to pathogen challenge.
Table 3: Integrated Analysis of NBS-LRR Genes from Multi-Omics Studies
| Plant Species | Pathogen / Disease | Associated NBS-LRR / QTL | Expression Pattern (Resistant vs. Susceptible) | Proposed Function / Mechanism |
|---|---|---|---|---|
| Cassava [73] | Cassava Brown Streak Disease (CBSD) | QTL on Chr. 11 with NBS-LRR cluster | N/A (GWAS study) | The association suggests the NBS-LRR cluster is involved in resistance to CBSD. |
| Barley [74] | Net Form Net Blotch (NFNB) | 54 QTLs (16 novel) identified via GWAS | N/A (GWAS study) | Pyramiding of multiple QTLs is suggested for durable resistance. |
| Eggplant [14] | Bacterial Wilt (R. solanacearum) | 269 SmNBS genes identified | 9 SmNBSs showed differential expression post-inoculation; EGP05874.1 identified as a key candidate. | EGP05874.1 is hypothesized to mediate the immune response to bacterial invasion. |
| Rice [39] | Bacterial Leaf Streak (BLS) | Xo1 (NBS-LRR) | Differentially Expressed Genes (DEGs) in NILs indicated upregulation of PTI/ETI genes and synthesis of lignin and phytoalexins. | The resistance gene bls2 regulates a multi-layer defense including hormone signaling and structural reinforcement. |
| Medicago truncatula [75] | Spring Black Stem (SBS) | 22 candidate R genes identified | 192 DEGs in resistant genotype vs. 2,908 in susceptible; resistant genotype showed enrichment for cell wall modification. | Resistance is associated with early and targeted defense responses, potentially mediated by specific NLRs. |
Diagram 2: NBS-LRR-Mediated Immune Signaling. Upon pathogen recognition, NBS-LRR activation triggers a complex signaling network that culminates in diverse defense outputs. SA: Salicylic Acid, JA: Jasmonic Acid, ET: Ethylene.
The integration of association mapping and transcriptomic profiling provides a powerful, multi-dimensional approach to dissect the role of NBS-LRR genes in plant disease resistance. GWAS efficiently pinpoints the genomic loci, while transcriptomics reveals the dynamic expression patterns of these genes under pathogen attack. The convergence of evidence from both methods—where a specific NBS-LRR gene is both genetically associated with resistance and differentially expressed—strongly indicates a functional role in the immune response. The candidate genes identified through this integrated pipeline, such as EGP05874.1 in eggplant [14] or those within the QTL on chromosome 11 in cassava [73], serve as high-priority targets for functional validation. Subsequent validation through techniques like VIGS [28] or transgenic complementation is the critical final step to confirm gene function. This consolidated framework accelerates the discovery and deployment of NBS-LRR genes in breeding programs, ultimately contributing to the development of crop varieties with durable and broad-spectrum disease resistance.
Cross-Species Comparative Analysis of Conserved NBS-LRR Orthologs
Nucleotide-binding site-leucine-rich repeat (NBS-LRR) genes represent the largest class of plant disease resistance (R) genes, forming the core of the plant immune system against diverse pathogens. This application note provides a comprehensive framework for conducting cross-species comparative analysis of conserved NBS-LRR orthologs, with emphasis on identifying candidate genes underlying differential disease resistance between plant genotypes. We integrate genomic, transcriptomic, and functional validation approaches to enable researchers to identify evolutionarily conserved NBS-LRR orthologs with potential applications in crop improvement and disease resistance breeding.
Plants have evolved a sophisticated two-layer immune system to combat pathogen infection. The second layer, known as effector-triggered immunity (ETI), is primarily mediated by intracellular receptors encoded by NBS-LRR genes [76]. These genes are characterized by a conserved nucleotide-binding site (NBS) domain and a highly variable leucine-rich repeat (LRR) domain responsible for pathogen recognition [76]. NBS-LRR genes are divided into subclasses based on their N-terminal domains: TIR-NBS-LRR (TNL), CC-NBS-LRR (CNL), and RPW8-NBS-LRR (RNL) [76] [23].
Cross-species comparative analysis of NBS-LRR orthologs enables researchers to identify evolutionarily conserved resistance genes that have been maintained across related species, often indicating important functional roles in plant immunity. This approach is particularly valuable when studying differential resistance to pathogens in crop plants and their wild relatives [16] [77]. The following sections provide detailed protocols and resources for conducting such analyses.
Table 1: Comparative NBS-LRR Gene Distribution Across Plant Species
| Plant Species | Total NBS-LRR Genes | CNL | TNL | RNL | Chromosomal Distribution | Key Features |
|---|---|---|---|---|---|---|
| Secale cereale (Rye) | 582 | 581 | 0 | 1 | Highest density on chromosome 4 | Greater number than barley and diploid wheat; 382 ancestral lineages inherited |
| Vernicia montana (Tung tree) | 149 | 98* | 12* | - | Distributed across 11 chromosomes | Contains TIR domains; resistant to Fusarium wilt |
| Vernicia fordii (Tung tree) | 90 | 49* | 0 | - | Distributed across 11 chromosomes | Lacks TIR domains; susceptible to Fusarium wilt |
| Nicotiana benthamiana | 156 | 25 | 5 | 4* | - | Model plant for plant-pathogen interactions |
| Dioscorea rotundata (Yam) | 167 | 166 | 0 | 1 | 25 multigene clusters | No TNL genes detected; 124 genes in clusters |
| Arachis duranensis (Peanut) | 393 | Majority | Minority | - | - | Diploid ancestor of cultivated peanut |
| Arachis ipaënsis (Peanut) | 437 | Majority | Minority | - | More gene clusters than A. duranensis | Increased tandem duplication events |
Note: Values with asterisk () indicate counts of genes containing specific domains rather than full-length genes. CNL=CC-NBS-LRR; TNL=TIR-NBS-LRR; RNL=RPW8-NBS-LRR*
The distribution of NBS-LRR genes varies significantly across plant species, reflecting their distinct evolutionary paths and adaptation to different pathogenic pressures. Monocot species like Secale cereale and Dioscorea rotundata typically lack TNL genes, while eudicots maintain both CNL and TNL subclasses [76] [23]. Comparative analysis of resistant and susceptible genotypes within the same species, such as Vernicia montana (resistant) and Vernicia fordii (susceptible) to Fusarium wilt, reveals how NBS-LRR repertoire differences may correlate with disease resistance [16].
Ortholog Identification and Evolutionary Analysis
Genomic Identification of NBS-LRR Genes
Protocol 1: Genome-Wide Identification of NBS-LRR Genes
Data Acquisition: Download genome sequences and annotation files from public databases (e.g., NCBI, Ensembl Plants, Phytozome).
Domain Search: Use HMMER software to search against the NB-ARC domain (Pfam: PF00931) with E-value < 1.0 [76] [5].
BLAST Validation: Perform BLASTp search using obtained sequences as queries against the same proteome.
Domain Verification: Confirm domain presence using HMMscan against Pfam database (E-value < 0.0001) [76].
Additional Domain Identification: Scan for CC, TIR (PF01582), RPW8 (PF05659), and LRR domains using CDD and SMART tools [5] [23].
Manual Curation: Remove genes without conserved NBS domain and classify based on domain architecture.
Workflow 1: Ortholog Identification and Evolutionary Analysis
Orthogroup and Phylogenetic Analysis
Protocol 2: Cross-Species Ortholog Identification
Orthogroup Construction: Use OrthoFinder v2.5.1 with DIAMOND for sequence similarity searches and MCL for clustering [28].
Multiple Sequence Alignment: Align protein sequences using MAFFT or ClustalW [76] [5].
Phylogenetic Tree Construction: Build maximum likelihood trees using IQ-TREE or MEGA [76].
Synteny Analysis: Identify conserved genomic blocks using MCScanX or similar tools.
Ancestral State Reconstruction: Infer ancestral NBS-LRR lineages and species-specific inheritance patterns.
Phylogenetic analysis of NBS-LRR genes from Secale cereale, Hordeum vulgare (barley), and Triticum urartu (diploid wheat) revealed that at least 740 NBS-LRR lineages were present in their common ancestor, with only 65 preserved in all three species [76]. This indicates significant species-specific gene loss and retention, with S. cereale inheriting 382 ancestral lineages, 120 of which were lost in both barley and wheat [76].
Differential Expression Analysis in Resistant vs. Susceptible Genotypes
Table 2: Expression Profiling of NBS-LRR Genes in Resistant and Susceptible Genotypes
| Plant System | Resistant Genotype | Susceptible Genotype | Pathogen | Key Findings |
|---|---|---|---|---|
| Vernicia spp. (Tung tree) | V. montana | V. fordii | Fusarium wilt | Vm019719 upregulated in V. montana; ortholog Vf11G0978 downregulated in V. fordii |
| Solanum phureja (Potato) | i-0144787 | i-0144786 | Globodera rostochiensis (nematode) | Multiple differentially expressed NBS-LRR genes identified in root transcriptomes |
| Arachis spp. (Peanut) | A. duranensis | A. hypogaea Luhua14 | Aspergillus flavus | Continuous upregulation in wild species; temporal response in cultivated peanut |
| Oryza sativa (Rice) | BR2655 | HR12 | Magnaporthe oryzae (blast) | 22 LRR-containing transcripts upregulated in resistant line; different expression profiles |
Transcriptomic Profiling Protocol
Protocol 3: Differential Expression Analysis of NBS-LRR Genes
Experimental Design: Select resistant and susceptible genotypes with contrasting responses to specific pathogens [8] [78].
Pathogen Inoculation: Inoculate plants with pathogen and appropriate mock controls.
- Example: For nematode resistance in potato, inoculate roots with Globodera rostochiensis pathotype Ro1 [8].
Tissue Sampling: Collect tissues at multiple time points post-inoculation.
- Recommended: 24h intervals for dynamic response capture [78].
RNA Extraction: Use standardized kits (e.g., RNeasy Plant Mini Kit) with quality control [78].
Library Preparation and Sequencing: Prepare libraries using NEBNext Ultra RNA Library Prep Kit and sequence on Illumina platforms [78].
Bioinformatic Analysis:
- Map reads to reference genome using CLC Genomics Workbench or similar tools [78]
- Identify differentially expressed genes (DEGs) with thresholds (e.g., log2FC ≥ 3, p ≤ 0.05) [78]
- Extract NBS-LRR genes from DEGs using keyword searches ("LRR", "Resistance") [78]
- Validate expression patterns via qRT-PCR
Workflow 2: Transcriptomic Analysis of NBS-LRR Genes
Functional Validation Protocols
Virus-Induced Gene Silencing (VIGS)
Protocol 4: Functional Validation Using VIGS
Candidate Gene Selection: Prioritize NBS-LRR genes showing differential expression and evolutionary conservation.
Vector Construction:
- Clone 150-300 bp gene-specific fragment into TRV-based VIGS vector [16]
- Verify construct by sequencing
Agrobacterium Transformation:
- Introduce vector into Agrobacterium tumefaciens strain GV3101
- Grow cultures to OD600 = 1.0-1.5 in LB medium with appropriate antibiotics
Plant Infiltration:
- Resuspend bacteria in infiltration buffer (10 mM MgCl2, 10 mM MES, 200 μM acetosyringone)
- Infiltrate leaves of 2-3 week-old plants using needleless syringe
Pathogen Challenge:
- Inoculate silenced plants with target pathogen after 2-3 weeks
- Monitor disease symptoms and quantify pathogen biomass
Molecular Confirmation:
- Verify gene silencing efficiency using qRT-PCR
- Assess expression of defense marker genes
In Vernicia montana, VIGS of Vm019719 (an NBS-LRR gene) demonstrated its essential role in resistance to Fusarium wilt, as silenced plants showed increased susceptibility [16]. Similarly, silencing of GaNBS (OG2) in resistant cotton increased vulnerability to cotton leaf curl disease [28].
Promoter Analysis and Regulatory Mechanisms
Protocol 5: Promoter cis-Element Analysis
Promoter Sequence Extraction: Obtain 1500-2000 bp upstream sequences of start codons of target NBS-LRR genes.
cis-Element Identification: Use PlantCARE database to identify regulatory elements [5].
Transcription Factor Binding Site Prediction: Analyze for specific motifs (e.g., W-box for WRKY transcription factors).
Experimental Validation:
- Conduct electrophoretic mobility shift assays (EMSA) for protein-DNA interaction
- Perform dual-luciferase reporter assays for promoter activity
In the tung tree system, the orthologous pair Vf11G0978-Vm019719 showed distinct expression patterns correlated with promoter differences. The resistant allele Vm019719 contains a W-box element that binds VmWRKY64, while the susceptible allele Vf11G0978 has a deletion in this element, rendering it unresponsive [16].
The Scientist's Toolkit: Research Reagent Solutions
Table 3: Essential Research Reagents for NBS-LRR Ortholog Analysis
| Reagent/Resource | Function/Application | Example Sources/Protocols |
|---|---|---|
| HMMER Suite | Identification of NBS domains using hidden Markov models | Pfam NB-ARC domain (PF00931) [76] [5] |
| OrthoFinder | Orthogroup inference across multiple species | Diamond for sequence searches, MCL for clustering [28] |
| IQ-TREE/MEGA | Phylogenetic analysis of NBS-LRR genes | Maximum likelihood trees, model selection [76] [5] |
| TRV VIGS Vectors | Functional validation through gene silencing | pTRV1/pTRV2 vectors for N. benthamiana and other plants [16] |
| PlantCARE Database | Identification of cis-regulatory elements in promoters | Online tool for promoter analysis [5] |
| RNASeq Kits | Transcriptome profiling of resistant/susceptible genotypes | NEBNext Ultra RNA Library Prep Kit [78] |
| CLC Genomics Workbench | Differential expression analysis | Reference-based assembly and DEG identification [78] |
Cross-species comparative analysis of conserved NBS-LRR orthologs provides a powerful approach for identifying key regulators of disease resistance in plants. By integrating evolutionary analysis with transcriptomic profiling and functional validation, researchers can prioritize candidate genes for crop improvement. The protocols and resources outlined in this application note establish a comprehensive framework for conducting such analyses across diverse plant-pathogen systems, ultimately facilitating the development of disease-resistant crop varieties through marker-assisted breeding and genetic engineering.
Developing Molecular Markers from Validated NBS Genes for Breeding Programs
Nucleotide-binding site (NBS) domain genes constitute a major superfamily of plant resistance (R) genes that play a critical role in defense responses against pathogens [28]. These genes, particularly those belonging to the NLR (Nucleotide-binding Leucine-Rich Repeat) family, function as key immune receptors for effector-triggered immunity (ETI) [28]. The significant expansion and diversification of the NLR family across flowering plants, compared to the smaller repertoires in ancestral lineages like bryophytes, underscores their evolutionary importance in plant adaptation [28]. In the context of a broader thesis on the differential expression of NBS genes, comparing resistant and susceptible cultivars provides a powerful foundation for identifying candidate genes. Such comparative analyses, like those conducted in wheat against leaf rust, can reveal crucial differences in the timely recognition of pathogens and the rapid activation of defense mechanisms between resistant and susceptible plants [41]. This application note details the protocols for translating the findings from such differential expression analyses into robust molecular markers for marker-assisted selection (MAS) in breeding programs, enabling the development of crops with durable disease resistance.
Application Notes
From Differential Expression to Marker Development
The journey from gene expression analysis to functional molecular markers involves a multi-stage process, beginning with the genome-wide identification and profiling of NBS genes. A comparative analysis of NBS genes across 34 plant species identified 12,820 genes with both classical and novel domain architectures, highlighting the significant diversity within this gene family [28]. The core of the process lies in contrasting the expression profiles of these genes between resistant and susceptible cultivars under pathogen challenge. For instance, in wheat, a comparative gene expression analysis after leaf rust infection used EST (Expressed Sequence Tag) sequencing from near-isogenic lines, identifying 14,268 unigenes and confirming the differential expression of selected candidates through RT-PCR [41]. Similarly, expression profiling of orthogroups (OGs) in cotton under cotton leaf curl disease (CLCuD) indicated the putative upregulation of specific OGs (such as OG2, OG6, and OG15) in different tissues under various biotic and abiotic stresses [28].
Following identification, the next critical step is the discovery of polymorphisms, such as SNPs (Single Nucleotide Polymorphisms), within the candidate genes. A genetic variation analysis between susceptible (Coker 312) and tolerant (Mac7) Gossypium hirsutum accessions identified several unique variants in the NBS genes of Mac7 (6,583 variants) and Coker 312 (5,173 variants) [28]. Finally, the functional role of the candidate gene in the resistance mechanism must be validated. Virus-induced gene silencing (VIGS) of GaNBS (OG2) in resistant cotton demonstrated its putative role in controlling the viral titer, confirming its importance in the defense response [28].
Molecular Marker Types and Applications
Molecular markers developed from validated NBS genes can take several forms, each with specific applications in breeding. Genome-wide association studies (GWAS) have become a widely used method for identifying markers linked to resistance. For example, a GWAS on 306 soybean germplasms for resistance to the soybean cyst nematode (SCN) identified 77 significant SNPs and 117 candidate genes [79]. Two primary types of PCR-based markers derived from SNPs are particularly useful for breeding:
- KASP Markers: The aforementioned soybean
SCNstudy developed twoKASPmarkers (S19_rs8522772andS19_rs8384176) closely linked to resistance.KASPis a fluorescence-based technology ideal for high-throughput, low-cost genotyping of a fewSNPsacross many individuals [79]. - CAPS Markers: The same study also developed four
CAPSmarkers (S19_rs838271,S19_rs8522589,S19_rs8466511, andS19_rs8481473).CAPSmarkers are based onPCRamplification followed by restriction enzyme digestion, which reveals polymorphisms based on the presence or absence of restriction sites [79].
These markers enable the precise selection of parental lines and progeny carrying the desired resistance alleles, significantly accelerating the breeding cycle.
Experimental Protocols
Protocol I: Genome-Wide Identification and Expression Profiling of NBS Genes
Objective: To identify and classify NBS-encoding genes in a target plant species and analyze their expression patterns in resistant and susceptible cultivars under pathogen stress.
Materials:
- Plant materials: Resistant and susceptible cultivars (e.g., near-isogenic lines).
- Pathogen inoculum.
- RNA/DNA extraction kits.
- High-performance computing cluster for bioinformatic analysis.
- Software: PfamScan, OrthoFinder, MAFFT, FastTreeMP.
Methodology:
- Identification and Classification:
a. Obtain the latest genome assembly for the target species from databases like
NCBIor Phytozome [28]. b. Identify genes containing theNBS(NB-ARC) domain using thePfamScanscript with thePfam-A.hmmmodel (e-value ≤1.1e-50) [28]. c. Classify the identified genes based on their domain architecture (e.g.,TIR-NBS-LRR,CC-NBS-LRR) [28]. - Evolutionary and Orthogroup Analysis:
a. Perform orthogroup analysis using OrthoFinder with the
Diamondtool for sequence similarity and theMCLalgorithm for clustering [28]. b. Construct a phylogenetic tree using maximum likelihood methods (e.g., FastTreeMP) with 1000 bootstraps [28]. - Expression Profiling:
a. Treat resistant and susceptible plants with the pathogen and collect tissue samples at multiple time points post-inoculation (e.g., 0, 8, 16, 20, 48 hours) [41].
b. Extract total
RNAand sequence usingRNA-seqtechnology. c. Retrieve or calculateFPKM(Fragments Per Kilobase of transcript per Million mapped reads) values from relevant databases or processedRNA-seqdata [28]. d. Create heatmaps to visualize the differential expression ofNBSgenes across tissues, biotic, and abiotic stresses.
Protocol II: GWAS and Molecular Marker Development
Objective: To identify significant marker-trait associations for disease resistance and develop breeder-friendly KASP and CAPS markers.
Materials:
- A diverse panel of germplasm (e.g., 306 soybean accessions).
- Facilities for phenotyping (e.g., disease nurseries).
- High-density
SNPmarker dataset (e.g., from whole-genome sequencing). GWASsoftware (e.g.,GAPIT,TASSEL).KASPgenotyping assay mix and real-timePCRsystem.- Restriction enzymes, thermal cycler, and gel electrophoresis system.
Methodology:
- Phenotyping:
a. Grow the germplasm panel in a replicated design in a disease field nursery.
b. Inoculate with the pathogen and evaluate resistance using a relevant metric. For
SCN, this is the Female Index (FI), which quantifies nematode reproduction on roots [79]. - Genome-Wide Association Study (
GWAS): a. PerformGWASusing a model like the compressed mixed linear model (cMLM) to identifySNPssignificantly associated with the resistance trait [79]. b. Identify candidate genes located in the genomic regions of the significantSNPs. - Marker Development:
a. For
KASPmarkers: Design competitive allele-specific primers for the significantSNPs. PerformKASPgenotyping per the manufacturer's protocol, which uses fluorescence resonance energy transfer to distinguish alleles [79]. b. ForCAPSmarkers: DesignPCRprimers flanking the targetSNP. Amplify the genomic region viaPCR. Digest thePCRproducts with a restriction enzyme that cuts one allele but not the other. Separate the fragments using gel electrophoresis to reveal polymorphic bands [79].
Data Presentation
Table 1: Key NBS Gene Classes and Their Functional Roles in Plant Immunity
| Gene Class / Domain Architecture | Putative Role in Defense | Expression Profile (Example) | Validation Method |
|---|---|---|---|
TIR-NBS-LRR (TNL) |
Effector recognition; activation of ETI [28] |
Upregulated in resistant cultivar after infection [28] | VIGS [28] |
CC-NBS-LRR (CNL) |
Effector recognition; activation of ETI [28] |
Upregulated in resistant cultivar after infection [28] | VIGS [28] |
| NBS-LRR | Effector recognition; activation of ETI [28] |
Differentially expressed in resistant vs. susceptible [41] [28] | RT-PCR [41] |
| TIR-NBS-TIR-Cupin_1 | Species-specific resistance function [28] | Tissue-specific expression [28] | Functional analysis |
| NBS (no additional domains) | Signaling component in defense network [28] | Constitutive or induced expression | Protein interaction assays [28] |
Table 2: Comparison of Molecular Marker Platforms for Breeding Applications
| Feature | KASP Markers | CAPS Markers |
|---|---|---|
| Principle | Fluorescence-based allele-specific PCR [79] |
PCR + Restriction Fragment Length Polymorphism (PCR-RFLP) [79] |
| Throughput | High-throughput | Medium-throughput |
| Cost | Low per data point | Moderate |
| Technology Requirement | Real-time PCR instrument |
Thermal cycler, gel electrophoresis |
| Key Application | High-volume genotyping of few target loci [79] | Validation, mapping, when equipment is limited [79] |
| Example | S19_rs8522772 for SCN resistance [79] |
S19_rs838271 for SCN resistance [79] |
Workflow and Pathway Visualizations
The Scientist's Toolkit: Research Reagent Solutions
Table 3: Essential Research Reagents and Materials for NBS Gene and Marker Studies
| Reagent / Material | Function / Application | Key Considerations |
|---|---|---|
| High-Quality Genomic DNA | Substrate for GWAS, PCR, and marker development. |
Purity and integrity are critical for PCR efficiency and GWAS accuracy [79]. |
| Total RNA Extraction Kits | Isolation of intact RNA for transcriptome sequencing (RNA-seq). |
Must prevent RNase degradation for accurate FPKM calculation [41] [28]. |
| Pfam-A.hmm Model | Bioinformatics resource for identifying NBS (NB-ARC) domains in protein sequences. |
Used with PfamScan at a stringent e-value (e.g., 1.1e-50) [28]. |
| KASP Assay Mix | Fluorescence-based genotyping chemistry for high-throughput SNP scoring. |
Requires a real-time PCR instrument capable of detecting fluorescence [79]. |
| Restriction Endonucleases | Enzyme for digesting PCR products in CAPS marker analysis. |
Selection depends on the SNP creating or abolishing a specific restriction site [79]. |
| cDNA Synthesis Kit | Reverse transcription of RNA to cDNA for RT-PCR validation. |
Essential for confirming differential expression of NBS genes [41]. |
Conclusion
Differential expression analysis of NBS genes provides powerful insights into the molecular mechanisms of disease resistance in plants. By integrating foundational knowledge with advanced transcriptomic methodologies, researchers can effectively identify key resistance genes that distinguish resistant from susceptible cultivars. The consistent finding of specific NBS-LRR gene upregulation in resistant genotypes, coupled with successful functional validation through techniques like VIGS, confirms the critical role these genes play in plant immunity. Future directions should focus on multi-omics integration, understanding regulatory networks including miRNA-mediated control of NBS genes, and translating these discoveries into practical breeding applications through marker development and gene pyramiding strategies. This approach will accelerate the development of durable disease-resistant crop varieties, enhancing global food security through reduced pesticide dependency and improved sustainable agriculture practices.
References
- 1. Genome-wide analysis of NBS-LRR genes revealed ... [https://www.frontiersin.org/journals/plant-science/articles/10.3389/fpls.2023.1091567/full]
- 2. Genome-Wide Characterization and Expression Pattern ... [https://www.mdpi.com/1422-0067/26/18/9063]
- 3. Phylogenetic, Structural, and Evolutionary Insights into ... [https://pmc.ncbi.nlm.nih.gov/articles/PMC11899730/]
- 4. Non-canonical mechanisms of effector-triggered immunity [https://www.sciencedirect.com/science/article/pii/S1369526625001268]
- 5. Genome-wide identification and characterization of NBS ... [https://www.nature.com/articles/s41598-025-03507-5]
- 6. The Eucalyptus grandis NBS-LRR Gene Family: Physical ... [https://www.frontiersin.org/journals/plant-science/articles/10.3389/fpls.2015.01238/full]
- 7. Bioinformatics analysis and function prediction of NBS ... [https://pubmed.ncbi.nlm.nih.gov/36357714/]
- 8. Differential expression of NBS-LRR-encoding genes in ... [https://pmc.ncbi.nlm.nih.gov/articles/PMC5751396/]
- 9. Identification and distribution of the NBS-LRR gene family in ... [https://bmcgenomics.biomedcentral.com/articles/10.1186/s12864-015-1554-9]
- 10. Genome-Wide Analysis of NBS-LRR Genes From an Early ... [https://pmc.ncbi.nlm.nih.gov/articles/PMC9140740/]
- 11. Genome-wide analysis of NBS-LRR genes revealed ... [https://pmc.ncbi.nlm.nih.gov/articles/PMC9986449/]
- 12. Genome-wide analysis of NBS-LRR genes in Rosaceae ... [https://pmc.ncbi.nlm.nih.gov/articles/PMC9685399/]
- 13. Differential expression of NBS-LRR-encoding genes in the ... [https://bmcplantbiol.biomedcentral.com/articles/10.1186/s12870-017-1193-1]
- 14. Genome-Wide Analysis Revealed NBS-LRR Gene ... [https://www.mdpi.com/2073-4395/13/10/2583]
- 15. Genome-Wide Identification of NBS-LRR Family in Three ... [https://www.mdpi.com/2073-4425/16/6/680]
- 16. Functional characterization of NBS-LRR genes reveals an ... [https://pmc.ncbi.nlm.nih.gov/articles/PMC10898138/]
- 17. Species-specific duplications driving the recent expansion of ... [https://bmcgenomics.biomedcentral.com/articles/10.1186/s12864-015-1291-0]
- 18. A Genome-Wide Comparison of NB-LRR Type ... [https://www.sciencedirect.com/science/article/pii/S1016847823071157]
- 19. Genome-Wide Characterization and Expression Pattern ... [https://pmc.ncbi.nlm.nih.gov/articles/PMC12469828/]
- 20. Plant NBS-LRR proteins: adaptable guards - Genome Biology [https://genomebiology.biomedcentral.com/articles/10.1186/gb-2006-7-4-212]
- 21. Transcriptome analysis reveals genes associated with late ... [https://www.nature.com/articles/s41598-024-60608-3]
- 22. The Biological Roles of Puccinia striiformis f. sp. tritici ... [https://pmc.ncbi.nlm.nih.gov/articles/PMC10296696/]
- 23. Genome-Wide Identification and Evolutionary Analysis of ... [https://www.frontiersin.org/journals/genetics/articles/10.3389/fgene.2020.00484/full]
- 24. Functional characterization of NBS-LRR genes reveals an ... [https://bmcbiol.biomedcentral.com/articles/10.1186/s12915-024-01836-x]
- 25. Plant NBS-LRR proteins in pathogen sensing and host defense [https://pmc.ncbi.nlm.nih.gov/articles/PMC1973153/]
- 26. Genetic Analysis of Partially Resistant and Susceptible ... [https://pmc.ncbi.nlm.nih.gov/articles/PMC10816841/]
- 27. Genetic variation for disease resistance and tolerance ... [https://pmc.ncbi.nlm.nih.gov/articles/PMC123246/]
- 28. Comparative analysis, diversification, and functional ... [https://www.nature.com/articles/s41598-024-62876-5]
- 29. Two linked pairs of Arabidopsis TNL resistance genes ... [https://www.nature.com/articles/ncomms7338]
- 30. Identification and Characterization of NBS Resistance ... [https://www.frontiersin.org/journals/plant-science/articles/10.3389/fpls.2021.758559/full]
- 31. Identification, characterization, and validation of NBS ... [https://pmc.ncbi.nlm.nih.gov/articles/PMC10318170/]
- 32. Comparative Transcriptome Analysis Provides Insights into ... [https://pmc.ncbi.nlm.nih.gov/articles/PMC9101505/]
- 33. Comparative Transcriptome Analysis of Resistant and ... [https://www.frontiersin.org/journals/plant-science/articles/10.3389/fpls.2015.01173/full]
- 34. Transcriptome analysis reveals key defense genes associated ... [https://bmcgenomics.biomedcentral.com/articles/10.1186/s12864-025-12056-0]
- 35. Clinical applications of and molecular insights from RNA ... [https://genomemedicine.biomedcentral.com/articles/10.1186/s13073-025-01494-w]
- 36. A Beginner's Guide to Analysis of RNA Sequencing Data [https://pmc.ncbi.nlm.nih.gov/articles/PMC6096346/]
- 37. RNA-Seq and Gene Regulatory Network Analyses Uncover ... [https://pmc.ncbi.nlm.nih.gov/articles/PMC8960243/]
- 38. Evolution patterns of NBS genes in the genus Dendrobium ... [https://bmcplantbiol.biomedcentral.com/articles/10.1186/s12870-022-03904-2]
- 39. Transcriptome analysis of rice resistant and susceptible ... [https://www.frontiersin.org/journals/plant-science/articles/10.3389/fpls.2025.1610315/full]
- 40. Comparative RNA-Seq Analysis Uncovers a Complex ... [https://www.nature.com/articles/s41598-017-09945-0]
- 41. Comparative Gene Expression Analysis of Susceptible and ... [https://pmc.ncbi.nlm.nih.gov/articles/PMC2920755/]
- 42. a practical guide to RNA sequencing data analysis [https://pmc.ncbi.nlm.nih.gov/articles/PMC12599993/]
- 43. Visualization methods for differential expression analysis [https://bmcbioinformatics.biomedcentral.com/articles/10.1186/s12859-019-2968-1]
- 44. Divergent molecular pathways govern temperature ... [https://www.nature.com/articles/s41467-025-60030-x]
- 45. Multi-omic network inference from time-series data [https://www.nature.com/articles/s41540-025-00591-1]
- 46. An incremental framework for batch effect correction in DNA ... [https://pmc.ncbi.nlm.nih.gov/articles/PMC12495439/]
- 47. NBS-LRR genes of Musa acuminata is involved in disease ... [https://www.sciencedirect.com/science/article/abs/pii/S0304423824005181]
- 48. 11 Summarising quantitative data | Scientific Research and ... [https://bookdown.org/pkaldunn/SRM-Textbook/SummariseQuantData.html]
- 49. Summarising quantitative data [https://www.healthknowledge.org.uk/e-learning/statistical-methods/practitioners/summarising-quantitative-data]
- 50. Genome-wide identification, characterization, and ... [https://pubmed.ncbi.nlm.nih.gov/36538175/]
- 51. Genome-Wide Identification and Expression Analysis of the ... [https://pmc.ncbi.nlm.nih.gov/articles/PMC10045381/]
- 52. Genome-Wide Identification of NBS-LRR Family in Three ... [https://pmc.ncbi.nlm.nih.gov/articles/PMC12192410/]
- 53. PRGminer: harnessing deep learning for the prediction of ... [https://www.frontiersin.org/journals/plant-science/articles/10.3389/fpls.2025.1411525/full]
- 54. aPEAch: Automated Pipeline for End-to-End Analysis of ... [https://pmc.ncbi.nlm.nih.gov/articles/PMC11273691/]
- 55. paralogs and isoforms classifier based on machine- ... [https://pmc.ncbi.nlm.nih.gov/articles/PMC8529730/]
- 56. Comparative transcriptomes reveal insights into different host ... [https://bmcplantbiol.biomedcentral.com/articles/10.1186/s12870-025-06553-3]
- 57. Molecular Networks Underlying Wheat Resistance and ... [https://www.mdpi.com/2036-7481/16/11/242]
- 58. A wheat CC-NBS-LRR protein Ym1 confers WYMV ... [https://www.nature.com/articles/s41467-025-58816-0]
- 59. Phylogenetic, Structural, and Evolutionary Insights into ... [https://www.mdpi.com/1422-0067/26/5/1828]
- 60. Identification and Characterization of NBS Resistance ... [https://pmc.ncbi.nlm.nih.gov/articles/PMC8585750/]
- 61. HebQTLs reveal intra-subgenome regulation inducing ... [https://genomebiology.biomedcentral.com/articles/10.1186/s13059-025-03694-4]
- 62. Whole genome sequencing reveals transcriptional and ... [https://www.nature.com/articles/s41598-025-18334-x]
- 63. Transcriptome analysis of rice resistant and susceptible ... [https://pmc.ncbi.nlm.nih.gov/articles/PMC12489515/]
- 64. Transcriptome analysis reveals key defense genes associated ... [https://pmc.ncbi.nlm.nih.gov/articles/PMC12465310/]
- 65. Transcriptomic analysis of rice cultivars with distinct resistance ... [https://pmc.ncbi.nlm.nih.gov/articles/PMC12459299/]
- 66. A wheat CC-NBS-LRR protein Ym1 confers WYMV resistance ... [https://pmc.ncbi.nlm.nih.gov/articles/PMC12003722/]
- 67. Differential Gene Expression Analysis of Wheat Breeding ... [https://www.mdpi.com/2073-4395/10/12/1888]
- 68. Gene expression analysis of resistant and susceptible rice ... [https://bmcgenomics.biomedcentral.com/articles/10.1186/s12864-022-08524-6]
- 69. Efficient Virus-Induced Gene Silencing (VIGS) Method for ... [https://pmc.ncbi.nlm.nih.gov/articles/PMC12115190/]
- 70. Virus-Induced Gene Silencing (VIGS) in Functional Genomics [https://www.mdpi.com/2311-7524/11/11/1297]
- 71. Transcriptomic analysis of resistant and susceptible ... [https://pmc.ncbi.nlm.nih.gov/articles/PMC7297882/]
- 72. Genome-wide association mapping for the identification of ... [https://pmc.ncbi.nlm.nih.gov/articles/PMC11893644/]
- 73. Genome-wide association mapping and ... [https://www.nature.com/articles/s41598-018-19696-1]
- 74. Genome-wide association mapping of net form net blotch ... [https://www.frontiersin.org/journals/agronomy/articles/10.3389/fagro.2025.1525588/full]
- 75. Transcriptome analysis of resistant and susceptible Medicago ... [https://bmcplantbiol.biomedcentral.com/articles/10.1186/s12870-024-05444-3]
- 76. Genome-wide Identification and Evolutionary Analysis of NBS ... [https://pmc.ncbi.nlm.nih.gov/articles/PMC8630680/]
- 77. Comparative analysis of NBS-LRR genes and their response ... [https://journals.plos.org/plosone/article?id=10.1371/journal.pone.0171181]
- 78. In silico modelling and characterization of eight blast resistance ... [https://jgeb.springeropen.com/articles/10.1186/s43141-020-00076-0]
- 79. Genome‐wide association study and molecular marker ... [https://pmc.ncbi.nlm.nih.gov/articles/PMC12340342/]