Deep Learning and Computer Vision in Plant Phenotyping: Methods, Applications, and Future Directions
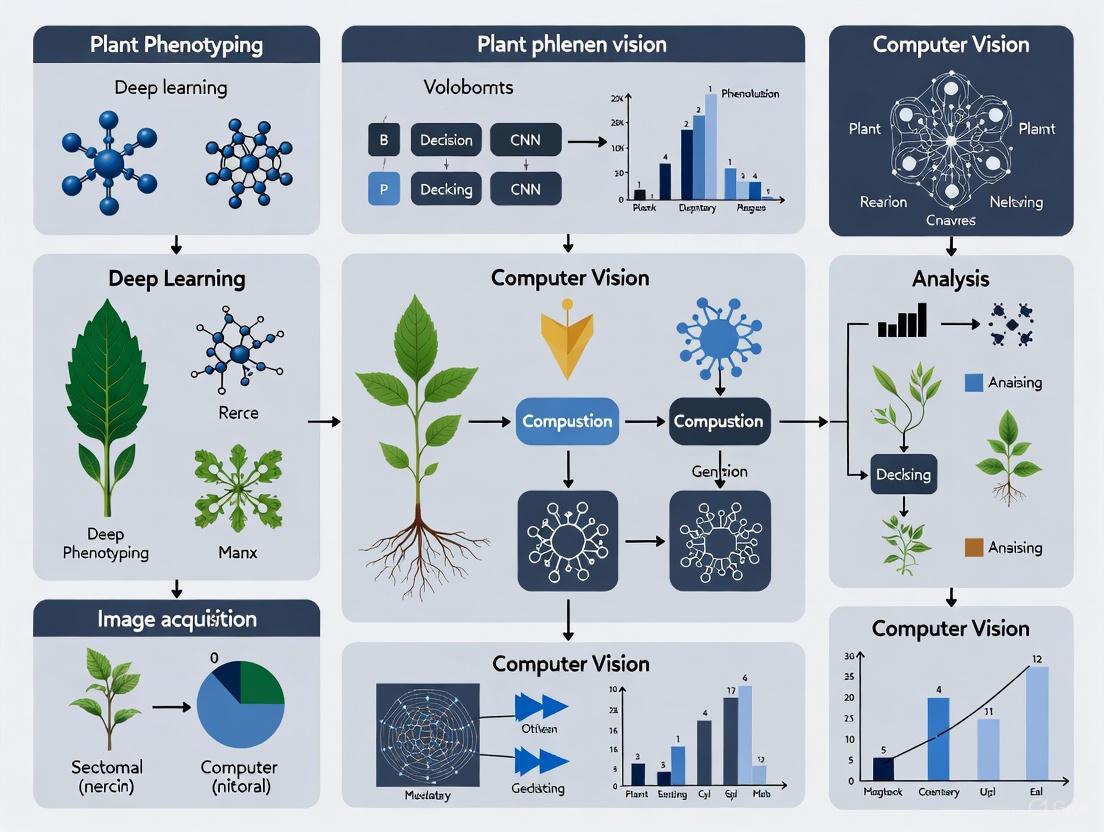
This article provides a comprehensive review of modern plant phenotyping methods leveraging deep learning and computer vision.
Deep Learning and Computer Vision in Plant Phenotyping: Methods, Applications, and Future Directions
Abstract
This article provides a comprehensive review of modern plant phenotyping methods leveraging deep learning and computer vision. It explores the foundational principles driving the shift from manual to automated, high-throughput systems and details the application of specific neural network architectures like CNNs, RNNs, and Transformers for tasks ranging from disease detection to morphological analysis. The content addresses critical challenges such as data scarcity, model generalization, and interpretability, offering troubleshooting and optimization strategies. Finally, it presents a comparative analysis of model performance across different conditions and datasets, benchmarking state-of-the-art approaches to guide researchers and professionals in selecting and validating methods for robust, real-world deployment.
From Manual Measurements to AI-Driven Insights: The Foundations of Modern Plant Phenotyping
Defining Plant Phenotyping and Its Critical Role in Food Security and Crop Improvement
Plant phenotyping is the scientific discipline concerned with the quantitative assessment of plant traits across different hierarchical scales, from the cellular level to the whole canopy [1] [2]. It encompasses the measurement and analysis of a plant's anatomical, ontogenetical, physiological, and biochemical properties to understand how its genetic makeup (genotype) interacts with environmental conditions and management practices to determine its observable characteristics and performance [1] [2]. The core objective is to establish a reliable link between the genotype and the resulting phenotype, which is crucial for selecting superior genotypes that will become future cultivars well-adapted to different environments [3].
Historically, phenotyping relied on labour-intensive manual methods where experts visually scored plant samples and recorded characteristics, often requiring destructive harvesting for laboratory tests [3]. This approach was limited by its throughput, which impacted data accuracy and the number of traits that could be practically characterized [3]. The contemporary revolution in phenotyping lies in the adoption of high-throughput, non-destructive methods that utilize automated sensors, robotics, and data analytics to characterize plants rapidly and objectively [3] [1]. These modern platforms can now accomplish in hours what previously took field experts months to collect, allowing researchers to focus more on data analysis and decision-making [3].
The Imperative for Advanced Phenotyping in Global Agriculture
The global plant phenotyping market, valued at approximately USD 242.9 million in 2023, is projected to grow steadily, reflecting its increasing importance in addressing core agricultural challenges [4]. This growth is fundamentally driven by the escalating global demand for food, with a population projected to exceed 9.7 billion by 2050, which necessitates a substantial increase in agricultural output without a proportional expansion of arable land or water resources [4]. Furthermore, there is an urgent need for climate-resilient crops capable of withstanding extreme weather patterns, including prolonged droughts, heatwaves, and emerging disease outbreaks [4] [5]. Phenotyping technologies are indispensable for rapidly identifying plant traits that confer resistance and tolerance to these abiotic and biotic stresses, thereby accelerating the development and deployment of robust crop varieties [4] [6].
Table 1: Primary Drivers of the Plant Phenotyping Market
| Driver | Impact |
|---|---|
| Food Demand | Necessary to increase agricultural output for a growing global population [4]. |
| Climate Change | Requires development of crops resilient to drought, heat, and new diseases [4] [5]. |
| Technology Integration | AI, ML, and robotics enable automated, high-throughput systems that replace manual measurements [4]. |
A significant bottleneck in crop improvement has been the disparity between the rapid advancements in genotyping technologies and our ability to collect high-quality phenotypic data at a similar scale and speed [6] [7]. Effective phenotyping is the essential bridge that connects genomic information to real-world plant performance, making it a cornerstone for modern genetic crop improvement, molecular breeding, and transgenic studies [6] [7]. By providing precise measurements of complex traits related to growth, yield, and stress adaptation, phenotyping empowers breeders and researchers to make data-driven selections, ultimately shortening the breeding cycle and enhancing crop productivity [6].
High-Throughput Phenotyping Technologies and Platforms
High-throughput phenotyping (HTP) leverages a suite of non-destructive imaging techniques and automated platforms to characterize plant traits rapidly and accurately. These technologies operate on the principle of measuring the interaction of electromagnetic radiation with plant tissues, which varies depending on the plant's physiological status [6] [7]. The data acquired from these sensors provide digital insights into plant health, structure, and function.
Table 2: Core Imaging Techniques in Modern Plant Phenotyping
| Imaging Technique | Measured Parameters | Key Applications |
|---|---|---|
| Visible Light Imaging | Plant biomass, architecture, height, color, growth dynamics [6] [7]. | Morphological analysis, growth monitoring, yield trait estimation [7]. |
| Thermal Imaging | Canopy/leaf temperature, stomatal conductance [6] [7]. | Assessment of plant water status and transpiration for drought stress detection [7]. |
| Fluorescence Imaging | Photosynthetic efficiency, quantum yield, leaf health status [6] [7]. | Detection of biotic and abiotic stresses before visual symptoms appear [6]. |
| Hyperspectral Imaging | Leaf/canopy water content, pigment composition, phytochemical levels [6] [7]. | Detailed health status assessment, nutrient content analysis, specific disease identification [6]. |
| 3D Imaging | Canopy and shoot structure, root architecture, leaf angle distribution [6] [7]. | Detailed architectural analysis for light interception and plant development studies [7]. |
These imaging techniques are deployed across various platforms, ranging from controlled environments (growth chambers, greenhouses) to field conditions [6]. In controlled settings, sophisticated robotics and conveyor systems enable the automated phenotyping of hundreds of plants per day under defined conditions [2]. For field-based phenotyping, which is critical for validating traits in real-world agricultural scenarios, platforms include Unmanned Aerial Vehicles (UAVs or drones), Unmanned Ground Vehicles (UGVs), and tractor-mounted systems [3] [4]. These field platforms, equipped with various sensors, capture canopy-level data over large acreages, directly contributing to precision agriculture models [4].
Figure 1: Workflow of a High-Throughput Phenotyping System. The process begins with the selection of an environment, which determines the appropriate platform. These platforms are equipped with various imaging sensors that collect raw data, which is subsequently analyzed to extract meaningful plant traits.
Application Note: Protocol for Multi-Spectral Phenotyping of Drought Stress Response
This protocol outlines a standardized procedure for using multi-spectral imaging to quantify the physiological response of cereal crops to progressive drought stress. The method is designed for high-throughput applications in a controlled greenhouse environment.
Research Reagent and Material Solutions
Table 3: Essential Materials for Drought Stress Phenotyping
| Item | Specification/Function |
|---|---|
| Plant Material | 20 genotypes of wheat (Triticum aestivum), with 10 plants per genotype [6]. |
| Growth System | Pot-based with standardized potting mix; automated irrigation system for initial well-watered phase [6]. |
| Multi-Spectral Camera | Sensor sensitive in visible (RGB) and near-infrared (NIR) bands, mounted on a movable gantry or UGV [6] [7]. |
| Thermal Camera | For simultaneous capture of canopy temperature, a proxy for stomatal conductance and water status [6] [7]. |
| Environmental Sensors | To continuously monitor and record light, air temperature, and relative humidity [6]. |
| Data Storage & Compute | Robust system for handling large image datasets; software for calculating vegetation indices (e.g., NDVI) [6] [7]. |
Experimental Procedure
Plant Growth and Experimental Design:
- Sow seeds in a randomized complete block design to account for microenvironmental variation within the greenhouse.
- Grow all plants under well-watered conditions (maintaining soil moisture at field capacity) until the tillering stage (Zadoks growth stage 25-29).
- Implement the drought stress treatment by withholding water from the designated stress group. The control group continues to receive regular irrigation.
Image Acquisition Protocol:
- Frequency: Acquire images every day at the same time (e.g., mid-morning, 10:00 AM) to minimize diurnal variation effects.
- Settings: Use fixed camera settings (aperture, ISO, shutter speed) and consistent lighting (or use camera flash) for the entire experiment to ensure data comparability.
- Capture: For each plant, capture co-registered multi-spectral (RGB and NIR) and thermal images from a nadir (top-down) view. Ensure the entire plant is within the frame.
Data Processing and Trait Extraction:
- Upload images to a data management platform (e.g., Hiphen's Cloverfield) for automated processing [3].
- Calculate Vegetation Indices algorithmically from the images. Key indices include:
- Extract mean canopy temperature from the thermal images.
Data Analysis:
- Plot the temporal trajectory of NDVI, PSA, and canopy temperature for each genotype under both control and stress conditions.
- Genotypes that maintain higher NDVI and PSA values and lower canopy temperatures under drought conditions are identified as possessing superior drought tolerance.
The Integration of Deep Learning and Computer Vision
The massive volume of image data generated by high-throughput phenotyping platforms presents a significant challenge in data analysis, creating a new bottleneck [8] [9]. Deep Learning (DL), a subset of artificial intelligence, has emerged as a transformative technology to address this challenge by automating the extraction of meaningful information from plant images [8] [9].
Deep learning, particularly Convolutional Neural Networks (CNNs), reduces the need for manual feature engineering by learning hierarchical representations directly from raw pixel data [8]. These algorithms are now crucial for a wide range of phenotyping tasks, including:
- Image Segmentation: Automatically distinguishing plant pixels from background soil or other objects [8].
- Classification and Counting: Identifying and counting specific organs, such as leaves, flowers, or kernels [8].
- Disease and Stress Detection: Identifying subtle patterns indicative of biotic or abiotic stress long before they are visible to the human eye [4] [8].
- Predictive Modeling: Unraveling complex genotype-phenotype-environment relationships to predict plant performance [8] [9].
The integration of DL into phenotyping pipelines is a key trend that significantly boosts both the scale and precision of plant research, enabling more powerful and predictive analyses for crop improvement [4] [9].
Figure 2: Role of Deep Learning in Image Analysis. Raw plant images are processed by deep learning models, which automate the extraction of complex phenotypic traits, enabling tasks such as organ counting, stress detection, and yield prediction.
Challenges and Future Perspectives
Despite its promising potential, the widespread adoption of advanced plant phenotyping faces several hurdles. A significant challenge is the high initial capital investment required for advanced phenotyping infrastructure, which can be a barrier for smaller institutions and developing economies [4]. Furthermore, the complexity of data management and analysis remains a major constraint; phenotyping generates petabytes of multi-dimensional data, and extracting actionable insights demands advanced computational resources and a highly skilled workforce [4]. The lack of standardized protocols across different platforms and institutions also hinders data comparability and collaborative progress [4].
The future of plant phenotyping will be shaped by the continued pervasive integration of Artificial Intelligence (AI) and Machine Learning (ML) to enhance data analysis and predictive power [4] [9]. There is also a strong trend toward scaling up field-based phenotyping to validate traits in real-world conditions using UAVs and UGVs [4]. Another critical frontier is the move towards multi-modal data fusion, combining imaging data with other 'omics' data (genomics, metabolomics) and environmental records to build a more holistic understanding of plant function and resilience [10] [5]. Overcoming current challenges and leveraging these future trends will be paramount to unlocking the full potential of plant phenotyping in securing global food security and accelerating crop improvement for a sustainable future.
Plant phenotyping, the science of measuring plant structural and physiological characteristics, is fundamental to crop improvement and agricultural research [11] [12]. Traditional methods for obtaining these measurements have historically relied on manual visual assessments and tools like rulers and calipers [11] [12]. While these approaches have provided valuable data, they introduce significant bottlenecks that impair the scalability, accuracy, and efficiency of modern breeding programs and physiological studies. This application note details the core limitations of traditional phenotyping—manual labor intensiveness, destructive sampling, and inherent subjectivity—and frames them within the context of a shifting research paradigm that leverages deep learning and computer vision to overcome these constraints. The transition to high-throughput, non-destructive, and automated phenotyping is crucial for accelerating the development of crops resilient to climate change and for supporting global food security [11] [12].
Core Limitations of Traditional Phenotyping
The table below summarizes the three primary limitations of traditional phenotyping methods and their impacts on research and breeding programs.
Table 1: Core Limitations of Traditional Plant Phenotyping Methods
| Limitation | Description | Impact on Research |
|---|---|---|
| Manual Labor | Relies on human effort for visual observations and physical measurements using tools like rulers and calipers [11]. | Time-consuming and labor-intensive, making it unsuitable for large-scale field operations [11]. Creates a bottleneck in data acquisition, limiting the number of individuals and traits that can be assessed [12]. |
| Destructive Sampling | Often requires plants to be damaged or uprooted to study internal properties, such as root architecture or biomass [11]. | Makes it impossible to monitor the same plant throughout its life cycle, capturing only a single moment in time [11]. Prevents longitudinal studies on the same individual, which is critical for understanding growth dynamics [13]. |
| Subjectivity | Measurements and scoring are influenced by the individual researcher's perception and interpretation [11] [12]. | Introduces inconsistency and error, as different people may observe and interpret the same plant traits differently [11]. Data accuracy and reliability cannot be guaranteed, compromising the validity of downstream analyses [12]. |
Transition to Modern High-Throughput Phenotyping
The limitations of traditional methods are being addressed by high-throughput plant phenotyping (HTP), which leverages a suite of non-destructive imaging technologies and automated analysis. The following workflow illustrates how modern phenotyping integrates these technologies to create an efficient, data-driven pipeline.
Experimental Protocol: A Case Study in Non-Destructive Vigor Assessment
This protocol details a specific experiment that demonstrates the transition from a destructive traditional method to a non-destructive, image-based technique for assessing early seedling vigor in rice—a critical trait for direct-seeded cultivation systems [13].
Application Note: Early Seedling Vigor Phenotyping in Direct-Seeded Rice
1. Background and Objective: Early seedling vigor helps young plants compete with weeds and establish successfully. Traditional screening relies on destructive harvests to measure biomass, preventing the tracking of individual plants over time and making the selection of superior genotypes in breeding programs slow and inefficient [13]. This protocol establishes a non-destructive, image-based method to quantify seedling vigor using whole-plant area (WPA) as a key proxy metric.
2. Experimental Setup and Workflow: The following diagram contrasts the traditional destructive method with the modern image-based protocol.
3. Key Findings and Validation:
- Strong Correlation: The whole-plant area estimated from images (WPAi) showed a strong positive correlation with the whole-plant area measured by a destructive flatbed scanner (WPAs), with regression analysis showing WPAs explained 83.11% and 87.33% of the variation in WPAi at 14 and 28 days after sowing (DAS), respectively [13].
- Growth Rate Validation: The crop growth rate calculated from WPAi (CGR-WPAi) was strongly correlated with the CGR of shoot dry weight with tillers (R² = 74.26%) and root dry weight (R² = 45.20%) from destructive sampling [13].
- Novel Geometric Traits: The study identified new non-destructive metrics like convex hull and top view area, which effectively differentiated vigorous genotypes and reduced labor time by 80% while halving labor costs [13].
The Scientist's Toolkit: Research Reagent Solutions
The following table outlines key technologies and materials that form the foundation of a modern, computer vision-based phenotyping setup.
Table 2: Essential Tools for Modern High-Throughput Plant Phenotyping
| Category | Tool / Technology | Function in Phenotyping |
|---|---|---|
| Imaging Sensors | RGB Camera | Captures standard color images for morphological analysis, leaf counting, and flower detection [11] [14]. |
| Hyperspectral Imager | Captures a wide range of spectral bands to infer chemical composition, chlorophyll levels, water content, and nutrient deficiencies [11] [15]. | |
| LiDAR / 3D Scanner | Laser-based scanning to create detailed 3D models of plants for analyzing complex structures, biomass, and canopy architecture [11] [15]. | |
| Thermal Camera | Measures infrared radiation to assess plant surface temperature, useful for monitoring water stress and health [11] [16]. | |
| Data Acquisition Platforms | Unmanned Aerial Vehicle (UAV) / Drone | Enables high-throughput, aerial-based phenotyping of large field populations, often carrying multiple sensors [11] [15] [14]. |
| Ground Robot (e.g., BoniRob) | Provides ground-level, automated phenotyping screening for detailed organ-level data [16]. | |
| Software & Algorithms | Deep Learning Models (YOLO11, CNN, ViT) | Performs automated image analysis for tasks like object detection, classification, and segmentation to extract phenotypic information [11] [17] [14]. |
| Image Analysis Software (PlantCV, ImageJ) | Provides user-friendly platforms for applying image processing techniques and quantifying traits without extensive computational expertise [14]. |
The limitations of traditional phenotyping—its reliance on manual labor, its destructive nature, and its inherent subjectivity—have long been a bottleneck in plant science and breeding. The integration of high-throughput phenotyping techniques, powered by computer vision and deep learning, presents a transformative solution. As demonstrated by the rice seedling vigor protocol, modern methods can provide non-destructive, objective, and highly scalable alternatives that yield data with strong correlations to traditional metrics while enabling dynamic trait analysis. Adopting these tools and protocols allows researchers to overcome historical constraints, accelerate the breeding cycle, and contribute more effectively to global food security efforts.
High-throughput phenotyping (HTP) represents a paradigm shift in agricultural and biological research, addressing a major bottleneck in crop improvement pipelines: the ability to phenotype crops quickly and efficiently [9]. This shift is characterized by the integration of automation, non-destructive imaging, and advanced computational analysis to quantitatively measure plant structural and functional characteristics [18] [19]. Plant phenotyping, defined as the assessment of complex plant traits such as growth, development, stress tolerance, architecture, physiology, and yield, plays a crucial role in informing both crop breeding and crop management decisions [18]. The move from labor-intensive, destructive, and low-throughput manual methods to automated, scalable solutions enables researchers to analyze plant traits under diverse environmental conditions with minimal manual input, thereby accelerating strain screening and optimization for applications in biofuels, bioremediation, and nutraceuticals [20].
Core Imaging Technologies for Non-Destructive Analysis
Non-destructive imaging forms the foundation of high-throughput phenotyping, allowing repeated measurements of the same plants throughout their lifecycle. The primary imaging modalities each provide unique insights into plant health and performance.
Table 1: Core Imaging Modalities in High-Throughput Plant Phenotyping
| Imaging Modality | Measured Parameters | Applications in Phenotyping | Technical Considerations |
|---|---|---|---|
| RGB Imaging | Projected leaf area, shoot biomass, plant architecture, colour analysis [19] | Growth rate analysis, morphology assessment, phenology tracking [19] [21] | Multiple views (top, side) improve accuracy; affected by leaf overlapping and circadian movements [19] |
| Chlorophyll Fluorescence Imaging (CFIM) | Quantum yields of photochemistry, non-photochemical energy dissipation [19] | Photosynthetic efficiency, early stress detection, photosynthetic function analysis [19] | Requires dark adaptation; kinetic CFIM provides most comprehensive data [19] |
| Thermal Imaging | Leaf surface temperature [19] | Water stress detection, stomatal conductance assessment [19] | Requires careful environmental control; temperature differences indicate transpiration rates [19] |
| Hyperspectral Imaging | Reflectance across numerous spectral bands [19] | Chlorophyll content, nutrient status, pigment composition [19] | Provides chemical composition data through spectral signatures [19] |
Protocol: Multi-Modal Imaging for Stress Response Analysis
Purpose: To non-destructively monitor plant responses to abiotic stress using integrated imaging sensors.
Materials:
- Plant samples subjected to stress treatments and controls
- Automated phenotyping platform with integrated RGB, chlorophyll fluorescence, and thermal cameras
- Image analysis software (commercial or open-source)
- Data processing workstation
Procedure:
- Plant Preparation: Establish a minimum of 10 biological replicates per genotype and treatment. For controlled environments, use randomized complete block designs.
- Imaging Schedule: Capture images at consistent intervals (e.g., daily or every other day) at the same time of day to minimize diurnal variation effects.
- RGB Imaging: Acquire images from multiple angles (top and at least two side views) to accurately estimate biomass and projected leaf area [19].
- Chlorophyll Fluorescence: Dark-adapt plants for 20 minutes prior to measurement. Capture both minimal (F₀) and maximal (Fₘ) fluorescence levels to calculate Fᵥ/Fₘ = (Fₘ - F₀)/Fₘ, which estimates the maximum quantum yield of PSII photochemistry [19].
- Thermal Imaging: Ensure consistent environmental conditions during capture. Use reference surfaces of known temperature for calibration.
- Data Extraction: Use automated image analysis to extract phenotypic traits from all imaging modalities.
- Data Integration: Correlate data across imaging platforms to build comprehensive phenotypic profiles.
Automated and Scalable Phenotyping Platforms
Recent advances in phenotyping platforms focus on integrating robotics with multiple sensing technologies to achieve unprecedented throughput and data integration. The PhenoSelect system exemplifies this approach, combining robotics, spectroscopy, fluorometry, flow cytometry, and data analytics for high-throughput, multi-trait phenotyping [20]. Such systems can profile multiple algal species across 96 different environmental and chemical conditions simultaneously, quantitatively measuring parameters such as photosynthetic efficiency, growth rate, and cell size with minimal manual intervention [20].
A key innovation in automated phenotyping is the quantification of phenotypic plasticity through computational approaches like convex hull volume calculation, which helps characterize how species respond to varying environmental conditions [20]. For example, automated systems have revealed that Haematococcus pluvialis exhibits the largest phenome size (indicating broad plasticity), while Nannochloropsis australis shows the smallest among studied species [20]. Visualization tools such as Ranked Spider Plots and heatmaps enable researchers to identify patterns across multiple traits and conditions [20].
Protocol: Automated System Operation for High-Throughput Screening
Purpose: To operate an automated phenotyping platform for scalable screening of plant populations.
Materials:
- Automated phenotyping platform with robotic handling system
- Multi-sensor array (e.g., RGB, fluorescence, spectral sensors)
- Environmental control system
- Data management and analysis infrastructure
Procedure:
- System Calibration: Perform daily calibration of all sensors using standardized reference materials. Verify robotic positioning accuracy.
- Experimental Setup: Program the experimental layout into the system software, assigning specific positions to different genotypes and treatments.
- Automated Scheduling: Configure the imaging schedule to maximize throughput while avoiding measurement interference (e.g., sufficient dark adaptation for fluorescence measurements).
- Quality Control Checks: Implement automated quality checks for focus, exposure, and sensor performance during data collection.
- Data Management: Use automated pipelines to transfer, store, and pre-process acquired data. Implement backup protocols to prevent data loss.
- Trait Extraction: Apply computer vision algorithms to extract quantitative traits from images. Use batch processing for large datasets.
- Data Validation: Periodically validate automated measurements with manual assessments to ensure data quality and reliability.
Deep Learning and Computer Vision in Phenotyping Analysis
Deep learning has emerged as a transformative technology for analyzing the large image datasets generated by high-throughput phenotyping systems [9]. Convolutional Neural Networks (CNNs) have demonstrated remarkable success in extracting phenotypic traits from imaging data, including leaf count, shape, size, and disease severity [22]. These approaches have evolved from traditional machine learning methods that struggled with generalization to new conditions or crop types [22].
More recently, hybrid architectures that combine transformer-based models with lightweight convolutional modules have shown improved performance for phenotyping tasks [22]. These frameworks incorporate three key elements: (1) a hybrid generative model to capture complex spatial and temporal phenotypic patterns; (2) a biologically-constrained optimization strategy to improve prediction accuracy and interpretability; and (3) an environment-aware module to address environmental variability [22].
Protocol: Deep Learning Implementation for Image-Based Phenotyping
Purpose: To implement a deep learning pipeline for automated trait extraction from plant images.
Materials:
- High-performance computing workstation with GPU acceleration
- Curated dataset of plant images with corresponding manual annotations
- Deep learning frameworks (e.g., TensorFlow, PyTorch)
- Data augmentation utilities
Procedure:
- Data Preparation: Collect and annotate a minimum of 100 images per object class or genotype to ensure robust model training [21]. For limited data scenarios, employ patch-based classification to increase effective dataset size [21].
- Data Augmentation: Apply transformations including rotation, scaling, colour adjustment, and flipping to increase dataset diversity and improve model generalization.
- Model Selection: Choose appropriate network architectures based on the phenotyping task:
- Biologically-Constrained Optimization: Incorporate domain knowledge as constraints during training to ensure biologically plausible predictions [22].
- Model Training: Implement transfer learning when possible by fine-tuning pre-trained models on plant-specific datasets to reduce training time and data requirements [22].
- Validation: Use k-fold cross-validation with independent test sets to evaluate model performance. Employ metrics such as accuracy, F1-score, and mean average precision appropriate to the task.
- Deployment: Integrate the trained model into the phenotyping pipeline for automated trait extraction.
Explainable AI and Interpretability in Phenotyping
As deep learning models become more complex, their "black box" nature presents challenges for plant scientists who need to understand the relationship between model predictions and plant physiology [18]. Explainable AI (XAI) addresses this issue by providing tools and techniques that help researchers interpret, understand, and trust AI model decisions [18] [24]. The adoption of XAI in plant phenotyping is still in its early stages but growing in importance [18].
XAI methods can be categorized as either model-specific (applicable to specific model architectures) or model-agnostic (applicable to any model) [18]. Popular techniques include saliency maps that highlight image regions most influential in model decisions, feature visualization that reveals what patterns models have learned to detect, and surrogate models that approximate complex models with simpler, interpretable ones [18].
Protocol: Implementing Explainable AI for Phenotyping Models
Purpose: To apply XAI techniques for interpreting deep learning models in plant phenotyping.
Materials:
- Trained deep learning models for phenotyping tasks
- XAI libraries (e.g., SHAP, LIME, Captum)
- Visualization tools
- Domain knowledge of plant biology
Procedure:
- Model Selection: Choose appropriate XAI techniques based on model architecture and interpretation goals.
- Saliency Map Generation: Apply gradient-based methods to identify image regions most influential for model predictions.
- Feature Importance Analysis: Use permutation-based methods to quantify the importance of different input features.
- Biological Validation: Correlate model explanations with known biological knowledge to validate that models are learning meaningful features.
- Comparative Analysis: Compare explanations across different genotypes, treatments, or growth stages to identify patterns.
- Model Refinement: Use insights from XAI to identify potential model biases or errors and refine training data or architecture accordingly.
- Visualization: Create clear visualizations that communicate model decisions to domain experts without technical backgrounds.
Emerging Technologies and Future Directions
The field of high-throughput phenotyping continues to evolve with several emerging technologies promising to further transform plant phenotyping. Large Language Models (LLMs) and multi-modal approaches are showing potential for simplifying interaction with complex vision models [25]. Systems like PhenoGPT leverage LLMs to invoke the most appropriate pre-trained vision models to address plant tasks specified by free text, lowering the barrier for plant scientists without extensive computational background [25].
Another significant trend is the move toward field-based high-throughput phenotyping to capture trait expression under real-world conditions [21]. For perennial crops like grapevines, field phenotyping is particularly important for evaluating the full phenotypic variability of traits like yield or plant vigour throughout the season [21].
Table 2: Application of High-Throughput Phenotyping Across Scales and Environments
| Phenotyping Scale | Technological Requirements | Measurable Traits | Applications |
|---|---|---|---|
| Laboratory/ Controlled Environment | Automated imaging systems, environmental control, robotic handling [19] [21] | Detailed morphological traits, precise physiological responses [21] | Fundamental research, gene function analysis, early screening [21] |
| Greenhouse | Semi-controlled environments, mobile gantries or conveyor systems [19] | Disease progression, growth patterns under semi-controlled conditions [21] | Pre-breeding screening, preliminary yield assessment [21] |
| Field | UAVs, ground vehicles, weather-proof sensors, GPS [21] | Yield components, canopy architecture, stress responses under natural conditions [21] | Breeding selection, agronomic management, genotype × environment interaction studies [21] |
Protocol: Field-Based High-Throughput Phenotyping
Purpose: To implement high-throughput phenotyping under field conditions for perennial crops.
Materials:
- UAVs with multi-spectral or hyperspectral cameras
- Ground vehicles with sensors
- GPS and geotagging capability
- Weather monitoring stations
- Data processing pipeline for large datasets
Procedure:
- Experimental Design: Establish field trials with appropriate replication and randomization. Include reference genotypes with known characteristics.
- Sensor Selection: Choose sensors appropriate for target traits (e.g., multispectral for vegetation indices, thermal for water stress).
- Flight Planning: For UAV-based phenotyping, program automated flight paths with consistent altitude, speed, and overlap.
- Temporal Scheduling: Plan capture times to coincide with key growth stages and optimal environmental conditions (e.g., midday for water stress assessment).
- Data Management: Implement robust data management systems for large volumes of field data, including metadata on environmental conditions.
- Spatial Analysis: Apply geospatial analysis to account for field heterogeneity and positional effects.
- Data Integration: Combine field phenotyping data with environmental and genomic data for comprehensive analysis.
The Scientist's Toolkit: Essential Research Reagents and Materials
Table 3: Essential Research Reagent Solutions for High-Throughput Phenotyping
| Tool/Category | Specific Examples | Function/Application |
|---|---|---|
| Imaging Sensors | RGB cameras, Chlorophyll fluorescence imagers, Thermal cameras, Hyperspectral sensors [19] | Non-destructive measurement of plant morphology, physiological status, and chemical composition [19] |
| Automation Systems | Robotic handlers, Conveyor systems, Automated liquid handlers [20] | Enable high-throughput, reproducible sample processing and measurement with minimal manual intervention [20] |
| AI Models | CNN architectures (U-Net, ResNet), Transformer models, Hybrid architectures [22] [23] | Automated trait extraction, pattern recognition, and prediction from image data [22] |
| Data Analysis Platforms | PhenoSelect [20], Deep learning frameworks (TensorFlow, PyTorch) [22] | Data integration, visualization (Ranked Spider Plots, heatmaps), and trait quantification [20] |
| Reference Materials | Colour standards, Thermal references, Fluorescence standards [19] | Sensor calibration and data normalization across measurement sessions [19] |
Plant phenotyping is the comprehensive assessment of complex plant traits such as growth, development, tolerance, resistance, architecture, physiology, ecology, and yield [7]. The advancement of high-throughput phenotyping platforms using non-destructive imaging techniques has revolutionized plant biology research and breeding programs by enabling automated, quantitative measurement of plant traits [26]. These technologies are particularly valuable for dissecting the genetics of quantitative traits and studying plant responses to biotic and abiotic stresses [7] [19].
Imaging plants extends beyond simply "taking pictures" to quantitatively measure phenotypes through the interaction between light and plant tissues—including reflected, absorbed, or transmitted photons [7]. Each plant component has wavelength-specific properties; for instance, chlorophyll absorbs photons primarily in blue and red spectral regions, while water has specific absorption features in near and short wavelengths [7]. This review provides a comprehensive technical analysis of four core imaging technologies—RGB, hyperspectral, thermal, and 3D imaging—within the context of modern plant phenotyping pipelines that integrate deep learning and computer vision.
Core Imaging Modalities
RGB Imaging utilizes cameras sensitive to the visible spectral range (400-700 nm) to capture red, green, and blue channel data [7] [26]. It serves as a fundamental tool for quantifying morphological and architectural traits, providing high-contrast images that align with human visual perception [27] [19].
Hyperspectral Imaging (HSI) captures both spectral (λ) and spatial (x, y) information, merging these into a 3D data matrix termed a "hyperspectral data cube" or "hypercube" [28]. This technology collects hundreds of contiguous narrow spectral bands across ultraviolet (UV), visible (VIS), near-infrared (NIR), and short-wave infrared (SWIR) regions (250-2500 nm), enabling detailed biochemical characterization [28].
Thermal Imaging employs infrared cameras to detect electromagnetic radiation in the thermal infrared range (3-5 μm or 7-14 μm), producing pixel-based maps of surface temperature [7] [26]. This modality provides insights into plant physiological status by measuring canopy or leaf temperature variations [26].
3D Imaging utilizes technologies such as stereo camera systems, time-of-flight cameras, laser scanning, and photogrammetry to capture spatial depth information and reconstruct three-dimensional plant architecture [7] [29]. These systems generate detailed depth maps for analyzing complex structural traits [7].
Technical Specifications and Applications
Table 1: Comparative Analysis of Core Imaging Technologies for Plant Phenotyping
| Imaging Technique | Spectral Range | Spatial Resolution | Primary Measurable Parameters | Plant Phenotyping Applications | Key Limitations |
|---|---|---|---|---|---|
| RGB Imaging | 400-700 nm (visible light) | Whole organs or organ parts, time series | Projected area, growth dynamics, shoot biomass, color, texture, architecture | Biomass estimation [26] [19], growth rate analysis [26] [30], disease quantification [26], yield traits [7] | Limited to structural assessment; affected by lighting conditions [26] |
| Hyperspectral Imaging | 250-2500 nm (UV-VIS-NIR-SWIR) | Crop vegetation cycles, indoor time series | Continuous spectra per pixel, vegetation indices, pigment composition, water content | Early disease detection [28], pigment composition analysis [7] [28], water status monitoring [28], nutrient assessment | High instrument cost [28]; complex data processing [28]; large data volumes [28] |
| Thermal Imaging | 3-5 μm or 7-14 μm (thermal infrared) | Whole shoot or leaf tissue, time series | Canopy/leaf temperature, stomatal conductance, transpiration rate | Water stress detection [26] [19], stomatal conductance monitoring [26], irrigation management | Affected by ambient conditions; requires reference measurements for calibration |
| 3D Imaging | N/A (geometry-focused) | Whole-shoot time series at various resolutions | Depth maps, plant height, leaf angle distributions, canopy structure | Shoot architecture analysis [7], root system modeling [29], biomass estimation, growth modeling in 3D space | Computational intensity; occlusion challenges [29] |
Experimental Protocols
Multi-Modal Image Registration Protocol
Objective: To achieve pixel-perfect registration of multi-modal plant imaging data (RGB, hyperspectral, and chlorophyll fluorescence) for enhanced feature extraction in machine learning applications [27].
Materials and Equipment:
- Sensor system (e.g., HAIP BlackBox V2) with HSI push broom line scanner (500-1000 nm)
- RGB camera (slightly tilted mounting position)
- Chlorophyll fluorescence imager (e.g., PhenoVation Plant Explorer XS)
- Multi-well plates or rhizoboxes for plant cultivation
- Calibration targets for geometric and radiometric correction
Procedure:
- Camera Calibration: Perform geometric calibration for each imaging modality using calibration targets. Calculate mean reprojection errors for accuracy assessment (target: subpixel range) [27].
- Data Acquisition: Acquire images from all sensor systems while maintaining consistent plant positioning. For HSI systems, account for push broom scanner characteristics and potential geometric distortions [27].
- Transformation Restriction: Restrict image registration to affine transformation to balance computational efficiency and robustness while minimizing original data alteration [27].
- Reference Image Selection: Systematically evaluate which sensor system provides optimal registration performance as a reference/target image [27].
- Algorithm Application: Test multiple automated image registration algorithms:
- Feature-based ORB (Oriented FAST and Rotated BRIEF)
- Phase-only correlation (POC) of Fourier transform
- Normalized cross-correlation (NCC)-based approach
- Enhanced correlation coefficient (ECC) maximization [27]
- Performance Evaluation: Calculate overlap ratios (ORConvex) to quantify registration accuracy. Target performance: >95% overlap for RGB-to-ChlF and HSI-to-ChlF registrations [27].
- Fine Registration: Implement additional fine registration on object-separated image data to address heterogeneity across different image regions that may not be fully corrected by a single global transformation matrix [27].
Validation: Assess registration quality through overlap metrics and subsequent analysis performance in machine learning applications for stress detection and trait quantification [27].
Hyperspectral Imaging and Analysis Protocol
Objective: To acquire and analyze hyperspectral data for detecting plant physiological status, stress responses, and biochemical composition [28].
Materials and Equipment:
- Hyperspectral imaging system (push broom or snapshot type)
- Controlled illumination system (consistent lighting conditions)
- Calibration standards (white reference and dark current)
- Computer with hyperspectral data processing capabilities
- Plant samples in controlled growth environment
Procedure:
- System Setup: Configure HSI system appropriate for experimental scale (lab, greenhouse, or field). For field applications, portable HSI devices are recommended [28].
- Illumination Control: Implement standardized lighting conditions. For indoor systems, supplemental blue LED lighting arrays can improve signal quality [28].
- Data Acquisition: Capture hyperspectral data cubes across the 250-2500 nm range. Maintain consistent distance and angle between sensor and plant samples [28].
- Data Calibration: Convert raw data to reflectance using white and dark reference measurements to account for sensor characteristics and illumination conditions [28].
- Hypercube Processing: Organize data into spatial (x, y) and spectral (λ) dimensions for subsequent analysis [28].
- Feature Extraction: Apply appropriate algorithms for:
- Vegetation indices calculation (e.g., NDVI, PRI)
- Spectral signature analysis for specific biochemical compounds
- Spatial pattern recognition for stress detection
- Dimension reduction techniques for large datasets [28]
- Model Development: Implement machine learning approaches (traditional or deep learning) to correlate spectral features with phenotypic traits of interest [28].
Validation: Compare HSI-derived parameters with ground truth measurements from laboratory analyses (e.g., chlorophyll content, water potential, nutrient levels) [28].
Diagram 1: Multi-modal plant phenotyping workflow integrating RGB, hyperspectral, thermal, and 3D imaging technologies.
The Scientist's Toolkit
Research Reagent Solutions
Table 2: Essential Materials and Software for Imaging-Based Plant Phenotyping
| Category | Item | Specifications | Application in Phenotyping |
|---|---|---|---|
| Imaging Hardware | RGB Camera | Visible spectrum (400-700 nm), high spatial resolution | Basic morphological assessment, growth tracking, architecture analysis [7] [26] |
| Hyperspectral Imaging System | Spectral range: 250-2500 nm, spatial resolution: sensor-dependent | Biochemical composition analysis, early stress detection, pigment quantification [28] | |
| Thermal Infrared Camera | Thermal range: 3-5 μm or 7-14 μm, temperature sensitivity: <0.1°C | Stomatal conductance monitoring, water stress detection, transpiration measurement [7] [26] | |
| 3D Imaging System | Stereo cameras, time-of-flight, or laser scanning | Plant architecture modeling, biomass estimation, root system analysis [7] [29] | |
| Experimental Systems | Rhizoboxes | Transparent growth containers (e.g., 300 mm × 1000 mm) with mineral glass front | Root system imaging in soil environment, non-destructive root growth monitoring [31] |
| Multi-well Plates (PhenoWell) | Space-efficient culture system with multiple wells | High-throughput screening of various abiotic stress factors on small plants [27] | |
| Software & Algorithms | Image Registration Tools | Python packages (OpenCV, scikit-image), affine transformation methods | Multi-modal image fusion, coordinate system alignment [27] |
| Root Image Analysis | Rhizobox image processing pipelines, segmentation algorithms | Root architecture quantification, root-soil interaction studies [31] | |
| Deep Learning Frameworks | TensorFlow, PyTorch with custom plant imaging modules | Automated trait extraction, disease identification, growth prediction [32] [28] |
Diagram 2: Information flow in multi-modal plant phenotyping, showing how different imaging technologies contribute to comprehensive trait assessment through data fusion and deep learning analysis.
Applications in Plant Stress Response and Breeding
Biotic and Abiotic Stress Detection
The integration of multi-modal imaging technologies has significantly advanced the detection and quantification of plant stress responses [27] [19]. Hyperspectral imaging enables early detection of fungal pathogens such as Zymoseptoria tritici in wheat before visible symptoms manifest, allowing for timely intervention strategies [28]. By analyzing specific spectral signatures in the 500-900 nm range, HSI can distinguish between healthy and infected tissues with high accuracy [28]. Thermal imaging provides sensitive measurement of stomatal closure in response to drought stress through increased leaf temperature detection, often revealing water deficit conditions before visible wilting occurs [26] [19]. RGB imaging combined with advanced computer vision algorithms enables quantitative assessment of disease severity through lesion counting and discoloration area measurement, replacing subjective visual scoring systems [26] [33].
High-Throughput Trait Quantification
Modern imaging platforms enable automated quantification of complex phenotypic traits essential for breeding programs [30] [19]. Root system architecture analysis using rhizobox-based RGB and hyperspectral imaging provides non-destructive assessment of root growth dynamics and spatial distribution in soil environments [31]. The combination of RGB time-series imaging with chemometric information from hyperspectral scans offers comprehensive insights into root-soil interactions and functional root responses to environmental conditions [31]. Canopy structure and growth dynamics are quantified through 3D imaging and photogrammetry approaches, enabling precise measurement of leaf area index, plant height, and biomass accumulation over time [30] [29]. These automated trait extraction pipelines significantly accelerate the phenotyping of large breeding populations, overcoming previous bottlenecks in genotype-to-phenotype studies [30].
Future Perspectives and Challenges
The field of imaging-based plant phenotyping faces several important challenges and opportunities for advancement. Data management and processing remains a significant hurdle, particularly for hyperspectral and 3D imaging technologies that generate massive datasets requiring specialized computational resources and analysis expertise [28]. Future developments in automated preprocessing pipelines, cloud computing integration, and machine learning-based feature extraction will be essential for broader adoption [32] [28]. Multi-modal data fusion represents another critical frontier, with current research demonstrating improved stress detection accuracy through integrated analysis of complementary imaging modalities [27]. The development of standardized registration protocols and fusion algorithms will enhance the synergistic potential of combined imaging technologies [27].
Instrument accessibility and cost continue to limit widespread implementation, particularly for advanced technologies like hyperspectral and high-resolution 3D imaging [28]. Future directions should focus on developing lower-cost systems, portable devices for field applications, and user-friendly software interfaces to make these technologies accessible to a broader range of researchers and breeding programs [28]. The integration of artificial intelligence and deep learning will further transform plant phenotyping by enabling automated trait identification, predictive modeling of growth patterns, and discovery of novel phenotypic indicators from complex multi-modal datasets [32] [28]. As these technologies mature, they will increasingly support the development of climate-resilient crops and sustainable agricultural systems through accelerated identification of optimal genotypes for challenging environments.
The Phenotyping Bottleneck and the Promise of Deep Learning
Plant phenotyping, the quantitative assessment of plant traits, is recognized as a major bottleneck in improving the efficiency of breeding programs, understanding plant-environment interactions, and managing agricultural systems [34] [35]. Traditional methods, which rely heavily on manual observation and data collection, are labor-intensive, time-consuming, and prone to human error, hindering the understanding of correlations between genetic factors, environmental conditions, and expressed phenotypes [36] [32]. This creates a significant impediment to addressing global challenges such as food security, climate change, and resource constraints [32] [34].
Deep learning (DL), a subset of machine learning characterized by its ability to learn hierarchical data representations automatically, is revolutionizing image-based plant phenotyping [34] [9] [35]. Unlike conventional machine learning that requires manual feature design, DL models, particularly Convolutional Neural Networks (CNNs), can learn relevant features directly from raw image data, breaking down analytical barriers and enabling the development of intelligent solutions for high-throughput phenotyping [34]. This capability is transforming phenotyping from a slow, subjective exercise into a rapid, data-driven process, empowering researchers and breeders with objective insights [37]. This article details the specific CNN architectures overcoming these challenges and provides application-focused protocols for their implementation.
Core Deep Learning Architectures in Plant Phenotyping
Different computer vision tasks in phenotyping require specialized CNN architectures. The table below summarizes the primary architectures and their applications.
Table 1: Core CNN Architectures and Their Applications in Plant Phenotyping
| CNN Architecture | Primary Computer Vision Task | Key Innovation Concept | Exemplar Phenotyping Application |
|---|---|---|---|
| AlexNet/ZFNet [34] | Image Classification | Early deep CNNs demonstrating breakthrough performance on large datasets. | Plant stress classification; developmental stage identification. |
| VGGNet [34] | Image Classification | Use of small (3x3) convolutional filters to increase network depth (up to 19 layers). | Detailed feature extraction for trait analysis. |
| U-Net [36] [32] | Image Segmentation | Encoder-decoder architecture with skip connections for precise pixel-wise segmentation. | Leaf and plant organ segmentation from complex backgrounds. |
| SegNet [36] | Image Segmentation | Encoder-decoder network using pooling indices for upsampling. | Leaf segmentation for accurate counting and morphological analysis. |
| DeepLab V3+ [36] | Image Segmentation | Uses atrous convolution to capture multi-scale contextual information. | Fine-grained segmentation of plant structures. |
| Transformer-based Models [32] | Text Generation / Multi-task Learning | Self-attention mechanisms for contextual understanding and sequence generation. | Generating natural language descriptions of phenotyping data. |
| LC-Net [36] | Leaf Counting (Custom Pipeline) | Integrates segmented leaf images with original RGB images to enhance counting accuracy. | Accurate leaf counting in rosette plants, even with overlapping leaves. |
Specialized Architectures and Emerging Trends
Beyond standard architectures, the field is advancing through specialized designs and hybrid models:
LC-Net for Leaf Counting: LC-Net represents a tailored pipeline rather than a single architecture. It leverages a SegNet model for initial leaf segmentation. The key innovation is the use of both the original RGB image and the segmented leaf image as a combined input to a subsequent counting model, which employs convolution blocks and max-pooling layers. This dual-input approach significantly enhances accuracy by providing the model with both raw pixel data and pre-processed structural information [36].
Hybrid and Multimodal Frameworks: Emerging frameworks combine different deep learning models to handle diverse data sources. For instance, a hybrid generative model can capture complex spatial and temporal phenotypic patterns, while an environment-aware module dynamically adapts to varying environmental factors, ensuring reliable predictions across different agricultural settings [32].
Text Generation for Phenotyping: Transformer-based models like GPT are being fine-tuned on agricultural datasets to automate the generation of textual reports, summarize experimental findings, and provide actionable insights in natural language, thereby improving communication between researchers and practitioners [32].
Experimental Protocols for Key Phenotyping Tasks
This section provides detailed methodologies for implementing deep learning for two critical phenotyping tasks: leaf counting and disease severity assessment.
Protocol 1: Leaf Counting in Rosette Plants Using LC-Net
This protocol is adapted from the LC-Net model, which demonstrated superior performance on datasets like CVPPP and KOMATSUNA [36].
Workflow Overview:
Diagram 1: LC-Net leaf counting workflow.
Step-by-Step Procedure:
Data Acquisition and Preparation:
- Imaging: Capture top-view RGB images of rosette plants (e.g., Arabidopsis, cabbage) against a consistent background.
- Dataset: Utilize public benchmarks like the Plant Phenotyping Datasets [38] (e.g., CVPPP, KOMATSUNA) or collect your own.
- Preprocessing: Resize all images to a uniform size (e.g., 256x256 pixels). Apply data augmentation techniques including rotation, flipping, and brightness adjustment to improve model robustness.
Leaf Segmentation Model Training:
- Model Selection: Implement a SegNet architecture, which was chosen for its superior performance in the original study [36].
- Ground Truth: Prepare pixel-wise annotated masks where each leaf is distinctly labeled.
- Training: Train the SegNet model using the original RGB images as input and the annotated masks as the target. Use a loss function like categorical cross-entropy.
- Validation: Evaluate segmentation quality using metrics such as Intersection over Union (IoU) and Dice Score [36].
LC-Net Counting Model Training:
- Input Preparation: For each training image, generate the corresponding segmented image using the trained SegNet model. The input to the counting model is the concatenation of the original RGB image and the segmented image.
- Architecture: The LC-Net counting model consists of convolution blocks (CB). Each CB contains convolution layers, batch normalization, and an activation function (e.g., ReLU), followed by max-pooling layers [36].
- Training: Train the model using the actual leaf count as the regression target. Use Mean Squared Error (MSE) as the loss function.
Model Deployment and Inference:
- Validation: Test the entire pipeline on a held-out test set.
- Evaluation Metrics: Report Mean Square Error (MSE), absolute difference count (DiC), and percentage agreement between predicted and actual leaf counts [36].
Protocol 2: In-Field Phenotyping for Disease Severity Assessment
This protocol is inspired by large-scale, mobile-based initiatives like CIMMYT's ImageSafari project [37].
Workflow Overview:
Diagram 2: In-field phenotyping pipeline.
Step-by-Step Procedure:
Standardized Image Collection:
- Equipment: Use smartphones or tablets equipped with standardized imaging protocols. The ImageSafari project uses QED.ai tools for this purpose [37].
- Protocol: Capture geo-referenced images at multiple growth stages and from multiple angles (e.g., top-down, side-view). Ensure consistent lighting and distance where possible. Use barcode-based workflows to link images to specific plots and genetic metadata from breeding systems like CIMMYT's Enterprise Breeding System (EBS) [37].
Data Curation and Annotation:
- Curation: Build a high-quality dataset by removing blurry or otherwise unusable images.
- Annotation: Expert annotators label images with traits of interest, such as disease severity scores (e.g., on a 0-5 scale) or percent leaf area affected. This creates the ground-truth dataset for supervised learning.
AI Model Development and Validation:
- Model Selection: Employ a CNN architecture suitable for image classification (e.g., VGGNet, ResNet) or segmentation (U-Net), depending on whether the output is a severity class or a segmented diseased area.
- Training: Train the model on the annotated dataset. Incorporate biologically-constrained optimization to ensure predictions are biologically realistic [32].
- Validation: Perform rigorous validation across different environments, seasons, and genetic backgrounds to ensure accuracy, consistency, and fairness. This step is critical for model generalizability [37].
Deployment and Scaling:
- Integration: Deploy the best-performing model via user-friendly mobile apps or cloud-based APIs.
- Use Case: Breeders and technicians in the field can use the app to take a new picture and receive an instant, in-field prediction of disease severity, enabling rapid, data-driven decisions [37].
Successful implementation of deep learning phenotyping requires a suite of computational and data resources.
Table 2: Essential Research Reagents and Resources for Deep Learning Phenotyping
| Resource Category | Specific Examples | Function and Utility |
|---|---|---|
| Public Benchmark Datasets | CVPPP Dataset; KOMATSUNA Dataset [36] [38] | Provide annotated imaging data for developing, training, and benchmarking algorithms for tasks like leaf segmentation and counting. |
| Software Libraries & Frameworks | TensorFlow; PyTorch; Scikit-learn [36] | Open-source libraries used to build, train, and evaluate deep learning models (e.g., implementing CNN architectures). |
| Pre-trained Models | Models from ImageNet; SegNet; U-Net [36] [34] | Models pre-trained on large datasets enable transfer learning, reducing the computational cost and labeled data requirements for new tasks. |
| Hardware for Model Training | NVIDIA GeForce GPUs (e.g., GTX 1650) [36] | Graphics Processing Units (GPUs) are essential for accelerating the computationally intensive process of training deep neural networks. |
| Field Imaging & Data Collection Tools | Smartphones with QED.ai apps; Standardized Imaging Protocols [37] | Enable systematic, geo-referenced, high-volume image collection in the field, which is the foundational step for any data-driven pipeline. |
Performance Benchmarks and Quantitative Outcomes
The effectiveness of deep learning models is validated through quantitative benchmarks on standard datasets.
Table 3: Performance Benchmarks of Deep Learning Models in Phenotyping
| Model / Architecture | Task | Dataset | Key Performance Metrics |
|---|---|---|---|
| LC-Net [36] | Leaf Counting | CVPPP & KOMATSUNA (merged) | Demonstrated superior performance in accurate leaf counting, outperforming existing state-of-the-art techniques, with robust performance on overlapping leaves. |
| SegNet (within LC-Net) [36] | Leaf Segmentation | CVPPP & KOMATSUNA (merged) | Achieved superior segmentation results visually and numerically, as measured by Accuracy, IoU, and Dice Score. |
| SHEPHERD [39] | Rare Disease Diagnosis (Medical) | Undiagnosed Diseases Network (UDN) | Identified correct causal gene in 40% of patients across 299 diseases, demonstrating high performance in a low-data regime. |
| AI-Powered Phenotyping (CIMMYT Pipeline) [37] | In-Field Trait Prediction | >1 Million images (sorghum, millet, etc.) | Enabled rapid, scalable, and objective trait prediction, transforming a slow, subjective process into a data-driven one. |
Deep learning, particularly CNNs and emerging transformer-based architectures, is decisively overcoming the plant phenotyping bottleneck. By automating the extraction of meaningful information from large quantities of image data, these technologies enable high-throughput, accurate, and objective measurement of plant traits, from leaf counting in controlled environments to disease assessment in the field [36] [37] [9].
Future research will likely focus on several key areas: improving model performance on noisy images and in complex field conditions, exploring 3D convolution models for richer structural analysis, and developing optimizations using diverse algorithms [36]. Furthermore, the integration of multimodal data (e.g., combining imagery with genomic and environmental data) and the use of knowledge-grounded learning to incorporate existing biological knowledge will be crucial for enhancing predictive accuracy and biological interpretability [32] [39]. As these tools become more accessible through mobile platforms, they promise to democratize advanced phenotyping, accelerating crop improvement and sustainable agricultural production on a global scale.
Architectures in Action: A Deep Dive into Deep Learning Models for Phenotyping Tasks
Plant phenotyping, the quantitative assessment of plant traits, is crucial for understanding plant behavior, improving crop yields, and advancing precision agriculture [22]. This field has been revolutionized by the adoption of deep learning, particularly Convolutional Neural Networks (CNNs), which enable the automated, high-throughput analysis of plant images [40] [24]. CNNs have become the dominant approach for tackling key phenotyping tasks such as leaf counting and disease identification, offering superior performance over traditional image processing and machine learning methods [41] [42]. These applications are vital for addressing global challenges in food security by helping to breed more resilient crops and enabling more effective disease management [24]. This article provides detailed application notes and experimental protocols for implementing CNN-based solutions in leaf counting and plant disease detection, framed within the broader context of a thesis on deep learning and computer vision for plant phenotyping.
Application Note 1: CNN-Based Leaf Counting
Background and Significance
Accurate leaf counting is a fundamental component of plant phenotyping, as it provides direct insights into plant growth and development [43]. Manual counting is labor-intensive, time-consuming, and subject to human error and bias [44]. Automated leaf counting using CNNs offers a rapid, reliable, and scalable alternative, allowing researchers to monitor plant health and growth stages efficiently [43] [44].
Key Models and Performance
Recent research has produced several specialized CNN architectures for leaf counting. The following table summarizes the performance of key models on standard datasets.
Table 1: Performance of CNN-Based Leaf Counting Models
| Model Name | Dataset | Key Metric | Performance | Reference |
|---|---|---|---|---|
| LC-Net | Combined CVPPP & KOMATSUNA | Subjective & Numerical Evaluation | Outperformed other recent CNN-based models | [43] |
| Eff-U-Net++ | CVPPP | Absolute Difference in Count (AbsDiC) | 0.21 | [43] |
| Eff-U-Net++ | MSU-PID | Absolute Difference in Count (AbsDiC) | 0.38 | [43] |
| Eff-U-Net++ | KOMATSUNA | Absolute Difference in Count (AbsDiC) | 1.27 | [43] |
| Regression Model (AlexNet) | LCC/LSC (Ara2012, Ara2013-Canon) | Pearson Correlation (r) | 0.76 (with augmented data) | [44] |
| YOLO V3-based | CVPPP | Absolute Difference in Count (AbsDiC) | 0.48 | [43] |
Experimental Protocol: LC-Net for Rosette Plant Leaf Counting
Principle: The LC-Net model leverages a convolutional neural network that takes both the original plant image and a pre-segmented image of the leaves as dual inputs. This provides the model with additional spatial information, improving its counting accuracy [43].
Workflow:
Materials and Reagents:
- Dataset: The combined dataset from the Leaf Segmentation Challenge (LSC) and Leaf Counting Challenge (LCC), specifically the 'Ara2012' and 'Ara2013-Canon' sets, which contain top-down images of Arabidopsis plants [44].
- Segmentation Model: A pre-trained SegNet model for generating the segmented leaf input, which has been shown to outperform other models like DeepLab V3+, U-Net, and RefineNet for this task [43].
- Software: Python 3.6+, PyTorch or TensorFlow deep learning frameworks.
Procedure:
- Data Preparation:
- Obtain the LSC and LCC datasets.
- Use the SegNet model to generate segmented binary images from the original plant images. These highlight the leaf regions.
- Data Pre-processing:
- Resize all original and segmented images to a uniform size compatible with the LC-Net input layer (e.g., 128x128 or 256x256 pixels).
- Normalize pixel values to a [0, 1] range.
- Model Training:
- Construct the LC-Net architecture, which is designed to process the two input streams.
- Define a regression loss function, such as Mean Squared Error (MSE).
- Use an optimizer like Adam with an initial learning rate of 1e-4.
- Train the model on the training set, using the ground truth leaf counts as labels.
- Validation and Testing:
- Evaluate the model's performance on the validation and test sets using metrics such as Absolute Difference in Count (AbsDiC) and Mean Squared Error (MSE).
- Compare the performance against other state-of-the-art models to benchmark results.
Application Note 2: CNN-Based Plant Disease Identification
Background and Significance
Plant diseases cause significant economic losses and threaten global food security [45]. Early and accurate detection is critical for effective management. CNN-based disease identification systems provide a rapid, scalable, and accessible tool for farmers and researchers, potentially surpassing the accuracy of manual diagnosis by experts [46] [41]. These models can be deployed via mobile applications or integrated into autonomous agricultural vehicles for continuous field monitoring [46].
Key Models and Performance
Disease identification models typically focus on classification or detection. The following table summarizes the performance of representative models.
Table 2: Performance of CNN-Based Plant Disease Identification Models
| Model / Approach | Plant/Disease | Key Metric | Performance | Reference |
|---|---|---|---|---|
| Stepwise Detection Model | Bell pepper, Potato, Tomato | Overall Accuracy | 97.09% | [45] |
| Stepwise (Crop Classification) | Bell pepper, Potato, Tomato | Accuracy | 99.33% (EfficientNet) | [45] |
| Stepwise (Disease Detection) | Bell pepper | Accuracy | 100.00% (GoogLeNet) | [45] |
| Stepwise (Disease Detection) | Potato | Accuracy | 100.00% (VGG19) | [45] |
| Stepwise (Disease Detection) | Tomato | Accuracy | 99.75% (ResNet50) | [45] |
| PiTLiD (Transfer Learning) | Multiple (Small Datasets) | Comparative Accuracy | Superior performance on small-scale datasets | [47] |
| Faster R-CNN, YOLOv3 | Apple Leaf Disease | Mean Average Precision (mAP) | Feasible for real-field detection | [42] |
Experimental Protocol: Stepwise Disease Detection and Classification
Principle: This protocol uses a three-step CNN-based model to first identify the plant species, then detect the presence of disease, and finally classify the specific disease type. This stepwise approach improves accuracy and modularity [45].
Workflow:
Materials and Reagents:
- Dataset: A curated dataset of diseased and healthy leaf images. Public datasets like PlantVillage are commonly used. For real-field applications, custom datasets similar to the apple leaf disease dataset mentioned in [42] are necessary.
- CNN Models: Pre-trained models such as EfficientNet, GoogLeNet, VGG19, and ResNet50, which can be fine-tuned for specific tasks [45].
- Software: Python with deep learning libraries (PyTorch, TensorFlow), and image processing tools (OpenCV).
Procedure:
- Data Curation:
- Assemble a dataset with images labeled by crop species and disease state (healthy/diseased). For diseased samples, include the specific disease name.
- Split the dataset into training, validation, and test sets (e.g., 70%/15%/15%).
- Step 1 - Crop Classification Model:
- Training: Fine-tune a pre-trained EfficientNet model using the training images, with the crop species (e.g., bell pepper, potato, tomato) as the label.
- Validation: Validate the model on the validation set and select the model with the highest accuracy.
- Step 2 - Disease Detection Model:
- Training: For each crop species, train a dedicated binary classification model (e.g., GoogLeNet for bell pepper, VGG19 for potato, ResNet50 for tomato) to distinguish between healthy and diseased leaves.
- Validation: Validate each crop-specific model to ensure high detection accuracy.
- Step 3 - Disease Classification Model:
- Training: For each crop, train a multi-class classification model (e.g., EfficientNet for tomato diseases, VGG19 for potato diseases) on the diseased subset of the data to identify the specific disease type.
- Validation: Validate the model's ability to correctly classify different diseases.
- Integrated System Testing:
- Test the entire pipeline on the held-out test set, feeding an input image through all three steps to obtain a final diagnosis.
The Scientist's Toolkit: Essential Research Reagents and Materials
Table 3: Key Research Reagents and Computational Tools for CNN-based Plant Phenotyping
| Item Name | Function/Application | Specification Notes |
|---|---|---|
| PlantVillage Dataset | A large, public benchmark dataset for training and validating disease identification models. | Contains over 87,000 images across 25 plant species and 58 disease classes [46] [41]. |
| LSC/LCC Dataset | Standard dataset for leaf segmentation and counting challenges. | Comprises top-down images of Arabidopsis thaliana (e.g., Ara2012, Ara2013-Canon) with ground-truth annotations [44]. |
| Pre-trained CNN Models (ResNet, VGG, EfficientNet) | Base architectures for transfer learning, reducing data and computational requirements. | Pre-trained on ImageNet; can be fine-tuned for specific phenotyping tasks [47] [45]. |
| SegNet | Deep convolutional encoder-decoder architecture for robust pixel-wise leaf segmentation. | Used to generate segmented leaf images as input for advanced models like LC-Net [43]. |
| Data Augmentation Pipeline | Artificially expands training datasets to improve model generalization and prevent overfitting. | Techniques include random cropping, rotation, flipping, and color jittering [44]. |
| Explainable AI (XAI) Tools | Provides insights into model decision-making, increasing trust and aiding biological discovery. | Techniques like Grad-CAM can highlight image regions most influential to a model's prediction [24]. |
Recurrent Neural Networks (RNNs), particularly Long Short-Term Memory (LSTM) architectures, have emerged as transformative computational tools for analyzing temporal patterns in plant phenotyping. This framework enables unprecedented capability to model dynamic growth processes and developmental stage transitions by learning long-range dependencies in time-series data. By processing sequential input from high-throughput phenotyping platforms, these models capture complex temporal dependencies in plant development, overcoming limitations of static image analysis. This protocol details comprehensive methodologies for implementing LSTM networks to quantify phenological stage transitions and growth dynamics, providing researchers with practical tools for enhancing precision in agricultural research and crop management.
Plant phenotyping—the quantitative assessment of plant traits—faces significant challenges in capturing temporal dynamics of growth and development. Traditional methods relying on manual observations or static image analysis fail to adequately model the sequential nature of plant development, where current states are intrinsically linked to previous physiological conditions [48]. The emergence of automated phenotyping platforms has generated vast time-series datasets, creating an urgent need for analytical frameworks capable of modeling these temporal sequences.
Recurrent Neural Networks (RNNs) represent a class of neural networks specifically designed for sequential data, making them ideally suited for temporal phenotyping applications. Unlike feedforward networks, RNNs maintain an internal state that serves as a memory of previous inputs, allowing them to model time-dependent processes [48]. However, standard RNNs suffer from vanishing gradient problems that limit their ability to capture long-range dependencies. Long Short-Term Memory (LSTM) networks address this limitation through specialized gating mechanisms that regulate information flow, enabling learning of long-term dependencies in phenotypic time-series data spanning weeks or months [48] [49].
Within plant phenotyping, LSTM applications include classification of plant genotypes based on growth patterns, prediction of biomass accumulation, and identification of phenological stage transitions through analysis of time-lapse imagery and sensor data [48] [49]. This protocol provides comprehensive methodologies for implementing these approaches in plant research.
Core Concepts: Temporal Modeling in Plant Phenology
Phenological Stages as Sequential Processes
Plant development occurs through an ordered sequence of phenological stages, each characterized by distinct morphological and physiological changes. These stages include dormancy, bud break, leaf development, stem elongation, flowering, fruiting, and senescence [50]. The timing and duration of these stages are influenced by complex interactions between genetic factors and environmental conditions, particularly temperature and photoperiod [51].
The sequential nature of these developmental transitions makes them particularly amenable to temporal modeling approaches. Each stage both influences and constrains subsequent developmental possibilities, creating dependencies that span the entire growth cycle [50]. For example, the timing of bud break affects subsequent leaf development, which in turn influences the plant's capacity for photosynthesis and biomass accumulation.
LSTM Architecture for Temporal Phenotyping
LSTM networks address the vanishing gradient problem through a sophisticated gating mechanism that regulates information flow. The key components of an LSTM unit include:
- Forget Gate: Determines which information from the previous cell state should be discarded
- Input Gate: Controls which new information should be stored in the current cell state
- Output Gate: Regulates which information from the current cell state should be output
This architecture enables LSTMs to learn which temporal features in plant development sequences are most relevant for specific phenotyping tasks, such as genotype classification or biomass prediction [48]. The "forget gate" is particularly valuable for plant phenotyping applications, as it allows the network to reset itself when previously relevant phenotypic information becomes obsolete due to developmental stage transitions [49].
Table: LSTM Gates and Their Biological Analogues in Plant Phenotyping
| LSTM Component | Function | Phenotyping Analogue |
|---|---|---|
| Forget Gate | Discards irrelevant information | Recognizing developmental stage transitions |
| Input Gate | Incorporates new relevant information | Integrating new phenotypic observations |
| Cell State | Maintains long-term information | Preserving growth history across stages |
| Output Gate | Controls exposure of internal state | Generating stage-specific trait measurements |
Experimental Protocols
Protocol 1: CNN-LSTM Framework for Accession Classification
Background: Distinguishing closely related plant genotypes (accessions) requires analysis of subtle differences in growth patterns and developmental timing that may not be apparent in single timepoints [48].
Materials:
- Time-lapse imaging system (e.g., climate chambers with automated image capture)
- Arabidopsis or other model plant accessions
- Computing infrastructure with GPU acceleration
Methodology:
Data Acquisition:
- Capture top-view images of plants throughout their complete life cycle using fixed-interval automated imaging (e.g., daily captures)
- Maintain consistent imaging conditions (lighting, camera position, background)
- Annotate images with ground truth accession labels
Preprocessing:
- Resize images to uniform dimensions (e.g., 224×224 pixels)
- Apply data augmentation techniques (rotation, flipping, brightness adjustment)
- Organize images into temporal sequences aligned by developmental stage
Model Architecture:
- Feature Extraction: Utilize a Convolutional Neural Network (CNN) frontend (e.g., VGG, ResNet) pretrained on ImageNet to extract spatial features from each image
- Temporal Modeling: Feed CNN-extracted features into an LSTM network with 128-256 hidden units
- Classification: Pass the final LSTM output through a fully connected layer with softmax activation for accession classification
Training:
- Initialize CNN weights using transfer learning from ImageNet pretraining
- Use categorical cross-entropy loss and Adam optimizer
- Employ early stopping based on validation accuracy to prevent overfitting
Evaluation:
- Assess classification accuracy on held-out test sequences
- Analyze confusion matrices to identify systematically confused accessions
- Visualize temporal attention patterns to identify critical developmental windows for discrimination
Applications: This approach has successfully classified four Arabidopsis accessions with substantially higher accuracy than traditional hand-crafted features or CNN-only models, revealing that temporal growth patterns contain distinctive phenotypic signatures [48].
Protocol 2: LSTM-Based Biomass Prediction from Time-Series Remote Sensing
Background: Biomass accumulation represents a complex integration of growth processes over time, influenced by genetics, environment, and management practices. Traditional destructive sampling is inefficient for breeding programs with hundreds of genotypes [49].
Materials:
- UAV-mounted multispectral/hyperspectral sensors
- Weather station for environmental data
- Ground reference biomass samples for model training
- Genotypic data for plant varieties
Methodology:
Data Collection:
- Acquire weekly UAV-based multispectral imagery across the growing season
- Extract vegetative indices (NDVI, EVI, CCI) at plot level
- Record daily weather data (temperature, precipitation, solar radiation)
- Obtain genetic marker data (SNPs) for all genotypes
- Collect limited destructive biomass samples for model training and validation
Feature Engineering:
- Compute time-series of spectral vegetation indices from UAV imagery
- Calculate growing degree days from temperature records
- Apply feature importance analysis to identify optimal feature subsets
- Reduce dimensionality of genetic data using principal component analysis
Model Architecture:
- Implement a multi-input LSTM architecture with 64-128 memory units
- Process time-series of remote sensing features and weather data through the LSTM pathway
- Incorporate static genetic information through embedding layers
- Include environmental covariates through auxiliary input pathways
Transfer Learning Implementation:
- Pre-train model on extensive dataset from previous growing season
- Fine-tune final layers using limited labeled data from current season
- Apply layer-wise freezing to prevent catastrophic forgetting
- Use domain adaptation techniques to align feature distributions across seasons
Model Evaluation:
- Assess prediction accuracy using R², RMSE, and MAE metrics
- Compare performance against traditional approaches (random forest, SVR, PLSR)
- Analyze temporal feature importance using attention mechanisms
- Validate generalizability across environments and years
Applications: This approach has demonstrated high accuracy for predicting sorghum biomass in breeding trials containing over 600 testcross hybrids, with transfer learning enabling effective model adaptation across growing seasons with minimal ground reference data [49].
Computational Framework & Workflow
The integration of LSTM networks into plant phenotyping pipelines follows a systematic workflow from data acquisition to model deployment. The diagram below illustrates this comprehensive framework:
LSTM Phenotyping Framework: Integrated workflow from multi-modal data acquisition to agricultural applications.
The Scientist's Toolkit: Research Reagent Solutions
Table: Essential Computational Tools for LSTM-Based Plant Phenotyping
| Tool/Category | Specific Examples | Function in Phenotyping Research |
|---|---|---|
| Deep Learning Frameworks | TensorFlow, PyTorch, Keras | Model implementation, training, and deployment |
| Plant Imaging Systems | LemnaTec, WIWAM, PhenoArch | Automated high-throughput image acquisition |
| Remote Sensing Platforms | UAVs with multispectral/hyperspectral sensors, LiDAR | Field-based phenotyping data collection |
| Biological Databases | Plant Phenomics Network, TRY Plant Trait Database | Benchmarking and transfer learning |
| Sequence Modeling Architectures | LSTM, BiLSTM, GRU, Transformer | Temporal pattern recognition in growth data |
| Explainable AI Tools | LIME, SHAP, Attention Visualization | Interpreting model decisions and biological insights |
| Data Augmentation Tools | Albumentations, Imgaug | Addressing limited training data problems |
Data Analysis and Performance Metrics
Quantitative evaluation of LSTM models in plant phenotyping requires specialized metrics that capture both temporal dynamics and phenotypic accuracy. The table below summarizes key performance indicators across different application domains:
Table: Performance Metrics for LSTM-Based Phenotyping Models
| Application Domain | Evaluation Metrics | Reported Performance | Benchmark Comparison |
|---|---|---|---|
| Accession Classification | Accuracy, F1-Score, Confusion Matrix | 91.5% accuracy for 4 Arabidopsis accessions [48] | +18.2% over hand-crafted features |
| Biomass Prediction | R², RMSE (kg/ha), MAE | R² = 0.89, RMSE = 1.24 Mg/ha for sorghum [49] | +0.15 R² points vs. Random Forest |
| Phenological Stage Detection | Precision, Recall, Jaccard Index | 94.3% phase-specific accuracy [51] | +18% improvement in stage transition timing |
| Growth Trend Forecasting | Mean Absolute Percentage Error, Dynamic Time Warping | 12.3% MAPE for 14-day growth projection | 32% reduction vs. statistical baselines |
LSTM networks and recurrent architectures provide a powerful framework for modeling temporal dynamics in plant phenotyping, enabling researchers to move beyond static assessments to capture the inherently sequential nature of plant growth and development. The protocols outlined in this document offer practical implementation guidelines for leveraging these approaches across diverse applications, from genotype classification to biomass prediction. As high-throughput phenotyping platforms continue to generate increasingly complex temporal datasets, the integration of these deep learning approaches will be essential for unlocking biologically meaningful patterns and advancing both fundamental plant science and applied crop improvement.
The future development of LSTM applications in plant phenotyping will likely focus on multi-modal data integration, improved interpretability through attention mechanisms, and enhanced generalization through transfer learning and domain adaptation techniques. These advances will further solidify the role of recurrent networks as indispensable tools for temporal phenotype analysis in plant biology and agricultural research.
Plant phenotyping, the quantitative assessment of plant traits, is fundamental for understanding plant behavior, improving crop yields, and advancing precision agriculture [32]. However, traditional methods are often labor-intensive, subjective, and struggle with the complexity of plant structures and variability in field conditions [32] [52]. Deep learning has emerged as a transformative tool, with Convolutional Neural Networks (CNNs) initially leading progress in image-based trait analysis [52]. Despite their success, CNNs can be limited in capturing long-range dependencies and are often challenged by pervasive field conditions such as occlusions, varying lighting, and complex plant backgrounds [53].
The Transformer architecture, with its core self-attention mechanism, presents a powerful alternative. Originally developed for natural language processing, self-attention dynamically weights the importance of all elements in a sequence, allowing the model to focus on the most relevant parts of the input for a given task [54]. In computer vision, this capability enables Vision Transformers (ViTs) and related architectures to build global feature representations, leading to superior performance in capturing complex plant morphological traits and overcoming the limitations of local feature extraction inherent in CNNs [52] [55]. This document details the application of Transformer architectures for robust feature extraction in plant phenotyping, providing specific application notes, experimental protocols, and essential research toolkits for scientists and researchers.
Core Principles of Self-Attention in Plant Phenotyping
The self-attention mechanism is the foundation of the Transformer's power. It allows a model to relate different positions of a single sequence (or image) to compute a representation of that sequence [54]. For an input sequence, the mechanism uses three learned vectors: Query (Q), Key (K), and Value (V). The output is a weighted sum of the value vectors, where the weight assigned to each value is determined by the compatibility of the query with the corresponding key [54]. This process can be summarized by the scaled dot-product attention formula [54]:
[ \text{Attention}(Q, K, V) = \text{softmax}\left(\frac{QK^T}{\sqrt{d_k}}\right)V ]
The multi-head attention mechanism extends this by running multiple self-attention operations in parallel, allowing the model to jointly attend to information from different representation subspaces [54]. In plant phenotyping, this translates to a model's ability to simultaneously focus on diverse aspects of a plant's structure—such as leaf veins, stem texture, and overall shape—to build a comprehensive and robust representation, even when parts of the plant are occluded [53].
Application Notes: Transformer-Based Models in Plant Phenotyping
Transformer architectures are being successfully applied across diverse plant phenotyping tasks. Their strength in handling complex, non-ideal conditions is proving particularly valuable.
3D Plant Organ Segmentation with TPointNetPlus
Segmenting individual organs from 3D point clouds is crucial for obtaining precise phenotypic parameters but is challenging due to complex structures and occlusions. The TPointNetPlus model addresses this by integrating a Transformer module into the PointNet++ architecture [53]. The Transformer's self-attention mechanism enhances feature extraction by effectively capturing global features and long-range dependencies within the point cloud data. This integration significantly improves the model's understanding of complex plant structures and its robustness to noise and occlusion, common in practical agricultural scenarios [53]. The model achieved a notable accuracy of 98.39% in leaf semantic segmentation from cotton plant point clouds, with correlation coefficients for phenotypic parameters like plant height and leaf area exceeding 0.9 [53].
Multi-View Phenotyping with ViewSparsifier
Multi-view imaging mitigates single-view limitations like occlusion but introduces significant redundancy. The ViewSparsifier approach tackles this challenge using a Transformer-based architecture for multi-view plant phenotyping tasks such as plant age prediction and leaf count estimation [55]. Its core innovation is a randomized view selection strategy that sparsifies input views, reducing computational redundancy. Features from selected views are extracted using a Vision Transformer (ViT) and then fused using a Transformer encoder with positional encodings. This method won first place in both tasks of the GroMo 2025 Grand Challenge, demonstrating state-of-the-art performance with a mean absolute error (MAE) of 3.55 across multiple crop types, significantly lower than the baseline MAE of 7.74 [55].
Overcoming the Quadratic Complexity of Self-Attention
A known challenge of standard self-attention is its quadratic computational and memory complexity with respect to sequence length, which can be a bottleneck for long sequences or high-resolution data [56]. Research into Efficient Transformers has produced methods like linear approximation to mitigate this. For instance, one proposed method acts as a drop-in replacement for standard self-attention, offering O(n) complexity and a significant decrease in memory footprint while maintaining competitive performance, making Transformer models more feasible for resource-constrained environments or high-throughput applications [56].
Table 1: Performance Comparison of Transformer-Based Phenotyping Models
| Model / Approach | Task | Dataset / Crop | Key Performance Metric | Result |
|---|---|---|---|---|
| TPointNetPlus [53] | 3D Organ Segmentation | Cotton Point Clouds | Leaf Segmentation Accuracy | 98.39% |
| Phenotypic Parameter Correlation (R) | > 0.9 | |||
| ViewSparsifier [55] | Leaf Count & Age Prediction | GroMo 2025 (Okra, Radish, etc.) | Mean Absolute Error (MAE) - Overall | 3.55 |
| MAE - Okra | 1.38 | |||
| MAE - Wheat | 2.90 | |||
| CURformer [56] | Efficient Self-Attention | Long Range Arena Benchmark | Memory Footprint & Latency | Significant Decrease |
| Task Performance | Competitive with SOTA |
Experimental Protocols
This section provides detailed methodologies for implementing Transformer-based models in plant phenotyping workflows.
Protocol: 3D Point Cloud Organ Segmentation using TPointNetPlus
This protocol outlines the procedure for segmenting cotton plant organs from 3D point clouds [53].
I. Materials and Equipment
- Hardware: Imaging system (e.g., multi-view cameras for 3D reconstruction), computer workstation with GPU (e.g., NVIDIA GTX 1060 6G or better).
- Software: Python, PyTorch or TensorFlow, PointNet++ implementation, libraries for 3D data processing (e.g., Open3D).
- Dataset: A 3D point cloud dataset of plants. For example, the Cotton3D dataset constructed using Structure from Motion (SfM) with over 724 high-quality point clouds, each containing 40,960 points [53].
II. Experimental Procedure
- Data Acquisition and Preprocessing:
- Capture multi-view images of the plant (e.g., using an automated rig with controlled lighting).
- Reconstruct a dense 3D point cloud using SfM or other multi-view stereo techniques.
- Preprocess the point cloud by down-sampling or up-sampling to a fixed number of points (e.g., 40,960) and normalize the data.
Model Architecture and Integration:
- Implement the PointNet++ network as the backbone for hierarchical feature extraction.
- Integrate a standard Transformer encoder module into the PointNet++ architecture. The Transformer should be inserted into the encoder path to enhance feature representation after PointNet++'s set abstraction layers.
- The multi-head self-attention mechanism in the Transformer will allow the network to capture global contextual relationships between points.
Training Configuration:
- Loss Function: Use a combination of cross-entropy loss for segmentation and optionally a regression loss for phenotypic parameter prediction.
- Optimizer: Adam or SGD with momentum.
- Hyperparameters: Set batch size (e.g., 8-16), learning rate (e.g., 0.001), and number of epochs (e.g., 200) based on model and dataset size.
- Perform data augmentation such as random rotation, jittering, and scaling of the point clouds.
Instance Segmentation and Phenotyping:
- Use a clustering algorithm like HDBSCAN on the semantically segmented point cloud to separate individual instances of leaves, bolls, and branches.
- Extract phenotypic parameters (e.g., plant height, leaf area, boll volume) from the segmented instances.
III. Data Analysis and Validation
- Calculate segmentation accuracy by comparing model predictions against manually annotated ground truth.
- Compute correlation coefficients (R) and R-squared values between predicted and manually measured phenotypic parameters to validate the model's predictive capability.
Protocol: Multi-View Phenotyping using ViewSparsifier
This protocol describes how to implement the ViewSparsifier approach for tasks like leaf count and plant age estimation from multiple images [55].
I. Materials and Equipment
- Hardware: A multi-view image acquisition system (e.g., capturing from multiple heights and angles), GPU-equipped computer.
- Software: Python, PyTorch, Hugging Face Transformers library (for Vision Transformer).
- Dataset: A multi-view plant image dataset. The GroMo 2025 dataset is an example, with images captured from 5 height levels and 24 angles (15° increments) per plant [55].
II. Experimental Procedure
- View Selection and Preprocessing:
- Define a view selection strategy. Start with a "selection vector" – a random or strategic selection of 24 views from a single height level.
- For each selected view, perform center cropping to remove uninformative background regions. The crop size may be specific to the plant type.
- (Optional Advanced Strategy) Use a "selection matrix" to randomly select views across all available height levels for a more comprehensive representation.
Feature Extraction and Model Setup:
- Use a pre-trained Vision Transformer (ViT) as a feature extractor. The ViT can be kept frozen or fine-tuned based on the dataset size and task.
- Extract feature vectors for every view in the selected set.
Transformer-Based Feature Fusion:
- Combine the feature vectors from all selected views. Add positional encodings to retain the spatial information of the viewpoints.
- Pass this sequence of features through a standard Transformer encoder. The self-attention mechanism will model the relationships between the different views.
- Apply global mean pooling on the output of the Transformer encoder to create a single, compact representation of the multi-view information.
Training with Robust Augmentation:
- Use a Multi-Layer Perceptron (MLP) head with PReLU activation and dropout for the final regression (or classification) task.
- Key Augmentation: During training, for each batch, apply a random rotational permutation (circular shift) to the sequence of selected views. This prevents overfitting to a fixed view order and improves model robustness.
Permutation-Based Inference:
- During inference, generate 24 rotational permutations of the original view selection.
- Run the model for each of these 24 permutations.
- Compute the final prediction by averaging the outputs from all permutations. This reduces variance and improves prediction stability.
III. Data Analysis and Validation
- Evaluate model performance using Mean Absolute Error (MAE) for regression tasks like leaf count and age prediction.
- Compare results against baseline models and other competitors, as shown in Table 1.
Visualizing the Workflows
The following diagrams illustrate the logical flow and architecture of the key Transformer-based methods described in the protocols.
Diagram 1: TPointNetPlus for 3D Point Cloud Segmentation
Diagram 2: ViewSparsifier for Multi-View Learning
Table 2: Essential Materials and Resources for Transformer-based Plant Phenotyping Research
| Item Name / Category | Specification / Example | Function / Purpose in Research |
|---|---|---|
| High-Throughput Phenotyping Platform | Field-based rail transport & imaging chamber system [57] | Automates plant transport and standardized image acquisition in field conditions, ensuring consistent data for model training. |
| 3D Point Cloud Dataset | Cotton3D dataset [53] | Provides high-precision, dense 3D point clouds of plants for training and evaluating segmentation models like TPointNetPlus. |
| Multi-View Image Dataset | GroMo 2025 Challenge Dataset [55] | Offers multi-view images from multiple heights and angles, ideal for developing and benchmarking multi-view models like ViewSparsifier. |
| Curated RGB Image Datasets | Agricultural Computer Vision Dataset Survey [33] | A collection of 45+ high-quality RGB datasets for tasks like weed/disease detection, useful for pre-training and transfer learning. |
| Pre-trained Vision Models | Vision Transformer (ViT) models (e.g., from Hugging Face) [55] | Serve as powerful, readily available feature extractors, which can be used frozen or fine-tuned for specific phenotyping tasks. |
| Efficient Attention Library | Implementation of linear attention (e.g., CURformer) [56] | Provides drop-in replacements for standard self-attention to reduce memory footprint and computational cost for long sequences. |
| Deep Learning Framework | PyTorch / PyTorch Lightning [54] | Offers flexible and efficient ecosystems for building, training, and experimenting with complex Transformer architectures. |
Transformer architectures, through their powerful self-attention mechanism, are proving to be exceptionally capable of handling the complexities and variabilities inherent in plant phenotyping tasks under field conditions. By capturing global contexts and long-range dependencies, they enable robust feature extraction from challenging data modalities like 3D point clouds and multi-view images, overcoming issues of occlusion and redundancy.
Future research will likely focus on enhancing the efficiency and scalability of these models through methods like linear attention approximations [56]. Furthermore, the integration of multimodal data—combining imagery with genomic, soil, and meteorological information—using Transformer-based fusion networks represents a promising frontier for developing a more holistic understanding of the plant phenome and its interaction with the environment [32] [58]. As these technologies mature, they will become indispensable tools for accelerating crop breeding and advancing the goals of precision agriculture.
In plant phenotyping, the quantitative measurement of plant characteristics is crucial for advancing crop breeding and precision agriculture [59]. However, a significant bottleneck impedes progress: the lack of large volumes of high-quality, annotated data required for training deep learning models [22] [60]. Generating accurately labeled ground truth images for tasks like plant segmentation is labor-intensive, time-consuming, and requires intricate human-machine interaction for annotation [60].
Generative models, particularly Generative Adversarial Networks (GANs) and Variational Autoencoders (VAEs), offer a powerful solution to this data scarcity problem. These models learn the underlying probability distribution of plant appearances and morphological traits, enabling them to synthesize realistic and diverse image data that expands limited training sets [60]. This capability is transforming plant phenotyping by facilitating the development of more robust and accurate deep learning models for tasks such as trait extraction, disease classification, and growth monitoring.
The Data Scarcity Challenge in Plant Phenotyping
The application of deep learning in plant phenotyping is fundamentally constrained by the "data bottleneck." This challenge manifests in several key areas:
- Labor-Intensive Annotation: Creating ground truth data for segmentation is a major hurdle. Manually generating binary masks to distinguish plant structures from background is tedious and can substantially delay model development [60].
- Limited Phenotypic Variability: Conventional data augmentation techniques, such as rotation, scaling, and flipping, merely rearrange existing pixels. They cannot introduce genuinely novel plant phenotypes, lighting conditions, or morphological combinations not already present in the original dataset [60].
- Domain-Specific Constraints: Phenotyping often requires images of plants at specific developmental stages or under particular stress conditions, which can be difficult, expensive, or time-consuming to capture in sufficient quantities [22].
Generative Models: Technical Foundations
Generative Adversarial Networks (GANs)
A GAN consists of two neural networks, the generator (G) and the discriminator (D), which are trained simultaneously in an adversarial process [60]. The generator learns to map random noise to synthetic data instances. The discriminator evaluates these instances, trying to distinguish them from real data. Through this competition, the generator progressively produces more realistic samples. In plant phenotyping, conditional GANs like Pix2Pix are particularly valuable, as they learn to map an input image (e.g., an RGB plant photo) to a corresponding output image (e.g., a segmentation mask) [60].
Variational Autoencoders (VAEs)
While GANs excel at generating sharp, realistic images, VAEs offer a different approach based on probabilistic inference. A VAE consists of an encoder that maps input data to a probability distribution in a latent space, and a decoder that samples from this distribution to reconstruct the data. Although VAEs can generate synthetic data, they tend to produce smoother, sometimes blurrier outputs compared to GANs, which can limit their effectiveness for capturing fine plant morphological details like leaf boundaries and textures [60].
Application Notes: Protocol for Synthetic Data Generation
The following workflow details a two-stage GAN-based protocol for generating synthetic plant images and their corresponding segmentation masks, adapted from a recent study on greenhouse-grown plants [60].
Experimental Workflow
The diagram below illustrates the two-stage synthetic data generation pipeline.
Stage 1: Generation of Synthetic RGB Images with FastGAN
Objective: To augment the original dataset with diverse, realistic RGB plant images.
- Input: A limited set of original RGB plant images (e.g., 120 images each for Arabidopsis and maize) [60].
- Model: FastGAN, an unconditional generative adversarial network designed for training stability and efficiency on high-resolution images with limited data [60].
- Protocol:
- Data Preparation: Resize all input images to a uniform resolution (e.g., 1024 × 1024 pixels). Normalize pixel values per channel to the range [0, 1] [60].
- Model Training: Train FastGAN on the preprocessed RGB images. The model learns the underlying distribution of plant appearances, textures, and morphological structures.
- Image Synthesis: After training, use the generator to produce novel synthetic RGB images of plants. These images exhibit non-linear intensity and texture transformations, expanding the dataset's variability beyond the original samples [60].
- Outcome: A large set of synthetic RGB plant images that retain the complex features of the original data while introducing new variations.
Stage 2: Translation to Segmentation Masks with Pix2Pix
Objective: To generate accurate binary segmentation masks for the synthetic RGB images created in Stage 1.
- Input:
- Synthetic RGB images from FastGAN.
- A small, manually annotated set of real RGB images and their corresponding binary ground truth masks (e.g., 80 image-mask pairs for Arabidopsis and maize) [60].
- Model: Pix2Pix, a conditional Generative Adversarial Network (cGAN) designed for image-to-image translation tasks [60].
- Protocol:
- Model Training: Train the Pix2Pix model on the paired real RGB and ground truth mask images. The generator learns the mapping from an RGB input to a segmentation mask, while the discriminator learns to distinguish real from generated mask-RGB pairs.
- Mask Generation: Pass the synthetic RGB images from Stage 1 through the trained Pix2Pix generator to automatically produce their corresponding binary segmentation masks.
- Outcome: Paired synthetic data—realistic RGB images and their accurately segmented masks—ready for use in training downstream deep learning models.
Performance and Validation
The performance of the generated segmentation masks is quantitatively evaluated by comparing Pix2Pix outputs against manually annotated ground truth images using the Dice coefficient [60]. This protocol has demonstrated high accuracy, with Dice scores ranging between 0.88 and 0.95 for different plant species like Arabidopsis and maize. The choice of loss function is critical; Sigmoid Loss has been shown to enable the most efficient model convergence, achieving the highest average Dice scores [60].
The Scientist's Toolkit: Essential Research Reagents
Table 1: Key computational tools and resources for generative modeling in plant phenotyping.
| Tool/Resource | Type | Function in Generative Phenotyping | Example Use Case |
|---|---|---|---|
| FastGAN [60] | Generative Adversarial Network | Generates high-resolution, realistic synthetic RGB images from a limited dataset. | Augmenting training sets with novel plant phenotypes. |
| Pix2Pix [60] | Conditional GAN (cGAN) | Translates images from one domain to another (e.g., RGB to segmentation mask). | Automated generation of ground truth segmentation masks. |
| U-Net [60] | Convolutional Neural Network | Serves as a supervised baseline model for image segmentation performance comparison. | Benchmarking the quality of GAN-generated segmentation masks. |
| LemnaTec System [60] | High-throughput Imaging Platform | Acquires high-resolution plant images under controlled conditions for model training. | Providing standardized input data for generative models. |
| Leaf Phenotyping Dataset [61] | Benchmark Dataset | Provides annotated imaging data for plant segmentation, detection, and tracking. | Training and validating generative and segmentation models. |
Quantitative Outcomes and Comparative Analysis
Empirical results demonstrate the significant advantages of integrating generative models into plant phenotyping workflows. The following table summarizes key quantitative findings from a recent application.
Table 2: Quantitative performance of a two-stage GAN pipeline for plant image segmentation. [60]
| Plant Species | Training Set Size (RGB-Mask Pairs) | Dice Coefficient (Performance Metric) | Optimal Loss Function |
|---|---|---|---|
| Arabidopsis | 80 | 0.94 | Sigmoid Loss |
| Maize | 80 | 0.95 | Sigmoid Loss |
| Barley | 100 | 0.88 - 0.95 (range) | Sigmoid Loss |
The success of this GAN-based approach highlights its efficacy in overcoming data limitations. By learning from a small set of hand-annotated images, the pipeline can generate a virtually unlimited supply of training data, thereby reducing manual annotation burden and accelerating model development [60].
Future Perspectives
The integration of generative models into plant phenotyping is still evolving. Future developments are likely to focus on:
- 3D Plant Modeling: Using generative techniques to create synthetic 3D plant models, which provide more accurate morphological data and can resolve occlusions better than 2D approaches [62].
- Multimodal Data Integration: Combining generative AI with multimodal data (e.g., hyperspectral, thermal, and genomic information) to create comprehensive digital plant twins for simulating growth under various environmental scenarios [22].
- Advanced Architectures: Exploring newer generative frameworks, such as diffusion models, for potentially higher texture fidelity, albeit at a higher computational cost [60].
In conclusion, GANs and VAEs represent a paradigm shift in plant phenotyping. By addressing the fundamental challenge of data scarcity, they empower researchers to build more accurate, robust, and generalizable models, ultimately accelerating progress in crop improvement and sustainable agriculture.
Application Note 1: YOLO-PLNet for Real-Time Peanut Leaf Disease Detection
Plant disease detection represents a critical bottleneck in agricultural production, with traditional visual inspection methods being labor-intensive, inefficient, and insufficient for large-scale farming operations. The YOLO-PLNet framework addresses this challenge through a lightweight, edge-deployable model specifically designed for real-time detection of peanut leaf diseases. Based on the YOLO11n architecture, this model achieves an optimal balance between detection accuracy and computational efficiency, making it suitable for deployment on resource-constrained edge devices commonly used in agricultural settings [63].
Experimental Protocol and Methodology
Data Acquisition and Preparation
- Data Collection: Images were acquired from over 20 peanut fields in Zhengzhou City, Henan Province, China, from late June to mid-September 2024. A Fuji FinePix S4500 digital camera was used, maintaining a distance of 20-35 cm from the leaves, with a resolution of 2017×2155 pixels [63].
- Dataset Composition: The dataset comprises six categories: Early Leaf Spot, Early Rust, Late Leaf Spot, Late Rust, Nutrient Deficiency, and Healthy leaves. After quality screening, 2,132 original images were retained [63].
- Data Annotation and Augmentation: Expert plant pathologists used the LabelImg tool for manual annotation of disease targets. Data augmentation techniques included horizontal/vertical flipping (50% probability), 90-degree rotation, and brightness/contrast perturbation (±20% adjustment) to enhance model robustness [63].
Model Architecture and Training
YOLO-PLNet introduces several key modifications to the baseline YOLO11n architecture [63]:
- Lightweight Attention-Enhanced (LAE) Convolution: Reduces computational overhead in the backbone and neck networks.
- Channel-Spatial Attention Mechanism (CBAM): Enhances feature representation for small lesions and edge-blurred targets.
- Asymptotic Feature Pyramid Network (AFPN): Improves multi-scale detection performance through staged cross-level fusion.
The model was trained using standard YOLO training procedures with optimization for edge deployment constraints.
Performance Metrics and Results
The following table summarizes the quantitative performance of YOLO-PLNet compared to the baseline YOLO11n model.
Table 1: Performance Comparison of YOLO-PLNet vs. YOLO11n Baseline
| Metric | YOLO11n (Baseline) | YOLO-PLNet | Improvement |
|---|---|---|---|
| Parameters | 2.60M | 2.13M | -18.07% |
| Computational Complexity | 6.5G | 5.4G | -16.92% |
| Model Size | 5.35MB | 4.51MB | -15.70% |
| mAP@0.5 | 96.7% | 98.1% | +1.4% |
| mAP@0.5:0.95 | 93.0% | 94.7% | +1.7% |
| Inference Latency (FP16) | - | 19.1 ms | - |
| Throughput (FP16) | - | 28.2 FPS | - |
| Inference Latency (INT8) | - | 11.8 ms | - |
| Throughput (INT8) | - | 41.3 FPS | - |
Table 2: Edge Deployment Performance on Jetson Orin NX
| Precision | Latency | Throughput | GPU Usage | Power Consumption |
|---|---|---|---|---|
| FP16 | 19.1 ms | 28.2 FPS | Moderate | Moderate |
| INT8 | 11.8 ms | 41.3 FPS | Low | Low |
Workflow Visualization
Application Note 2: Multi-View 3D Plant Reconstruction with OB-NeRF and Edge_MVSFormer
Accurate 3D reconstruction of plant morphology is essential for high-throughput phenotyping, enabling non-destructive measurement of traits like plant height, leaf area, and canopy structure. This application note examines two advanced approaches: OB-NeRF, which uses an improved Neural Radiance Field for high-fidelity reconstruction from videos, and Edge_MVSFormer, which employs a transformer-based network for edge-aware reconstruction from multi-view images [64] [65].
Experimental Protocol and Methodology
OB-NeRF Platform for Complex Plants
- Data Acquisition: A "camera to plant" video acquisition system was built. For citrus saplings, videos were captured around the target plants [64].
- Keyframe Extraction: Keyframes were extracted from the captured videos to reduce redundancy [64].
- Camera Calibration: Zhang Zhengyou's calibration method and Structure from Motion (SfM) estimated camera parameters. A global calibration strategy used camera imaging trajectories as prior knowledge for automatic pose calibration [64].
- OB-NeRF Reconstruction: The Object-Based NeRF algorithm introduced a new ray sampling strategy that improved reconstruction efficiency and quality without requiring image background segmentation. An exposure adjustment phase enhanced robustness to uneven lighting [64].
Edge_MVSFormer for Edge-Aware Reconstruction
- Data Preparation: Multi-view images of 20 model plants (succulents, lilies, begonias, cacti) were captured using a custom dual-loop slide rail system. Images were taken at 15° intervals from two heights, yielding 48 images per plant [65].
- Ground Truth Acquisition: A Freescan X3 handheld laser scanner (accuracy: 0.03 mm) acquired ground truth point clouds [65].
- Network Architecture: Based on TransMVSNet, Edge_MVSFormer integrates an edge detection algorithm to augment edge information as input and introduces an edge-aware loss function to focus the network on accurately reconstructing edge regions [65].
- Training Protocol: The model was pre-trained on DTU and BlendedMVS datasets, then fine-tuned on the private plant dataset [65].
Performance Metrics and Results
The following tables summarize the quantitative performance of both 3D reconstruction methods.
Table 3: Performance Comparison of 3D Reconstruction Methods
| Method | Key Innovation | Input Data | Reconstruction Time | Key Metric | Performance |
|---|---|---|---|---|---|
| OB-NeRF [64] | Object-Based Neural Radiance Fields | Video | ~250 seconds | PSNR | Surpasses original NeRF |
| Edge_MVSFormer [65] | Edge-Aware Transformer Network | Multi-view RGB Images | - | Depth Map Error | Reduces edge error by 2.20 ± 0.36 mm |
| SfM-MVS [66] | Traditional Structure from Motion | Multi-view High-Res Images | Time-consuming | Measurement R² | Plant height: >0.92, Leaf traits: 0.72-0.89 |
| PlantMDE [67] | Monocular Depth Estimation | Single RGB Image | Fast | OW-PCC* | Superior to Depth Anything & Marigold |
*OW-PCC: Organ-Wise Pearson Correlation Coefficient
Table 4: Accuracy of Trait Extraction from 3D Models [66]
| Phenotypic Trait | Coefficient of Determination (R²) | Mean Absolute Error (MAE) |
|---|---|---|
| Plant Height | 0.9933 | 2.0947 cm |
| Leaf Length | 0.9881 | 0.1898 cm |
| Leaf Width | 0.9883 | 0.1199 cm |
Workflow Visualization
The Scientist's Toolkit: Research Reagent Solutions
Table 5: Essential Equipment and Software for Plant Phenotyping Research
| Tool / Reagent | Specification / Type | Function / Application |
|---|---|---|
| Jetson Orin NX [63] | Edge AI Platform | Deployment platform for real-time inference of models like YOLO-PLNet. |
| ZED 2 / ZED Mini [66] | Binocular Stereo Camera | Captures high-resolution RGB images and depth information for 3D reconstruction. |
| Freescan X3 [65] | Handheld Laser Scanner | Provides high-accuracy (0.03 mm) ground truth point clouds for model validation. |
| TensorRT [63] | Optimization SDK | Optimizes model inference speed and efficiency on NVIDIA hardware via precision calibration (FP16/INT8). |
| LabelImg [63] | Annotation Software | Tool for manual annotation of bounding boxes on images to create training datasets. |
| COLMAP [64] [66] | Reconstruction Software | Open-source tool implementing SfM and MVS for 3D reconstruction from images. |
| Custom Slide Rail System [65] | Image Acquisition Hardware | Enables automated capture of multi-view plant images from consistent angles. |
| PlantDepth Dataset [67] | Benchmark Dataset | Large-scale RGB-D dataset for training and evaluating plant-specific depth estimation models. |
These case studies demonstrate significant advancements in plant phenotyping through deep learning. YOLO-PLNet provides an efficient solution for real-time, in-field disease detection optimized for edge deployment, while multi-view 3D reconstruction techniques like OB-NeRF and Edge_MVSFormer enable accurate, non-destructive phenotypic trait extraction. The integration of these technologies into scalable platforms addresses critical bottlenecks in high-throughput plant phenotyping, supporting accelerated crop breeding and precision agriculture. Future work should focus on enhancing model generalizability across species and environments, further reducing computational requirements, and integrating multi-modal data streams for comprehensive plant health assessment.
Navigating Real-World Challenges: Strategies for Optimizing Deep Learning Models in Agriculture
Data scarcity and class imbalance are significant challenges in developing robust deep learning models for plant phenotyping. These issues are prevalent due to the difficulties in collecting large, annotated datasets of plants, which often involve seasonal growth cycles, the presence of rare diseases, and the inherent complexity of annotating biological structures [68] [18]. This document details standardized protocols and application notes for employing advanced data augmentation and transfer learning techniques to overcome these data limitations, thereby enhancing the performance and generalizability of phenotyping models.
Data Augmentation Techniques and Protocols
Data augmentation encompasses a set of strategies designed to artificially expand and diversify training datasets. This is crucial for preventing overfitting and improving model robustness, especially when working with limited original data [69] [70].
Basic Image Transformation Techniques
Basic augmentation involves applying random but realistic geometric and photometric transformations to existing images. The following protocol is designed for image-level classification tasks.
Protocol 2.1.1: Implementation of Basic Augmentations
- Input: A directory of training images (
X_train) and corresponding labels. - Tool Setup: Utilize the
ImageDataGeneratorclass from Keras or thetorchvision.transformsmodule in PyTorch. - Parameter Configuration: Instantiate the augmenter with the following representative parameters [69]:
rotation_range=50width_shift_range=0.2height_shift_range=0.2zoom_range=0.3horizontal_flip=Truebrightness_range=[0.8, 1.2]
- Execution: Configure the data loader to apply these transformations randomly in real-time during model training. This ensures that each epoch, the model sees a slightly different variation of the training data.
Table 1: Standard Parameters for Basic Image Transformations
| Transformation | Description | Typical Parameter Value | Application Note |
|---|---|---|---|
| Random Rotation | Rotates image by a random angle within a specified range. | rotation_range=50 (degrees) |
Avoid full 360° rotation for non-symmetrical plants. |
| Width/Height Shift | Randomly translates the image along the width or height axis. | shift_range=0.2 (20% of total) |
Prevents the model from overfitting to leaf positions. |
| Random Zoom | Zooms the image in or out by a random factor. | zoom_range=0.3 |
Simulates varying distances to the camera. |
| Horizontal Flip | Flips the image horizontally with a 50% probability. | horizontal_flip=True |
Applicable for most plant top-down views. |
| Brightness Alteration | Randomly adjusts the image brightness. | brightness_range=[0.8, 1.2] |
Compensates for varying lighting conditions in the field. |
Advanced Generative Techniques
For more severe data scarcity or class imbalance, generative models can create novel, high-resolution synthetic images.
Protocol 2.2.1: Conditional GAN for Root Phenotyping
This protocol is based on using a conditional Generative Adversarial Network (cGAN) to generate root system architecture (RSA) images and their corresponding annotations [68].
- Objective: Triple the size of an original root dataset and reduce pixel-wise class imbalance between root and background pixels.
- Model Selection: Employ the Pix2PixHD model, a high-definition, image-to-image translation cGAN.
- Network Architecture:
- Generator (G): A U-Net-like architecture that takes a random noise vector
zand a condition (e.g., a semantic label map) to generate a synthetic root image. - Discriminator (D): A convolutional network that distinguishes between real images from the dataset and fake images produced by G. It is conditioned on the real annotation.
- Generator (G): A U-Net-like architecture that takes a random noise vector
- Training: The two networks are trained simultaneously in a min-max game, optimizing the following objective function [68]:
- ( \minG \maxD V(D, G) = \mathbb{E}{x}[\log D(x|y)] + \mathbb{E}{z}[\log(1 - D(G(z|y)))] )
- Where
xis a real image,yis the condition (annotation), andzis the input noise.
- Output: A synthetic dataset of realistic, high-resolution root images and annotations, which is then combined with the original data for downstream segmentation tasks.
Protocol 2.2.2: Style-Consistent Image Translation (SCIT) for Disease Synthesis
This protocol translates images from a variation-majority class (e.g., healthy leaves) to a variation-minority class (e.g., diseased leaves), preserving the original image's style (background, viewpoint, leaf size) [71].
- Objective: Augment a rare disease class by leveraging the diverse appearances of healthy leaves.
- Model Customization: Build upon the CycleGAN framework, incorporating a mask encoder and a style-consistency loss.
- Input: A source image (healthy leaf) and a binary mask defining the Region of Interest (ROI).
- Key Components:
- Mask Encoder: Informs the generator which part of the image (the leaf) should be translated.
- Style-Consistency Loss: Ensures that the style-related features (illumination, background, viewpoint) of the source image are maintained in the generated image. This is based on the hypothesis that images can be factorized into label-related and style-related components [71].
- Output: A synthetic diseased leaf image that retains the original healthy leaf's "style," along with the original annotations (mask), making it immediately usable for training object detection and instance segmentation models.
The following diagram illustrates the logical workflow for selecting and applying these data augmentation strategies based on the specific data challenge.
Figure 1: Data Augmentation Strategy Selection Workflow
Transfer Learning Protocols
Transfer learning repurposes a model pre-trained on a large, general dataset (e.g., ImageNet) for a specific plant phenotyping task, significantly reducing the required amount of task-specific data [72].
Protocol 3.1: Adaptive Transfer Learning for Phenotyping
- Base Model Acquisition: Select a pre-trained Convolutional Neural Network (CNN) such as Inception-v3 or ResNet. These models have learned rich feature extractors from millions of images.
- Model Surgery:
- Remove the original classification head (the final fully connected layer).
- Replace it with a new, randomly initialized head tailored to the target task (e.g., a new classifier for 14 crop species and 26 diseases [72]).
- Fine-Tuning Strategies:
- Strategy A (Feature Extractor): Freeze the weights of the base model's convolutional layers and only train the new head. This is efficient and effective for small, similar datasets.
- Strategy B (Full Fine-Tuning): Unfreeze all or some of the layers of the base model and train the entire network with a low learning rate. This is applicable when the target dataset is larger or more complex.
- Training: Compile the model with a suitable optimizer (e.g., Adam) and loss function (e.g., cross-entropy), and train on the target plant phenotyping dataset. Studies have reported accuracies of over 99% for species and disease identification using this approach [72].
Experimental Validation and Benchmarking
To validate the efficacy of augmentation and transfer learning, quantitative benchmarking against established metrics is essential.
Table 2: Key Performance Metrics for Model Evaluation
| Metric | Formula / Description | Interpretation in Plant Phenotyping | ||||||
|---|---|---|---|---|---|---|---|---|
| Testing Accuracy | ( \frac{\text{Correct Predictions}}{\text{Total Predictions}} ) | Overall model performance for classification tasks. Values >99% have been reported [72]. | ||||||
| Dice Score (F1) | ( \frac{2 \times | X \cap Y | }{ | X | + | Y | } ) | Measures segmentation overlap between prediction (X) and ground truth (Y). A score of 0.80 indicates good performance [68]. |
| Cross-Entropy Error | ( - \frac{1}{N} \sum{i=1}^{N} \sum{c=1}^{M} y{i,c} \log(\hat{y}{i,c}) ) | Quantifies the divergence between predicted and true class distributions. <2% is considered low error [68]. |
Protocol 4.1: Benchmarking Augmentation for Root Segmentation
- Baseline: Train a SegNet model on the original, imbalanced root image dataset [68].
- Intervention: Train an identical SegNet model on the dataset augmented using the cGAN-based method from Protocol 2.2.1.
- Evaluation: Compare the Dice Score and cross-entropy error of both models on a held-out test set. The model trained on the augmented dataset demonstrated a Dice Score of nearly 0.80 and a cross-entropy error of less than 2%, showcasing significant improvement over the baseline [68].
The Scientist's Toolkit: Research Reagent Solutions
This section catalogs essential computational tools and datasets used in the featured studies.
Table 3: Key Research Reagents for Advanced Plant Phenotyping
| Research Reagent | Type | Function in Experiment |
|---|---|---|
| Pix2PixHD | Software Model (cGAN) | Generates high-resolution, realistic synthetic root images and annotations to combat pixel-wise class imbalance [68]. |
| Style-Consistent Image Translation (SCIT) | Software Model (GAN) | Translates images from a source domain (healthy) to a target domain (diseased) while preserving style variations for instance-level augmentation [71]. |
| SegNet | Software Model (CNN) | Performs pixel-wise binary semantic segmentation of plant roots from the background; used to validate augmentation efficacy [68]. |
| Inception-v3 | Software Model (CNN) | A pre-trained network used as a feature extractor in transfer learning for species and disease identification [72]. |
| AirSurf-Lettuce | Software Platform | A custom analytic platform combining computer vision and CNN for high-throughput scoring and categorization of millions of lettuces from aerial imagery [73]. |
| NDVI Aerial Imagery | Dataset | Provides spectral data correlated with biomass and greenness, used as input for large-scale field phenotyping [73]. |
Integrating sophisticated data augmentation and transfer learning techniques is paramount for advancing plant phenotyping research in the face of data scarcity. The protocols and reagents detailed herein provide a reproducible framework for researchers to enhance the accuracy, robustness, and generalizability of their deep learning models, ultimately accelerating progress in crop breeding and precision agriculture.
In plant phenotyping, the ability of deep learning models to perform reliably under new environmental conditions and across different plant species—a capability known as model generalization—remains a significant challenge. Plant phenotyping, the quantitative assessment of plant traits, is essential for understanding plant behavior, improving crop yields, and advancing precision agriculture [32]. Traditional models often exhibit performance degradation due to the complex interplay between genotype, phenotype, and environment, as well as the high biological variability between species [74] [75].
This application note details practical methodologies and protocols to enhance model generalization by specifically addressing environmental variability and enabling cross-species application. The protocols are designed for researchers and scientists employing deep learning and computer vision in plant phenotyping research.
Core Challenges in Plant Phenotyping
Environmental Variability
A plant's phenotype results from its genotype expressed under specific environmental conditions. Models trained in controlled environments often fail in field conditions due to changes in lighting, weather, soil composition, and background clutter [32] [18]. This domain shift is a primary obstacle to deploying robust phenotyping systems.
The Species Gap
The "species gap" refers to the performance drop a model experiences when applied to a plant species not represented in its training data [75]. Plants exhibit vast phenotypic diversity; leaves from different species can vary enormously in shape, size, and structure. Creating a dedicated, annotated dataset for every species of interest is computationally and financially intractable [75] [76].
Technical Approaches and Quantitative Comparisons
Architectural and Methodological Solutions
Researchers have developed several key strategies to overcome generalization challenges. The table below summarizes the core approaches, their applications, and representative models.
Table 1: Deep Learning Approaches for Improving Model Generalization in Plant Phenotyping
| Approach | Description | Primary Application | Key Features | Notable Models/Results |
|---|---|---|---|---|
| Environment-Aware Module [32] | Dynamically adapts model predictions based on environmental factors like weather and soil data. | Precision agriculture under variable conditions. | Integrates non-image data; improves reliability across agricultural settings. | Framework sets a new standard for scalable and accurate phenotyping [32]. |
| Universal Synthetic Data (UPGen) [75] | A synthetic data pipeline using Domain Randomisation (DR) to generate top-down images of diverse plant species. | Leaf instance segmentation across species. | Models biological variation; reduces need for manual annotation; bridges domain & species gaps. | State-of-the-art performance on the CVPPP Leaf Segmentation Challenge [75]. |
| Two-Stage Segmentation (PointNeXt) [76] | Uses a deep learning network for stem-leaf semantic segmentation followed by clustering for instance segmentation. | 3D organ segmentation across species and growth stages. | Handles structural variation; avoids destructive sampling; supports high-throughput analysis. | mIoU of 89.21% (sugarcane), 89.19% (maize), 83.05% (tomato); avg. accuracy > 94% [76]. |
| Biologically-Constrained Optimization [32] | Incorporates prior biological knowledge into the model's learning process. | Trait prediction and analysis. | Ensures predictions are biologically realistic; enhances interpretability and structural consistency. | Improves trait correlations and prediction accuracy [32]. |
| Transformer-based Models [52] | Utilizes self-attention mechanisms to capture long-range dependencies in data. | Drought phenotyping from spectral data; multimodal data fusion. | Captures global context; effective with heterogeneous inputs (hyperspectral, RGB, meteorological). | R² of 0.81 in cross-cultivar prediction of leaf water content, outperforming other models [52]. |
Performance Metrics Across Species
The following table quantifies the performance of a generalized model when applied to different plant species, demonstrating the effectiveness of the two-stage PointNeXt method.
Table 2: Cross-Species Performance of a Two-Stage Phenotyping Model (PointNeXt) [76]
| Plant Species | Number of Plants Tested | Mean Intersection over Union (mIoU) | Overall Accuracy | F1 Score (Leaf Instance) |
|---|---|---|---|---|
| Sugarcane | 35 | 89.21% | > 94% | > 90% |
| Maize | 14 | 89.19% | > 94% | > 90% |
| Tomato | 22 | 83.05% | > 94% | ~85% (Precision >90%, Recall lower) |
Experimental Protocols
Protocol 1: Implementing an Environment-Aware Deep Learning Framework
This protocol is adapted from a hybrid framework that integrates a generative model with environmental data [32].
Workflow Diagram: Environment-Aware Phenotyping
Materials & Equipment:
- Imaging System: High-resolution RGB camera or hyperspectral sensor.
- Environmental Sensors: Soil moisture, air temperature, humidity, and light intensity sensors.
- Computing Hardware: GPU-enabled workstation (e.g., NVIDIA RTX3090 [76]).
- Software: Python, PyTorch or TensorFlow, and libraries for data fusion (e.g., OpenCV, Pandas).
Procedure:
- Data Collection: Simultaneously capture plant images and corresponding environmental data across different times and conditions.
- Preprocessing: Standardize images and normalize sensor data. Create a unified dataset where each image sample is linked to its environmental metadata.
- Model Training:
- Architecture: Implement a hybrid model that combines a convolutional neural network (CNN) or Vision Transformer for image feature extraction with a separate module (e.g., a feedforward network) to process environmental data.
- Fusion: Fuse the image features and processed environmental features in a intermediate layer of the model.
- Constraint: Apply biological constraints as regularization terms in the loss function to penalize phenotypically impossible predictions.
- Validation: Validate the model on a separate dataset collected under distinct environmental conditions to assess generalization.
Protocol 2: Cross-Species Generalization using Synthetic Data
This protocol is based on the UPGen (Universal Plant Generator) framework and subsequent fine-tuning on real data [75].
Workflow Diagram: Cross-Species Generalization Pipeline
Materials & Equipment:
- Synthetic Data Pipeline: UPGen or similar software for generating synthetic plant images with domain randomization [75].
- Real Data: A small set of annotated images (e.g., 20-50 plants) for the target species [76].
- Computing Hardware: High-performance computing resources for synthetic data generation and model pre-training.
Procedure:
- Synthetic Pre-training:
- Use UPGen to generate a large and diverse dataset of synthetic plant images with perfect per-pixel annotations (e.g., for leaf instance segmentation). Domain Randomization should vary species morphology, lighting, and background.
- Pre-train a deep learning model (e.g., PointNeXt for 3D data or a CNN for 2D data) on this synthetic dataset.
- Fine-tuning on Real Data:
- Collect a limited set of real, annotated images for the target species.
- Take the pre-trained model and fine-tune all its layers on this small real dataset. Use a low learning rate to avoid catastrophic forgetting.
- Testing: Evaluate the fine-tuned model on a held-out test set of real images from the target species to measure cross-species performance.
The Scientist's Toolkit: Research Reagent Solutions
This table outlines essential computational "reagents" and resources for developing generalized plant phenotyping models.
Table 3: Essential Research Reagents and Resources for Generalized Plant Phenotyping
| Resource Name / Type | Function / Application | Key Features / Examples | Availability |
|---|---|---|---|
| Universal Plant Generator (UPGen) [75] | Synthetic data generation for bridging the species and domain gap. | Generates top-down RGB images with leaf instance segmentation masks; uses Domain Randomisation. | Publicly available dataset and model. |
| Pre-trained Models (PointNeXt) [76] | Provides a robust starting point for 3D plant organ segmentation. | Achieved high mIoU across sugarcane, maize, and tomato; can be fine-tuned. | Models from published research. |
| Plant Phenotyping Datasets (CVPPP) [75] | Benchmarking and training models for leaf instance segmentation. | Contains real images of rosette plants (e.g., Arabidopsis) with annotations. | Publicly available for research. |
| Molecular Libraries Small Molecule Repository [77] | Database of chemical compounds for CADD in plant pathology. | Used for virtual screening of agrochemicals against pathogen targets. | Free access (PubChem). |
| Homology Modeling Tools (SwissModel, Modeller) [77] | Predicting 3D protein structures for target-based agrochemical discovery. | Essential for Structure-Based Drug Design (SBDD) when experimental structures are unavailable. | Free academic access. |
| Virtual Screening Software (AutoDock, PyRX) [77] | Computational screening of chemical compound libraries against protein targets. | Identifies potential lead compounds for inhibiting pathogenicity factors. | Free academic access. |
The integration of Artificial Intelligence (AI), particularly deep learning, into plant phenotyping has revolutionized our ability to measure and analyze plant traits at high throughput. These algorithms empower the rapid measurement of plant characteristics from image data and enable predictions about the effects of genetics and environment on plant phenotype [78]. However, the advanced performance of these models often comes at a cost: interpretability. Many complex models function as "black boxes," where the internal decision-making process is opaque, making it challenging to understand the rationale behind specific predictions [79]. This lack of transparency hinders trust and limits the usefulness of AI for gaining insights into the fundamental biological processes driving plant phenotypes.
Explainable AI (XAI) emerges as a critical solution to this challenge. XAI addresses the interpretability gap by providing clarity into AI-driven decision-making processes, thereby fostering trust and understanding among stakeholders, including researchers, breeders, and drug development professionals who rely on these insights for critical decisions [80]. In the context of plant phenotyping, XAI is not merely a technical luxury but a necessity for sanity-checking models, increasing model reliability, and identifying potential dataset biases that could limit a model's applicability across different environmental conditions or plant species [78]. By understanding the 'why' behind model predictions, researchers can move beyond simple trait measurement to investigate the most influential features that lead to a given result, thereby unlocking deeper biological understanding [78].
The Critical Need for XAI in Agricultural and Pharmaceutical Research
Building Trust and Ensuring Reliability
The deployment of AI models in real-world agricultural and pharmaceutical settings requires a high degree of trust and accountability. For instance, when an AI model assists in diagnosing plant diseases or predicting crop yield, the end-users—whether farmers, breeders, or regulatory bodies—need to understand the basis for these predictions to trust and act upon them [80] [79]. XAI techniques provide justifiable outcomes that make the reasoning of AI systems clear, which is crucial for building this trust [79]. This transparency is particularly vital in pharmaceutical research involving plant-based compounds, where understanding the basis for a model's prediction about plant trait efficacy can directly impact drug discovery pipelines.
Identifying and Mitigating Bias
AI models are susceptible to learning biases present in their training data. In plant phenotyping, a model might perform well on images of plants taken under specific lighting conditions or growth stages but fail when applied to different scenarios. XAI helps in detecting these dataset biases by revealing the features that the model relies on for its predictions [78]. For example, if a disease detection model is incorrectly focusing on background soil patterns rather than leaf textures, XAI methods can uncover this flaw, allowing researchers to refine their datasets and models for more robust and generalizable performance [80].
Driving Biological Discovery
A primary application of XAI in plant phenotyping is its role in translating data into knowledge. By investigating which features an AI model deems important for predicting a specific phenotypic outcome, researchers can generate new testable hypotheses about plant biology [78]. For instance, an XAI analysis might reveal that certain subtle leaf coloration patterns, previously overlooked by human experts, are highly predictive of drought tolerance. This insight can direct subsequent genetic or biochemical studies, thereby accelerating crop breeding and the development of more resilient plant varieties for pharmaceutical and agricultural applications [78] [11].
Key XAI Techniques and Their Applications in Plant Phenotyping
A variety of XAI methodologies are being employed to interpret AI models in plant phenotyping. The selection of a specific technique often depends on the type of AI model used (e.g., convolutional neural networks, random forests) and the nature of the data (e.g., images, spectral data). The table below summarizes the prominent XAI techniques, their underlying principles, and their suitability for different phenotyping tasks.
Table 1: Key Explainable AI (XAI) Techniques and Applications in Plant Phenotyping
| XAI Technique | Type | Key Principle | Example Application in Plant Phenotyping |
|---|---|---|---|
| SHAP (Shapley Additive Explanations) [80] [81] | Model-agnostic | Borrows from game theory to assign each feature an importance value for a particular prediction. | Explaining feature importance in models predicting grain protein content from spectroscopic data [82]. |
| LIME (Local Interpretable Model-agnostic Explanations) [80] [81] | Model-agnostic | Approximates a complex model locally with a simpler, interpretable model to explain individual predictions. | Interpreting image-based disease detection by highlighting super-pixels in a leaf image that contributed to a "diseased" classification [80]. |
| Gradient-based Attribution Methods (e.g., Saliency Maps, Grad-CAM) [78] | Model-specific | Uses gradients from the deep learning model to identify which input pixels most influence the output. | Identifying the regions in a plant image (e.g., leaf tips, stem) that a model used for drought estimation or leaf counting [78] [11]. |
| Counterfactual Explanations [79] | Model-agnostic | Illustrates how a model's output would change with small, meaningful alterations to the input. | Demonstrating the minimal changes in leaf color or shape that would cause a model to classify a plant as healthy instead of stressed. |
These techniques can be applied across diverse phenotyping tasks. For example, in disease detection, models like YOLO11 can be used for classification, and XAI methods such as Grad-CAM can generate heatmaps over the input image, visually pinpointing lesions or discolorations that led to the diagnosis [80] [11]. In root localization and fruit counting, explainability helps researchers verify that the model is correctly identifying the target structures and not being confused by background clutter [83]. Furthermore, in predicting complex traits like climate resilience, XAI can help determine which environmental factors or plant morphological features the model finds most predictive, thereby validating the biological plausibility of the model's decisions [78].
Experimental Protocols for Implementing XAI in Plant Phenotyping
Protocol: XAI-Guided Workflow for Image-Based Plant Disease Detection
This protocol details the steps for training a deep learning model for plant disease detection and using XAI to interpret its predictions, thereby building trust and providing biological insights.
I. Materials and Setup
- Imaging Hardware: Standard RGB camera, hyperspectral sensor, or UAV (drone)-mounted camera system [11].
- Computing Infrastructure: Workstation with GPU (e.g., NVIDIA GeForce RTX series) for efficient deep learning model training and inference.
- Software Environment: Python 3.8+, with libraries including PyTorch or TensorFlow, OpenCV, scikit-learn, and XAI libraries such as SHAP, Captum, or iNNvestigate [78].
- Plant Material: Dataset of plant images (e.g., grapevine leaves) with corresponding health status labels (e.g., healthy, mild disease, severe disease) [11].
II. Procedure
Data Acquisition and Preprocessing:
- Collect a large, diverse, and well-labeled dataset of plant images under various lighting and background conditions [11].
- Preprocess images by resizing to a uniform dimension (e.g., 224x224 pixels), normalizing pixel values, and applying data augmentation techniques (rotation, flipping, brightness adjustment) to improve model robustness [32].
Model Training and Validation:
- Select a pre-trained convolutional neural network (CNN) like ResNet or a custom-trained YOLO11 model for object detection and classification [11].
- Fine-tune the model on the labeled plant disease dataset.
- Split data into training, validation, and test sets. Monitor performance metrics such as accuracy, precision, recall, and F1-score to ensure the model generalizes well to unseen data [83].
Model Explanation with XAI:
- For a Sample Prediction: Use a model-specific method like Grad-CAM on a test image. This will generate a heatmap overlay on the original image, highlighting regions most influential in the model's classification decision [78].
- For Global Feature Importance: Use a model-agnostic tool like SHAP. Calculate SHAP values for a representative subset of the test data to understand which features (e.g., color, texture) the model consistently relies on for distinguishing between disease classes [80].
Interpretation and Validation:
- Expert Validation: Present the XAI results (e.g., heatmaps, feature importance plots) to plant pathologists or domain experts. Correlate the model's focus areas with known biological symptoms of the disease.
- Bias and Error Analysis: Use XAI to investigate misclassified images. Determine if the model is focusing on incorrect features (e.g., image background instead of the leaf), indicating a potential bias in the training data [80].
Table 2: Research Reagent Solutions for XAI in Plant Phenotyping
| Reagent / Tool | Function / Application | Key Characteristics |
|---|---|---|
| Ultralytics YOLO11 [11] | Object detection and image classification model. | High accuracy and speed; suitable for real-time applications on drones or mobile devices. |
| U-Net Architecture [32] [82] | Semantic segmentation of plant images. | Precise pixel-wise labeling for tasks like leaf area measurement or root system analysis. |
| SHAP Library [80] [81] | Explain predictions of any machine learning model. | Model-agnostic; provides both local and global explanations. |
| Hyperspectral Imaging Sensors [11] | Capture data beyond the visible spectrum (e.g., near-infrared). | Enables assessment of biochemical traits like chlorophyll and water content. |
| VOSviewer [81] | Software for constructing and visualizing bibliometric networks. | Useful for literature review and mapping research trends in XAI and plant science. |
Protocol: Biologically-Constrained Optimization for Trait Prediction
This protocol incorporates prior biological knowledge into the AI model to ensure predictions are biologically realistic, enhancing both accuracy and interpretability [32].
I. Materials and Setup
- As in Protocol 4.1, plus access to structured biological knowledge (e.g., plant phenotyping ontologies, known genetic correlations between traits).
II. Procedure
- Define Biological Constraints: Identify plausible relationships between input features and output phenotypes. For example, specify that leaf area should be positively correlated with biomass, or that a certain pigment level must fall within a physiologically possible range.
- Incorporate Constraints into Model Training: Integrate these constraints as regularization terms in the model's loss function or use them to guide the architecture of the neural network [32].
- Train the Constrained Model: Follow standard training procedures while ensuring the model adheres to the defined biological rules.
- Explain and Compare: Use XAI techniques to compare the explanations from the biologically-constrained model with those from an unconstrained model. The constrained model's explanations should align more closely with established biological knowledge, increasing confidence in its predictions and providing more reliable insights [32].
Diagram 1: XAI validation workflow for plant phenotyping.
Visualization of Model Interpretations
Effectively communicating the outputs of XAI methods is crucial for researchers to gain actionable insights. Visualization is the primary medium for this communication. For image-based models, heatmaps and saliency maps are the most common and intuitive visualization tools. These maps are superimposed on the original input image, using a color gradient (e.g., red for high importance, blue for low importance) to indicate the regions that most strongly influenced the model's prediction [78]. For instance, when a model like YOLO11 classifies a grape leaf as diseased, a Grad-CAM heatmap can vividly show whether the model is correctly focusing on the diseased margins of the leaf or being misled by other elements [11].
Beyond heatmaps, other visualization techniques are valuable for different data types. Feature importance plots, such as those generated by SHAP, provide a clear, ranked list of the input variables that contribute most to a prediction or the model's overall behavior [80] [81]. This is particularly useful for non-image data, such as spectral or genetic information. Counterfactual explanations can be visualized by generating and comparing synthetic images that show the minimal changes required to alter the model's decision, helping users understand the model's decision boundaries [79]. The diagram below illustrates the logical flow from a complex, "black-box" deep learning model to a human-understandable interpretation through XAI.
Diagram 2: XAI logical flow from black box to interpretation.
Quantitative Analysis of XAI Impact
The value of XAI can be quantified through both its growing research footprint and its tangible improvements to model performance. Bibliometric analysis reveals a significant upward trend in publications at the intersection of XAI and life sciences. From 2022 to 2024, the annual average number of publications in related pharmaceutical fields exceeded 100, indicating a surge in academic and research interest [81]. Furthermore, the quality of research, as measured by citations per paper (TC/TP), reached a milestone in 2020, with TC/TP values often exceeding 10, reflecting the high impact and utility of this emerging field [81].
From a performance perspective, integrating XAI and biological constraints leads to more robust and accurate models. For example, a biologically-constrained optimization strategy has been shown to improve prediction accuracy and interpretability by ensuring model outputs are structurally consistent with known plant biology [32]. The market response also underscores this trend; the global plant phenotyping market, valued at approximately $311.73 million in 2025, is projected to grow to $520.80 million by 2030, a growth trajectory fueled by the adoption of advanced, trustworthy AI-driven technologies [11].
Table 3: Impact Metrics for XAI in Agricultural and Pharmaceutical Research
| Metric Area | Specific Metric | Findings / Impact |
|---|---|---|
| Research Activity [81] | Annual Publication Count (TP) | Surpassed 100 per year (2022-2024), showing rapid growth from <5 per year pre-2018. |
| Research Quality [81] | Average Citations per Paper (TC/TP) | Peaked in 2020, consistently >10 from 2018-2021, indicating high-impact research. |
| Model Performance [32] | Prediction Accuracy & Interpretability | Biologically-constrained models show improved accuracy and structural consistency. |
| Market Adoption [11] | Plant Phenotyping Market Value | $311.73M (2025) to $520.80M (2030), signaling trust and investment in advanced methods. |
| Strategic Priority [84] | Industry View on Explaining GenAI | 37% of the market views explaining GenAI results as a strategic priority beyond compliance. |
The imperative for Explainable AI in plant phenotyping is clear: to bridge the gap between high-performing AI models and the need for transparent, trustworthy, and actionable insights in agricultural and pharmaceutical research. By employing techniques like SHAP, LIME, and Grad-CAM, researchers can move from opaque predictions to interpretable decisions, validating model reliability, uncovering biological drivers, and ensuring that AI-powered tools can be confidently deployed in real-world scenarios.
Future advancements in XAI for plant phenotyping will likely focus on several key areas. There will be a stronger push for the integration of XAI early in model development cycles, rather than as a post-hoc analysis, fostering the creation of inherently interpretable models [80]. As these systems become more critical, ensuring the robustness of XAI methods themselves against adversarial attacks will be paramount [80]. Furthermore, the development of standardized benchmark datasets that include not only images and labels but also ground-truth explanation maps will be crucial for fairly evaluating and comparing different XAI approaches [80]. Finally, the move towards real-time monitoring and explanation will enable dynamic decision-making in the field, truly closing the loop between data acquisition, AI-driven insight, and actionable intervention in precision agriculture and drug development [80] [11].
In the field of plant phenotyping, occlusion and redundancy present significant challenges for accurately measuring plant traits. Occlusion occurs when plant organs, such as leaves or fruits, are partially or completely hidden from view by other plant parts, leading to inaccurate data collection and trait measurement [85]. Redundancy, often encountered in multi-view systems, refers to the collection of overlapping data from multiple sensors or viewpoints, which must be intelligently fused to create a complete and accurate representation of the plant [86] [87].
Advanced multi-view and fusion strategies have emerged as powerful solutions to these challenges, leveraging multiple data perspectives and sophisticated algorithms to overcome the limitations of single-view analysis. These approaches are particularly crucial for plant phenotyping applications, where non-destructive, high-throughput measurement of plant architecture, growth, and health is essential for crop improvement and precision agriculture [73] [88]. This document provides application notes and experimental protocols for implementing these advanced strategies within plant phenotyping research.
Multi-View Data Acquisition Technologies
Multi-view data acquisition forms the foundation for addressing occlusion and redundancy in plant phenotyping. The table below summarizes key technologies and their applications in plant phenotyping.
Table 1: Multi-View Data Acquisition Technologies for Plant Phenotyping
| Technology | Principles | Spatial Resolution | Applicable Plant Scales | Key Plant Phenotyping Traits |
|---|---|---|---|---|
| Laser Triangulation (LT) | Active laser line projection with camera capture; triangulation calculates depth [88] | Microns to millimeters [88] | Single plant, organ level [88] | Leaf morphology, surface texture, 3D structure [88] |
| Structure from Motion (SfM) | Passive 3D reconstruction from multiple 2D RGB images using corresponding points [88] | High (depends on camera resolution and image count) [88] | Miniplot, experimental field [88] | Plant size, volume, development over time [88] |
| Structured Light (SL) | Projects patterns onto surfaces; measures deformation to calculate 3D shape [88] | High [88] | Single plant, organ level [88] | Complex plant geometries, fine textures [88] |
| Time-of-Flight (ToF) | Measures round-trip time of active light signals to determine distance [89] [88] | Lower compared to LT and SfM [88] | Single plant, dynamic reconstruction [89] [88] | Canopy structure, plant height [89] |
| Terrestrial Laser Scanning (TLS) | Time-of-flight or phase-shift based scanning from multiple positions [88] | Millimeters [88] | Experimental field, open field [88] | Canopy parameters, canopy volume [88] |
Multi-View Fusion Strategies to Overcome Occlusion
Query-Based Multi-View Detection
The QMVDet framework represents a significant advancement in handling occlusion through an innovative camera-aware attention mechanism. Instead of treating all camera views equally, it selectively weights information from various viewpoints to minimize confusion caused by occlusions [86]. This approach simultaneously utilizes both 2D and 3D data while maintaining 2D-3D multiview consistency to guide the multiview detection network's training [86].
The system employs a query-based learning scheduler that balances the loading of camera-aware attention calculation, enabling the model to focus on the most reliable information from various camera views [86]. This method has demonstrated state-of-the-art accuracy on multiview detection benchmarks by effectively selecting the most reliable information from various camera views, thus minimizing the confusion caused by occlusions [86].
Automated Multimodal Deep Learning Fusion
For plant classification and identification tasks, automatic modality fusion provides a powerful approach to handling the limitations of single-organ views. This method integrates images from multiple plant organs—flowers, leaves, fruits, and stems—into a cohesive model, effectively creating a comprehensive biological representation even when individual organs are partially occluded [90].
The Multimodal Fusion Architecture Search (MFAS) automatically discovers optimal fusion strategies rather than relying on predetermined fusion points, making it particularly valuable for complex plant structures where occlusion patterns may vary [90]. This approach has demonstrated superior performance compared to late fusion strategies, achieving 82.61% accuracy on 979 classes in the Multimodal-PlantCLEF dataset, outperforming late fusion by 10.33% [90].
Manifold Learning for Multi-View Integration
Manifold learning approaches such as multi-SNE (an extension of t-SNE for multi-view data) provide effective solutions for visualizing and analyzing multi-view plant data. These methods generate unified low-dimensional embeddings that integrate information from multiple views, effectively mitigating occlusion effects present in individual viewpoints [91].
Multi-SNE updates low-dimensional embeddings by minimizing the dissimilarity between their probability distribution and the distribution of each data-view, with the total cost equaling the weighted sum of these dissimilarities [91]. This approach has demonstrated excellent performance for unified clustering of multi-omics single-cell data, suggesting strong applicability for plant phenotyping tasks where cellular-level occlusion may occur [91].
Experimental Protocols
Protocol 1: Implementation of QMVDet for 3D Plant Reconstruction
Objective: To create accurate 3D reconstructions of plants by implementing the QMVDet framework with camera-aware attention for handling occlusion.
Materials:
- Multiple calibrated cameras (minimum of 3)
- Camera calibration targets
- Computing workstation with GPU
- Plant specimens
- QMVDet software framework
Procedure:
- Camera Setup and Calibration:
- Arrange cameras around the plant specimen to maximize viewpoint coverage
- Ensure overlapping fields of view between adjacent cameras
- Perform camera calibration using calibration targets to determine intrinsic and extrinsic parameters
Data Collection:
- Capture synchronized images from all camera viewpoints
- Maintain consistent lighting conditions throughout acquisition
- Collect multiple image sets for different plant specimens or growth stages
Implementation of QMVDet Framework:
- Configure the 2D single-view detection network based on FairMOT architecture
- Implement the camera-aware attention mechanism for multiview aggregation
- Set up the 2D-3D consistency constraint for joint optimization
- Train the network using a multi-task learning approach
Evaluation and Validation:
- Compare results with ground truth manual measurements
- Assess performance using standard metrics: precision, recall, F1-score
- Quantify improvement over single-view and uniform weighting approaches
Diagram: QMVDet Workflow for 3D Plant Reconstruction
Protocol 2: Automated Multi-Organ Fusion for Plant Classification
Objective: To implement automated multimodal fusion for accurate plant classification using multiple organ images despite partial occlusions.
Materials:
- Digital camera or smartphone
- Plant specimens with multiple organs (flowers, leaves, fruits, stems)
- Computing environment with deep learning frameworks
- Multimodal-PlantCLEF dataset or custom dataset
Procedure:
- Dataset Preparation:
- Collect images of each plant specimen focusing on different organs separately
- For each specimen, capture images of flowers, leaves, fruits, and stems
- Apply data augmentation to increase dataset diversity
- Apply preprocessing including image resizing and normalization
Model Architecture Setup:
- Implement unimodal base models using MobileNetV3Small for each organ type
- Set up the modified Multimodal Fusion Architecture Search (MFAS)
- Configure multimodal dropout for robustness to missing modalities
Training Procedure:
- Train unimodal models separately for each organ type
- Apply MFAS to automatically discover optimal fusion strategy
- Implement cross-validation to prevent overfitting
- Use categorical cross-entropy as loss function
Evaluation:
- Compare performance with late fusion baseline
- Assess accuracy with missing modalities (simulated occlusion)
- Perform statistical testing using McNemar's test
Diagram: Automated Multi-Organ Fusion Architecture
Protocol 3: Active Vision System for Occluded Fruit Detection
Objective: To implement an active vision strategy where robotic systems dynamically adjust viewpoints to detect occluded fruits.
Materials:
- Robotic manipulator with mounted camera
- Depth sensor (RGB-D camera or LiDAR)
- Computing system for real-time processing
- Orchards or plants with fruits
Procedure:
- System Setup:
- Mount RGB-D camera on robotic manipulator
- Calibrate camera with robotic coordinate system
- Establish communication between vision system and motion controller
Initial Scanning:
- Perform initial 3D scan of plant environment
- Identify regions of interest and potential occlusion areas
- Generate initial fruit detection map with confidence scores
Active Viewpoint Planning:
- Analyze initial detections for low-confidence regions
- Calculate optimal viewpoints to reduce occlusion
- Plan collision-free trajectory for robotic manipulator
Iterative Refinement:
- Capture images from new viewpoints
- Update fruit detection map with new information
- Repeat viewpoint planning until confidence thresholds are met
Validation:
- Compare detection accuracy with static camera system
- Measure percentage of previously occluded fruits detected
- Calculate time efficiency of the active vision approach
The Scientist's Toolkit: Research Reagent Solutions
Table 2: Essential Research Tools for Multi-View Plant Phenotyping
| Tool/Category | Specific Examples | Function in Multi-View Phenotyping |
|---|---|---|
| 3D Sensing Technologies | Laser Triangulation Scanners, Structured Light Systems, Time-of-Flight Cameras, Terrestrial Laser Scanning [89] [88] | Capture high-resolution 3D geometry of plant structure from multiple viewpoints |
| Passive Reconstruction | RGB Cameras, Multi-view Stereo Systems, Structure from Motion Software [88] | Reconstruct 3D models from multiple 2D images without active illumination |
| Multi-View Fusion Algorithms | QMVDet, Multi-SNE, MFAS, iDeepViewLearn [86] [90] [87] | Integrate information from multiple views to overcome occlusion and redundancy |
| Deep Learning Frameworks | PyTorch, TensorFlow, YOLO11 [87] [11] | Provide base architectures for implementing custom multi-view fusion models |
| Occlusion Handling Techniques | Camera-Aware Attention, Amodal Instance Segmentation, Active Vision Strategies [86] [85] [92] | Specifically address partial and complete occlusion in plant imagery |
Quantitative Performance Comparison
The table below summarizes the performance metrics of various multi-view and fusion strategies for handling redundancy and occlusion in plant phenotyping applications.
Table 3: Performance Comparison of Multi-View and Fusion Strategies
| Method | Application Context | Key Metrics | Performance Advantages | Limitations |
|---|---|---|---|---|
| QMVDet with Camera-Aware Attention [86] | Multiview detection in visual sensor networks | State-of-the-art on Wildtrack and MultiviewX benchmarks | Selective information weighting minimizes occlusion confusion | Requires camera calibration and synchronized views |
| Automatic Multimodal Fusion [90] | Plant classification using multiple organs | 82.61% accuracy on 979 classes; outperforms late fusion by 10.33% | Robust to missing modalities through multimodal dropout | Requires multiple organ images per specimen |
| AirSurf-Lettuce [73] | Aerial phenotyping of lettuce fields | >98% accuracy in scoring and categorizing iceberg lettuces | High-throughput analysis of millions of lettuces | Specialized for specific crop type and aerial perspective |
| Active Deep Sensing [85] | Robotic fruit harvesting with occlusion | Improved detection of occluded fruits through viewpoint adjustment | Dynamically adapts to overcome occlusion in cluttered environments | Requires robotic system and real-time processing |
| 3D Reconstruction with Structured Light [89] | Fruit surface measurement | R²=0.97 for apple deformation; RMSE=0.755 mm | High precision for objects with inconspicuous surface features | Sensitive to environmental lighting conditions |
Advanced multi-view and fusion strategies represent a paradigm shift in addressing the persistent challenges of occlusion and redundancy in plant phenotyping. The integration of multiple data perspectives, coupled with sophisticated fusion algorithms such as camera-aware attention mechanisms and automated multimodal architecture search, enables researchers to extract comprehensive phenotypic information that would be impossible from single viewpoints.
The experimental protocols and application notes provided in this document offer practical guidance for implementing these strategies in plant phenotyping research. As these technologies continue to evolve, particularly with advances in active vision systems and real-time processing capabilities, the capacity to accurately measure plant traits in complex, occluded environments will significantly accelerate crop improvement programs and precision agriculture applications.
The adoption of deep learning for plant phenotyping in resource-limited settings is often hindered by computationally heavy models and the high cost of specialized equipment. Overcoming these computational and economic constraints requires the development of lightweight, efficient models and the strategic use of low-cost hardware. This paradigm shift makes high-throughput phenotyping accessible, supporting broader applications in precision agriculture and crop research. This document provides application notes and detailed protocols for developing and deploying such lightweight models, with a focus on practicality and cost-effectiveness for researchers and scientists.
Performance Analysis of Lightweight Models
The development of lightweight models involves balancing performance with computational demands such as model size and memory requirements. The following table summarizes the quantitative performance of several models discussed in the literature, providing a benchmark for comparison.
Table 1: Performance Metrics of Lightweight Deep Learning Models for Plant Phenotyping
| Model Name | Reported Accuracy/Performance | Model Size | Key Features/Techniques | Dataset(s) Used |
|---|---|---|---|---|
| AgarwoodNet [93] | 0.9859 F1 Score, 0.9859 Kappa | 37 MB | Depth-wise separable convolution, residual and inception modules [93] | APDD (5,472 images), TPPD (4,447 images) [93] |
| CAS-ModMobileNetV2 [93] | 99.8% Accuracy, AUC of 1.0 | Information Missing | Modified MobileNetV2 architecture [93] | Information Missing |
| Custom 15-layer CNN [93] | 98% Precision, 99% F1 Score | Information Missing | Platform as a Service cloud integration [93] | Citrus leaves (5 classes) |
| Multilevel Feature Fusion Net [93] | 99.83% Testing Accuracy | Information Missing | Channel attention mechanism, prescription module [93] | Tomato plant diseases |
Application Notes: Protocols for Model Development and Deployment
Protocol 1: Developing a Lightweight CNN from Scratch
This protocol outlines the process for developing and training a custom lightweight convolutional neural network (CNN), such as AgarwoodNet, for plant disease classification [93].
- Objective: To create a high-accuracy, memory-efficient model deployable on low-memory devices.
- Materials and Software:
- Procedure:
- Data Preprocessing: Resize all images to a uniform input size (e.g., 224x224 pixels). Apply data augmentation techniques including random rotation, flipping, and color jittering to improve model robustness [93].
- Model Architecture Design:
- Implement a core feature extraction module using depth-wise separable convolutions to reduce computational cost [93].
- Incorporate residual connections to facilitate the training of deeper networks and avoid vanishing gradients [93].
- Use inception-style modules to capture features at multiple scales efficiently [93].
- Model Training: Train the model using an Adam optimizer. Utilize techniques like adversarial domain adaptation and contrastive representation learning to improve generalization and reduce overfitting, especially when dealing with multi-source datasets [93].
- Performance Validation: Validate the model on a held-out test set. Assess using metrics beyond accuracy, including Cohen's Kappa, precision, recall, and F1 scores to ensure comprehensive evaluation [93].
The workflow for this protocol is illustrated below.
Protocol 2: Deploying Models on Low-Cost Phenotyping Stations
This protocol describes the assembly of a low-cost image acquisition station and the deployment of a trained model for automated analysis, based on the RaspiPheno platform [94].
- Objective: To establish an affordable, portable phenotyping platform for in-situ image capture and analysis.
- Materials and Hardware:
- Procedure:
- Hardware Assembly:
- Construct the physical frame from wood or 3D-printed parts.
- Mount the Raspberry Pi camera module at a fixed height to ensure consistent image perspective.
- Install LED lights around the camera to create a uniform lighting environment and minimize shadows.
- Secure the Raspberry Pi computer to the frame.
- Software Setup:
- Install the operating system on the Raspberry Pi.
- Deploy the pre-trained lightweight model (e.g., a TensorFlow Lite version of AgarwoodNet) onto the Raspberry Pi.
- Install and configure the RaspiPheno App to automate the process of image capture, analysis, and result logging [94].
- Operation and Data Collection:
- Place the plant sample within the imaging station.
- Execute the RaspiPheno App, which will automatically capture an image and run inference using the deployed model.
- The application will output a phenotypic measurement or classification result (e.g., disease diagnosis), which can be stored or transmitted.
- Hardware Assembly:
The architecture of this low-cost phenotyping station is as follows.
Protocol 3: Leveraging Advanced 3D Phenotyping on a Budget
While 3D phenotyping offers superior data, it is often considered expensive. This protocol outlines cost-effective methods for 3D plant reconstruction [95].
- Objective: To perform 3D plant reconstruction and analysis using low-cost, passive imaging techniques.
- Materials:
- Camera: A standard digital camera or smartphone.
- Software: Photogrammetry software (e.g., using structure-from-motion and multi-view-stereo techniques) [95].
- Calibration Target: A checkerboard or object of known dimensions for scale reference.
- Procedure:
- Image Acquisition:
- Place the plant on a turntable or move around it, capturing tens to hundreds of images from overlapping viewpoints, covering all angles [95].
- Ensure consistent, diffuse lighting to avoid sharp shadows and highlights.
- 3D Model Reconstruction:
- Input the image set into the photogrammetry software.
- The software will automatically generate a dense 3D point cloud by detecting and matching features across multiple images [95].
- Trait Extraction:
- Use the resulting 3D model to measure morphological traits such as plant biomass, leaf area, and leaf angle.
- Segment individual plant organs (e.g., leaves, stems) from the 3D model for more detailed analysis.
- Image Acquisition:
The Scientist's Toolkit: Essential Research Reagents and Materials
The following table catalogs key hardware and software components for establishing a cost-effective plant phenotyping pipeline.
Table 2: Key Research Reagents and Materials for Low-Cost Plant Phenotyping
| Item Name | Function/Application | Specifications/Examples |
|---|---|---|
| Raspberry Pi & Camera | Core of a low-cost image acquisition station; handles image capture and on-device computation [94]. | Raspberry Pi 4 or 5; Raspberry Pi Camera Module v2 or higher [94]. |
| Low-Cost 3D Scanner | For 3D plant model reconstruction using active sensing [95]. | Microsoft Kinect sensor [95]. |
| AgarwoodNet Model | A pre-designed lightweight DL model for disease and pest classification [93]. | Model size: 37 MB; employs depth-wise separable convolutions [93]. |
| RaspiPheno Pipe/App | Automated workflow software for image analysis on Raspberry Pi platforms [94]. | Available via GitHub; automates analysis without advanced computer skills [94]. |
| Plant Phenotyping Datasets | Benchmark datasets for training and validating models on tasks like segmentation and classification [38]. | Available from plant-phenotyping.org; include annotations for various tasks [38]. |
The integration of thoughtfully designed lightweight models like AgarwoodNet with affordable, modular hardware platforms such as those built on Raspberry Pi demonstrates a viable path forward for plant phenotyping in resource-constrained environments [93] [94]. The protocols outlined for model development, low-cost station deployment, and budget 3D phenotyping provide a concrete starting point for researchers. By prioritizing computational efficiency and economic feasibility, these approaches significantly lower the barrier to entry for high-quality phenotyping, accelerating research in both academic and industrial settings, including drug development from plant-based compounds.
Benchmarking Performance: A Comparative Analysis of Deep Learning Models and Datasets
A significant performance gap exists between controlled laboratory environments and complex field conditions in image-based plant phenotyping, often referred to as the "phenotyping gap" [96]. This discrepancy presents a major bottleneck in translating advanced deep learning models from research prototypes into practical agricultural tools. While laboratory conditions can yield accuracy rates of 95-99%, these same models frequently achieve only 70-85% accuracy when deployed in real-world agricultural settings [97]. This application note systematically analyzes the factors contributing to this accuracy gap and provides detailed protocols for developing more robust plant phenotyping models that maintain performance across deployment environments, thereby supporting more reliable crop breeding and management decisions.
Quantitative Analysis of the Performance Gap
Comparative Performance Across Environments
Table 1: Performance Comparison of Plant Disease Detection Models in Laboratory vs. Field Conditions
| Model Architecture | Laboratory Accuracy (%) | Field Accuracy (%) | Performance Gap (Percentage Points) | Key Limitations in Field Conditions |
|---|---|---|---|---|
| Traditional CNNs | 95-99 | 53-85 | 42-14 | Sensitive to environmental variability, background complexity |
| Transformer-based (SWIN) | 95-99 | ~88 | 7-11 | Better robustness to lighting, occlusion |
| Custom AirSurf-Lettuce [73] | N/A | >98 (Lettuce counting) | Minimal | Specialized for specific crop, high-quality NDVI imagery |
| BluVision Micro [98] | N/A | High (Microscopic phenotyping) | Minimal | Controlled microscopic imaging environment |
Factors Contributing to the Accuracy Gap
The performance discrepancy between laboratory and field environments stems from multiple technical and environmental challenges that impact model generalizability [97]:
Environmental Variability: Field conditions introduce significant variations in illumination (bright sunlight to cloudy conditions), background complexity (soil types, mulch, neighboring plants), viewing angles, and plant growth stages that are not present in controlled laboratory settings [97].
Data Limitations: Annotated datasets from field environments remain difficult to obtain at scale due to the requirement for expert plant pathologists to verify disease classifications. This creates bottlenecks in dataset expansion and diversification, leading to models that struggle with regional biases or coverage gaps for certain species and disease variants [97].
Cross-Species Generalization: Models trained on specific plant species (e.g., tomato leaves) often fail to generalize to other species (e.g., cucumber plants) due to fundamental differences in leaf structure and coloration patterns, a phenomenon known as catastrophic forgetting [97].
Early Detection Challenges: Identifying plant diseases during initial development stages presents substantial technical difficulties, as early infection symptoms may manifest as minute physiological changes before visible symptoms appear [97].
Experimental Protocols for Robust Model Development
Protocol 1: Cross-Environment Model Validation
Purpose: To systematically evaluate model performance across laboratory and field conditions and identify failure modes.
Materials:
- Imaging systems (RGB cameras, hyperspectral sensors)
- Controlled growth chambers or greenhouses
- Field plots with target crops
- Computing infrastructure for deep learning
Procedure:
- Dataset Collection:
- Acquire images in controlled laboratory conditions using standardized protocols [96]
- Collect field images across multiple time points, locations, and environmental conditions
- Ensure precise annotation by domain experts for both environments
Environmental Stress Testing:
- Deliberately introduce environmental variations in test datasets
- Include images with different lighting conditions (morning, noon, afternoon)
- Incorporate images with occlusions, soil variations, and multiple growth stages
Performance Metrics Analysis:
- Calculate accuracy, precision, recall, and F1-score separately for laboratory and field datasets
- Perform error analysis to identify common failure patterns in field conditions
- Assess model calibration (confidence scores should reflect actual likelihood of correct prediction)
Troubleshooting Tip: If performance gap exceeds 15 percentage points, augment training data with more diverse field examples and employ domain adaptation techniques.
Protocol 2: Transformer-Based Model Implementation
Purpose: To leverage state-of-the-art transformer architectures that demonstrate improved robustness in field conditions.
Materials:
- SWIN transformer architecture pretrained on ImageNet
- Plant phenotyping dataset with laboratory and field images
- High-performance computing resources with GPU acceleration
Procedure:
- Data Preparation:
- Curate dataset with minimum 1,000 images per category from both laboratory and field environments
- Apply standardized preprocessing: resize to 224×224 pixels, normalize pixel values
- Implement data augmentation: random cropping, rotation, color jittering, lighting variations
Model Configuration:
- Initialize with SWIN-Base architecture pretrained on ImageNet
- Replace final classification layer with number of target plant disease classes
- Set initial learning rate to 5e-5 with cosine decay scheduling
Training Protocol:
- Employ progressive training: first on laboratory images, then fine-tune on field images
- Utilize mixed-precision training for efficiency
- Implement early stopping with patience of 10 epochs based on validation loss
Interpretability Analysis:
- Apply Grad-CAM or other XAI techniques to visualize model focus areas [18]
- Verify that model attention aligns with biological regions of interest
- Identify potential spurious correlations that may affect field performance
Validation: The model should achieve >85% accuracy on field datasets and maintain performance within 10 percentage points of laboratory accuracy [97].
Visualization of Experimental Workflows
Cross-Environment Model Validation Protocol
Model Selection and Optimization Workflow
The Scientist's Toolkit: Research Reagent Solutions
Table 2: Essential Materials and Technologies for Plant Phenotyping Research
| Category | Specific Technology/Solution | Function in Phenotyping | Considerations for Deployment |
|---|---|---|---|
| Imaging Modalities | RGB Imaging (500-2000 USD) [97] | Accessible detection of visible symptoms, plant architecture assessment | Cost-effective but limited to visible spectrum |
| Hyperspectral Imaging (20,000-50,000 USD) [97] | Identification of physiological changes before visible symptoms appear | Higher cost enables pre-symptomatic detection | |
| NDVI Sensors [73] | Vegetation index correlation with biomass and leaf area | Effective for yield-related phenotyping | |
| Platform Systems | LemnaTec Scanalyzer [96] | Automated high-throughput phenotyping in controlled environments | Laboratory-focused system |
| AirSurf-Lettuce Platform [73] | Automated analysis of ultra-large aerial imagery for crop counting | Field-deployable for large-scale phenotyping | |
| BluVision Micro [98] | High-throughput microscopic phenotyping of plant-pathogen interactions | Specialized for microscopic analysis | |
| Machine Learning Frameworks | Transformer Architectures (SWIN) [97] | Superior robustness in field conditions, better handling of environmental variations | 88% field accuracy vs. 53% for traditional CNNs |
| Convolutional Neural Networks [9] | Baseline model performance, well-established architectures | Laboratory accuracy of 95-99% but field performance drops significantly | |
| Explainable AI (XAI) Methods [18] | Model interpretation, trust-building, biological insight generation | Critical for understanding model decisions in field conditions |
Discussion and Implementation Guidelines
The significant accuracy gap between laboratory and field performance in plant phenotyping underscores the critical need for robust model development strategies that prioritize real-world deployment viability over laboratory optimization. The evidence indicates that transformer-based architectures, particularly SWIN, demonstrate superior performance maintenance in field conditions, achieving approximately 88% accuracy compared to 53% for traditional CNNs [97]. This performance advantage stems from their better handling of environmental variability and complex background elements present in agricultural settings.
Successful implementation requires systematic approaches to dataset development, with particular emphasis on incorporating diverse field conditions throughout the model development lifecycle rather than as an afterthought. The integration of explainable AI techniques provides crucial insights into model decision-making processes, enabling researchers to identify potential failure modes and align model attention with biologically relevant features [18]. Furthermore, the economic considerations of imaging technologies must be balanced against deployment requirements, with RGB systems offering accessibility (500-2000 USD) while hyperspectral imaging (20,000-50,000 USD) enables pre-symptomatic detection capabilities [97].
For researchers implementing these protocols, we recommend prioritizing cross-environment validation from the initial stages of model development, incorporating real-world constraints into laboratory training procedures, and establishing continuous performance monitoring systems for deployed models. These practices will significantly enhance the translational potential of plant phenotyping research from laboratory environments to practical agricultural applications, ultimately contributing to improved global food security through more reliable crop monitoring and management systems.
The rapid advancement of deep learning is redefining how visual data is processed and understood by machines, with significant implications for plant phenotyping research [99]. This field, which involves measuring a plant's structural and functional characteristics, is crucial for improving crop breeding and sustainable farming practices [18]. However, traditional phenotyping methods are often labor-intensive, time-consuming, and prone to errors [11] [100].
Convolutional Neural Networks (CNNs) have long served as the backbone for image-based plant phenotyping tasks [101]. More recently, Vision Transformers (ViTs) have emerged as a competitive alternative, applying the transformer architecture to image data by treating images as sequences of patches [99] [101]. Simultaneously, Self-Supervised Learning (SSL) has gained prominence as a technique that reduces reliance on extensively labeled datasets by learning from the inherent structure of the data itself [99] [100].
This application note provides a structured comparison of these key architectures—CNNs, Vision Transformers, and SSL methods—evaluating their performance on public plant phenotyping datasets. We present quantitative benchmarks, detailed experimental protocols, and practical toolkits to guide researchers in selecting appropriate architectures for specific phenotyping tasks.
Background and Definitions
Convolutional Neural Networks (CNNs) are specifically designed for processing structured grid data like images. They utilize convolutional layers to automatically learn spatial hierarchies of features, making them particularly effective for image classification, object detection, and segmentation tasks [101]. Popular CNN architectures include ResNet and U-Net, which have demonstrated strong performance on various plant phenotyping tasks [36] [102].
Vision Transformers (ViTs) treat images as sequences of patches and utilize self-attention mechanisms to learn relationships between these patches. This architecture excels at capturing global context within images, though it typically requires larger datasets for optimal performance compared to CNNs [99] [101].
Self-Supervised Learning (SSL) encompasses methods that learn representations from unlabeled data by defining pretext tasks. In computer vision, SSL methods are generally segmented into contrastive, generative, and predictive approaches [99]. Contrastive methods, such as Momentum Contrast (MoCo) and Dense Contrastive Learning (DenseCL), aim to learn patterns by contrasting positive and negative samples [100].
Key Public Datasets for Plant Phenotyping
Public datasets are essential for benchmarking phenotyping algorithms. The Plant Phenotyping Datasets collection provides annotated imaging data for developing and evaluating computer vision algorithms [38]. Key datasets include:
- CVPPP: Used for plant segmentation, leaf counting, and leaf tracking.
- KOMATSUNA: Contains images of rosette plants for segmentation and counting tasks.
- Pheno4D: Provides 4D plant data (3D + time) for analyzing growth dynamics.
These datasets support various computer vision problems including multi-instance detection, object counting, foreground-background segmentation, and boundary estimation [38].
Performance Benchmarking
Comparative Performance Across Architectures
Table 1: Performance comparison of CNN, Vision Transformer, and SSL methods on plant phenotyping tasks.
| Architecture | Specific Model | Task | Dataset | Performance Metrics | Key Findings |
|---|---|---|---|---|---|
| CNN | LC-Net (with SegNet) | Leaf counting | CVPPP + KOMATSUNA | Superior performance vs. state-of-the-art [36] | Incorporating segmented leaf images enhanced counting accuracy, especially for overlapping leaves. |
| Vision Transformer | Plant-MAE | 3D organ segmentation | Maize, Tomato, Potato, Pheno4D | Precision, Recall, F1 score >80%; high mIoU [103] | Achieved strong segmentation accuracy across diverse crops and data acquisition methods. |
| SSL | MoCo v2 | Wheat head detection, plant instance detection | Wheat dataset | Lower performance vs. supervised pre-training [100] | Performance varied based on dataset redundancy and task requirements. |
| SSL | DenseCL | Leaf counting | Wheat dataset | Competitive performance vs. supervised methods [100] | Outperformed supervised pre-training for leaf counting task. |
| CNN | DeepLab V3+, U-Net, Refine Net | Leaf segmentation | CVPPP + KOMATSUNA | SegNet showed superior results [36] | CNN-based segmentation models demonstrated varying capabilities on merged datasets. |
Relative Strengths and Limitations
Table 2: Characteristics of different architectural approaches to plant phenotyping.
| Characteristic | CNNs | Vision Transformers | SSL Methods |
|---|---|---|---|
| Feature Learning | Local feature extraction through convolutional filters [101] | Global feature extraction using self-attention [101] | Varies by approach (contrastive, generative, predictive) [99] |
| Data Efficiency | Performs well with relatively small datasets [101] | Typically requires large datasets for optimal performance [101] | Reduces need for labeled data; uses unlabeled data effectively [99] [103] |
| Computational Requirements | Efficient due to localized operations [101] | Higher computational cost due to self-attention mechanisms [101] | Pretraining can be computationally intensive but fine-tuning is efficient [100] |
| Interpretability | Easier to interpret as features are spatially structured [101] | More challenging to interpret due to global feature representation [101] | Varies by method; some contrastive approaches offer better interpretability [99] |
| Implementation Complexity | Well-established with extensive frameworks [101] | Increasing support but less mature than CNNs [99] | Complex pretraining phase but standard fine-tuning [100] |
Experimental Protocols
Protocol 1: Implementing SSL for Image-Based Plant Phenotyping
This protocol outlines the procedure for benchmarking self-supervised contrastive learning methods for image-based plant phenotyping, based on the study by Ogidi et al. (2023) [100].
Materials and Equipment
- High-resolution imaging system (RGB cameras, hyperspectral sensors, or 3D scanners)
- Computing hardware with NVIDIA GPUs (e.g., GeForce series)
- Deep learning frameworks: TensorFlow, PyTorch, or Scikit-learn
- Public plant phenotyping datasets (CVPPP, KOMATSUNA, or specialized wheat datasets)
Procedure
Data Collection and Preparation
- Capture plant images using standardized imaging protocols under consistent lighting conditions.
- For wheat phenotyping: Collect images focusing on wheat heads, spikes, and leaves at different growth stages.
- Apply data augmentation techniques including random rotation, flipping, color jittering, and scaling to enhance dataset diversity [100] [102].
Model Selection and Configuration
- Select SSL methods for benchmarking: Momentum Contrast (MoCo) v2 and Dense Contrastive Learning (DenseCL).
- Implement comparison models with supervised pre-training for baseline performance.
- Configure model architectures according to original specifications with adjustments for plant-specific features.
Pre-training Phase
- Conduct pre-training on unlabeled datasets using the contrastive learning objective.
- For MoCo v2: Maintain a queue of negative samples and use a momentum encoder to stabilize training.
- For DenseCL: Focus on local pixel-level features rather than global image representations.
- Set training duration to 500 epochs with appropriate batch sizes (e.g., 520 for pretraining).
Fine-tuning and Evaluation
- Fine-tune pre-trained models on specific phenotyping tasks: wheat head detection, plant instance detection, wheat spikelet counting, and leaf counting.
- Use reduced batch sizes (e.g., 20) for fine-tuning with 300 epochs.
- Evaluate model performance using task-specific metrics: mean Square Error (MSE) for counting tasks, precision/recall for detection tasks.
Performance Analysis
- Compare SSL methods with supervised pre-training approaches.
- Assess model sensitivity to dataset redundancy and data diversity.
- Evaluate generalization capability across different plant species and growth conditions.
Troubleshooting
- For poor performance: Increase dataset diversity and apply additional augmentation techniques.
- For training instability: Adjust learning rates, implement gradient clipping, or modify momentum parameters.
- For overfitting: Incorporate regularization techniques such as dropout or weight decay.
Protocol 2: CNN-Based Leaf Counting and Segmentation
This protocol details the procedure for implementing LC-Net, a CNN-based model for leaf counting in rosette plants [36].
Materials and Equipment
- Standard RGB camera for plant imaging
- Computing system with NVIDIA GeForce GPU (1650 or higher)
- TensorFlow and Scikit-learn frameworks
- CVPPP and KOMATSUNA datasets
Procedure
Data Preparation
- Merge CVPPP and KOMATSUNA datasets to create a combined dataset of approximately 2010 images.
- Partition data into training, validation, and testing sets (typical split: 70%/15%/15%).
- Resize images to standard dimensions and apply normalization.
Leaf Segmentation
- Implement and compare multiple CNN segmentation models: DeepLab V3+, SegNet, U-Net, and RefineNet.
- Select SegNet as the primary segmentation model based on superior visual and numerical performance.
- Add a normalization layer to eliminate unwanted pixels caused by uneven backgrounds or light reflections.
LC-Net Implementation
- Design the LC-Net architecture to process both original RGB images and segmented leaf images.
- Structure the network with convolution blocks (CB) comprising convolution layers, batch normalization, and activation functions.
- Implement three CBs with reduced parameter size through inclusion of smaller filter convolutions.
Training and Validation
- Train segmentation and counting models independently.
- Use combined input of original and segmented images to enhance counting accuracy.
- Evaluate segmentation quality using accuracy, Intersection over Union (IoU), and Dice score.
- Assess counting performance using Mean Square Error (MSE), absolute difference count, and percentage agreement.
Troubleshooting
- For segmentation inaccuracies: Adjust normalization parameters to better handle background variations.
- For poor counting performance with overlapping leaves: Increase proportion of overlapping leaf examples in training data.
- For generalization issues: Apply additional data augmentation specifically for challenging scenarios.
Visualization of Experimental Workflows
SSL Pretraining and Fine-tuning Workflow
CNN-Based Leaf Counting Pipeline
The Scientist's Toolkit
Table 3: Essential research reagents and computational tools for plant phenotyping research.
| Tool/Resource | Type | Function | Example Applications |
|---|---|---|---|
| CVPPP Dataset | Dataset | Benchmark dataset for plant segmentation and leaf counting | Evaluating segmentation algorithms, leaf counting models [38] |
| KOMATSUNA Dataset | Dataset | Rosette plant images for phenotyping tasks | Training and validation of leaf counting models [36] |
| Pheno4D Dataset | Dataset | 4D plant data (3D + time) | Analyzing plant growth dynamics and structural changes [103] |
| SegNet | Algorithm | CNN-based segmentation model | Leaf segmentation in complex plant images [36] |
| MoCo v2 | Algorithm | Self-supervised contrastive learning method | Learning representations from unlabeled plant images [100] |
| Plant-MAE | Algorithm | Masked autoencoder for 3D plant data | 3D organ segmentation across multiple crops [103] |
| TensorFlow/PyTorch | Framework | Deep learning development | Implementing and training custom models [36] |
| RGB Imaging | Hardware | Standard color image capture | Basic plant morphology and color analysis [11] |
| Hyperspectral Sensors | Hardware | Capture beyond visible spectrum | Detecting plant stress and chemical composition [11] |
| 3D Scanning/LiDAR | Hardware | Three-dimensional modeling | Analyzing complex plant structures and biomass estimation [11] [103] |
This benchmarking study demonstrates that the optimal architecture for plant phenotyping depends on specific task requirements, data availability, and computational resources. CNNs remain strong performers for tasks requiring local feature extraction and when working with limited labeled data. Vision Transformers excel in capturing global context and have shown promising results in 3D phenotyping tasks. SSL methods offer a compelling approach for reducing dependency on labeled data while maintaining competitive performance.
The choice between these architectures should be guided by the specific phenotyping application, with CNNs suitable for standard segmentation and counting tasks, Vision Transformers advantageous for complex structural analysis, and SSL methods particularly valuable when labeled data is scarce or dataset diversity is high.
Future work in this field should focus on developing more specialized architectures for plant phenotyping, improving the interpretability of Transformer and SSL models, and creating comprehensive benchmarks across a wider range of crop species and growth conditions.
The Impact of Data Domain and Diversity on Downstream Task Performance
In plant phenotyping, the transition from hand-engineered computer vision pipelines to deep learning has created a paradigm shift, enabling the measurement of increasingly complex phenotypic traits [104]. However, this shift has also created a significant dependency on large, annotated datasets, which are expensive and time-consuming to produce [105] [106]. The domain and diversity of the data used to pre-train deep learning models are critical factors that directly influence model performance on downstream phenotyping tasks. Data domain refers to the specific context or source of the data (e.g., general images, natural images, plant images, or crop-specific images), while data diversity encompasses the variety of phenotypes, growth stages, environmental conditions, and imaging scenarios represented within a dataset [107]. This application note examines the impact of these factors and provides detailed protocols for leveraging domain-specific, diverse data to enhance plant phenotyping research.
The Critical Role of Data Domain and Diversity
Conceptual Framework and Key Definitions
The performance of a deep learning model on a target plant phenotyping task is fundamentally linked to the properties of the data on which it was pre-trained.
- Data Domain: The similarity between the pre-training (source) data and the target (downstream) task data. Research has demonstrated a performance hierarchy: models pre-trained on crop images consistently outperform those pre-trained on general plant images, which in turn outperform models pre-trained on broad natural or general images [107]. This underscores the value of within-domain transfer learning.
- Data Diversity: The breadth of phenotypic, environmental, and genotypic variations represented in a dataset. A diverse dataset enables models to learn robust, generalizable features that are invariant to irrelevant noise and variations [105]. Lack of diversity can lead to dataset shift, where a model trained on a limited distribution of phenotypes fails to generalize to a different testing distribution [106].
Quantitative Evidence of Impact
Benchmarking studies provide concrete evidence of how data domain and diversity influence downstream task performance. The following table summarizes key findings from large-scale evaluation studies.
Table 1: Impact of Pretraining Data Domain on Downstream Task Performance
| Downstream Task | Pretraining Domain (Ordered by Specificity) | Key Performance Metric | Result Trend | Primary Citation |
|---|---|---|---|---|
| Wheat Head Detection | ImageNet → iNaturalist → iNaturalist (Plants) → TerraByte Field Crop (TFC) | Mean Average Precision (mAP) | Performance maximized by using a diverse, domain-specific source dataset | [107] |
| Plant Instance Detection | ImageNet → iNaturalist → iNaturalist (Plants) → TerraByte Field Crop (TFC) | Mean Average Precision (mAP) | Domain-specific pretraining yields best performance | [107] |
| Leaf Counting (Arabidopsis) | Supervised (ImageNet) vs. Self-Supervised (MoCo v2, DenseCL) | Mean Absolute Error (MAE) | Self-supervised methods on domain-specific data can be competitive with or outperform supervised ImageNet pretraining | [107] |
| Rice Disease Classification | Supervised (ImageNet) vs. Self-Supervised (SimCLR on agricultural field images) | Classification Accuracy | Fine-tuning with only 1% of labeled in-domain data achieved 80.2% accuracy, highlighting enhanced data efficiency | [105] |
The data also reveals that self-supervised learning (SSL) methods, which learn representations from unlabeled data, are particularly sensitive to data redundancy and domain specificity. SSL models show greater performance degradation than supervised models when trained on redundant data (e.g., from video sequences with high overlap) [107]. Furthermore, the internal representations learned by SSL models differ significantly from those learned by supervised methods, potentially capturing features more relevant to phenotypic analysis [107].
Application Notes & Experimental Protocols
Protocol A: Self-Supervised Pre-training with a Domain-Specific Dataset
This protocol is adapted from studies that successfully applied the SimCLR framework to agricultural imagery to learn robust, general-purpose representations without the need for manual labeling [105].
1. Research Problem: How to leverage large, unannotated datasets of agricultural images to create a powerful backbone model for various downstream phenotyping tasks, thereby reducing annotation costs.
2. Experimental Premise: A model pre-trained via contrastive learning on a diverse, domain-specific dataset will learn feature representations that are highly transferable to downstream plant phenotyping tasks, such as disease classification, detection, and segmentation.
3. Materials and Reagents:
- Hardware: High-performance computing workstation with one or more modern GPUs (e.g., NVIDIA A100, RTX 4090), adequate storage for large image datasets.
- Software: Python (v3.8+), PyTorch or TensorFlow framework, OpenCV, NumPy.
- Dataset: A large, unlabeled collection of plant images. The dataset should be diverse, encompassing:
- Species/Varieties: Multiple crop species and cultivars.
- Growth Stages: From germination to maturity.
- Imaging Conditions: Variations in lighting, perspective, and background.
- Sensor Types: Images from mobile phones, drones, and fixed cameras.
4. Step-by-Step Methodology:
- Step 1: Data Curation. Collect and assemble a large, unlabeled dataset from domain-relevant sources (e.g., field images captured by mobile devices or UAVs). Ensure diversity in phenotypes and conditions.
- Step 2: Data Preprocessing. Resize all images to a uniform resolution (e.g., 224x224 pixels). Normalize pixel values.
- Step 3: Data Augmentation (for Contrastive Learning). For each image in a mini-batch, generate two randomly augmented views. Standard augmentations include:
- Random resized crop
- Random color jitter (strength: 0.5)
- Random Gaussian blur
- Random horizontal flip (probability: 0.5)
- Step 4: Model Architecture.
- Backbone Encoder: A standard CNN architecture (e.g., ResNet-50) without its final classification layer. This network maps an input image to a hidden representation vector,
h. - Projection Head: A small multi-layer perceptron (MLP) with one or more hidden layers (e.g., 3-layer MLP) that maps the representation
hto a lower-dimensional latent space,z, where the contrastive loss is applied.
- Backbone Encoder: A standard CNN architecture (e.g., ResNet-50) without its final classification layer. This network maps an input image to a hidden representation vector,
- Step 5: Pre-training via Contrastive Learning.
- Use a contrastive loss function (NT-Xent loss).
- For a batch of
Nimages, each image is augmented twice, creating2Ndata points. - For a given image, its augmented pair is treated as a positive sample, while all other
2(N-1)images in the batch are treated as negative samples. - The learning objective is to maximize the agreement (similarity) between positive pairs and minimize the agreement between negative pairs.
- Step 6: Model Output.
- After pre-training, discard the projection head.
- The backbone encoder is retained as a pre-trained feature extractor for downstream tasks. It outputs a high-dimensional feature vector (e.g., 2048-dim for ResNet-50) that encapsulates the visual semantics of the input image.
The workflow for this protocol, including the critical contrastive learning step, is visualized below.
Protocol B: Benchmarking Domain-Specific Transfer Learning
This protocol provides a methodology for empirically evaluating the impact of different pre-training domains on a specific downstream task, as conducted in benchmark studies [107].
1. Research Problem: To quantitatively determine which pre-training data domain yields the best performance for a specific plant phenotyping task (e.g., wheat head detection, leaf counting).
2. Experimental Premise: Pre-training a model on a domain-specific dataset will lead to superior downstream task performance compared to pre-training on a general-domain dataset.
3. Materials and Reagents:
- Hardware: Same as Protocol A.
- Software: Same as Protocol A.
- Datasets:
- Source Domains (for Pre-training): A set of datasets of varying domain specificity.
- General: ImageNet.
- Natural: iNaturalist 2021.
- Plant-Specific: Plants subset of iNaturalist.
- Crop-Specific: A dedicated crop phenotyping dataset (e.g., TerraByte Field Crop dataset).
- Target Dataset (for Fine-tuning/Evaluation): A labeled dataset for the specific downstream task (e.g., Global Wheat Head Detection dataset, MinneApple [105], Leaf Counting [106]).
- Source Domains (for Pre-training): A set of datasets of varying domain specificity.
4. Step-by-Step Methodology:
- Step 1: Model Pre-training. Pre-train multiple instances of the same model architecture (e.g., ResNet-50) on each of the source domain datasets. This can be done using supervised learning (if labels are available) or self-supervised learning (if not).
- Step 2: Model Adaptation for Downstream Task. For each pre-trained model, replace the final classification layer with a new task-specific head (e.g., a detection head like Faster R-CNN, or a regression head for counting).
- Step 3: Transfer Learning. Fine-tune the entire model (or parts of it) on the labeled target dataset. Use a standard split (e.g., 80/20 train/validation) and consistent hyperparameters (learning rate, batch size) across all experiments to ensure a fair comparison.
- Step 4: Performance Evaluation. Evaluate each fine-tuned model on the held-out test set of the target dataset. Use task-specific metrics:
- Detection: Mean Average Precision (mAP).
- Counting: Mean Absolute Error (MAE).
- Classification: Accuracy, F1-Score.
- Step 5: Data Diversity Analysis. Analyze the diversity of the pre-training datasets used. Investigate the impact of redundancy (e.g., by de-duplicating images from video sequences) on final task performance, particularly for SSL methods.
Table 2: Essential Research Reagent Solutions for Plant Phenotyping Experiments
| Reagent / Resource | Type | Primary Function in Experiment | Exemplars / Specifications |
|---|---|---|---|
| Image Datasets (General) | Data | Provides baseline features for transfer learning from a broad domain. | ImageNet, COCO |
| Image Datasets (Domain-Specific) | Data | Enables within-domain transfer learning; critical for robust feature learning in plant phenotyping. | TerraByte Field Crop (TFC), iNaturalist Plants subset, custom agricultural field imagery [105] [107] |
| Pre-trained Models (Supervised) | Software/Model | Serves as a starting point for transfer learning, providing generic visual feature extractors. | ImageNet-pretrained ResNet, VGG, EfficientNet models |
| Pre-trained Models (Self-Supervised) | Software/Model | Provides an alternative starting point trained without labels, often capturing features more robust to domain shift. | Models trained via MoCo v2, SimCLR, DenseCL on domain-specific data [105] [107] |
| Deep Learning Frameworks | Software | Provides the programming environment and tools for building, training, and evaluating deep learning models. | TensorFlow/Keras, PyTorch, Deep Plant Phenomics platform [104] |
| Synthetic Plant Generators | Software/Data | Augments small datasets; generates training data with perfect labels and controlled phenotype distributions to mitigate dataset shift. | L-system-based plant models, parametric synthetic plant generators [106] |
The Scientist's Toolkit
The successful application of the above protocols relies on a set of key resources, which are summarized in the table below.
The evidence is clear: the strategic selection of data domain and the conscious cultivation of data diversity are not merely preliminary steps but are integral to the success of deep learning applications in plant phenotyping. Leveraging domain-specific datasets for pre-training, whether through supervised or self-supervised methods, consistently leads to superior performance on downstream tasks while significantly reducing the burden of data annotation. Furthermore, ensuring diversity within these datasets—encompassing a wide range of phenotypes, genotypes, and environmental conditions—is paramount for building models that are robust, generalizable, and effective in real-world agricultural scenarios. The protocols and analyses provided herein offer a roadmap for researchers to systematically harness the power of data to drive future discoveries in plant biology and precision agriculture.
Plant phenotyping, the quantitative assessment of plant traits such as size, color, growth, and root structures, is fundamental to agricultural research and crop improvement [11]. Traditional methods reliant on manual visual observations and physical tools like rulers and calipers are increasingly being replaced by high-throughput automated systems leveraging computer vision and deep learning [11]. This shift is driven by the pressing need to develop climate-resilient crops and enhance agricultural productivity amidst challenges like global warming and a growing population [11]. Automated phenotyping represents a paradigm shift from subjective, low-efficiency methods to data-driven, non-destructive approaches that can capture dynamic plant processes with unprecedented precision and scale. This document, framed within a broader thesis on deep learning and computer vision for plant phenotyping, provides application notes and protocols detailing the quantitative advantages of automation over manual methods, with a focus on speed, accuracy, and consistency.
Quantitative Comparison: Automated vs. Manual Phenotyping
The superiority of automated phenotyping is demonstrated across multiple performance metrics. The following tables summarize quantitative gains observed in empirical studies.
Table 1: Performance Accuracy Comparison for Specific Phenotypic Traits
| Phenotypic Trait | Phenotyping Method | Reported Accuracy | Research Context |
|---|---|---|---|
| Plant Height | Automated 3D Point Cloud | 98.6% | Chinese Cymbidium Seedlings [108] |
| Leaf Count | Automated 3D Point Cloud | 100% | Chinese Cymbidium Seedlings [108] |
| Leaf Length | Automated 3D Point Cloud | 92.2% | Chinese Cymbidium Seedlings [108] |
| Leaf Area | Automated 3D Point Cloud | 82.3% | Chinese Cymbidium Seedlings [108] |
| Soybean Yield Prediction | Deep Learning (GRNN) | 97.43% | In-field Prediction [109] |
| Lettuce Growth Stage Classification | YOLO-VOLO-LS Model | ~100% | Greenhouse Conditions [109] |
| Wheat Spike Counting | Hybrid Task Cascade Model | 99.29% | Field Images [109] |
Table 2: Comparative Advantages of Automated vs. Manual Phenotyping
| Performance Metric | Traditional Manual Methods | Automated Phenotyping | Key Technological Enablers |
|---|---|---|---|
| Speed & Throughput | Time-consuming; low-throughput; difficult to scale [11] | Real-time or high-throughput analysis; scalable for large operations [11] | UAVs, robotics, high-speed sensors, cloud/edge computing [110] [11] |
| Measurement Accuracy | Subjective; prone to human error and inconsistency [11] | High objective accuracy (see Table 1); detects sub-visual traits [108] | Hyperspectral imaging, 3D reconstruction, deep learning models [11] |
| Operational Consistency | Variable results due to observer fatigue and subjectivity [11] | High consistency and reproducibility across time and samples [11] | Standardized algorithms, non-destructive sensors [11] |
| Trait Dynamicity | Captures a single moment; destructive sampling prevents continuous monitoring [11] | Captures dynamic growth processes and temporal patterns [55] [11] | Time-series data collection, non-invasive sensors [11] |
| Data Comprehensiveness | Limited to simple, easily observable traits [11] | Multimodal data integration (e.g., spectral, thermal, structural) [32] [11] | Multi-sensor fusion (RGB, LiDAR, thermal, hyperspectral) [11] |
Experimental Protocols for Automated Phenotyping
Protocol 1: Multi-View Plant Phenotyping with Redundancy Reduction
This protocol, based on the award-winning ViewSparsifier approach from the GroMo 2025 Challenge, is designed for robust estimation of traits like leaf count and plant age from multiple plant images while mitigating view redundancy [55].
1. Research Reagent Solutions
- Imaging Platform: A system capable of capturing images from multiple heights and angles (e.g., 5 height levels with 15° rotational increments) [55].
- Vision Transformer (ViT) Model: A pre-trained model for feature extraction (e.g., from frameworks like PyTorch or TensorFlow) [55].
- Computing Environment: A GPU-equipped workstation with deep learning libraries (e.g., PyTorch) and the ViewSparsifier codebase [55].
2. Experimental Workflow The following diagram illustrates the multi-view image processing pipeline for redundancy reduction and feature analysis.
3. Step-by-Step Procedure
- Step 1: Image Acquisition. Capture images of each plant sample from multiple predefined heights and rotational angles to create a comprehensive multi-view dataset [55].
- Step 2: View Selection. For each training instance, randomly select a subset of views (e.g., a "selection vector" of 24 views) to prevent the model from overfitting to a fixed set of viewpoints and to combat redundancy [55].
- Step 3: Feature Extraction. Process each selected view through a pre-trained Vision Transformer (ViT) to extract high-level feature representations. The ViT can be kept frozen or fine-tuned based on performance [55].
- Step 4: Feature Fusion. Combine the extracted features from all selected views. Incorporate positional encodings and fuse them using a Transformer Encoder, followed by mean pooling to create a unified, compact representation of the plant [55].
- Step 5: Model Training. Feed the fused representation into a regression head, typically a two-layer Multi-Layer Perceptron (MLP) with a PReLU activation function. Use dropout regularization tailored to the specific crop and task to mitigate overfitting [55].
- Step 6: Permutation-Based Inference. During inference, generate 24 rotational permutations of the selected views. Process each permutation through the trained model and compute the final prediction by averaging the outputs, enhancing robustness [55].
Protocol 2: 3D Point Cloud-Based Phenotyping for Complex Structures
This protocol details an automated method for extracting phenotypic parameters from plants with complex morphologies, such as Chinese Cymbidium seedlings, using 3D point clouds [108].
1. Research Reagent Solutions
- 3D Scanning Device: A Time-of-Flight (TOF) camera or laser scanner mounted on a rotational stage for multi-angle capture [108].
- Computing Setup: A computer with point cloud processing libraries (e.g., Point Cloud Library (PCL), Open3D) and custom algorithms for segmentation and skeletonization [108].
- Software: Environments like Python or C++ for implementing point cloud preprocessing, segmentation, and parameter calculation algorithms [108].
2. Experimental Workflow The workflow for 3D point cloud analysis involves data acquisition, preprocessing, and specialized segmentation to measure plant traits.
3. Step-by-Step Procedure
- Step 1: 3D Data Acquisition. Use a custom-built, non-destructive 3D scanning device equipped with a TOF camera. Capture RGB and depth images of the plant sample at least at 0° and 180° rotations [108].
- Step 2: Point Cloud Preprocessing.
- Convert depth images to a 3D point cloud.
- Remove noise, including "flying pixels" (FPN), using a Principal Component Analysis (PCA)-based algorithm and a radius-based outlier filter.
- Register point clouds from different angles using a combination of rotational registration and the Iterative Closest Point (ICP) algorithm to create a complete 3D model [108].
- Step 3: Tiller Branch Point Detection. Analyze the 3D point cloud morphology to identify the points where individual tillers branch out from the main plant structure [108].
- Step 4: Two-Round Tiller Segmentation.
- First Round: Separate the non-overlapping parts of each tiller and the overlapping parts of each ramet using an edge point cloud-based segmentation method.
- Second Round: Slice the overlapping part horizontally. Distribute the points in each slice to individual tillers based on the weight ratio of the tillers above, resulting in a complete point cloud for each tiller [108].
- Step 5: Phenotypic Parameter Calculation. For the segmented point cloud of each tiller, automatically compute key parameters:
- Plant Height: The maximum vertical extent.
- Leaf Number: The count of segmented leaves.
- Leaf Length & Area: Calculated from the extracted skeleton points and surface area of the leaf point cloud [108].
- Step 6: Validation. Compare the automatically extracted parameters with manual ground-truth measurements to validate accuracy (e.g., 98.6% for plant height, 100% for leaf count) [108].
The Scientist's Toolkit: Essential Research Reagents & Technologies
Successful implementation of automated phenotyping relies on a suite of integrated technologies. The following table catalogs key hardware, software, and data components.
Table 3: Key Research Reagent Solutions for Automated Plant Phenotyping
| Tool Category | Specific Technology/Item | Function in Automated Phenotyping |
|---|---|---|
| Sensing & Imaging | RGB Cameras [11] | Captures standard color images for basic morphological analysis and color-based health assessment. |
| Hyperspectral Sensors [11] | Captures data beyond the visible spectrum to infer chemical composition (e.g., chlorophyll, water content). | |
| Thermal Cameras [11] | Measures leaf surface temperature for early stress detection and water status monitoring. | |
| 3D Sensors (LiDAR, TOF cameras) [11] [108] | Generates 3D point clouds for structural analysis, volume estimation, and complex trait extraction. | |
| AI & Software | Pre-trained Models (YOLO11, ViT) [55] [11] | Provides foundational capability for object detection, classification, and feature extraction; can be fine-tuned. |
| Farm Management Software [111] | Integrates data from multiple sources for visualization, analysis, and actionable insight generation. | |
| Platforms & Robotics | Unmanned Aerial Vehicles (UAVs/Drones) [110] [11] | Enables high-throughput, aerial field scouting and imaging at scale. |
| Autonomous Ground Vehicles & Robots [110] [109] | Automates in-field data collection and tasks like harvesting, weeding, and precision spraying. | |
| Data & Computation | Public Datasets (e.g., GroMo) [55] [83] | Provides benchmark data for training and validating new models and algorithms. |
| Cloud/Edge Computing Platforms [110] | Facilitates storage and processing of large datasets, enabling real-time analytics in remote areas. |
The quantitative evidence and detailed protocols presented herein unequivocally demonstrate that automated phenotyping significantly outperforms manual methods in speed, accuracy, and consistency. The integration of deep learning, computer vision, and advanced sensor technologies enables the high-throughput, non-destructive, and precise measurement of complex plant traits, from individual leaf parameters to whole-plant architecture in 3D. These capabilities are pivotal for accelerating plant breeding, enhancing crop management in precision agriculture, and ultimately addressing global food security challenges. As the field evolves, the fusion of multimodal data and the development of more efficient, robust algorithms will further solidify automated phenotyping as an indispensable tool in plant science.
The adoption of deep learning and computer vision in plant phenotyping has created a pressing need for standardized evaluation frameworks to ensure model reliability and biological relevance. The "phenotyping bottleneck" is no longer just about data acquisition but has shifted toward the robust extraction of meaningful phenotypic information from complex image data [112] [104]. The transition of these technologies from controlled laboratory settings to diverse field conditions and from simple geometric measurements to complex, non-linear traits necessitates a rigorous, standardized approach to validation [7] [59]. This document provides application notes and experimental protocols for establishing comprehensive evaluation frameworks for image-based plant phenotyping models, encompassing metrics, standards, and validation workflows essential for research scientists and development professionals.
Core Performance Metrics for Phenotyping Models
The evaluation of phenotyping models requires a multi-faceted approach, assessing not only technical performance but also biological validity and operational efficiency. The metrics can be categorized based on the primary task of the model.
Table 1: Core Performance Metrics for Different Phenotyping Tasks
| Task Category | Key Metrics | Description & Biological Relevance |
|---|---|---|
| Classification (e.g., disease detection, mutant classification) | Accuracy, Precision, Recall, F1-Score, Area Under the Receiver Operating Characteristic Curve (AUC-ROC) [83] [112] | Assesses the model's ability to correctly identify and categorize discrete plant states. Essential for diagnosing stress responses or genetic traits. |
| Regression (e.g., leaf counting, age estimation, biomass prediction) | Mean Absolute Error (MAE), Mean Squared Error (MSE), Root Mean Squared Error (RMSE), Pearson Correlation Coefficient (r) [112] [113] | Quantifies the deviation of predicted continuous values from ground truth measurements. Critical for growth modeling and yield prediction. |
| Segmentation (e.g., leaf, root, or colony delineation) | Intersection over Union (IoU), Dice Coefficient, Pixel Accuracy [32] [98] | Evaluates the precision of object boundary identification. Fundamental for analyzing plant architecture and pathogen colonization. |
Beyond these task-specific metrics, generalizability is paramount. This is typically evaluated by testing a model trained on one dataset (e.g., a specific growth environment or cultivar) on a separate, independent test set or, more stringently, on data from a different environment, camera sensor, or plant species [112] [59]. Furthermore, for breeding and genetic applications, the ultimate validation lies in demonstrating that computationally derived phenotypes can detect meaningful genotype-phenotype associations, such as identifying known or novel quantitative trait loci (QTLs) with higher resolution than manual phenotyping [98] [113].
Standards for Data Acquisition and Annotation
The foundation of any valid phenotyping model is high-quality, consistently acquired and annotated data. Standardizing this process is critical for model reproducibility and performance.
Imaging Protocols and Modalities
The choice of imaging technique dictates the phenotypic traits that can be extracted. Standard protocols should specify the sensor type, resolution, and environmental conditions.
Table 2: Overview of Key Imaging Modalities for Plant Phenotyping
| Imaging Technique | Primary Applications | Example Phenotype Parameters | Considerations for Standardization |
|---|---|---|---|
| Visible Light (RGB) Imaging [7] | Plant architecture, growth dynamics, color analysis, yield traits. | Projected shoot area, leaf area, compactness, fruit count, root architecture. | Consistent lighting, background, and camera calibration to minimize variance. |
| Fluorescence Imaging [7] [59] | Photosynthetic efficiency, plant health status, abiotic stress response. | Quantum yield of photosystem II, non-photochemical quenching. | Requires dark adaptation of plants; sensor calibration is critical. |
| Thermal Infrared Imaging [7] [59] | Stomatal conductance, water stress response, transpiration rate. | Canopy or leaf surface temperature. | Highly sensitive to ambient temperature, humidity, and wind speed. |
| Hyperspectral Imaging [7] [59] | Leaf and canopy chemical composition, water status, pigment content. | Vegetation indices (e.g., NDVI), water content, nutrient deficiency. | Data complexity is high; requires specialized processing and dimension reduction. |
| Microscopy [98] | Plant-pathogen interactions at a cellular level, subcellular phenotyping. | Fungal colony area, haustoria count, cellular structures. | Standardized sample preparation (e.g., staining, clearing) and magnification. |
Annotation and Ground Truthing Protocols
Accurate ground truth data is the benchmark for model training and validation. Protocols must be established for:
- Annotation Guidelines: Detailed, written protocols for human annotators to ensure consistency, especially for complex traits like disease severity or root architecture [104].
- Data Curation: The use of publicly available, benchmarked datasets where possible (e.g., those cited in reviews like [83]) allows for direct model comparison.
- Multi-Rater Validation: For subjective traits, calculating inter-annotator agreement scores (e.g., Cohen's Kappa) ensures the reliability of the ground truth [59].
Experimental Protocols for Model Validation
This section outlines a standardized workflow for a comprehensive validation experiment, from data splitting to performance reporting.
Workflow for a Comprehensive Validation Experiment
The following diagram illustrates the key stages in a robust model validation pipeline.
Protocol Details
Protocol Title: Multi-Dimensional Validation of a Deep Learning Phenotyping Model
1. Data Preprocessing and Splitting
- Purpose: To prepare image data and create unbiased splits for training and evaluation.
- Steps:
- Preprocessing: Resize all images to a uniform resolution (e.g., 224x224 pixels). Apply per-channel normalization using mean and standard deviation of the training set. For robust models, define a standard data augmentation pipeline (e.g., random rotation, flipping, brightness/contrast adjustment) but apply augmentation only to the training set [32].
- Data Splitting: Partition the data into three sets: Training (70%), Validation (15%), and Test (15%). The splitting strategy must account for population structure. For genomic studies, ensure all replicates of the same genotype are contained within a single split to prevent data leakage and overoptimistic performance [113]. For temporal data, ensure chronological splitting.
2. Model Training and Hyperparameter Tuning
- Purpose: To train the model and optimize its parameters without overfitting to the test data.
- Steps:
- Training: Train the model on the Training set using a standard loss function (e.g., Cross-Entropy for classification, MSE for regression). Use the Validation set to monitor for overfitting after each epoch.
- Hyperparameter Tuning: Systematically vary key hyperparameters (e.g., learning rate, batch size, network depth) and select the combination that yields the best performance on the Validation set. The Test set must remain completely untouched during this phase [59].
3. Core Performance and Generalizability Assessment
- Purpose: To obtain an unbiased estimate of model performance and its robustness to new conditions.
- Steps:
- Core Evaluation: Run the final model (tuned in the previous step) on the held-out Test Set. Report all relevant metrics from Table 1. Include confidence intervals where possible (e.g., via bootstrapping).
- External Validation: To test generalizability, acquire a second, independent dataset, ideally from a different environment, growth season, or imaging platform. Evaluate the model trained on the original full dataset on this new external set and report the performance drop. This is a critical test of real-world utility [112].
4. Biological and Operational Validation
- Purpose: To ensure the model's predictions are biologically meaningful and practically useful.
- Steps:
- Biological Validation: For genetic studies, use the model-predicted phenotypes to conduct a Genome-Wide Association Study (GWAS). Compare the results—such as the number and location of identified QTLs—to those from manual phenotyping. A valid model should recapitulate known associations and potentially discover new ones with high sensitivity, as demonstrated in barley-powdery mildew interactions [98].
- Operational Assessment: In a real-field simulation, report the model's inference speed (frames per second) and computational resource requirements (CPU/GPU memory), as these factors determine scalability for high-throughput breeding programs [114].
The Scientist's Toolkit: Essential Research Reagents and Materials
Table 3: Key Research Reagent Solutions for Plant Phenotyping Validation
| Item / Resource | Function in Validation Framework | Examples / Notes |
|---|---|---|
| Public Benchmark Datasets [83] | Provides standardized data for fair model comparison and initial benchmarking. | Datasets for disease detection, weed control, and fruit detection. Essential for establishing baselines. |
| Open-Source Software Platforms [112] [104] | Offers pre-trained models and flexible frameworks for training custom models, accelerating development. | "Deep Plant Phenomics" platform for tasks like leaf counting and mutant classification. |
| High-Throughput Phenotyping Platforms [114] [59] | Provides the hardware infrastructure for controlled, automated, and reproducible image acquisition. | LemnaTec Scanalyzer, PHENOVISION. Systems integrate robotics, environmental control, and multiple sensors. |
| Standardized Genotype-Phenotype Datasets [113] | Enables the validation of phenotyping models through genetic analysis. | Datasets like Maize8652 or Wheat2000, which include genomic markers and multiple trait measurements. |
| Image Analysis and ML Libraries (e.g., TensorFlow, PyTorch, OpenCV) | The computational backbone for building, training, and evaluating deep learning models. | Include libraries for specific tasks like segmentation (U-Net) or object detection (Faster R-CNN) [32]. |
The establishment of rigorous, standardized evaluation frameworks is not an ancillary activity but a core component of modern plant phenotyping research. By adopting the metrics, standards, and detailed protocols outlined in this document—spanning technical performance, biological relevance, and operational scalability—researchers can ensure their deep learning models are robust, reproducible, and capable of delivering meaningful insights for crop improvement and basic plant science. This structured approach is fundamental to bridging the genotype-to-phenotype gap and unlocking the full potential of computer vision in agriculture.
Conclusion
The integration of deep learning and computer vision has fundamentally transformed plant phenotyping, enabling unprecedented scale, accuracy, and automation in measuring complex traits. This synthesis of key intents demonstrates that while foundational architectures like CNNs and emerging Transformers provide powerful tools, their success hinges on effectively addressing challenges of data quality, model interpretability, and real-world generalization. The comparative analysis reveals a persistent performance gap between controlled laboratory settings and variable field conditions, underscoring the need for robust, explainable, and adaptable models. Future directions point toward greater integration of multimodal data, the development of lightweight models for edge computing, and a stronger emphasis on Explainable AI (XAI) to build trust and provide actionable biological insights. These advancements will not only accelerate crop breeding and sustainable agriculture but also offer a methodological framework that could inspire new approaches in biomedical image analysis and clinical research, bridging the gap between plant science and human health.
References
- 1. What Is Plant ? EMPHASIS Phenotyping [https://emphasis.plant-phenotyping.eu/about/plant-phenotyping/]
- 2. : from bean weighing to image analysis Plant phenotyping [https://plantmethods.biomedcentral.com/articles/10.1186/s13007-015-0056-8]
- 3. What is Plant ? - Blog Hiphen Phenotyping [https://www.hiphen-plant.com/what-is-plant-phenotyping-2/]
- 4. Market: Accelerating the Future of Plant ... Phenotyping Food Security [https://www.linkedin.com/pulse/plant-phenotyping-market-accelerating-future-food-security-singh-hh0je]
- 5. Embracing plant plasticity or robustness as a means of ensuring food ... [https://pmc.ncbi.nlm.nih.gov/articles/PMC11706996/]
- 6. High-Throughput Phenotyping: A Platform to Accelerate Crop Improvement - PMC [https://pmc.ncbi.nlm.nih.gov/articles/PMC9590473/]
- 7. A Review of Imaging Techniques for Plant Phenotyping - PMC [https://pmc.ncbi.nlm.nih.gov/articles/PMC4279472/]
- 8. [2006.11391] Computer Vision with Deep Learning for Plant Phenotyping in Agriculture: A Survey [https://arxiv.org/abs/2006.11391]
- 9. Deep Learning in Image-Based Plant Phenotyping - PubMed [https://pubmed.ncbi.nlm.nih.gov/38382904/]
- 10. High-Throughput Plant Phenotyping: Methods and Protocols | SpringerLink [https://link.springer.com/book/10.1007/978-1-0716-2537-8]
- 11. Plant Phenotyping : YOLO11 Computer Vision | Ultralytics [https://www.ultralytics.com/blog/ultralytics-yolo11-and-computer-vision-in-plant-phenotyping]
- 12. Advanced high-throughput plant phenotyping techniques for... [https://pmc.ncbi.nlm.nih.gov/articles/PMC8721248/]
- 13. Non- destructive for early seedling vigor in direct-seeded... phenotyping [https://plantmethods.biomedcentral.com/articles/10.1186/s13007-020-00666-6]
- 14. New Insights in Maize Phenotyping via Image Analysis [https://bioengineer.org/new-insights-in-maize-phenotyping-via-image-analysis/]
- 15. Uncrewed Aerial Vehicle (UAV)-Based High-Throughput Phenotyping of Maize Silage Yield and Nutritive Values Using Multi-Sensory Feature Fusion and Multi-Task Learning with Attention Mechanism [https://www.mdpi.com/2072-4292/17/21/3654]
- 16. Computer vision-based plants phenotyping: A comprehensive survey - PMC [https://pmc.ncbi.nlm.nih.gov/articles/PMC10805646/]
- 17. Deep learning and computer vision in plant disease detection: a comprehensive review of techniques, models, and trends in precision agriculture | Artificial Intelligence Review [https://link.springer.com/article/10.1007/s10462-024-11100-x]
- 18. Frontiers | Explainable deep learning in plant phenotyping [https://www.frontiersin.org/journals/artificial-intelligence/articles/10.3389/frai.2023.1203546/full]
- 19. of plant shoots using imaging methods for... Automated phenotyping [https://plantmethods.biomedcentral.com/articles/10.1186/s13007-015-0072-8]
- 20. of microalgae: Automated solution for... phenotyping scalable [https://pubmed.ncbi.nlm.nih.gov/40473142/]
- 21. - High in grapevine breeding... | OENO One throughput phenotyping [https://oeno-one.eu/article/view/8458]
- 22. Frontiers | Deep -Based Text Generation for Learning ... Plant [https://www.frontiersin.org/journals/plant-science/articles/10.3389/fpls.2025.1564394/abstract]
- 23. Convolutional Neural Networks for Image-Based High-Throughput Plant Phenotyping: A Review - ScienceDirect [https://www.sciencedirect.com/science/article/pii/S2643651524000475]
- 24. Explainable deep learning in plant phenotyping - PMC [https://pmc.ncbi.nlm.nih.gov/articles/PMC10546035/]
- 25. PhenoGPT: Towards Language Interaction with Vision Models for... [https://www.research.ed.ac.uk/en/publications/phenogpt-towards-language-interaction-with-vision-models-for-plan]
- 26. Image-Based High-Throughput Phenotyping in Horticultural Crops - PMC [https://pmc.ncbi.nlm.nih.gov/articles/PMC10222289/]
- 27. Automated image registration of RGB , hyperspectral and chlorophyll... [https://plantmethods.biomedcentral.com/articles/10.1186/s13007-024-01296-y]
- 28. Applications of hyperspectral imaging in plant phenotyping - ScienceDirect [https://www.sciencedirect.com/science/article/abs/pii/S1360138521003460]
- 29. Photogrammetry-based 3D plant root imaging and phenotyping: Platforms, technologies, algorithms, and future directions - ScienceDirect [https://www.sciencedirect.com/science/article/pii/S2772375525007488]
- 30. Plant high-throughput phenotyping using photogrammetry and imaging techniques to measure leaf length and rosette area - ScienceDirect [https://www.sciencedirect.com/science/article/abs/pii/S0168169916301168]
- 31. and Spectral Root RGB for Imaging and... Plant Phenotyping [https://www.jove.com/t/56251/rgb-spectral-root-imaging-for-plant-phenotyping-physiological]
- 32. Frontiers | Deep -based text generation for learning ... plant phenotyping [https://www.frontiersin.org/journals/plant-science/articles/10.3389/fpls.2025.1564394/full]
- 33. GitHub - SmartFarmingLab/field_dataset_ survey : A curated collection... [https://github.com/SmartFarmingLab/field_dataset_survey]
- 34. Convolutional Neural Networks for Image-Based High-Throughput... [https://pmc.ncbi.nlm.nih.gov/articles/PMC7706326/]
- 35. Computer vision-based phenotyping for improvement of plant productivity: a machine learning perspective - PubMed [https://pubmed.ncbi.nlm.nih.gov/30520975/]
- 36. LC-Net: Revolutionizing Plant with Phenotyping for CNNs ... Accurate [https://www.azoai.com/news/20240124/LC-Net-Revolutionizing-Plant-Phenotyping-with-CNNs-for-Accurate-Leaf-Counting.aspx]
- 37. Driving a New Era in Breeding: AI-Powered Phenotyping at CIMMYT – CIMMYT [https://www.cimmyt.org/blogs/driving-a-new-era-in-breeding-ai-powered-phenotyping-at-cimmyt/]
- 38. Plant Phenotyping Datasets [https://www.plant-phenotyping.org/datasets-home]
- 39. Few Shot Learning for Phenotype -Driven Diagnosis of... - Zitnik Lab [https://zitniklab.hms.harvard.edu/projects/SHEPHERD/]
- 40. Deep learning in plant phenotyping: the first ten years - ScienceDirect [https://www.sciencedirect.com/science/article/pii/S2643651525000688]
- 41. Frontiers | An advanced deep learning models-based plant disease detection: A review of recent research [https://www.frontiersin.org/journals/plant-science/articles/10.3389/fpls.2023.1158933/full]
- 42. An Analysis of Plant Diseases Identification Based on Deep Learning Methods - PMC [https://pmc.ncbi.nlm.nih.gov/articles/PMC10412967/]
- 43. A CNN -based model to count the leaves of rosette plants (LC-Net) [https://www.nature.com/articles/s41598-024-51983-y?error=cookies_not_supported&code=9ae43566-aae2-4871-aabf-bc5b18dd5997]
- 44. GitHub - danakembara/ leaf - count -detect: This project is offered by... [https://github.com/danakembara/leaf-count-detect]
- 45. Construction of deep learning-based disease detection model in plants | Scientific Reports [https://www.nature.com/articles/s41598-023-34549-2]
- 46. Deep learning models for plant disease detection and diagnosis - ScienceDirect [https://www.sciencedirect.com/science/article/abs/pii/S0168169917311742]
- 47. PiTLiD: Identification of Plant From Disease Images Based on... Leaf [https://pubmed.ncbi.nlm.nih.gov/35914052/]
- 48. Deep phenotyping : deep learning for temporal phenotype /genotype... [https://plantmethods.biomedcentral.com/articles/10.1186/s13007-018-0333-4]
- 49. Frontiers | A novel transfer learning framework for sorghum biomass... [https://www.frontiersin.org/journals/plant-science/articles/10.3389/fpls.2023.1138479/full]
- 50. What are the phenological stages or phases of development in plants? - AgronoBlog - Agriculture Blog [https://agronoblog.com/phenological-stages/what-are-the-phenological-stages-or-phases-of-development-in-plants-2/]
- 51. Modelling and mapping of plant phenological stages as bio-meteorological indicators for climate change | Environmental Sciences Europe | Full Text [https://enveurope.springeropen.com/articles/10.1186/2190-4715-26-5]
- 52. Application of Deep Learning Technology in Monitoring Plant Attribute Changes | MDPI [https://www.mdpi.com/2071-1050/17/17/7602]
- 53. A cotton organ segmentation method with phenotypic measurements... [https://pmc.ncbi.nlm.nih.gov/articles/PMC11912792/]
- 54. Tutorial 5: Transformers and Multi-Head Attention — PyTorch... [https://pytorch-lighting.readthedocs.io/en/latest/notebooks/course_UvA-DL/05-transformers-and-MH-attention.html]
- 55. ViewSparsifier: Killing Redundancy in Multi-View Plant Phenotyping [https://arxiv.org/html/2509.08550v1]
- 56. Drop-in efficient self-attention approximation method | Machine Learning [https://link.springer.com/article/10.1007/s10994-025-06768-3]
- 57. An automated in-field transport and imaging chamber system for high-throughput phenotyping of potted soybean | Plant Methods | Full Text [https://plantmethods.biomedcentral.com/articles/10.1186/s13007-025-01424-2]
- 58. https://www.frontiersin.org/journals/plant-science/articles/ ... [https://www.frontiersin.org/journals/plant-science/articles/10.3389/fpls.2025.1626622/xml]
- 59. A Comprehensive Review of High Throughput Phenotyping and Machine Learning for Plant Stress Phenotyping - PMC [https://pmc.ncbi.nlm.nih.gov/articles/PMC9590503/]
- 60. Automated generation of ground truth images of greenhouse-grown... [https://plantmethods.biomedcentral.com/articles/10.1186/s13007-025-01441-1]
- 61. Quantitative Plant | Leaf Phenotyping dataset [https://www.quantitative-plant.org/dataset/leaf-phenotyping-dataset]
- 62. How to make sense of 3D representations for plant phenotyping: a compendium of processing and analysis techniques | Plant Methods | Full Text [https://plantmethods.biomedcentral.com/articles/10.1186/s13007-023-01031-z]
- 63. Frontiers | YOLO -PLNet: a lightweight real - time model for... detection [https://www.frontiersin.org/journals/plant-science/articles/10.3389/fpls.2025.1707501/full]
- 64. Frontiers | A 3D reconstruction platform for complex plants using OB-NeRF [https://www.frontiersin.org/journals/plant-science/articles/10.3389/fpls.2025.1449626/full]
- 65. Edge_MVSFormer: Edge-Aware Multi-View Stereo Plant Reconstruction Based on Transformer Networks [https://www.mdpi.com/1424-8220/25/7/2177]
- 66. Frontiers | Accurate plant 3D reconstruction and phenotypic trait extraction via stereo imaging and multi-view point cloud alignment [https://www.frontiersin.org/journals/plant-science/articles/10.3389/fpls.2025.1642388/abstract]
- 67. 3D plant phenotyping from a single image: learning fine-scale organ morphology with monocular depth estimation - ScienceDirect [https://www.sciencedirect.com/science/article/abs/pii/S0168169925010312]
- 68. Root Plant Using Phenotyping Conditional GANs and Binary... Deep [https://pmc.ncbi.nlm.nih.gov/articles/PMC9823511/]
- 69. Five Popular Data In Augmentation Techniques Deep Learning [https://dataaspirant.com/data-augmentation-techniques-deep-learning/]
- 70. Recent Data Strategies for Augmentation in Deep ... Learning Plant [https://engrxiv.org/preprint/view/1148]
- 71. Frontiers | Style-Consistent Image Translation: A Novel Data ... [https://www.frontiersin.org/articles/10.3389/fpls.2021.773142/full?field=&journalName=Frontiers_in_Plant_Science&id=773142]
- 72. in Transfer learning Plant Phenotyping [https://blog.wps.eu/en/news/transfer-learning-in-plant-phenotyping]
- 73. Combining computer vision and deep learning to enable ultra-scale aerial phenotyping and precision agriculture: A case study of lettuce production | Horticulture Research [https://www.nature.com/articles/s41438-019-0151-5]
- 74. Deep Learning Applications in Plant Biology: Bridging Genotype and Phenotype - Premier Science [https://premierscience.com/pjpb-24-430/]
- 75. Scalable learning for bridging the species gap in image-based plant phenotyping - ScienceDirect [https://www.sciencedirect.com/science/article/abs/pii/S1077314220300746]
- 76. Two-Stage Deep Boosts Crop Learning Across Phenotyping Species [https://www.newswise.com/articles/two-stage-deep-learning-boosts-crop-phenotyping-across-species]
- 77. Computer-Aided Drug Discovery in Plant Pathology - PMC [https://www.ncbi.nlm.nih.gov/pmc/articles/PMC5720600/]
- 78. Understanding plant in crop breeding through... phenotypes [https://pubmed.ncbi.nlm.nih.gov/40574309/]
- 79. ( Explainable ) in AI : Balancing Performance and... XAI 2025 [https://www.suryasys.com/post/explainable-ai-xai-in-2025-balancing-performance-and-interpretability]
- 80. A systematic survey on explainable artificial intelligence ( XAI ) for plant ... [https://link.springer.com/article/10.1007/s10489-025-06790-x]
- 81. Explainable Artificial Intelligence in the Field of Drug Research - PMC [https://pmc.ncbi.nlm.nih.gov/articles/PMC12129466/]
- 82. - plant · GitHub Topics · GitHub phenotyping [https://github.com/topics/plant-phenotyping?o=desc&s=updated]
- 83. Cutting-edge computational approaches to plant phenotyping [https://pubmed.ncbi.nlm.nih.gov/40192856/]
- 84. Navigating the AI revolution: a roadmap for pharma's future [https://www.drugtargetreview.com/article/157270/navigating-the-ai-revolution-a-roadmap-for-pharmas-future/]
- 85. The Hidden Challenge of Occlusion in Computer Vision [https://objectways.com/blog/the-hidden-challenge-of-occlusion-in-computer-vision/]
- 86. Query-Based Multiview Detection for Multiple Visual Sensor Networks - PMC [https://pmc.ncbi.nlm.nih.gov/articles/PMC11314974/]
- 87. Interpretable deep learning methods for multiview learning | BMC Bioinformatics | Full Text [https://bmcbioinformatics.biomedcentral.com/articles/10.1186/s12859-024-05679-9]
- 88. Measuring crops in 3D: using geometry for plant phenotyping [https://plantmethods.biomedcentral.com/articles/10.1186/s13007-019-0490-0]
- 89. A Review of Optical-Based Three-Dimensional Reconstruction and... [https://pmc.ncbi.nlm.nih.gov/articles/PMC12158188/]
- 90. Frontiers | Automatic Fused Multimodal Deep for Learning ... Plant [https://www.frontiersin.org/journals/plant-science/articles/10.3389/fpls.2025.1616020/abstract]
- 91. Multi-view data visualisation via manifold learning - PMC [https://pmc.ncbi.nlm.nih.gov/articles/PMC11157621/]
- 92. Top 4 Computer Problems & Solutions in Agriculture Data... Vision [https://www.tenyks.ai/blog/top-4-computer-vision-problems-solutions-in-agriculture-data-part-2]
- 93. A lightweight for multi- deep biotic stress... learning model plant [https://pmc.ncbi.nlm.nih.gov/articles/PMC11982187/]
- 94. Development of a low-cost plant phenotyping facility | Plantae [https://plantae.org/development-of-a-low-cost-plant-phenotyping-facility/]
- 95. How to make sense of 3D representations for plant ... phenotyping [https://link.springer.com/article/10.1186/s13007-023-01031-z]
- 96. Frontiers | Optimizing experimental procedures for quantitative ... [https://www.frontiersin.org/articles/10.3389/fpls.2014.00770/full]
- 97. Recent advances in plant disease detection: challenges and... [https://plantmethods.biomedcentral.com/articles/10.1186/s13007-025-01450-0]
- 98. Frontiers | Deep phenotyping platform for microscopic plant-pathogen interactions [https://www.frontiersin.org/journals/plant-science/articles/10.3389/fpls.2025.1462694/full]
- 99. A Survey of the Self Supervised Learning Mechanisms for Vision... [https://arxiv.org/html/2408.17059v6]
- 100. Benchmarking deep-learning methods for more accurate plant-phenotyping [https://www.eurekalert.org/news-releases/987061]
- 101. Vision Transformers vs. Convolutional Neural Networks ( CNNs ) [https://www.geeksforgeeks.org/deep-learning/vision-transformers-vs-convolutional-neural-networks-cnns/]
- 102. The pipelines of deep learning-based plant image processing | Quantitative Plant Biology | Cambridge Core [https://www.cambridge.org/core/journals/quantitative-plant-biology/article/pipelines-of-deep-learningbased-plant-image-processing/C160F4CD43B4F0053E34B6EA97252953]
- 103. AI-Driven Plant-MAE Boosts 3D Plant Phenotyping with Self-Supervised Learning | Newswise [https://www.newswise.com/articles/ai-driven-plant-mae-boosts-3d-plant-phenotyping-with-self-supervised-learning]
- 104. Frontiers | Deep Plant Phenomics: A Deep Learning Platform for Complex Plant Phenotyping Tasks [https://www.frontiersin.org/journals/plant-science/articles/10.3389/fpls.2017.01190/full]
- 105. Self-Supervised Backbone Framework for Diverse Agricultural Vision ... [https://arxiv.org/html/2403.15248v1]
- 106. The use of plant models in deep : an application to leaf... learning [https://plantmethods.biomedcentral.com/articles/10.1186/s13007-018-0273-z]
- 107. Benchmarking Self-Supervised Contrastive Learning Methods for... [https://pmc.ncbi.nlm.nih.gov/articles/PMC10079263/]
- 108. An automated for Chinese Cymbidium... phenotyping method [https://plantmethods.biomedcentral.com/articles/10.1186/s13007-024-01277-1]
- 109. Editorial: AI, sensors and robotics in plant phenotyping and precision agriculture - PMC [https://pmc.ncbi.nlm.nih.gov/articles/PMC9727372/]
- 110. Precision Agriculture Technologies 2025: Used & Innovated [https://farmonaut.com/precision-farming/precision-agriculture-technologies-2025-used-innovated]
- 111. Precision Agriculture 2025: Key Strategies & Trends [https://www.omdena.com/blog/precision-agriculture-2025-key-strategies-trends]
- 112. Deep Plant Phenomics: A Deep Learning Platform for Complex Plant Phenotyping Tasks - PMC [https://pmc.ncbi.nlm.nih.gov/articles/PMC5500639/]
- 113. MtCro: multi-task deep improves multi-trait... learning framework [https://plantmethods.biomedcentral.com/articles/10.1186/s13007-024-01321-0]
- 114. How Plant Systems Works — In One Simple Flow ( Phenotyping ) 2025 [https://www.linkedin.com/pulse/how-plant-phenotyping-systems-works-one-simple-flow-2025-cp8ge]