Beyond Visible Signs: How Color-Changing Sensors Detect and Decode Early Plant Stress
This article provides a comprehensive analysis of the scientific principles, technological implementations, and practical applications of color-changing sensors for plant stress detection.
Beyond Visible Signs: How Color-Changing Sensors Detect and Decode Early Plant Stress
Abstract
This article provides a comprehensive analysis of the scientific principles, technological implementations, and practical applications of color-changing sensors for plant stress detection. Tailored for researchers and scientists, it explores the biochemical foundations of stress biomarkers like proline and hydrogen peroxide, which these sensors target. The content details various sensor formats—from paper-based assays and advanced nanosensors to wearable microneedle patches—and evaluates their operational mechanisms, including fluorescence activation and electrochemical signaling. It further addresses critical challenges in sensor sensitivity, specificity, and real-world deployment, while offering a comparative validation against established methods such as RGB/hyperspectral imaging and molecular assays. The review concludes by synthesizing the transformative potential of this technology for enabling precision agriculture and proactive crop health management.
The Biochemical Language of Plant Stress: Universal Biomarkers and Sensing Principles
In the face of escalating environmental challenges, the detection of plant stress before the appearance of physical damage is crucial for sustainable agriculture. Plant biomarkers, which are measurable indicators of a plant's cellular state in response to external stimuli, serve as early warning signals for stress conditions [1]. Among these, proline and hydrogen peroxide (H₂O₂) have emerged as two critically important molecular biomarkers with distinct yet interconnected roles in plant stress physiology. Recent advancements in detection technologies, particularly the development of color-changing sensors, leverage these biomarkers to provide real-time, visible assessments of plant health [2]. This technical guide provides an in-depth examination of proline and hydrogen peroxide as stress biomarkers, detailing their biochemical pathways, quantitative relationships with stress conditions, experimental methodologies for analysis, and their application in novel sensor technologies that are transforming plant stress monitoring.
Proline as a Universal Stress Biomarker
Biochemical Functions and Significance
Proline, an imino acid with a unique five-membered ring structure, functions as a multifunctional compatible solute in plant stress response systems. Its accumulation represents a common metabolic adaptation observed across diverse organisms including bacteria, algae, plants, and marine invertebrates when challenged by environmental stressors [3]. Under stress conditions, intracellular proline levels in plants can increase by more than 100-fold, serving multiple protective functions including osmotic adjustment, protein and membrane stabilization, redox balancing, and reactive oxygen species (ROS) scavenging [3] [4]. Proline also acts as a metal chelator under heavy metal stress and functions as a signaling molecule to modulate various defense responses [4].
Metabolic Pathways
Proline biosynthesis and catabolism in plants occur through carefully regulated pathways distributed across different cellular compartments:
- Glutamate Pathway: The primary route for stress-induced proline accumulation occurs via glutamate reduction in the cytosol and chloroplasts. This pathway involves two key enzymes: Δ1-pyrroline-5-carboxylate synthetase (P5CS), which catalyzes the rate-limiting step of glutamate reduction to glutamate semialdehyde (GSA), and P5C reductase (P5CR), which subsequently reduces P5C to proline [3] [4].
- Ornithine Pathway: This alternative pathway becomes significant under specific stress conditions, particularly when nitrogen recycling is prioritized. Ornithine-δ-aminotransferase (OAT) transaminates ornithine to produce GSA/P5C, which is then converted to proline [4].
- Catabolic Pathway: Proline degradation occurs primarily in mitochondria through the sequential actions of proline dehydrogenase (PDH) and P5C dehydrogenase (P5CDH), which convert proline back to glutamate [3] [4].
Table 1: Key Enzymes in Proline Metabolism
| Enzyme | Abbreviation | Pathway | Cellular Location | Function |
|---|---|---|---|---|
| Δ1-pyrroline-5-carboxylate synthetase | P5CS | Biosynthesis | Cytosol/Chloroplast | Rate-limiting enzyme converting glutamate to P5C |
| P5C reductase | P5CR | Biosynthesis | Cytosol/Chloroplast | Reduces P5C to proline using NADPH |
| Ornithine-δ-aminotransferase | OAT | Biosynthesis | Mitochondria | Converts ornithine to P5C as alternative pathway |
| Proline dehydrogenase | PDH | Catabolism | Mitochondria | Oxidizes proline to P5C |
| P5C dehydrogenase | P5CDH | Catabolism | Mitochondria | Oxidizes P5C to glutamate |
Research on tobacco plants under arsenic stress demonstrated that proline accumulation mechanisms vary with stress intensity. At low arsenic concentrations (10 mg/kg soil), proline accumulation resulted primarily from decreased catabolism (reduced PDH and P5CDH expression). At moderate concentrations (20 mg/kg soil), enhanced biosynthesis via the glutamate pathway (increased P5CS and P5CR expression) became significant. At high concentrations (40 mg/kg soil), both the glutamate and ornithine pathways (increased OAT expression) contributed to proline accumulation [4].
Quantitative Relationship with Stress Conditions
Proline accumulation exhibits dose-dependent responses to various abiotic stresses, as demonstrated across multiple plant species:
Table 2: Proline Accumulation Under Various Stress Conditions
| Plant Species | Stress Type | Stress Level | Proline Response | Reference |
|---|---|---|---|---|
| Tobacco | Arsenic toxicity | 10-40 mg As/kg soil | Dose-dependent increase up to 3.5-fold | [4] |
| Sweet corn | Copper stress | CuCl₂ treatment | Significant increase in shoots | [5] |
| Various species | Drought, salinity, heavy metals, pathogens | Stress conditions | Can increase >100-fold | [3] |
Figure 1: Proline Metabolic Pathway Regulation Under Stress Conditions
Hydrogen Peroxide as a Signaling Biomarker
Dual Role in Stress Response
Hydrogen peroxide (H₂O₂) exemplifies the dualistic nature of reactive oxygen species in plant systems, functioning as both a damaging toxic compound at high concentrations and a crucial signaling molecule at moderate levels. As a stable, diffusible ROS, H₂O₂ participates in numerous physiological processes including seed germination, root system development, stomatal aperture regulation, flowering, and programmed cell death [6]. Under stress conditions, H₂O₂ levels increase significantly and serve as a secondary messenger in stress signaling pathways, modulating gene expression and activating defense mechanisms [6].
Cellular Homeostasis: Generation and Scavenging
The cellular concentration of H₂O₂ represents a balance between production and scavenging systems:
Generation Pathways:
- Enzymatic production: Multiple enzyme systems contribute to H₂O₂ generation, including cell wall peroxidases, NADPH oxidases, amine oxidases, and various oxidases such as glycolate oxidase in peroxisomes [6].
- Non-enzymatic production: H₂O₂ is continually produced during metabolic processes, particularly through electron transport chains in chloroplasts and mitochondria, where superoxide produced by complexes I and III is converted to H₂O₂ by superoxide dismutase [6].
Scavenging Systems:
- Enzymatic scavengers: Plants employ multiple enzymes to maintain H₂O₂ homeostasis, including catalase (CAT), peroxidase (POX), ascorbate peroxidase (APX), and glutathione reductase (GR) located in various cellular compartments [6].
- Non-enzymatic antioxidants: Low molecular weight compounds such as ascorbate (AsA) and glutathione (GSH) directly react with H₂O₂ or participate in regeneration cycles to eliminate excess H₂O₂ [6].
Quantitative Dynamics in Stress Scenarios
Research has demonstrated that H₂O₂ levels increase under various stress conditions and that its controlled application can enhance stress tolerance:
Table 3: Hydrogen Peroxide Responses Under Stress Conditions
| Plant Species | Stress Type | H₂O₂ Role | Observed Effect | Reference |
|---|---|---|---|---|
| Tomato | Low-temperature | Signaling molecule | Combined with EBL enhanced antioxidant activity | [7] |
| Sweet corn | Copper stress | Pre-treatment agent | Ameliorated CuCl₂ stress effects | [5] |
| Arabidopsis | Salt/Osmotic stress | Signaling molecule | NADPH oxidase-derived H₂O₂ increased proline | [6] |
Interplay Between Proline and Hydrogen Peroxide
The relationship between proline and hydrogen peroxide represents a crucial metabolic intersection in plant stress response. Research indicates significant cross-regulation between these two biomarker systems:
H₂O₂ Modulates Proline Metabolism: In sweet corn seedlings under copper stress, H₂O₂ pre-treatment stimulated both the glutamate and ornithine pathways of proline biosynthesis while simultaneously suppressing proline catabolism by reducing proline dehydrogenase (ProDH) activity [5]. This coordinated regulation resulted in significantly enhanced proline accumulation compared to copper stress alone.
Proline Influences ROS Dynamics: Proline metabolism contributes to mitochondrial reactive oxygen species (ROS) production through the electron transport chain [3]. The redox changes induced by proline metabolism can influence H₂O₂ generation, creating a feedback loop that fine-tunes cellular signaling under stress conditions.
Coordinated Stress Adaptation: Studies suggest that H₂O₂ generated by NADPH oxidases promotes proline accumulation during abiotic stresses like salinity and osmotic stress, indicating that H₂O₂ functions upstream of proline accumulation in certain stress signaling pathways [6].
This interplay creates a sophisticated regulatory network that allows plants to fine-tune their stress responses according to stress type, intensity, and duration.
Experimental Assessment Methodologies
Proline Quantification Protocols
Standard Biochemical Assay for Proline Content:
- Tissue Extraction: Homogenize 0.5 g of fresh leaf tissue in 10 ml of 3% aqueous sulfosalicylic acid. Centrifuge at 12,000 × g for 15 minutes at 4°C.
- Reaction Preparation: Mix 2 ml of supernatant with 2 ml of acid-ninhydrin (1.25 g ninhydrin in 30 ml glacial acetic acid and 20 ml 6M phosphoric acid) and 2 ml of glacial acetic acid.
- Incubation: Heat at 100°C for 60 minutes in a water bath, then terminate reaction in ice bath.
- Extraction: Add 4 ml toluene to each tube, vortex vigorously for 20 seconds.
- Spectrophotometry: Measure absorbance of the toluene phase at 520 nm using toluene as blank.
- Calculation: Determine proline concentration from standard curve (0-100 μg/ml proline) and express as μmol proline/g fresh weight.
Molecular Analysis of Proline Metabolism:
- Gene Expression Profiling: Utilize quantitative RT-PCR to analyze expression of key genes (P5CS, P5CR, OAT, PDH, P5CDH) in proline metabolic pathways [4].
- Enzyme Activity Assays: Measure activities of proline metabolic enzymes via spectrophotometric methods monitoring NAD(P)H oxidation/reduction at 340 nm [5].
Hydrogen Peroxide Detection Methods
Spectrophotometric Quantification:
- Tissue Extraction: Homogenize plant tissue in 0.1% (w/v) trichloroacetic acid (TCA) at 4°C.
- Reaction Mixture: Combine tissue extract with 10 mM potassium phosphate buffer (pH 7.0) and 1 M potassium iodide (KI).
- Incubation: Keep in darkness for 1 hour to develop color.
- Measurement: Read absorbance at 390 nm against appropriate blank.
- Calculation: Determine H₂O₂ concentration using extinction coefficient 0.28 μM⁻¹cm⁻¹.
Histochemical Localization:
- DAB (3,3'-Diaminobenzidine) Staining: Infiltrate leaves with 1 mg/ml DAB solution (pH 3.8) for 8 hours under light. Transfer to 96% ethanol to remove chlorophyll and visualize brown deposition indicating H₂O₂ localization.
Integrated Experimental Workflow
Figure 2: Experimental Workflow for Biomarker Analysis
Color-Changing Sensor Technology
Fundamental Principles
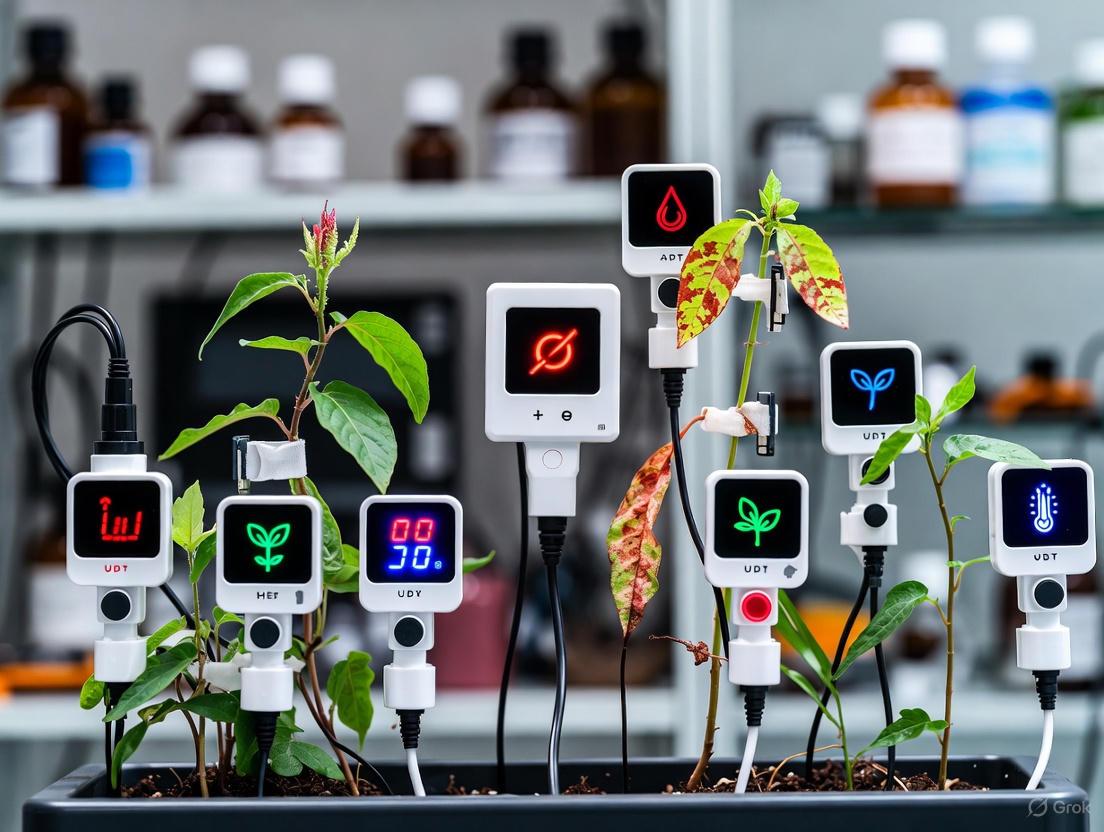
Recent advancements in plant stress monitoring have led to the development of innovative color-changing sensors that leverage proline as a universal biomarker. These sensors utilize the natural reaction mechanism inspired by the Nesocodon flower, whose nectar changes color in response to proline concentration through interaction with sinapaldehyde [2]. This natural color-changing phenomenon has been engineered into paper-based sensors embedded with sinapaldehyde that undergo visible color transitions from pale yellow to bright red as proline concentrations increase, providing a visual indication of plant stress levels [2].
Sensor Implementation Protocol
Proline Detection Workflow Using Color-Changing Sensors:
- Sample Collection: Clip a small piece (approximately 1 cm²) of the plant leaf tissue to be tested.
- Extract Preparation: Grind the leaf tissue in 1 ml of 70% ethanol to extract proline and other soluble compounds.
- Sensor Exposure: Dip the sinapaldehyde-embedded paper sensor into the extract for 5-10 seconds.
- Color Development: Allow the sensor to air dry for 5-15 minutes while observing color development.
- Result Interpretation: Compare developed color to reference chart:
- Pale yellow: Healthy plant (low proline, minimal stress)
- Orange: Moderate stress
- Bright red: High stress (elevated proline)
Quantitative Options: For precise measurements, scan the sensor and use image analysis software to obtain quantitative RGB values correlated with proline concentration [2].
Advantages and Applications
This sensor technology addresses significant limitations of conventional laboratory-based methods by providing:
- Rapid assessment (results within 15 minutes versus days for laboratory methods)
- Cost effectiveness (minimal equipment requirements)
- Field deployability (no specialized training needed)
- Accessibility for small-scale farmers and developing regions [2]
The technology has been successfully tested on various crops including cabbage, kale, brussel sprouts, and broccoli, demonstrating its broad applicability across plant species [2].
The Scientist's Toolkit: Essential Research Reagents
Table 4: Key Research Reagents for Proline and H₂O₂ Studies
| Reagent/Chemical | Function/Application | Experimental Context |
|---|---|---|
| Sulfosalicylic Acid (3%) | Protein precipitation and proline extraction | Proline quantification assay |
| Acid-Ninhydrin Reagent | Specific chromogen for proline detection | Proline quantification via spectrophotometry |
| L-Proline Standard | Reference standard for calibration curve | Proline quantification |
| Trichloroacetic Acid (TCA) | Protein precipitation and tissue preservation | H₂O₂ extraction and quantification |
| Potassium Iodide (KI) | Colorimetric reagent for H₂O₂ detection | H₂O₂ quantification assay |
| DAB (3,3'-Diaminobenzidine) | Histochemical stain for H₂O₂ localization | In situ H₂O₂ detection in tissues |
| Sinapaldehyde | Natural compound for proline recognition | Color-changing sensor technology |
| 24-Epibrassinolide (EBL) | Brassinosteroid plant hormone | Stress amelioration studies [7] |
| Na₂HAsO₄·7H₂O | Arsenic source for heavy metal stress | Heavy metal stress studies [4] |
| CuCl₂ | Copper source for heavy metal stress | Copper stress studies [5] |
Proline and hydrogen peroxide represent critical biomarkers in plant stress physiology, each providing unique insights into plant stress status through their distinct yet interconnected metabolic pathways. The quantitative relationship between these biomarkers and stress intensity makes them valuable indicators for assessing plant health. Traditional laboratory methods for their detection, while highly accurate, face limitations in accessibility and speed for practical agricultural applications. The emergence of color-changing sensor technology, particularly proline-detecting paper sensors, represents a significant advancement toward real-time, field-deployable stress monitoring that can provide early warning of stress conditions before visible symptoms appear. This technology, inspired by natural systems and adapted for practical use, holds particular promise for small-scale farming operations and developing regions where access to sophisticated laboratory equipment is limited. Future research directions should focus on expanding the range of detectable biomarkers, enhancing sensor specificity and sensitivity, and integrating these technologies with digital agriculture platforms for automated stress monitoring and precision management interventions.
The quest for early and accurate detection of plant stress has led researchers to look toward nature's own diagnostic systems. A pivotal inspiration is found in the Nesocodon flower, a species native to Mauritius that is believed to be pollinated by geckos [2]. This flower possesses a unique natural mechanism: its nectar changes color in response to the concentration of a small molecule called proline [2]. Proline is a universal biomarker for plant health, with plants producing heightened levels in response to various stressors such as lack of water, harsh soil metals, excessive sunlight, and extreme heat [2]. This natural color-changing system provides a elegant blueprint for engineered sensors, demonstrating a direct, visible link between a plant's internal biochemical state and an easily observable signal. This whitepaper details how this bio-inspired principle is being translated into cutting-edge colorimetric sensors, framing this innovation within the broader research objective of developing accessible, real-time plant stress detection technologies.
Table 1: Core Stressors Detectable via Proline Biomarker
| Stress Category | Specific Examples | Primary Biomarker |
|---|---|---|
| Abiotic Stress | Drought, Water Deficiency | Proline [2] |
| Extreme Temperatures | Proline [2] | |
| High Soil Salinity | Proline [2] | |
| Nutrient Deficiency | Proline [2] | |
| Biotic Stress | Bacterial Infection | Hydrogen Peroxide [8] |
| Fungal Infection | Proline [2] |
The Core Mechanism: From Nectar to Sensor
The fundamental chemical reaction observed in the Nesocodon flower involves the interaction between proline and a small molecule called sinapaldehyde, which naturally occurs within the plant [2]. This mixture catalyzes the creation of a vibrant red pigment known as nesocodin. In the flower, this reaction manifests as a color transition of the nectar from a pale yellow to a bright red, providing a visual cue to pollinators [2].
Researchers at Northeastern University have successfully leveraged and replicated this specific reaction to create functional sensors [2]. They developed paper-based sensors embedded with sinapaldehyde. When these sensors are exposed to a plant sample containing high concentrations of proline, the same proline-sinapaldehyde reaction occurs, producing nesocodin and causing the sensor to turn a bright red. In contrast, exposure to low proline levels from a healthy plant results in no significant color change, with the sensor remaining a pale yellow [2]. The intensity of the red color is dose-dependent, allowing for both qualitative visual assessment and quantitative analysis of the stress level using spectral analysis or smartphone imaging.
This mechanism represents a significant shift from traditional plant health assessment methods, which are often expensive, time-consuming, and require laboratory processing, costing hundreds to thousands of dollars and taking up to a week for results [2]. In contrast, the Nesocodon-inspired sensor offers an assessment that can be completed in a couple of minutes directly in the field, making it particularly valuable for smaller farming operations and family farmers who may not have access to expensive specialized equipment like drones [2].
Detailed Experimental Protocol
This section provides a detailed methodology for utilizing the Nesocodon-inspired colorimetric sensor for plant stress detection, as described by the Northeastern University research team [2].
Materials and Equipment
- Sensor Strips: Paper-based sensors embedded with sinapaldehyde [2].
- Plant Material: A small leaf sample (clip of a single leaf) from the plant to be tested [2].
- Mortar and Pestle or Mechanical Grinder: For homogenizing the leaf tissue.
- Ethanol Solvent: High-grade ethanol for extracting proline from the leaf sample [2].
- Microcentrifuge Tubes (1.5-2.0 mL): For sample preparation.
- Pipettes and Tips: For accurate liquid handling.
- Flatbed Scanner or Smartphone Camera: For quantifying color change (optional, for quantitative analysis) [2].
Step-by-Step Procedure
- Sample Collection: Using clean scissors or a blade, clip a small piece (approximately 1 cm²) from a leaf of the test plant [2].
- Homogenization: Place the leaf sample in a mortar and pestle or a mechanical grinder. Grind it into a fine pulp to break down the cellular structure and release intracellular contents.
- Proline Extraction:
- Transfer the homogenized leaf material to a microcentrifuge tube.
- Add 1 mL of ethanol to the tube.
- Vortex or shake the tube vigorously for 1-2 minutes to facilitate proline dissolution into the ethanol.
- Let the mixture sit for 10-15 minutes to complete the extraction [2].
- Sensor Assay:
- Dip the sinapaldehyde-embedded sensor strip directly into the ethanol-proline extract.
- Allow the sensor to remain in the solution for a few seconds, ensuring full immersion.
- Remove the sensor and observe the color development.
- Color Development and Data Acquisition: Within minutes, a color will develop on the sensor strip [2].
- Qualitative Assessment: Visually compare the sensor's color against a reference chart (e.g., pale yellow for healthy, orange for moderate stress, bright red for high stress) [2].
- Quantitative Assessment: For a more precise measurement, scan the sensor strip or capture an image using a smartphone camera under controlled lighting. Use image analysis software (e.g., ImageJ) to quantify the RGB (Red, Green, Blue) values or convert to HSV (Hue, Saturation, Value) or CIELAB color spaces for a more accurate correlation with proline concentration [9].
Data Interpretation
- Pale Yellow/Pale Green: Indicates low proline concentration, corresponding to a healthy, non-stressed plant.
- Orange: Indicates a moderate level of proline, suggesting the plant is experiencing a manageable level of stress.
- Bright Red: Indicates a high concentration of proline, signaling that the plant is under severe stress and requires immediate intervention.
The entire process, from sample collection to result, can be completed within 15 minutes, offering a rapid and accessible alternative to laboratory-based methods [2].
Alternative Signaling Pathways and Sensor Designs
While the proline-based mechanism is highly effective, plant stress manifests through multiple biochemical pathways, enabling a suite of complementary sensor designs. A prominent alternative signal is hydrogen peroxide (H₂O₂), which plants produce as a distress signal in response to pests, drought, extreme temperatures, and infections [8]. This pathway has been leveraged to create a wearable electrochemical patch for plants.
Table 2: Comparison of Colorimetric Sensor Types for Plant Stress Detection
| Sensor Type | Target Analyte | Detection Mechanism | Response Time | Key Advantage |
|---|---|---|---|---|
| Nesocodon-Inspired (Proline) | Proline | Color change from reaction with sinapaldehyde [2] | ~15 minutes (including extraction) [2] | Targets a universal stress biomarker |
| Wearable Patch (H₂O₂) | Hydrogen Peroxide | Electrochemical current from enzyme-mediated reaction [8] | <1 minute [8] | Real-time, in-situ monitoring |
| COF-Silk Microneedle | Xylem pH | Color change of Covalent Organic Frameworks (COFs) [10] | Real-time, continuous [10] | Early drought detection (up to 48 hrs early) [10] |
| Nanozyme-Based | Various (e.g., pesticides) | Peroxidase-like activity catalyzing color change [11] | Varies by assay | High sensitivity and specificity |
The wearable patch technology involves an array of microscopic plastic needles on a flexible base that attaches to the underside of a leaf [8]. A chitosan-based hydrogel mixture coats this array and contains an enzyme that reacts with hydrogen peroxide, generating electrons. The mixture also contains reduced graphene oxide, which conducts these electrons, producing a measurable electrical current that is directly proportional to the amount of hydrogen peroxide present [8]. This system can provide direct measurements in under a minute and is intended for real-time, reusable monitoring of crop diseases [8].
Another advanced approach focuses on detecting pH changes in the plant's xylem, a key early indicator of drought stress. Researchers have integrated Covalent Organic Frameworks (COFs)—networks of organic polymers that change color with pH—into transparent silk fibroin (SF) microneedles [10]. When these microneedles are applied to a plant, they allow for in-vivo 3D mapping of xylem pH using a simple smartphone camera. As drought stress sets in and xylem pH increases, the COF compounds transition from dark red to red, providing farmers with an early warning system up to 48 hours before physical symptoms like wilting become visible [10].
The Scientist's Toolkit: Essential Research Reagents and Materials
The development and deployment of bio-inspired colorimetric sensors require a specific set of reagents and materials. The following table details key components used in the featured experiments and the broader field of optical plant stress sensing.
Table 3: Key Research Reagent Solutions for Colorimetric Stress Sensing
| Reagent/Material | Function/Description | Application in Experiments |
|---|---|---|
| Sinapaldehyde | A small organic molecule that reacts with proline to form a colored pigment [2]. | The core sensing element in the Nesocodon-inspired paper sensor [2]. |
| Covalent Organic Frameworks (COFs) | Crystalline, porous polymers with tunable structures that exhibit chromic properties (change color with pH) [10]. | Integrated into silk microneedles for in-planta detection of xylem pH changes [10]. |
| Reduced Graphene Oxide (rGO) | A conductive nanomaterial that facilitates electron transfer in electrochemical sensors [11] [8]. | Used in wearable H₂O₂ patches to conduct electrons generated by the enzymatic reaction [8]. |
| Chitosan-based Hydrogel | A biocompatible, water-swollen polymer matrix that can encapsulate enzymes and other sensing elements [8]. | Serves as the enzyme-immobilization medium in the wearable microneedle patch for H₂O₂ detection [8]. |
| Silk Fibroin (SF) | A strong, biocompatible, and transparent protein derived from silk, used as a substrate for sensors [10]. | Forms the transparent microneedles that hold COFs for pH sensing, allowing for color visualization [10]. |
| Nanozymes (e.g., Graphene Nanoribbons) | Nanomaterials with enzyme-like catalytic activity that can trigger color-changing reactions [11]. | Used as peroxidase mimics in label-free colorimetric sensors for various analytes [11]. |
The emulation of the Nesocodon flower's color-changing mechanism represents a paradigm shift in plant stress detection, moving from complex, delayed laboratory analyses to simple, rapid, and field-deployable diagnostics. This bio-inspired approach, alongside complementary sensor technologies targeting hydrogen peroxide and xylem pH, provides a versatile toolkit for researchers and farmers to monitor plant health with unprecedented speed and accessibility. The core strength of these technologies lies in their direct translation of invisible plant biochemistry into clear, actionable visual or electrical signals, enabling pre-symptomatic intervention.
Future developments in this field are poised to focus on several key areas. Researchers aim to enhance sensor reusability and longevity, with goals such as increasing the wearable patch's reuse cycles beyond nine measurements [8]. There is also a strong drive toward multimodality, creating sensors that can detect a broader spectrum of analytes, including plant hormones and metabolites, from a single platform [2] [10]. Furthermore, the integration of these sensors with Internet of Things (IoT) platforms and edge AI will be critical for developing fully automated, real-time monitoring systems that can provide farmers with instant diagnostics and management recommendations, ultimately optimizing resource use and securing crop yields in the face of escalating environmental challenges [12].
In the face of escalating climate pressures, the precise and early detection of plant stress is paramount for safeguarding global food security. This whitepaper delineates the molecular origins of universal plant stress biomarkers, detailing the signaling cascades initiated by abiotic and biotic challenges that culminate in the production of measurable indicator molecules. We explore the transition from fundamental physiological understanding to applied detection technologies, with a specific focus on the operational principles of advanced color-changing sensors. The integration of these biomarkers into real-time monitoring systems represents a significant leap toward predictive agriculture, enabling pre-symptomatic stress mitigation and enhancing crop resilience.
Plants constantly monitor their environment, and deviations from optimal conditions trigger a sophisticated internal alarm system. This system translates perceived stress into a biochemical language of signaling molecules and protective compounds [13]. These compounds, known as plant biomarkers, are objective, quantifiable indicators of a plant's cellular state in response to external stimuli [14]. They serve as early warning signals, detectable before irreversible damage like wilting or necrosis occurs [1]. The reliable detection of these signals is critical; abiotic and biotic stress factors can cause yield reductions of 70% to 100%, posing a severe threat to food production systems tasked with feeding a projected global population of 10 billion by 2050 [14].
Universal Biomarkers and Their Production Pathways
When a plant encounters stress, it undergoes a phased response: an initial alarm phase with rapid molecular signaling, an acclimation phase involving the production of protective proteins and metabolites, and finally, a resistance phase where the stress phenotype is fully established [13]. Throughout this process, specific biomarkers are synthesized. The following diagram illustrates the primary signaling pathways that lead to the production of key universal biomarkers.
Key Stress Biomarkers and Their Functions
The pathways above lead to the production of several crucial biomarker molecules.
Abscisic Acid (ABA): This phytohormone is a primary coordinator of the response to abiotic stresses like drought, salinity, and extreme temperatures [1]. Its concentration increases markedly under stress conditions, earning it the designation of a "stress hormone" [15]. ABA regulates critical processes such as stomatal closure to reduce water loss, activates stress-responsive gene expression, and modulates root growth [1].
Proline: This amino acid accumulates to high levels in plants under a wide range of stresses, including water deficit, high salinity, and heavy metal exposure [2]. It functions as a compatible osmolyte, helping to maintain cellular turgor and water balance. Furthermore, proline stabilizes proteins and membranes, protects the photosynthetic apparatus, and acts as a scavenger of reactive oxygen species [2].
Heat Shock Proteins (HSPs): Synthesized in response to high temperatures and other protein-damaging stresses, HSPs function as molecular chaperones [14]. They prevent the aggregation of denatured proteins and assist in the refolding of misfolded proteins, thereby maintaining cellular proteostasis and enabling survival under adverse conditions [13].
Reactive Oxygen Species (ROS): While excessive ROS cause oxidative damage, they are also key signaling molecules in the plant's alarm phase [13]. Stress-induced fluctuations in intracellular ROS concentrations activate downstream defense and acclimation responses [15].
Aquaporins and Dehydrins: Proteins like aquaporins (which regulate water transport across membranes) and dehydrins (which protect cellular structures from dehydration) are critical biomarkers for water-related stresses [14].
Small RNAs (sRNAs): These regulatory molecules are involved in post-transcriptional gene silencing and play a pivotal role in fine-tuning the plant's stress response at the genetic level [14].
Table 1: Characteristics of Primary Universal Plant Biomarkers
| Biomarker | Chemical Class | Primary Stress Triggers | Key Functions | Detection Methods |
|---|---|---|---|---|
| Abscisic Acid (ABA) | Sesquiterpenoid hormone | Drought, Salinity, Heat | Stomatal closure, gene activation, growth regulation | ELISA, LC-MS, Immunosensors [1] [15] |
| Proline | Amino acid | Drought, Salinity, Heavy Metals | Osmoprotection, protein stabilization, ROS scavenging | Colorimetric assay, Ninhydrin, Sensor reaction [2] |
| Heat Shock Proteins | Molecular chaperones | Heat, Oxidative Stress | Protein folding, prevention of aggregation | Western Blot, ELISA, SDS-PAGE [14] [13] |
| Reactive Oxygen Species | Ions/molecules (e.g., H₂O₂) | Multiple abiotic/biotic | Signaling, antimicrobial defense | Chemiluminescence, fluorescence assays [13] [15] |
From Biomarker to Signal: Detection Technologies
The detection of these biomarkers has evolved from complex laboratory procedures to innovative, field-deployable sensors.
Conventional Laboratory Methods
Traditional detection relies on laboratory-based techniques that offer high specificity and sensitivity but require specialized equipment and trained personnel.
- Molecular Assays: Enzyme-Linked Immunosorbent Assay (ELISA) uses antibody-antigen interactions to detect and quantify pathogens and stress-related hormones like ABA and HSPs with high specificity [13]. Luminescence-based bioassays quantify ions like Ca²⁺ and ROS by measuring light emission from targeted chemical reactions [13].
- Mass Spectrometry (MS): This is a cornerstone of omics approaches. Coupled with separation techniques like Gas Chromatography (GC-MS), it allows for the comprehensive profiling of metabolites (metabolomics) and elements (ionomics) associated with the plant's stress response [13].
- Omics Technologies: Genomics, transcriptomics, proteomics, and metabolomics provide a holistic view of plant stress responses. Advances in next-generation sequencing (RNA-Seq) and protein analysis (2D-GE) have been instrumental in identifying and validating novel biomarkers [1].
Table 2: Comparison of Biomarker Detection Platforms
| Platform | Sensitivity | Key Advantage | Key Limitation | Throughput |
|---|---|---|---|---|
| Electrochemical Sensors | pg/mL [15] | Portability, real-time data | Limited multiplexing | Low to Medium |
| Colorimetric Sensors | ~nM-μM range [2] | Low cost, visual readout | Semi-quantitative without reader | Low |
| ELISA | High | High specificity, quantitative | Destructive, lab-bound | Medium |
| Mass Spectrometry | Very High | Broad, untargeted analysis | Expensive, complex data | High |
The Novel Color-Changing Sensor Paradigm
A groundbreaking advancement in field-based detection is the development of color-changing sensors inspired by natural systems. Researchers have developed a sensor that mimics the nectar of the Nesocodon flower, which changes color from yellow to bright red due to a reaction between proline and sinapaldehyde, forming the red pigment nesocodin [2].
The experimental workflow for utilizing these sensors is as follows:
This methodology leverages proline's status as a universal stress biomarker. Under stress, plants synthesize heightened levels of proline [2]. The sensor, embedded with sinapaldehyde, produces nesocodin in a dose-dependent manner upon contact with the plant extract. The resulting color shift from pale yellow (healthy) to bright red (stressed) provides a qualitative and quantitative assessment of plant stress within minutes, offering a low-cost alternative to expensive laboratory equipment [2].
The Scientist's Toolkit: Research Reagent Solutions
The following table details essential reagents and materials for research in plant stress biomarker detection, particularly for developing and validating novel sensor technologies.
Table 3: Essential Research Reagents for Biomarker Detection
| Reagent / Material | Function / Application | Example Use Case |
|---|---|---|
| Sinapaldehyde | Key chemical reactant in color-changing sensors; binds proline [2] | Core component of paper-based proline detection sensors [2] |
| Polyclonal/Monoclonal Antibodies | Molecular recognition for specific biomarkers | Target capture in ELISA for ABA or HSP detection [13] [15] |
| Electrochemical Transducers | Convert biochemical interaction to electrical signal | Core of immunosensors for phytohormone detection [15] |
| Enzyme Substrates | Generate measurable signal (color, light) in assays | Luminol for ROS detection; TMB for ELISA [13] |
| Fluorescent Proteins/Dyes | Enable non-destructive, in vivo tracking | GFP-tagged pathogens for biotic stress studies [13] |
The journey from stress to signal is a complex yet decipherable chain of molecular events. The production of universal biomarkers like proline, ABA, and HSPs is a fundamental plant process that can be harnessed for agricultural innovation. The emergence of simple, robust detection technologies, particularly color-changing sensors, marks a transformative shift from reactive to predictive plant health management. For researchers and scientists, the continued elucidation of stress signaling pathways, coupled with the engineering of more sensitive and multiplexed detection platforms, is critical for building resilient crop systems and ensuring future food security.
Optical sensing represents a cornerstone of modern analytical science, providing powerful tools for detecting and quantifying chemical and biological species. Within this domain, colorimetric and fluorescent detection stand as two principal modalities, each governed by distinct photophysical principles and offering unique advantages. These sensing strategies are particularly transformative in the field of plant science, enabling researchers to monitor stress responses in real-time with high spatial and temporal resolution. The fundamental operating principle hinges on the interaction between a designed molecular probe and a target analyte, which induces a measurable change in the probe's optical properties. This change can be a shift in absorption wavelength (colorimetry) or a modulation of emission intensity or wavelength (fluorescence). The deployment of these probes in plant systems allows for the direct visualization of stress biomarkers, such as reactive oxygen species, specific ions, or metabolic byproducts, facilitating an unprecedented understanding of plant physiology under adverse conditions.
Framed within the broader thesis of plant stress detection research, these optical methods provide a critical link between molecular-level stress events and macroscopic, observable phenomena. Unlike traditional destructive methods, optical sensors enable non-invasive monitoring of living plants, tracking the progression of stress and the efficacy of mitigation strategies over time. Recent advances in probe chemistry have yielded sophisticated designs capable of distinguishing between different stress types and operating within the complex chemical environment of plant tissues. The following sections delve into the core principles of each method, their comparative strengths and limitations, and their practical application in deciphering the intricate language of plant stress.
Core Principles and Photophysical Mechanisms
The operational divide between colorimetric and fluorescent sensing originates from their engagement with different stages of the photophysical cycle. A probe molecule's behavior upon light absorption dictates whether it will function as a colorimetric indicator, a fluorescent reporter, or both.
Colorimetric Sensing
Colorimetric detection is based on changes in the absorption properties of a molecular probe. When a probe binds to or reacts with a target analyte, its electronic structure is altered. This change manifests as a shift in the absorption spectrum, which can be observed by the human eye as a distinct color change. The underlying mechanism often involves the modulation of an Intramolecular Charge Transfer (ICT) process. In a typical ICT-based probe, an electron-donating group is connected to an electron-accepting group through a conjugated π-system. The interaction with the analyte can either enhance or diminish the efficiency of this charge transfer, resulting in a bathochromic (red-shift) or hypsochromic (blue-shift) shift in the absorption maximum. For instance, in the probe MDT designed for detecting hypochlorite (ClO⁻) and hydrazine (N₂H₄), the recognition event disrupts the conjugated system, altering the ICT efficiency and causing a visible color change that can be used for quantitative analysis [16]. The primary output for a colorimetric sensor is the absorbance value, which follows the Beer-Lambert law, relating absorbance to the concentration of the absorbing species.
Fluorescent Sensing
Fluorescent sensing, in contrast, relies on changes in the emission properties of a probe. The process begins with the absorption of a photon, promoting the probe to an excited electronic state. The subsequent return to the ground state can occur via non-radiative pathways or through the emission of a photon (fluorescence). The sensing mechanism involves the analyte modulating the efficiency of this emission. Common mechanisms include:
- Photoinduced Electron Transfer (PET): The analyte binds to a receptor, which inhibits an electron transfer process that would otherwise quench the fluorophore's emission, resulting in a fluorescence "turn-on" [17].
- Förster Resonance Energy Transfer (FRET): The analyte affects the energy transfer between a donor and an acceptor fluorophore.
- ICT-based Fluorescence: Similar to colorimetric probes, but the ICT state has a different emission efficiency, leading to analyte-induced fluorescence shifts or intensity changes.
A key parameter in fluorescence is the Stokes shift—the difference between the absorption and emission maxima. A large Stokes shift, as seen in the MDT probe (175 nm for N₂H₄ and 203 nm for ClO⁻), minimizes self-absorption and signal interference, greatly improving detection accuracy [16]. The output is the fluorescence intensity, which is proportional to the concentration of the probe-analyte complex.
Table 1: Core Photophysical Principles of Optical Sensing
| Feature | Colorimetric Sensing | Fluorescent Sensing |
|---|---|---|
| Measured Property | Absorption of Light | Emission of Light |
| Primary Readout | Absorbance / Color Change | Fluorescence Intensity / Wavelength |
| Key Mechanism | Modulation of ICT | PET, FRET, or ICT Modulation |
| Common Output | Visual Color Change, Spectrophotometry | Fluorescence Brightness, Spectrofluorometry |
| Stokes Shift | Not Applicable | A critical parameter; larger shifts reduce interference |
Comparative Analysis: Colorimetric vs. Fluorescent Detection
The choice between colorimetric and fluorescent detection is dictated by the specific requirements of the application, as each modality presents a unique profile of advantages and limitations. A direct comparison reveals their complementary roles in plant stress research.
Sensitivity is a primary differentiator. Fluorescent sensing is generally orders of magnitude more sensitive than colorimetric methods. This is because fluorescence is measured above a theoretically zero background, whereas absorption is a differential measurement against a high incident light intensity. For example, the detection limits for the fluorescent probe MDT were 8 nM for N₂H₄ and 15 nM for ClO⁻, sensitivities that are challenging to achieve with colorimetry alone [16]. Similarly, the LJTP2 probe for Hg²⁺ exhibited a detection limit of 16 nM, enabling the visualization of trace heavy metal stress in plants [17].
Spatial Resolution and Bioimaging Capability is another area where fluorescence excels. The emission from a fluorescent probe can be highly localized and visualized with microscopy, allowing for subcellular resolution. This is invaluable for plant stress research, as it enables scientists to pinpoint the exact location of stress events, such as the accumulation of Hg²⁺ in the plasma membrane and cell nucleus of onion cells [17]. While colorimetric changes can be imaged, they typically lack the resolution for detailed subcellular analysis and are more suited for tissue-level or whole-plant observations.
Ease of Use and Equipment Needs is often a strength of colorimetric sensing. A positive colorimetric response can frequently be interpreted by the naked eye or with a simple spectrophotometer, making it ideal for rapid, field-deployable tests. This principle is leveraged in low-cost plant stress sensors, where a color-changing paper indicator signals the presence of a stress biomarker like proline [2]. Fluorescence detection typically requires more sophisticated instrumentation, such as confocal microscopes or fluorometers, which can be a barrier for some applications.
Quantification and Dynamic Range, while possible with both, is often more straightforward and has a wider linear range with fluorescence due to its direct relationship with concentration over several orders of magnitude.
Table 2: Comparative Analysis of Sensing Modalities
| Parameter | Colorimetric Detection | Fluorescent Detection |
|---|---|---|
| Sensitivity | Moderate (µM - mM) | High (nM - pM) |
| Spatial Resolution | Low (Tissue level) | High (Subcellular level) |
| Equipment Complexity | Low | High |
| Quantitative Ease | Moderate | Excellent |
| Multi-analyte Detection | Challenging | Feasible with multi-color probes |
| Suitability for Bioimaging | Limited | Excellent |
| Cost | Generally Low | Moderate to High |
Experimental Protocols for Plant Stress Detection
The application of optical probes in plant stress research requires carefully designed protocols to ensure accurate, reproducible, and biologically relevant results. The following sections outline generalized experimental methodologies for employing both colorimetric and fluorescent probes.
Protocol: Colorimetric Detection of Plant Stress Biomarkers
This protocol is adapted from the methodology for detecting proline, a universal stress biomarker, using a sinapaldehyde-infused sensor [2].
Sample Preparation:
- Select a leaf from the plant under investigation.
- Using a sterile tool, clip a small, standardized section (e.g., 1 cm²) of the leaf.
- Grind the leaf tissue into a fine powder in a microfuge tube using a sterile pestle under liquid nitrogen to preserve chemical integrity.
Analyte Extraction:
- Add 1 mL of 80% (v/v) ethanol to the ground tissue.
- Vortex the mixture vigorously for 1 minute.
- Centrifuge at 10,000 × g for 5 minutes to pellet cellular debris.
- Carefully transfer the clear supernatant (containing the extracted solutes, including proline) to a new tube.
Sensor Incubation and Readout:
- Immerse the sinapaldehyde-based colorimetric sensor strip into the extracted supernatant.
- Incubate for 15 minutes at room temperature to allow the colorimetric reaction to proceed.
- Remove the strip and allow it to air dry.
Data Acquisition and Analysis:
- Qualitative Analysis: Visually compare the color of the test strip to a reference chart. A pale yellow indicates low proline (healthy plant), while bright red indicates high proline (stressed plant) [2].
- Quantitative Analysis: Scan the strip using a flatbed scanner or photograph it under standardized lighting. Use image analysis software (e.g., ImageJ) to measure the RGB values or grayscale intensity. Correlate the color intensity to a standard curve prepared with known proline concentrations.
Protocol: Fluorescent Imaging of Heavy Metal Stress
This protocol details the procedure for visualizing Hg²⁺ stress in plant roots using the LJTP2 fluorescent probe [17].
Plant Treatment and Probe Staining:
- Grow Arabidopsis thaliana or other model plants hydroponically under controlled conditions.
- Subject the plants to stress by adding HgCl₂ to the growth medium at desired concentrations (e.g., 2.5, 5, 10 µM) for a set duration (e.g., 7 days).
- Prepare a working solution of the LJTP2 probe (e.g., 10 µM) in an appropriate physiological buffer (e.g., Hepes, pH 7.4).
- Carefully excise the roots from the treated and control plants.
- Incubate the roots in the probe working solution for 1 hour in the dark to prevent photobleaching.
Microscopy and Image Acquisition:
- After incubation, rinse the roots gently with fresh buffer to remove excess, unbound probe.
- Mount the roots on a microscope slide in a drop of buffer.
- Image the samples using a confocal laser scanning microscope or a two-photon microscope. For LJTP2, excitation was performed at 410 nm, and emission was collected at 525 nm [17].
- Acquire Z-stack images to localize the fluorescence signal in three dimensions within the root tissue.
Data Processing and Quantification:
- Use image analysis software to measure the mean fluorescence intensity in regions of interest (ROI), such as the root tip, elongation zone, or specific subcellular compartments.
- Compare fluorescence intensities between treated and control samples to quantify the relative accumulation of Hg²⁺.
- Perform statistical analysis (e.g., t-test, ANOVA) to confirm the significance of the observed differences.
Visualization of Sensing Mechanisms and Workflows
The following diagrams, generated using Graphviz, illustrate the core mechanisms and experimental workflows for colorimetric and fluorescent sensing in plant stress detection.
Colorimetric vs. Fluorescent Sensing Mechanism
Diagram 1: Fundamental mechanisms of colorimetric and fluorescent sensing.
Experimental Workflow for Plant Stress Detection
Diagram 2: Integrated experimental workflow for detecting plant stress using optical sensors.
The Scientist's Toolkit: Essential Reagents and Materials
The successful implementation of optical sensing for plant stress detection relies on a suite of specialized reagents and materials. The following table catalogs key components used in the featured research and their critical functions.
Table 3: Research Reagent Solutions for Optical Plant Stress Sensing
| Reagent / Material | Function and Role in Experimentation |
|---|---|
| Small-Molecule Fluorescent Probes (e.g., MDT, LJTP2) | The core sensing element. Designed to selectively bind a target analyte (e.g., N₂H₄, ClO⁻, Hg²⁺), resulting in a measurable change in fluorescence intensity or wavelength. Enables sensitive, spatiotemporal detection within living plants [16] [17]. |
| Colorimetric Probe / Indicator Strips (e.g., sinapaldehyde-infused paper) | The core sensing element for colorimetry. Undergoes a visible color change in the presence of a specific stress biomarker (e.g., proline). Ideal for rapid, low-cost, and field-deployable stress assessments [2]. |
| Hyperspectral Imaging Systems | Advanced sensors that capture the full spectrum of light reflected or emitted by a plant for each pixel in an image. Allows for the detection of subtle, stress-induced changes in plant pigmentation and physiology that are invisible to the naked eye [18] [19] [20]. |
| Confocal / Two-Photon Microscope | Essential instrumentation for fluorescence imaging. Provides high-resolution, optical sectioning capabilities to localize fluorescent signals within specific plant tissues and even at the subcellular level, crucial for understanding the mechanism of stress action [17]. |
| Physiological Buffers (e.g., Hepes) | Provide a stable, biologically relevant pH environment for probe storage and during in vitro and ex vivo experiments with plant tissues. Ensures probe stability and consistent performance [17]. |
| Standard Analytical Equipment (Spectrophotometer, Fluorometer) | Bench-top instruments used for quantitative measurement of absorbance (for colorimetry) and fluorescence intensity (for fluorescence) in solution-based assays. Used for validating probe performance and generating standard curves [16]. |
In contemporary agriculture and plant research, the concept of "early" stress detection is paramount for effective intervention. This guide defines early detection as the identification of plant stress responses before the manifestation of visible physical symptoms, typically within a window of several minutes to 48 hours following the onset of a stressor. The ability to act during this critical period allows for interventions that can prevent irreversible damage, optimize crop yield, and enhance agricultural sustainability. Technological advancements, particularly the development of color-changing chemical sensors and wearable devices, are fundamentally transforming our capability to access this window by visualizing plant physiology in real-time. This whitepaper provides a technical examination of early stress detection, detailing the molecular basis, sensor technologies, experimental protocols, and key research tools that underpin this critical field.
The Molecular Basis for Early Stress Detection
Plants initiate complex biochemical signaling cascades within minutes of perceiving an abiotic or biotic stress. These early molecular events form the basis for detection long before tissue damage or wilting becomes apparent. Key early stress indicators include the rapid production of specific metabolites, ions, and reactive oxygen species.
- Proline Accumulation: The amino acid proline functions as a universal biomarker for plant health, with its concentration rising significantly in response to stressors such as drought, extreme temperatures, and harsh soil conditions. This accumulation is part of the plant's osmotic adjustment strategy [2].
- Hydrogen Peroxide (H₂O₂) Burst: As a key distress signal, hydrogen peroxide is produced when pests, drought, or infections disrupt normal plant biochemistry. It also acts as a signaling molecule between cells to activate defense mechanisms [8].
- Xylem pH Alterations: A reduction in xylem tissue acidity is an early indicator of drought stress. This pH change can precede physical symptoms like wilting by up to 48 hours, providing a crucial window for intervention [21].
- Reactive Oxygen Species (ROS) and Hormonal Signaling: Stress conditions often lead to an increase in ROS, causing oxidative damage. Concurrently, phytohormones such as ABA, ethylene, and jasmonic acid are reprogrammed to regulate adaptive responses [22] [23] [24].
Table 1: Key Early Stress Biomarkers and Their Detection Significance
| Biomarker | Stress Association | Detection Significance | Detection Window |
|---|---|---|---|
| Proline | Drought, Salinity, Heat, Cold | Universal biomarker for osmotic stress; indicates overall health status [2]. | Not Specified |
| Hydrogen Peroxide (H₂O₂) | Pathogen Attack, Drought, Extreme Temperatures | Primary distress signal; activates cellular defense mechanisms [8]. | ~1 minute [8] |
| Xylem pH (Increase) | Drought | Early indicator of water deficit; enables pre-symptomatic diagnosis [21]. | Up to 48 hours [21] |
| Abscisic Acid (ABA) | Drought, Salinity | Regulates stomatal closure and root growth to conserve water [23]. | Not Specified |
| Ethylene | Waterlogging/Flooding | Accumulates rapidly under hypoxia; triggers adaptive morphological changes [22] [23]. | Not Specified |
Color-Changing Sensor Technologies for Real-Time Detection
Color-changing sensors leverage specific biochemical reactions to provide a visual representation of plant health. The following technologies represent the forefront of this field, enabling rapid, in-field assessment.
Proline-Responsive Nesocodon-Inspired Sensors
Principle: These paper-based sensors mimic a natural mechanism observed in the nesocodon flower. The sensor is embedded with sinapaldehyde, which reacts with proline extracted from the plant in a dose-dependent manner. This reaction produces nesocodin, a red pigment, causing the sensor to change color from pale yellow to bright red, with the intensity correlating with the plant's stress level [2].
Experimental Protocol:
- Sample Collection: Clip a small piece (approx. 1 cm²) of the leaf from the plant of interest.
- Homogenization and Extraction: Grind the leaf tissue into a fine powder using a sterile pestle and mortar under liquid nitrogen. Transfer the powder to a microtube.
- Proline Solubilization: Add 1 mL of 70% ethanol to the powder to draw out the proline. Vortex vigorously for 1 minute.
- Sensing Reaction: Dip the sinapaldehyde-embedded sensor into the ethanol-proline extract for approximately 15 minutes.
- Result Interpretation: Qualitatively assess stress by observing the color change (yellow = healthy; orange/red = stressed). For quantitative data, scan the sensor and use image analysis software to calculate the red channel intensity [2].
Wearable Hydrogen Peroxide Patch
Principle: This wearable patch features an array of microscopic plastic needles on a flexible base, coated with a chitosan-based hydrogel containing an enzyme (e.g., horseradish peroxidase) and reduced graphene oxide. When the microneedles penetrate the leaf and interface with the apoplastic fluid, the enzyme reacts with hydrogen peroxide, producing electrons. This changes the electrical conductivity of the hydrogel, generating a measurable current that is proportional to the H₂O₂ concentration [8].
Experimental Protocol:
- Patch Application: Adhere the wearable patch to the underside of a live plant leaf, ensuring the microneedle array makes firm contact.
- Baseline Measurement: Connect the patch to a potentiostat and measure the baseline electrical current from an unstressed leaf.
- Stress Induction & Monitoring: Subject the plant to stress (e.g., bacterial infection, drought). The sensor begins measurements automatically.
- Data Acquisition: Monitor the electrical current in real-time. A significant increase in current compared to the baseline indicates H₂O₂ production due to stress. Results are available in under 1 minute [8].
Silk Fibroin Microneedle pH Sensors
Principle: These sensors consist of transparent silk fibroin (SF) microneedles coated with a film of chromatic Covalent Organic Frameworks (COFs). The COF compounds exhibit tunable acid chromism, meaning their color changes predictably with pH. The transparency of the SF microneedles allows for in-vivo observation and 3D mapping of pH spatial distributions in the xylem using a simple smartphone camera [21].
Experimental Protocol:
- Sensor Fabrication: Synthesize COF compounds (e.g., four specific compounds as documented) and coat them onto pre-formed SF microneedle arrays.
- Implantation: Gently press the COF-SF sensor onto a plant stem, allowing the microneedles to penetrate the xylem tissue.
- Image Capture: Use a smartphone camera or similar imaging device to capture high-resolution images of the sensor at regular intervals (e.g., every 30 minutes).
- Colorimetric Analysis: Analyze the images using RGB color analysis software. A color transition from dark red to red indicates an increase in xylem pH, signaling the onset of drought stress [21].
Figure 1: Generalized Signaling Pathway for Early Plant Stress Detection. This diagram illustrates the cascade from stress perception to a detectable sensor output.
Advanced Omics and AI-Driven Detection Frameworks
Beyond chemical sensors, advanced computational and omics technologies are pushing the boundaries of early detection.
- Integrated Multi-Omics Analyses: Combining transcriptomics and metabolomics provides a systems-level view of stress responses. For instance, in Magnolia sinostellata under waterlogging stress, RNA-seq revealed 12,538 differentially expressed genes (DEGs) in roots, while metabolomic analysis identified 178 differential metabolites (DEMs). This integrated approach can pinpoint key stress-responsive pathways, such as phytohormone signal transduction, long before physiological collapse [22].
- AI-Sensor Synergy: Machine learning (ML) models, when integrated with non-destructive sensor data, enable predictive stress assessment. One study used Electrical Impedance Spectroscopy (EIS), temperature, and humidity data to train a novel ensemble model called AdapTree. This model achieved an R² score of 0.993 for impedance-based stress prediction, allowing for highly accurate, real-time monitoring of plant physiological status [25].
Figure 2: AI-Driven Framework for Predictive Stress Assessment. This workflow shows how multi-sensor data is integrated for ML-based forecasting.
The Scientist's Toolkit: Essential Research Reagents and Materials
Successful experimentation in early stress detection relies on a suite of specialized reagents and materials.
Table 2: Key Research Reagent Solutions for Early Stress Detection Studies
| Reagent / Material | Function / Application | Example Use Case |
|---|---|---|
| Sinapaldehyde | Key reagent embedded in paper-based sensors; reacts with proline to form red pigment nesocodin [2]. | Proline quantification in leaf extracts [2]. |
| Chitosan-based Hydrogel | Biocompatible matrix for enzyme immobilization in electrochemical sensors; facilitates electron transfer [8]. | Wearable H₂O₂ patch for real-time, in-planta detection [8]. |
| Covalent Organic Frameworks (COFs) | Porous, chromatic crystalline materials that change color in response to specific analytes like pH [21]. | Silk fibroin microneedle sensors for drought stress monitoring [21]. |
| Silk Fibroin (SF) | A transparent, robust, and biodegradable protein used to form microneedles for minimally invasive sensor interfaces [21]. | Serves as the structural backbone for in-planta pH sensors [21]. |
| RNA-seq Reagents | For transcriptome-wide analysis of gene expression dynamics under stress conditions (e.g., Trimmomatic, HISAT2, DESeq2) [22]. | Identification of waterlogging-responsive genes and pathways [22]. |
| Trypsin | Protease used in mass spectrometry-based proteomic analysis for digesting proteins into peptides for identification/quantification [26]. | Profiling proteomic changes in Arabidopsis stress response mutants [26]. |
Sensor Architectures in Action: From Paper Strips to Nanotechnology
The rising global population and increasing climate crises exert unprecedented pressure on agricultural systems, demanding innovative solutions for monitoring plant health. Early detection of plant stress is crucial for preventing widespread damage, optimizing management strategies, and mitigating harvest losses [27]. Traditional methods for assessing plant health, such as laboratory analysis with high-end benchtop equipment, are often time-consuming, expensive, and require specialized expertise, limiting their accessibility and scalability [28]. Consequently, a significant research focus has shifted toward developing affordable, rapid, and field-deployable diagnostic tools.
Among the most promising developments are low-cost, paper-based sensors. This in-depth technical guide explores the design, operational principles, and field application of these sensors, with a specific focus on the detection of proline—a key biomarker for plant stress. Framed within the broader context of color-changing sensor research, this review details how these innovative devices are revolutionizing plant stress detection by translating complex physiological responses into simple, visible, and quantifiable signals.
The Technology Behind Paper-Based Sensors
Paper-based sensors represent a convergence of microfluidics, materials science, and analytical chemistry. Their fundamental operating principle is colorimetric detection, where a specific chemical interaction between an analyte and an embedded reagent produces a visible color change.
Fundamental Operating Principles
Color-changing sensors for plant stress detection primarily function through two established chemical mechanisms:
- The Ninhydrin-Proline Reaction: This is a well-characterized reaction where proline, upon heating with ninhydrin, forms a purple-colored product [29]. The intensity of the purple color is directly proportional to the concentration of proline in the sample, allowing for quantitative analysis.
- The Sinapaldehyde-Proline Reaction: Inspired by the nesocodon flower, this biomimetic approach leverages the reaction between proline and sinapaldehyde to form a red pigment called nesocodin [2]. In this system, a pale yellow sensor turns bright red in the presence of high proline concentrations, providing a qualitative and quantitative stress assessment.
Material Composition and Fabrication
The fabrication of these sensors prioritizes low cost and simplicity. The typical base material is cellulose filter paper, which is hydrophilic, porous, and provides a high surface area for reactions [29]. Hydrophobic barriers, often created using wax printing, define the fluidic channels and sensing zones [29]. The key functional components are the colorimetric dyes and reagents deposited onto these paper substrates via drop-casting [27].
Advanced sensor designs feature enclosed multilayer structures fabricated using origami (folding) methods. This architecture contains an internal mixing channel that enhances the reactivity between the analyte and reagents, significantly improving sensitivity. Furthermore, enclosing the sensor minimizes sample evaporation and contamination from the external environment, which is critical for reliable field use [29].
Proline as a Key Biomarker for Plant Stress
Proline is a widely recognized universal biomarker for abiotic plant stress. Plants accumulate this amino acid in response to various environmental pressures, including drought, high salinity, UV light, heavy metal exposure, and nutrient deficiency [2] [29]. Its accumulation serves as an osmoprotectant, helping to stabilize cellular structures and mitigate the effects of stress [29]. Consequently, detecting and quantifying proline levels provides a direct and reliable method for the early diagnosis of plant stress, often before visible symptoms like wilting or chlorosis appear.
Table 1: Plant Stressors and Associated Volatile Organic Compounds (VOCs)
| Stress Type | Specific Stressors | Key Biomarkers / VOCs Detected |
|---|---|---|
| Abiotic Stress | Drought, High Salinity, Nutrient Deficiency | Proline, 2-hexenal [27] [2] [29] |
| Biotic Stress | Diseases (e.g., Phytophthora root rot), Pests | Specific VOC profiles [28] [27] |
Quantitative Performance of Proline Detection Sensors
The performance of paper-based sensors for proline detection has been rigorously evaluated, demonstrating high sensitivity and suitability for field applications. The key metric for sensitivity is the Limit of Detection (LOD), which is the lowest concentration of proline that can be reliably distinguished from a blank sample.
Table 2: Performance Comparison of Paper-Based Proline Sensors
| Sensor Type | Detection Principle | Limit of Detection (LOD) | Key Advantage | Reference |
|---|---|---|---|---|
| Enclosed Multilayer Paper Sensor | Ninhydrin-proline reaction | 23 μM | High sensitivity, avoids evaporation | [29] |
| Previous 2-Layer Paper Sensor | Ninhydrin-proline reaction | 657 μM | Simpler design | [29] |
| Nesocodon-Inspired Sensor | Sinapaldehyde-proline reaction | Qualitative (color change) to Quantitative (when scanned) | Biomimetic, simple visual readout | [2] |
As shown in Table 2, structural innovations can drastically improve performance. The enclosed multilayer sensor achieves an LOD of 23 μM, which is approximately 29 times more sensitive than a previous, simpler two-layer paper sensor [29]. This high sensitivity allows for the detection of stress in its very early stages.
Experimental Protocols for Proline Detection
The following section provides detailed methodologies for conducting proline detection using paper-based sensors, as derived from the cited research.
Protocol 1: Using an Enclosed Multilayer Ninhydrin-Based Sensor
This protocol is adapted from the work on enclosed multilayer paper-based microfluidic sensors [29].
Sensor Fabrication:
- Patterning: Use a wax printer to pattern a sheet of chromatography paper with the sensor design, which includes a sample loading area and an internal mixing channel.
- Heating: Heat the wax-patterned paper on a hotplate at 120°C for 160 seconds to allow the wax to melt and penetrate the paper, creating hydrophobic barriers.
- Reagent Deposition: Pre-load the ninhydrin reagent onto the sample loading area of the sensor.
- Assembly: Fold the paper into a four-layer structure and glue it to form the final enclosed sensor. Only the sample loading area and the sensing window are exposed.
Sample Preparation:
- Clip a piece of the plant leaf (e.g., from A. thaliana, cabbage, or kale) to be tested.
- Grind the leaf piece and add ethanol to extract the proline.
Detection and Quantification:
- Load the extracted sample onto the sensor's sample loading area.
- Apply heat for a predetermined time to facilitate the proline-ninhydrin reaction, which causes a color change to purple in the sensing window.
- Capture an image of the sensing window under standardized lighting conditions.
- Analyze the image using RGB analysis software (e.g., ImageJ) to determine the ΔRGB value, which is correlated with the proline concentration. The concentration can be quantified by comparing the ΔRGB value to a pre-established calibration curve.
Protocol 2: Using a Nesocodon-Inspired Sinapaldehyde-Based Sensor
This protocol is adapted from the research on sensors inspired by the nesocodon flower [2].
Sensor Preparation:
- The sensor is pre-fabricated by embedding sinapaldehyde into a paper substrate.
Sample Preparation:
- Clip a small piece of the plant leaf.
- Grind the leaf and add ethanol to draw out the proline.
Detection and Quantification:
- Dip the sensor into the proline-containing liquid.
- Allow the reaction to proceed for approximately 15 minutes.
- Observe the color change: a pale yellow indicates low proline (healthy plant), while a bright red indicates high proline (stressed plant).
- For quantitative results, scan the sensor and use software to assign a numerical value based on the color intensity.
Field Application and Integration
The primary advantage of paper-based sensors is their deployment capability in real-world agricultural settings. Research has demonstrated their effectiveness in greenhouse and field conditions across various crops, including avocados, A. thaliana, cabbage, and kale [28] [2] [29].
For broader stress profiling, optoelectronic noses have been developed. These devices use an array of different colorimetric dyes drop-casted onto filter paper to create a unique color fingerprint in response to a mixture of plant volatiles [27]. This approach can detect abiotic stresses like high salinity and nutrient starvation as early as one to two days after exposure [27]. The cost of these multiplexed paper sensors can be as low as GBP 1 per unit, making them exceptionally accessible [27].
Integration with low-cost hardware is key to field application. Systems can utilize a low-cost spectrometer and a microcontroller (e.g., a Wio Terminal) to read and process the color changes from the paper sensors, enabling on-the-spot analysis [27].
The Researcher's Toolkit
Table 3: Essential Reagents and Materials for Paper-Based Plant Stress Sensors
| Item | Function / Role in Experimentation | Example from Literature |
|---|---|---|
| Chromatography Paper | Hydrophilic substrate for fluid transport and reagent support. | Whatman Grade 1 CHR chromatography paper [29] |
| Ninhydrin | Colorimetric reagent that reacts with proline to form a purple complex. | Pre-loaded in paper sensors for proline quantification [29] |
| Sinapaldehyde | Colorimetric reagent that reacts with proline to form a red pigment (nesocodin). | Embedded in paper for biomimetic stress sensing [2] |
| Colorimetric Dyes | A panel of dyes that change color in response to various Volatile Organic Compounds (VOCs). | Methyl red, Reichardt's dye, metal porphyrins [27] |
| Wax Printer | Creates hydrophobic barriers on paper to define microfluidic channels. | Xerox ColorQube 8570DN printer [29] |
| Microcontroller & Spectrometer | Electronic components for automating color measurement and data analysis in the field. | Wio Terminal, RGB LED ring, and a custom spectrometer case [27] |
Visualizing Workflows and Signaling Pathways
The following diagrams, generated using Graphviz, illustrate the core signaling pathway and experimental workflow for proline detection using paper-based sensors.
Diagram 1: Proline Detection Signaling Pathway
Diagram 2: Paper Sensor Experimental Workflow
Low-cost paper-based sensors represent a paradigm shift in plant stress monitoring. By leveraging simple colorimetric principles, such as the proline-ninhydrin and proline-sinapaldehyde reactions, these sensors offer a powerful, affordable, and accessible tool for early stress detection. Their design, which can range from simple test strips to sophisticated enclosed multilayer microfluidic devices, directly addresses the limitations of traditional laboratory methods. As research continues to enhance their sensitivity, multiplexing capabilities, and integration with portable readout systems, these sensors are poised to play an increasingly vital role in enabling precision agriculture, empowering farmers of all scales to make timely, data-driven decisions that enhance crop productivity and global food security.
In precision agriculture, the early detection of plant stress is a critical challenge. Plants respond to biotic and abiotic stressors—such as drought, extreme temperatures, salinity, and pathogen attack—through a complex signaling network where hydrogen peroxide (H₂O₂) serves as a crucial early messenger [30]. This reactive oxygen species (ROS) is involved in sensing multiple stresses and rapidly activating the plant's defense systems [30]. However, traditional methods for detecting H₂O₂ and other stress indicators are often destructive, lack sensitivity, and cannot provide real-time data on the dynamic changes within living plants [30].
The emergence of advanced optical sensors represents a transformative approach for monitoring plant health. Color-changing sensors detect plant stress by translating chemical signals, like the presence of H₂O₂, into visible or near-infrared optical outputs [2] [30]. This review focuses on one of the most promising developments in this field: NIR-II fluorescent nanosensors that leverage the unique properties of aggregation-induced emission luminogens (AIEgens). These sensors enable non-invasive, real-time monitoring of stress signaling molecules directly within living plants, offering researchers a powerful tool to decipher plant physiology with unprecedented spatial and temporal resolution.
Technical Foundations: NIR-II Imaging and AIE Luminogens
The NIR-II Biological Window
The second near-infrared window (NIR-II, 1000–1700 nm) offers significant advantages for deep-tissue biological imaging. Within this spectral range, light-tissue interactions—including autofluorescence, absorption, and scattering—are greatly reduced compared to the visible and NIR-I (700-900 nm) windows [31] [32]. This reduction in background interference allows for:
- Higher penetration depth into biological tissues
- Superior spatial resolution
- Enhanced signal-to-noise ratio [30] [31] [32]
These properties make NIR-II imaging particularly suitable for plant studies, where chlorophyll autofluorescence can obscure signals from conventional fluorescent probes.
Aggregation-Induced Emission Luminogens (AIEgens)
Aggregation-Induced Emission (AIE) is a photophysical phenomenon first reported by Tang's group in 2001 [32]. Unlike conventional fluorophores that suffer from aggregation-caused quenching (ACQ), AIE luminogens (AIEgens) exhibit weak emission in molecular solution but intense fluorescence in the aggregated state [33] [32]. The mechanism involves restricted intramolecular motion (RIM) in the aggregate state, which blocks non-radiative decay pathways and opens radiative channels [32]. For plant sensing applications, AIEgens provide:
- High photostability resistant to photobleaching
- Large Stokes shifts minimizing excitation backflow
- Bright emission in solid state ideal for nanoformulations [33] [34] [35]
Nanosensor Design and Operating Principle
Core Architecture of "Turn-On" H₂O₂ Nanosensors
The most effective H₂O₂ monitoring nanosensors employ an activatable "turn-on" design that remains silent until specifically triggered by the target molecule. As illustrated in Figure 1, a typical nanosensor consists of:
- An AIEgen serving as the NIR-II fluorescence reporter
- A quencher unit that suppresses the AIEgen's fluorescence until H₂O₂ is present
[30] provides a detailed example where an AIEgen is co-assembled with polymetallic oxomolybdates (POMs) that function as both the H₂O₂ recognition element and fluorescence quencher. The POMs possess oxygen vacancies that confer unique H₂O₂-responsive properties through redox reactions [30].
Figure 1: Signaling pathway of H₂O₂-activated NIR-II nanosensors.
Molecular Mechanism of H₂O₂ Detection
The detection mechanism relies on a specific redox reaction between H₂O₂ and the quencher module. In the POM-based system, Mo⁵⁺ in the POMs is oxidized to Mo⁶⁺ upon reaction with H₂O₂ [30]. This oxidation decreases the intervalence charge transfer (IVCT) between mixed-valence Mo centers, dramatically reducing the NIR absorption of the POMs [30]. Consequently, their quenching effect is diminished, and the bright NIR-II fluorescence of the AIEgen is recovered, providing a quantitative "turn-on" signal that correlates with H₂O₂ concentration.
This mechanism offers exceptional selectivity for H₂O₂ over other endogenous plant molecules and demonstrates rapid response times of approximately one minute with high sensitivity (detection limit of 0.43 μM) [30].
Quantitative Performance Metrics of NIR-II AIEgen Nanosensors
The performance of NIR-II AIEgen-based nanosensors has been rigorously characterized. Table 1 summarizes key optical and sensing parameters for representative systems described in the literature.
Table 1: Performance Characteristics of NIR-II Fluorescent H₂O₂ Nanosensors
| Sensor/Spectification | Detection Mechanism | Stokes Shift (nm) | Detection Limit | Response Time | Reference |
|---|---|---|---|---|---|
| AIE1035NPs@Mo/Cu-POM | H₂O₂-oxidized POM quenching | Not Specified | 0.43 μM | ~1 minute | [30] |
| BQM-H₂O₂ | Borate ester oxidation | 180 | 112.6 nM | Not Specified | [34] |
| Probe B2 | Borate ester oxidation | Not Specified | 49.74 nM | Not Specified | [33] |
| TPE-TLE | Borate oxidation | 70 (in aqueous solution) | 6.0 μM | Not Specified | [35] |
These performance metrics highlight the exceptional sensitivity of borate ester-based probes (B2 and BQM-H₂O₂) and the rapid response time of the POM-based system (AIE1035NPs@Mo/Cu-POM), each offering distinct advantages for different experimental requirements.
Experimental Workflow for Plant Stress Monitoring
Implementing NIR-II AIEgen nanosensors for plant studies involves a multi-step process from sensor preparation to data analysis. Figure 2 outlines the comprehensive workflow for monitoring H₂O₂ in living plants.
Figure 2: Experimental workflow for monitoring H₂O₂ in plants using NIR-II nanosensors.
Sensor Preparation and Characterization
The nanosensor construction begins with synthesizing an AIEgen with NIR-II emission properties. For instance, AIE1035 features a donor-acceptor-donor (D-A-D) structure with benzo[1,2-c:4,5-c']bis[1,2,5]thiadiazole (BBTD) as the acceptor and trimethylamine (TPA) as the donor [30]. This AIEgen is then encapsulated into nanocarriers, typically using the organic solvent swelling method with polystyrene (PS) nanospheres [30].
Concurrently, the quencher module is prepared. In the POM-based system, three variants (Mo-POM, Mo/Fe-POM, and Mo/Cu-POM) were synthesized and evaluated for their NIR absorption and H₂O₂ response [30]. Mo/Cu-POM demonstrated the most sensitive response to H₂O₂, with rapid decay effects observed at both NIR-I (750 nm) and NIR-II (1100 nm) wavelengths [30].
The final nanosensor is formed by co-assembling the AIEgen-loaded nanoparticles with the selected POM quencher through electrostatic interactions. This assembly must be characterized for:
- Particle size and distribution (PDI ~0.078, diameter ~230 nm)
- Surface charge (zeta potential)
- Elemental composition (confirmed via TEM and XPS) [30]
Plant Treatment and Stress Induction
For plant studies, the nanosensors are typically introduced through:
- Infiltration into leaf tissues using syringes without needles
- Stem injection for systemic distribution
- Root uptake in hydroponic systems
After sensor application, various stress conditions can be applied to induce H₂O₂ production, including:
- Drought stress by withholding water
- Salt stress through NaCl application
- Pathogen infection using bacterial or fungal suspensions
- Extreme temperature exposure
Imaging and Data Analysis
NIR-II fluorescence imaging is performed using specialized systems equipped with InGaAs cameras sensitive to 1000-1700 nm wavelengths [30]. Both macroscopic (whole-plant) and microscopic imaging can be conducted to capture spatial and temporal dynamics of H₂O₂ production.
The resulting fluorescence data can be processed with machine learning algorithms to classify stress types. [30] reported that a model trained on nanosensor data could differentiate between four types of stress with over 96.67% accuracy, demonstrating the analytical power of this approach.
The Scientist's Toolkit: Essential Research Reagents and Materials
Successful implementation of NIR-II AIEgen nanosensors requires specific reagents and instruments. Table 2 catalogues the essential components for these experiments.
Table 2: Essential Research Reagents and Materials for NIR-II H₂O₂ Sensing
| Category/Item | Specific Examples | Function/Purpose | Key Characteristics |
|---|---|---|---|
| AIEgen Cores | AIE1035 (D-A-D structure) [30], TPE derivatives [35], Quinoline-malononitrile derivatives [34] | NIR-II fluorescence reporter | Large Stokes shifts, high photostability, AIE property |
| H₂O₂ Recognition Elements | Polymetallic Oxomolybdates (POMs, e.g., Mo/Cu-POM) [30], Pinacol phenylboronates [33] [34] | Selective H₂O₂ binding and sensor activation | H₂O₂-specific oxidation, fluorescence quenching capability |
| Nanocarrier Systems | Polystyrene (PS) nanospheres [30] | AIEgen encapsulation and protection | Biocompatibility, controlled size distribution |
| Imaging Instrumentation | NIR-II microscopy systems, Macroscopic whole-plant imagers, InGaAs cameras [30] | Fluorescence signal detection | NIR-II spectral sensitivity (1000-1700 nm), high resolution |
| Plant Model Systems | Arabidopsis thaliana, Lettuce, Spinach, Pepper, Tobacco [30] | Experimental subjects for stress studies | Genetic tractability, agricultural relevance |
Comparative Analysis with Alternative Sensing Approaches
NIR-II AIEgen nanosensors represent just one approach to plant stress detection. Alternative methods include:
- Colorimetric sensors based on covalent organic frameworks (COFs) that change color in response to pH shifts caused by drought stress [10]
- Electrochemical sensors that detect specific biomarkers like proline [2]
- Traditional histochemical methods using dyes like DAB for H₂O₂ detection, which are destructive and not suitable for real-time monitoring [30]
The key advantages of NIR-II AIEgen nanosensors include:
- Non-destructive, real-time monitoring of living plants
- High specificity for H₂O₂ over other ROS
- Deep tissue penetration and minimal background interference
- Species-independent application across diverse plants [30]
NIR-II fluorescent nanosensors with AIE characteristics represent a cutting-edge tool for monitoring H₂O₂ signaling in living plants. Their "turn-on" design, high sensitivity, and compatibility with non-invasive imaging address critical limitations of traditional plant stress detection methods. When integrated with machine learning algorithms, these sensors can accurately classify stress types, offering researchers unprecedented insight into plant stress signaling networks.
Future development should focus on expanding the repertoire of detectable analytes beyond H₂O₂ to include other signaling molecules like phytohormones and calcium ions. Additionally, efforts to create biodegradable nanosensor formulations would enhance their environmental safety for field applications. As these technologies mature, they hold significant promise for transforming basic plant research and enabling precision agriculture practices that optimize crop productivity in challenging environmental conditions.
The early detection of plant stress is a critical challenge in agriculture, essential for preventing yield losses and maintaining crop health before visible symptoms like discoloration or wilting appear [8]. Within this field, a significant research focus involves developing sensors that detect specific biochemical stress markers. This guide details the engineering and application of a wearable microneedle-based patch for the real-time sensing of hydrogen peroxide, a key molecular distress signal in plants [8] [36]. For context, this approach will be framed against an alternative methodology: color-changing sensors that detect universal stress biomarkers like proline [2]. While the core technology of the wearable patch is electrochemical, this complementary colorimetric research provides a broader understanding of the plant stress detection landscape. This technical guide provides researchers and scientists with a comprehensive resource on the operating principles, fabrication, experimental protocols, and performance data of this emerging technology.
Core Technology Principles and Comparative Sensing Approaches
Plant stresses, including pests, drought, extreme temperatures, and bacterial infections, disrupt normal biochemistry, leading to the production of hydrogen peroxide (H₂O₂) [8] [37]. This molecule acts as both a distress signal and a cellular messenger that activates plant defense mechanisms [36]. The microneedle patch is designed to detect this compound directly and in situ.
Hydrogen Peroxide Sensing via Microneedle Patches
The wearable patch is an electrochemical sensor. Its core function relies on a chitosan-based hydrogel mixture coated onto a flexible array of microscopic plastic needles [8] [37]. This hydrogel contains an enzyme (e.g., horseradish peroxidase) that reacts specifically with hydrogen peroxide, producing electrons. The mixture also includes reduced graphene oxide, which acts as a conductor for these electrons, resulting in a measurable electrical current [36]. The magnitude of this current is directly proportional to the concentration of hydrogen peroxide at the needle interface [8].
Contrasting Approach: Color-Changing Stress Sensors
In parallel research, other groups have developed color-changing sensors that detect stress indirectly. Inspired by the nesocodon flower, whose nectar changes color in response to proline concentrations, these sensors use paper embedded with sinapaldehyde [2]. When a plant extract with high proline levels is applied, a chemical reaction produces a red pigment (nesocodin), changing the sensor's color from pale yellow to bright red [2]. This provides a qualitative or semi-quantitative visual assessment of plant stress levels. The table below contrasts these two sensing modalities.
Table 1: Comparison of Plant Stress Sensing Technologies
| Feature | Microneedle H₂O₂ Patch | Color-Changing Proline Sensor |
|---|---|---|
| Target Analyte | Hydrogen Peroxide (H₂O₂) | Proline |
| Sensing Principle | Electrochemical | Colorimetric (Color Change) |
| Signal Output | Electrical Current | Color Shift (Yellow to Red) |
| Measurement Time | ~1 minute [8] | ~15 minutes [2] |
| Key Advantage | Direct, real-time, in situ measurement on live plants | Low-cost, simple visual readout, accessible |
| Sample Preparation | None; attaches directly to leaf [37] | Requires clipping and grinding a leaf sample [2] |
The following diagram illustrates the core signaling pathway and sensing principle of the hydrogen peroxide microneedle patch.
Figure 1: Hydrogen Peroxide Signaling and Patch Sensing Pathway. Stresses trigger biochemical changes in the plant, leading to H₂O₂ production. The patch detects this via an enzyme reaction in its hydrogel, generating a measurable electrical current.
Fabrication and Materials of the Microneedle Patch
The successful operation of the sensor depends on a meticulously designed and fabricated physical structure.
Fabrication Methodology
The patch consists of a flexible base outfitted with an array of microscopic plastic needles [8]. While the specific polymer is not detailed in the press releases, general microneedle fabrication often involves techniques like photolithography, micromilling, and soft lithography for creating master molds, followed by micromolding in a vacuum environment to achieve high-fidelity replication of the micro-scale structures [38] [39]. The process involves creating a master mold, often via micromilling, and then using it to produce intaglio polydimethylsiloxane (PDMS) molds through soft lithography due to PDMS's flexibility and low surface energy [39]. The final microneedle array is then produced by molding the chosen polymer material using these PDMS molds.
Material Functionalization
The molded microneedle array is coated with the functional bio-hydrogel. This coating is a composite of:
- Chitosan: A natural, biocompatible polymer that forms the hydrogel matrix [8] [37].
- Enzyme (e.g., Horseradish Peroxidase): Catalyzes the specific reaction with H₂O₂, generating electrons [36].
- Reduced Graphene Oxide (rGO): Provides a conductive network within the hydrogel to transport the generated electrons to the measurement circuit [8] [37].
This combination of mechanical design and material science results in a patch that can painlessly penetrate the leaf's epidermis (avoiding nerve endings) to interface directly with the plant's apoplastic fluid, where stress signals like H₂O₂ are present [38].
Experimental Protocol and Validation
To validate the sensor's efficacy, a rigorous experimental protocol was followed using live plants.
Sensor Application and Data Collection
- Plant Preparation: Healthy soybean and tobacco plants are selected. A test group is infected with the bacterial pathogen Pseudomonas syringae pv. tomato DC3000 to induce stress, while a control group remains healthy [8] [37].
- Patch Attachment: The wearable patch is attached directly to the underside of a live plant leaf, where the microneedle array penetrates the surface [8].
- Measurement: The electrical current generated by the patch is measured and recorded. This process takes approximately one minute from attachment to result [8] [36].
Validation and Analysis
- Comparative Analysis: Sensor readings from stressed plants are compared to those from healthy ones. The current levels are correlated with the amount of hydrogen peroxide present [8].
- Accuracy Confirmation: The sensor's measurements of hydrogen peroxide concentration are validated against conventional laboratory analytical methods to confirm accuracy [8].
- Reusability Testing: The same patch is applied and removed multiple times to test the mechanical integrity of the microneedles and the stability of the hydrogel coating [8].
The workflow for this experimental validation is summarized below.
Figure 2: Experimental Workflow for Patch Validation. The process involves preparing stressed and healthy plant groups, applying the patch, measuring the electrochemical signal, and validating the results.
Performance Data and Technical Specifications
The hydrogen peroxide-sensing patch has demonstrated high performance in experimental trials. The following table summarizes key quantitative findings from the research.
Table 2: Performance Metrics of the Hydrogen Peroxide-Sensing Microneedle Patch
| Performance Parameter | Result / Metric | Experimental Context |
|---|---|---|
| Detection Time | ~1 minute | Time to achieve a measurable signal on a live plant [8] |
| Sensitivity | Significantly lower detection levels than previous needle-like sensors | Measured H₂O₂ at lower concentrations in leaves [8] |
| Reusability | Up to 9 times | Number of uses before microscopic needles began to lose form [8] |
| Cost per Test | < $1.00 USD | Estimated direct measurement cost [36] |
| Signal Fidelity | Current levels directly related to H₂O₂ amount | Confirmed via correlation with conventional lab analyses [8] |
| Pathogen Tested | Pseudomonas syringae pv. tomato DC3000 | Bacterial pathogen used to induce stress in soybean and tobacco plants [8] [37] |
The Scientist's Toolkit: Essential Research Reagents and Materials
Developing and working with this technology requires a specific set of materials and reagents. The table below details key components referenced in the featured research.
Table 3: Essential Research Materials for Microneedle H₂O₂ Sensor Development
| Material / Reagent | Function / Application | Technical Notes |
|---|---|---|
| Chitosan | Biopolymer forming the hydrogel matrix for the sensing chemistry [8]. | Biocompatible, forms a porous gel that allows analyte diffusion. |
| Reduced Graphene Oxide (rGO) | Conductive nanomaterial that transports electrons within the hydrogel [36]. | Provides high surface area and electrical conductivity to the composite. |
| Horseradish Peroxidase (HRP) | Enzyme that catalyzes the oxidation of H₂O₂, generating an electrical current [36]. | Provides specificity and catalytic amplification for H₂O₂ detection. |
| Polydimethylsiloxane (PDMS) | Elastomer used to create flexible molds (soft lithography) for microneedle fabrication [39]. | High replication fidelity, chemically inert, and thermally stable. |
| Polyurethane Acrylate (PUA) | UV-curable polymer used for insulating coatings on microneedle electrodes [39]. | Enhances electrical insulation; cured with UV light (λ ~ 365 nm). |
| Pseudomonas syringae | Model bacterial pathogen used to induce biotic stress and H₂O₂ production in plants [8]. | Pathovar tomato DC3000 is a well-characterized model for plant-pathogen studies. |
The wearable microneedle patch for hydrogen peroxide sensing represents a significant advancement in plant health monitoring, enabling real-time, in situ detection of a fundamental stress biomarker with a cost-effective and rapid platform. When contextualized within the broader field of plant stress detection—which includes alternative approaches like color-changing proline sensors—it highlights a trend towards targeted, biochemical monitoring that moves beyond visual symptomology.
Future research, as indicated by the developers, will focus on refining the technology and enhancing its reusability [8] [37]. Further directions will likely include long-term stability studies in field conditions, expanding the platform to detect other stress-related biomarkers, and integrating the sensor with wireless systems for continuous data logging and automated alerting within precision agriculture frameworks.
The Role of Machine Learning in Interpreting Complex Sensor Outputs
Modern agricultural research increasingly relies on advanced sensors for the early detection of plant stress. These sensors capture subtle physiological changes that are invisible to the human eye, generating complex, high-dimensional data streams. Color-changing sensors, which react to specific plant stress biomarkers, represent a promising technological development for real-time monitoring [2]. Similarly, hyperspectral imaging captures detailed reflectance patterns across hundreds of narrow spectral bands, while wearable electrochemical patches directly detect stress signaling molecules like hydrogen peroxide from plant leaves [8] [40] [41].
The primary challenge, however, lies not in data collection but in interpretation. The vast and intricate datasets produced by these sensors contain hidden patterns that are difficult to extract using conventional analytical methods. This is where machine learning (ML) becomes transformative. Machine learning algorithms, particularly deep learning models, excel at identifying complex, non-linear relationships within high-dimensional data. This technical guide explores how ML techniques are leveraged to decode complex sensor outputs, with a specific focus on applications within plant stress detection research, enabling earlier and more precise interventions.
Machine Learning Approaches for Sensor Data Interpretation
The choice of ML model is contingent on the sensor data type and the specific analytical goal. The following section details prominent approaches, their applications, and performance metrics.
Convolutional Neural Networks for Hyperspectral Data
Hyperspectral imaging (HSI) generates data cubes with extensive spatial and spectral information. Convolutional Neural Networks (CNNs) are particularly adept at processing this data structure.
- Application: A framework known as MLVI-CNN was developed to analyze hyperspectral data for crop stress detection. This approach first creates two novel vegetation indices—Machine Learning-based Vegetation Index (MLVI) and Hyperspectral Vegetation Stress Index (H_VSI)—by leveraging Recursive Feature Elimination (RFE) to identify the most informative spectral bands in the NIR and SWIR regions. These indices are then fed into a 1D CNN classifier [40].
- Performance: This model achieved a classification accuracy of 83.40% in distinguishing six levels of crop stress severity. It demonstrated the capability to detect stress 10–15 days earlier than traditional vegetation indices like NDVI and showed a strong correlation with ground-truth stress markers (r = 0.98) [40].
Ensemble Methods for Multi-Sensor Data Fusion
Integrating data from multiple sensor types provides a more holistic view of plant health. Ensemble methods combine multiple base models to improve predictive performance and robustness.
- Application: The
AdapTreemodel is a boosting-based ensemble method that combines AdaBoost with decision trees. It was designed to interpret multi-sensor data, including electrical impedance spectroscopy (EIS), temperature, and humidity, to predict stress-related parameters [25]. - Performance:
AdapTreedemonstrated exceptional predictive accuracy, achieving R² scores of 0.993 for impedance magnitude prediction and 0.999 for both relative humidity and temperature, significantly outperforming baseline models [25].
3D Reconstruction and Deep Learning from RGB Images
While not a spectral sensor, standard RGB imaging can be enhanced with ML to extract profound physiological information.
- Application: A methodology using 3D reconstruction and Deep Neural Networks (DNNs) from a single RGB image was proposed for plant stress detection. This technique analyzes plant geometry and leaf declination, which are early morphological stress symptoms, before visible color changes occur [42].
- Performance: This 3D approach outperformed conventional 2D image classification, showing a 22.86% higher precision, 24.05% higher recall, and 23.45% higher F1-score [42].
Table 1: Performance Comparison of Machine Learning Models in Plant Stress Detection
| ML Model | Sensor Type | Key Input Features | Reported Performance | Primary Advantage |
|---|---|---|---|---|
| 1D CNN [40] | Hyperspectral Imaging | MLVI, H_VSI Indices | 83.40% accuracy; detects stress 10-15 days earlier | High accuracy for spectral-temporal patterns |
| AdapTree Ensemble [25] | Multi-sensor (EIS, Temp, Humidity) | Impedance Magnitude/Phase, RH, Temperature | R²: 0.993 (Impedance), 0.999 (Temp/RH) | Superior predictive accuracy for multi-sensor data fusion |
| 3D DNN [42] | RGB Imaging | 3D Plant Geometry, Leaf Angles | 22.86% higher precision than 2D methods | Detects pre-visual stress through structural changes |
| Spectral Fitting Method (SFM) [43] | Mid-Resolution Spectral Imager | Sun-Induced Chlorophyll Fluorescence (SIF) | Significantly detected stress (p <0.05) | Accurately tracks physiological SIF yield (ΦF) under stress |
Experimental Protocols: From Sensor Data to ML Insight
This section outlines detailed methodologies for key experiments that successfully integrated sensor technology with machine learning.
Protocol 1: Color-Changing Sensor Analysis for Proline Detection
This protocol details the process for using color-changing paper-based sensors to detect proline, a universal biomarker for plant stress [2].
- Sample Collection: A small piece of the plant leaf (e.g., from cabbage, kale, broccoli) is clipped off.
- Sample Preparation: The leaf sample is ground into smaller pieces. Ethanol is added to the ground tissue to draw out the proline.
- Sensor Exposure: The paper-based sensor, which is embedded with sinapaldehyde (a compound derived from the nesocodon flower), is dipped into the proline-extracted liquid.
- Color Reaction: In the presence of proline, a chemical reaction occurs that produces the red pigment nesocodin. The sensor changes color from pale yellow to bright red in a dose-dependent manner.
- Data Acquisition & Analysis:
- Qualitative Assessment: The color change is visually inspected (yellow, orange, red).
- Quantitative Analysis: The sensor is scanned, and the intensity of the red color is quantified using image analysis software to infer the proline concentration and, thus, the stress level. The entire process from leaf clipping to result can be completed within 15 minutes [2].
Protocol 2: Hyperspectral Stress Detection with ML-Optimized Indices
This protocol describes the use of hyperspectral imaging and a CNN for early stress detection [40].
- Data Acquisition: Hyperspectral imagery is captured via UAVs, satellites, or ground-based systems across the visible, NIR, and SWIR regions (e.g., 650–1650 nm).
- Preprocessing: The raw imagery is corrected for uneven lighting and atmospheric interference to generate a calibrated hyperspectral data cube.
- Feature Selection & Index Development: Recursive Feature Elimination (RFE) is applied to the full spectral dataset to identify the most critical wavelengths sensitive to plant stress. These wavelengths are used to formulate two novel indices:
- Machine Learning-based Vegetation Index (MLVI)
- Hyperspectral Vegetation Stress Index (H_VSI)
- Model Training & Classification: The optimized indices (MLVI and H_VSI) are used as input features to train a 1D Convolutional Neural Network (CNN). The model is trained to classify data into multiple levels of stress severity.
- Validation: Model performance is validated against ground-truthed physiological measurements, such as relative water content or chlorophyll concentration [40] [41].
Protocol 3: Wearable Patch for Real-Time Hydrogen Peroxide Sensing
This protocol covers the use of a wearable electrochemical patch for detecting hydrogen peroxide, a key plant distress signal [8].
- Sensor Fabrication: A flexible patch with an array of microscopic plastic needles on a flexible base is created. The needles are coated with a chitosan-based hydrogel mixture containing an enzyme (e.g., horseradish peroxidase) and reduced graphene oxide.
- Sensor Deployment: The patch is attached to the underside of a live plant leaf, where the microneedles interface with the plant tissue.
- Signal Measurement: When hydrogen peroxide is present in the leaf, the enzyme in the hydrogel catalyzes a reaction that produces electrons. The reduced graphene oxide conducts these electrons, generating a measurable electrical current. The current level is directly proportional to the hydrogen peroxide concentration.
- Data Interpretation: The electrical signal is recorded, typically within under one minute of application. Significantly higher current readings from stressed plants (e.g., bacteria-infected) compared to healthy controls confirm stress activation. The patches can be reused multiple times (e.g., nine cycles) [8].
Diagram 1: Sensor Data to Insight Workflow
Visualizing Machine Learning Models and Data
Effective visualization is critical for understanding ML model structures, performance, and the complex, high-dimensional data they process.
Model Performance Visualization
To evaluate and communicate a model's effectiveness, several visualization techniques are standard:
- Confusion Matrix: A fundamental tool for classification models, it shows a matrix comparing model predictions against ground truth, clearly illustrating which classes the model confuses. The diagonal represents correct predictions, while off-diagonal entries show misclassifications [44].
- Performance Metric Plots: Visualizations of metrics like accuracy, precision, recall, and F1 score over time or across different model configurations help identify performance trends and optimization points [44].
- Feature Importance Plots: These plots make it easy to identify the key sensor-derived features (e.g., specific spectral wavelengths) that are most influential in driving the model's predictions, enhancing interpretability [44].
Dimensionality Reduction for Hyperspectral Data
Hyperspectral data contains hundreds of correlated bands, creating a high-dimensional space that is difficult to visualize. Dimensionality reduction techniques like t-Distributed Stochastic Neighbor Embedding (t-SNE) and Uniform Manifold Approximation and Projection (UMAP) are used to project this data into a 2D or 3D space while preserving its clustering structure [44]. This allows researchers to visually assess whether different stress levels or plant types form distinct, separable groups before formal model training.
The Scientist's Toolkit: Essential Research Reagents & Materials
Table 2: Key Research Materials and Tools for Sensor-Based Plant Stress Detection
| Item / Solution | Function in Research | Example Application |
|---|---|---|
| Sinapaldehyde-Embedded Paper Sensors | Reacts with stress biomarker proline to produce a visible color change (yellow to red) [2]. | Low-cost, rapid field test for plant stress. |
| Hyperspectral Imaging Systems | Captures detailed reflectance spectra (650-1650 nm+); reveals biochemical and structural plant composition [40] [41]. | Early detection of water/nutrient stress; biochemical trait prediction. |
| Wearable Electrochemical Patches | Monitors stress signaling molecules (e.g., H₂O₂) directly from plant leaf in real-time via microneedle array [8]. | Real-time, in planta monitoring of stress onset. |
| Electrical Impedance Spectroscopy (EIS) System | Measures electrical impedance of plant tissues to assess physiological state (cell membrane integrity, water content) [25]. | Non-invasive evaluation of cellular-level stress responses. |
| Recursive Feature Elimination (RFE) | ML-based feature selection technique to identify the most informative spectral bands from hyperspectral data [40]. | Reduces data dimensionality and creates optimized vegetation indices (e.g., MLVI, H_VSI). |
The integration of sophisticated sensors—from color-changing assays to wearable patches and hyperspectral imagers—with powerful machine learning algorithms is fundamentally advancing the field of plant stress phenotyping. Machine learning serves as the critical interpreter, transforming complex, multi-dimensional sensor outputs into accurate, early, and actionable insights. As these technologies continue to evolve, they pave the way for more resilient and sustainable agricultural systems, enabling precise interventions long before visible symptoms of stress occur. The future of this field lies in the development of more interpretable and efficient models that can fuse data from an even wider array of sensors, providing a truly holistic and real-time picture of plant health.
In modern agriculture, the early and accurate detection of plant stress is pivotal for maintaining crop health and maximizing yield. Among the most innovative developments in this field are color-changing sensors, which translate invisible plant stress biomarkers into visible color signals. This technical guide delves into the deployment of these advanced sensors across various crops, including brassica vegetables like cabbage and kale, and extends the principles to crops like tobacco. Framed within broader research on plant stress detection, these case studies demonstrate how direct, visual, and often low-cost monitoring can be achieved, offering a practical tool for researchers and agricultural professionals. The core thesis is that these sensors operate by leveraging specific biochemical stress responses, such as the accumulation of proline or the generation of reactive oxygen species, and transducing them into a colorimetric output for straightforward interpretation [2] [45].
Technical Foundation of Color-Changing Sensors
Color-changing sensors for plant stress detection function as biochemical transducers. They are designed to interact with specific biomarkers whose concentration shifts when a plant is under abiotic or biotic stress.
The operational principle is rooted in molecular recognition. A sensor is impregnated with a reactive compound that selectively binds to a target stress biomarker. This binding event triggers a chemical reaction that alters the sensor's light absorption properties, resulting in a visible color change. The intensity of the color is typically proportional to the concentration of the biomarker, allowing for both qualitative assessment and quantitative analysis [2] [46].
Two primary mechanistic approaches have been successfully demonstrated:
- Biomimetic Proline Detection: This approach mimics a natural mechanism found in the Nesocodon flower. The sensor is embedded with sinapaldehyde. When the sensor is exposed to a plant sample containing a high concentration of proline—a universal stress biomarker—the two compounds react to form nesocodin, a red pigment. Consequently, the sensor shifts in color from pale yellow to bright red, providing a direct visual indicator of stress levels [2].
- Nanobionic Hormone and ROS Detection: This approach utilizes optical nanosensors made from single-walled carbon nanotubes (SWNTs) wrapped with specific polymers or DNA strands. When these nanosensors bind to target molecules like hydrogen peroxide (H₂O₂) or salicylic acid (SA) within the plant tissue, their near-infrared (nIR) fluorescence changes (e.g., quenching or enhancement). This nIR signal, while not visible to the naked eye, can be detected with specialized instrumentation and is translated into a temporal waveform of the signaling molecule, representing a different form of "color" change in the spectroscopic domain [45].
Table 1: Core Biomarkers and Mechanisms for Color-Changing Sensors
| Target Biomarker | Role in Plant Stress | Sensor Mechanism | Resulting Color/Output Change |
|---|---|---|---|
| Proline | A universal osmolyte that accumulates under various abiotic stresses like drought and salinity [2] [47]. | Reaction with sinapaldehyde in a paper-based sensor [2]. | Yellow → Bright Red |
| Salicylic Acid (SA) | A key plant hormone involved in defense responses against pathogens and abiotic stresses [45]. | Fluorescence quenching of polymer-wrapped SWNT nanosensors [45]. | Change in nIR fluorescence intensity |
| Hydrogen Peroxide (H₂O₂) | A reactive oxygen species (ROS) acting as an early signaling molecule in stress responses [45]. | Fluorescence modulation of DNA-wrapped SWNT nanosensors [45]. | Change in nIR fluorescence intensity |
Case Study 1: Deploying Proline-Detecting Sensors on Cabbage and Kale
Experimental Protocol and Deployment Methodology
A clear, deployable protocol has been established for using proline-detecting sensors on brassica crops [2].
- Sample Collection: A small piece of leaf tissue (approximately 1-2 cm²) is clipped from the plant to be tested.
- Sample Preparation: The leaf tissue is mechanically ground into a fine pulp using a mortar and pestle or a miniature mechanical grinder. This process disrupts the cell walls to release intracellular contents.
- Analyte Extraction: Ethanol is added to the ground tissue to extract proline and other soluble compounds. The mixture is allowed to settle or is briefly centrifuged.
- Sensor Immersion and Reaction: The paper-based sensor strip, impregnated with sinapaldehyde, is dipped into the ethanolic extract.
- Result Interpretation: The sensor is observed for a color change. A pale yellow color indicates low proline (healthy plant), while a bright red color indicates high proline (stressed plant). The color intensity can be quantified by scanning the sensor and analyzing the RGB values for a more precise, numerical assessment.
This entire process, from leaf clipping to result, can be completed in approximately 15 minutes, offering a rapid alternative to laboratory-based methods [2].
Data and Analysis
The research demonstrated successful deployment on several members of the Brassicaceae family, including cabbage, kale, brussel sprouts, and broccoli. The sensors provided a clear qualitative assessment of plant stress. The study highlighted that this technology is particularly suited for smaller-scale farming operations or research settings where expensive, large-scale technologies like drones are not accessible. The sensors effectively filled a gap for affordable, rapid, in-field stress assessment [2].
Diagram: Proline Sensor Experimental Workflow
Case Study 2: Multiplexed Nanosensor Deployment for Early Stress Signaling
Experimental Protocol and Deployment Methodology
This case study explores a more advanced, non-destructive approach using nanosensors injected directly into the leaf mesophyll to monitor stress signaling waves in real-time, as demonstrated on Pak choi plants [45].
- Sensor Preparation: Two distinct types of SWNT-based nanosensors are synthesized:
- H₂O₂ Sensor: SWNTs wrapped with (GT)₁₅ DNA oligomers.
- SA Sensor: SWNTs wrapped with a specific cationic fluorene-based copolymer (S3).
- Sensor Introduction (Injection): A suspension containing both nanosensors is injected into the leaf mesophyll layer using a microsyringe. This creates a "nanobionic" sensing area within the living plant tissue.
- Stress Application: The plant is subjected to a controlled stressor (e.g., light stress, heat stress, pathogenic attack, or mechanical wounding).
- Real-Time Monitoring: A near-infrared (nIR) fluorescence imaging system is used to monitor the fluorescence of both sensors simultaneously over time. The H₂O₂ and SA dynamics are recorded as waveforms.
- Data Analysis: The temporal waveforms are analyzed for characteristics like amplitude, onset time, and duration. A biochemical kinetic model can be applied to interpret the stress-specific signatures [45].
Data and Analysis
The multiplexed nanosensor approach revealed distinct, stress-specific temporal patterns of H₂O₂ and SA generation within hours of stress treatment, long before physical symptoms appeared.
Table 2: Stress-Specific Signaling Dynamics Detected by Multiplexed Nanosensors
| Stress Type | H₂O₂ Waveform Characteristics | SA Waveform Characteristics | Key Finding |
|---|---|---|---|
| Pathogen Stress | Rapid, sustained increase [45]. | Strong, correlated increase [45]. | Confirms known SA-mediated defense pathway activation. |
| Heat Stress | Rapid, sharp peak, then adaptation [45]. | Moderate, delayed response [45]. | Suggests a quick ROS burst followed by a hormonal acclimation response. |
| Light Stress | Specific dynamic profile [45]. | Specific dynamic profile [45]. | Generates a unique signature distinguishable from other stresses. |
| Mechanical Wounding | Specific dynamic profile [45]. | Specific dynamic profile [45]. | Produces a characteristic early signaling pattern. |
The study concluded that the early H₂O₂ waveform encodes information specific to the stress type, enabling pre-symptomatic diagnosis and distinction between different stressors [45].
Diagram: Nanosensor-Detected Early Stress Signaling
The Scientist's Toolkit: Essential Research Reagents and Materials
Table 3: Key Research Reagent Solutions for Sensor Deployment
| Reagent / Material | Function / Description | Application Context |
|---|---|---|
| Sinapaldehyde | The organic compound that reacts with proline to form the red pigment nesocodin [2]. | Proline-detecting colorimetric sensors. |
| Single-Walled Carbon Nanotubes (SWNTs) | Serve as the highly photostable fluorescent core for near-infrared nanosensors [45]. | H₂O₂ and SA nanosensors. |
| (GT)₁₅ DNA Oligomer | A single-stranded DNA wrapper for SWNTs that confers specific binding to H₂O₂ [45]. | H₂O₂ nanosensor fabrication. |
| Cationic Fluorene-based Copolymer (S3) | A synthetic polymer wrapper for SWNTs that enables selective detection of Salicylic Acid [45]. | SA nanosensor fabrication. |
| Nafion Film | An ion-exchange membrane that selectively allows protons (H⁺) to pass, used in electrochromic neuromorphic transistors [46]. | Advanced electronic sensor devices. |
| Poly(3-hexylthiophene) - P3HT | A semiconducting polymer used as a channel material; its color and conductivity change upon ion doping [46]. | Electrochromic neuromorphic transistors. |
The case studies presented herein illustrate a significant paradigm shift in plant stress detection. The deployment of color-changing sensors, from simple paper-based strips for proline on cabbage to sophisticated multiplexed nanosystems in Pak choi, provides a powerful, versatile toolkit for agricultural research. These technologies enable a move from reactive, symptom-based observations to proactive, biomarker-based diagnostics. The core thesis is validated: by leveraging fundamental plant biochemistry and transducing it into visual or spectroscopic signals, these sensors offer unprecedented insight into plant health. For researchers, this opens new avenues for developing climate-resilient crops, optimizing resource use in precision agriculture, and fundamentally understanding plant signaling networks. The future of this field lies in enhancing sensor specificity, developing fully biodegradable form factors, and integrating these sensors into user-friendly platforms for widespread adoption by both scientists and farmers [2] [45].
Navigating Deployment Hurdles: Sensitivity, Specificity, and Real-World Viability
Color-changing sensors represent a transformative technology for the real-time detection of plant stress, offering a bridge between complex laboratory analysis and in-field practicality. These sensors function by translating the presence of specific plant stress biomarkers, such as proline, or the physiological consequences of stress into a visible color change [2] [48]. However, a significant challenge in deploying these sensors for reliable, field-based diagnostics lies in their inherent susceptibility to environmental variables like light, humidity, and temperature. These factors can directly influence the sensor's chemical matrix or the physical process of color development, potentially leading to false positives or inaccurate readings [49] [50]. This guide details the primary sources of environmental interference in colorimetric plant stress sensors and outlines the experimental methodologies and technological advances necessary to isolate the target stress signal from environmental noise, thereby ensuring data integrity and fostering the successful translation of this technology from controlled laboratories to dynamic agricultural settings.
Sensor Mechanisms and Environmental Vulnerability
Colorimetric sensors for plant stress detection operate on diverse principles, each with unique interactions with environmental conditions. Understanding these core mechanisms is the first step in designing robust interference-compensation strategies.
Table 1: Common Colorimetric Sensor Mechanisms and Their Environmental Vulnerabilities
| Sensor Mechanism | Primary Target/Principle | Key Environmental Interferences | Potential Impact on Signal |
|---|---|---|---|
| Biomarker Reaction [2] | Detection of universal stress biomarkers (e.g., proline) via specific dye reactions. | Temperature, Ambient Light | Alters reaction kinetics & color intensity; light affects visual/phone-based quantification. |
| Plasmonic Nanosensors [48] | Aggregation/dispersion of metal nanoparticles (e.g., gold) causes color shift. | Humidity, Ionic Strength | Can induce non-specific aggregation, leading to false positive color changes. |
| Enzyme-Mimetic Nanomaterials [51] | Nanomaterials with peroxidase-like activity catalyze color-producing reactions. | Temperature, pH | Temperature affects enzyme-like activity; pH can denature the nanomaterial or dye. |
| Stimuli-Responsive Polymers/Dyes [49] [50] | Polymers/dyes that change color in response to environmental parameters. | Humidity, Temperature | Inherently sensitive to these factors, which can confound a dedicated plant stress signal. |
Quantifying and Characterizing Interference
A systematic experimental approach is required to characterize how environmental factors affect sensor performance. The following protocols provide a framework for this critical validation step.
Protocol: Testing Temperature Interference
Objective: To determine the impact of temperature on the reaction kinetics and final color output of a colorimetric sensor.
- Sensor Preparation: Prepare a standardized batch of sensors, such as the paper-based sinapaldehyde sensors for proline detection [2] or fabric-based multi-responsive sensors [49].
- Sample Loading: Apply a consistent volume and concentration of the target analyte (e.g., a proline standard solution) to the sensors.
- Controlled Incubation: Use a programmable thermal chamber to expose identical, prepared sensors to a range of temperatures (e.g., 10°C, 20°C, 30°C, 40°C) while maintaining constant humidity and light levels.
- Data Acquisition:
- Kinetics: Capture images of the sensors at fixed time intervals (e.g., every 30 seconds) until the color stabilizes.
- Endpoint: After a fixed reaction time (e.g., 15 minutes), capture a high-resolution image of all sensors.
- Analysis: Use image analysis software (e.g., ImageJ) to convert the color of each sensor to a quantitative value, such as Red-Green-Blue (RGB) intensity or Hue-Saturation-Value (HSV). Plot the reaction rate and final color intensity against temperature to establish a temperature-correction model [49].
Protocol: Testing Humidity Interference
Objective: To assess the degree of non-specific color change induced by varying ambient humidity levels.
- Setup: Use an airtight vapor control chamber equipped with a humidifier and a dry gas (e.g., nitrogen) supply to precisely control relative humidity (RH) [50].
- Sensor Calibration: Place sensors without the target analyte (e.g., blank sensors, or those loaded with a control solution) in the chamber. Expose them to a humidity gradient from low (e.g., 20% RH) to high (e.g., 90% RH).
- Data Recording: At each target humidity level, record both the colorimetric response (via imaging) and, if the sensor is electronic, the electrical resistance [50].
- Analysis: Quantify the color change and/or resistance change at each humidity level. This data maps the sensor's inherent humidity response, which can be used for algorithmic compensation in future readings.
Protocol: Testing Ambient Light Interference
Objective: To evaluate the consistency of sensor readout under different lighting conditions, critical for smartphone-based field analysis.
- Sensor Preparation: Prepare a set of sensors with an identical, known level of color development.
- Imaging Conditions: Image the same set of sensors under various lighting conditions (e.g., direct sunlight, cloud cover, shade, artificial light) using a standard smartphone camera.
- Standardization: Incorporate an internal color reference card (with known white, black, and color patches) within every image frame [51].
- Analysis: Use the reference card to perform color normalization and white balance correction on the captured images. Compare the quantified sensor color values across the different lighting scenarios to assess variance and validate the correction algorithm.
Mitigation Strategies and Advanced Designs
To overcome the challenges of environmental interference, researchers are developing sophisticated mitigation strategies at the material, system, and data analysis levels.
Material-Level Solutions
Innovations in sensor materials focus on enhancing specificity and building-in compensation.
- Multi-Responsive Sensors: Advanced sensors are engineered to respond to multiple stimuli with distinct color signatures. A single sensor might change from pink to yellow with increasing humidity, and from yellow to pink with increasing temperature [49]. This allows for the fingerprinting of environmental conditions alongside the stress signal.
- Stable Colorimetric Reagents: The use of highly stable plasmonic nanoparticles, such as gold nanoparticles, can reduce non-specific interactions. Their surface can be functionalized with specific recognition elements (e.g., antibodies, oligonucleotides) to improve selectivity for the target analyte over environmental interferents [48].
- Protective Coatings: Applying thin, permeable polymer films (e.g., Polydimethylsiloxane or PDMS) can shield the sensor's active components from direct contact with water droplets or dust, while still allowing the diffusion of target vapor molecules [50].
System-Level and Data-Driven Solutions
Compensation can also be achieved through smart sensor system architecture and data processing.
- Integrated Reference Sensors: Deploying a "dummy" sensor identical to the active one but lacking the recognition element provides a built-in control. Any color change in the reference sensor is due to environmental interference and can be subtracted from the signal of the active sensor [48].
- Sensor Arrays (Electronic Noses): Instead of a single sensor, an array of multiple sensors with cross-reactive elements can be used. The unique response pattern ("fingerprint") generated by the array to a complex sample (plant volatiles + environment) can be deconvoluted using machine learning to identify the contribution of the plant stress signal separately from background humidity or temperature effects [51] [52].
- Machine Learning for Data Fusion: Machine learning (ML) and artificial intelligence (AI) models can be trained on large datasets that include sensor responses under a wide range of environmental conditions. These models learn to correlate the final color output with both the target analyte concentration and known interferents, allowing for highly accurate prediction of the true stress level [52] [53].
Visualizing Compensation Strategies
The following diagram illustrates the integrated workflow for mitigating environmental interference, from sensor design to final analysis.
Diagram: Integrated Workflow for Mitigating Environmental Interference in Colorimetric Sensors.
The Scientist's Toolkit: Essential Research Reagents and Materials
Table 2: Key Reagents and Materials for Developing and Testing Interference-Resistant Sensors
| Item | Function/Description | Relevance to Interference Studies |
|---|---|---|
| Sinapaldehyde [2] | A natural small molecule that reacts with proline to form a red pigment (nesocodin). | The core reactive dye in biomarker-based plant stress sensors. |
| Proline Standards [2] | Purified L-proline for preparing calibration solutions of known concentration. | Essential for establishing the baseline sensor response and quantifying how environment alters it. |
| Triaryl methane Dyes [49] (e.g., Cresol Red, Thymol Blue) | pH-sensitive dyes used in multi-responsive sensors for humidity, temperature, and pH. | Enable the design of sensors that explicitly report on environmental parameters. |
| Plasmonic Nanoparticles [48] (e.g., Gold Nanospheres) | Inorganic colorants whose intense color depends on size, shape, and dispersion state. | Used to create highly sensitive sensors; their surface chemistry is key to minimizing non-specific aggregation. |
| Ethylene Glycol (EG) / Polyvinyl Alcohol (PVA) [50] | Dopants for conductive polymers like PEDOT:PSS to tune electrical and humidity-sensing properties. | Used to fine-tune the responsiveness of sensor materials to specific environmental stimuli. |
| Thermochromic Liquid Crystal (TLC) [50] | A material that changes color with temperature. | Can be integrated into sensor systems to provide a direct, built-in visual readout of local temperature. |
| Programmable Environmental Chamber | An enclosure that allows for precise, independent control of temperature and humidity. | The fundamental tool for conducting controlled interference studies. |
| Color Reference Card | A card with standardized color patches. | Critical for normalizing and correcting color data acquired under varying ambient light conditions. |
The path to widespread adoption of color-changing sensors for plant stress detection hinges on overcoming the confounding effects of light, humidity, and temperature. This requires a multi-faceted approach, combining robust sensor design with rigorous experimental characterization and sophisticated data analysis. By systematically quantifying interference through controlled protocols, employing advanced materials that offer distinct multi-stimuli responses, and leveraging machine learning to deconvolute complex signals, researchers can transform these environmental challenges into manageable variables. The ongoing development of these strategies will be crucial in validating these promising tools, ensuring they deliver reliable, actionable intelligence that empowers both fundamental plant science and precision agriculture.
Addressing Sensor Biocompatibility and Minimizing Plant Tissue Damage
The integration of sensing technologies into living plants represents a frontier in precision agriculture, enabling real-time monitoring of plant health and stress responses. Within the broader context of research on how color-changing sensors detect plant stress, the critical challenges of sensor biocompatibility and plant tissue preservation must be addressed to ensure data integrity and plant viability. Biocompatibility refers to the ability of a sensor to perform its function without eliciting significant adverse effects on the plant's biological systems, while minimal tissue damage ensures that the plant's physiological processes remain largely undisturbed, thereby providing accurate health readings. This technical guide examines current methodologies, material strategies, and experimental protocols that advance the development of minimally invasive plant sensors for reliable stress detection, focusing specifically on the intersection of sensor design and plant physiology.
Sensor Material Biocompatibility and Design Strategies
The selection of appropriate materials forms the foundation for developing plant sensors that minimize tissue damage while maintaining functionality. Researchers have explored various material classes with inherent properties that enhance biocompatibility.
Silk fibroin (SF) has emerged as a particularly promising material due to its robustness, transparency, and ability to interface stably with biological tissues. Researchers from the Singapore-MIT Alliance for Research and Technology (SMART) have successfully integrated covalent organic frameworks (COFs) with silk fibroin to create microneedle sensors for in-planta detection of physiological pH changes. The transparency of SF microneedles allows for in-vivo observation and visualization of pH spatial distributions through changes in pH-sensitive colors without requiring destructive sampling methods [10].
Paper-based substrates offer another biocompatible approach, particularly for external application. Northeastern University researchers developed paper-based sensors embedded with sinapaldehyde that change color in response to proline concentrations—a universal biomarker for plant stress. These sensors provide a low-cost, accessible alternative for stress assessment while minimizing direct tissue interaction by analyzing leaf extracts rather than requiring continuous attachment to living tissue [2].
Material selection must also consider end-of-life disposal. Researchers are actively exploring biodegradable formulations to replace plastic components, thereby reducing environmental impact when sensors are deployed at scale in agricultural settings [2]. The progression of material strategies for plant wearables highlights a concerted effort to balance sensor functionality with plant wellbeing throughout the sensor lifecycle.
Table 1: Biocompatible Material Strategies for Plant Sensors
| Material Class | Key Properties | Applications | Tissue Impact |
|---|---|---|---|
| Silk Fibroin (SF) | Transparent, robust, stable interface with biological tissues | Microneedle sensors for pH monitoring in xylem tissues | Minimally invasive; allows 3D mapping of analytes |
| Paper-based Substrates | Porous, flexible, low-cost | Color-changing sensors for proline detection in leaf extracts | Non-invasive; requires small leaf samples for analysis |
| Covalent Organic Frameworks (COFs) | Tunable acid chromism, crystal-like structures | Color-changing films for pH detection | Minimal chemical interference when properly encapsulated |
| Biodegradable Polymers | Environmentally decomposable | Disposable sensor components to reduce waste | Varies with composition; designed to minimize long-term impact |
Quantitative Assessment of Tissue Damage and Sensor Impact
Objective measurement of plant tissue response to sensor integration is essential for validating biocompatibility claims. Researchers employ multiple quantitative metrics to evaluate the extent of tissue damage and physiological disruption.
The proline assay protocol developed by Northeastern researchers requires clipping a small piece of leaf (approximately 1-2 cm²) and grinding it with ethanol to extract proline for measurement with color-changing sensors. While this method causes localized damage, it provides quantitative stress assessment within 15 minutes without continuous sensor attachment to the plant [2]. This approach limits tissue interaction to discrete sampling events rather than chronic sensor presence.
More invasive microneedle-based sensors for continuous pH monitoring have demonstrated capability for early drought stress detection up to 48 hours before physical symptoms manifest. The tissue damage profile of these systems is characterized by penetration depth, microneedle diameter, and the inflammatory response elicited. SMART researchers designed SF microneedles with dimensions that minimize vascular tissue disruption while allowing sufficient analyte access for reliable pH measurement [10].
Non-invasive imaging approaches using RGB and spectral sensors provide a reference point for tissue damage comparison. These remote sensing technologies cause zero direct tissue damage but are limited to external observations and may not detect early physiological changes [54]. The trade-offs between sensor invasiveness and data richness must be carefully balanced based on application requirements.
Table 2: Tissue Impact Assessment of Different Sensor Modalities
| Sensor Modality | Sampling Method | Tissue Damage Level | Key Advantages | Limitations |
|---|---|---|---|---|
| Proline Assay Sensor | Leaf clipping and extraction | Low (destructive sampling) | Rapid results (15 min), low-cost | Discrete data points, not continuous |
| Silk Fibroin Microneedle pH Sensor | Microneedle insertion | Low to Moderate | Continuous monitoring, early stress detection (48-hour advance) | Requires tissue penetration |
| RGB Imaging Sensors | Remote imaging | None | Completely non-invasive, high resolution for color and morphology | Limited to visible symptoms, affected by lighting |
| Spectral Imaging Sensors | Remote imaging | None | Detects non-visible physiological changes | Expensive, complex data processing |
| Wearable Physical Sensors | Direct attachment | Low | Continuous monitoring of physical parameters | Potential for abrasion or constriction |
Experimental Protocols for Biocompatibility Testing
Proline Detection Assay with Color-Changing Sensors
Purpose: To quantitatively measure plant stress levels through proline concentration in leaf tissue using color-changing paper-based sensors while minimizing ongoing plant tissue damage.
Materials and Reagents:
- Paper-based sensors embedded with sinapaldehyde [2]
- Ethanol (analytical grade)
- Mortar and pestle or mechanical grinder
- Digital scanner or smartphone camera for color quantification
- Color analysis software (e.g., ImageJ with color deconvolution plugin)
Procedure:
- Clip a small section of leaf tissue (approximately 0.5 cm²) from the plant of interest.
- Immediately place the tissue in a mortar and grind with 5 mL of ethanol until fully homogenized.
- Transfer the homogenate to a small container and immerse the paper-based sensor.
- Incubate for 15 minutes at room temperature, allowing color development.
- Remove the sensor and capture a digital image under standardized lighting conditions.
- Analyze the color values using appropriate software, comparing against a standard curve of known proline concentrations.
- Interpret results: pale yellow indicates healthy proline levels, while bright red indicates elevated proline and significant plant stress.
Biocompatibility Considerations: This method causes minimal overall plant damage through small tissue samples and eliminates continuous sensor attachment, allowing the plant to recover between sampling events [2].
In-Planta pH Monitoring with COF-SF Microneedles
Purpose: To continuously monitor xylem pH changes as an early indicator of drought stress using chromatic covalent organic framework-silk fibroin (COF-SF) microneedles.
Materials and Reagents:
- COF-SF microneedle arrays (fabricated as described in [10])
- Sterilization equipment (UV light or ethanol sterilization)
- Smartphone camera or digital microscope for color documentation
- Color reference standards for calibration
- Supporting framework for sensor stabilization (if needed)
Procedure:
- Sterilize the COF-SF microneedle array using appropriate methods.
- Carefully insert the microneedle array into the plant stem or petiole, targeting xylem tissue.
- Secure the sensor with a minimal-contact support system to prevent mechanical damage from movement.
- Document initial sensor color using a calibrated imaging system.
- Monitor color changes at regular intervals (e.g., every 6-12 hours) using the same imaging setup.
- Quantify color changes through RGB value extraction, focusing on red channel intensity.
- Correlate color changes with pH values using predetermined calibration curves.
- Interpret results: transition from dark red to red indicates pH increase and emerging drought stress.
Biocompatibility Considerations: The transparent SF microneedles allow multidimensional mapping in a minimally invasive manner while providing stable interfacing with plant tissues [10].
Signaling Pathways in Plant Stress Detection
The detection of plant stress through color-changing sensors relies on fundamental physiological pathways that generate measurable biomarkers. The following diagram illustrates the primary signaling pathway for proline-mediated stress detection and the corresponding sensor mechanism:
Plant Stress Detection Pathway
This pathway illustrates how environmental stressors trigger physiological responses in plants, leading to proline accumulation. When sensors containing sinapaldehyde interact with extracted proline, they undergo a color change from pale yellow to bright red through the formation of nesocodin pigment, enabling stress diagnosis [2].
The following workflow diagram outlines the experimental process for assessing plant stress using color-changing sensors while emphasizing biocompatibility considerations:
Experimental Workflow with Biocompatibility
Research Reagent Solutions for Plant Stress Sensing
The development and implementation of plant stress detection sensors requires specific reagents and materials optimized for biocompatibility and detection efficiency. The following table details essential research reagents and their functions in sensor fabrication and deployment.
Table 3: Essential Research Reagents for Plant Stress Sensor Development
| Reagent/Material | Function | Biocompatibility Considerations |
|---|---|---|
| Sinapaldehyde | Embedded in paper-based sensors to react with proline | Naturally occurring in plants; minimal toxicity concerns |
| Silk Fibroin (SF) | Forms transparent microneedle structure for tissue penetration | Biocompatible, robust, and stable interface with biological tissues |
| Covalent Organic Frameworks (COFs) | Provides color-changing properties in response to pH | Network structures can be designed for specific biocompatibility profiles |
| Ethanol | Extraction solvent for proline and other biomarkers | Rapid evaporation minimizes residual impact on plant tissues |
| Nesocodin Pigment | Natural red pigment formed in proline detection | Reference standard for colorimetric quantification; non-toxic |
| Biodegradable Polymer Substrates | Sensor matrix for disposable components | Reduces environmental impact and potential long-term soil contamination |
The effective detection of plant stress through color-changing sensors must be fundamentally grounded in principles of biocompatibility and minimal tissue damage. Current strategies span a spectrum from minimally destructive sampling methods for proline detection to innovative microneedle designs that enable continuous monitoring with acceptable tissue impact. Material selection plays a crucial role in these approaches, with silk fibroin, paper-based matrices, and biodegradable polymers offering varying benefits for different applications.
Future research directions should focus on further minimizing the trade-off between data quality and plant wellbeing. This includes developing increasingly sensitive detection methods that require smaller tissue samples, creating more flexible and less obstructive attachment mechanisms, and enhancing sensor biodegradability without compromising functionality. Additionally, standardized protocols for assessing tissue damage across different sensor types would enable more systematic comparison of emerging technologies. As these biocompatibility challenges are addressed, color-changing sensors will become increasingly valuable tools for precise, timely plant stress management in both agricultural and research contexts.
Strategies for Enhancing Specificity Against Multiple Stressors
The accurate and early detection of plant stress is paramount for global food security, yet a significant challenge persists in differentiating between specific abiotic and biotic stressors before visible symptoms occur. While color-changing sensors represent a revolutionary tool in plant health monitoring, their utility in complex agricultural settings is often limited by an inability to discriminate between multiple, co-occurring stresses. This technical guide details advanced strategies designed to augment the specificity of these sensing platforms, enabling precise stress identification. Framed within broader research on color-changing sensor technology, this document provides researchers and scientists with a roadmap for developing next-generation diagnostic tools that move beyond general stress detection to achieve targeted identification.
Core Technologies in Color-Changing Plant Sensors
Color-changing sensors function by translating specific biochemical or physiological plant responses into a visible or detectable optical signal. The foundational principle hinges on the interaction between a sensor material and a specific plant biomarker, resulting in a measurable color shift.
Biomarker-Based Colorimetric Sensors
This approach leverages specific molecular interactions. A prominent example involves sensors for proline, a universal biomarker for plant stress.
- Mechanism: These sensors replicate a natural color-changing reaction found in the nesocodon flower. The sensor is embedded with sinapaldehyde. When a plant extract containing high levels of proline is applied, the two compounds mix, forming the red pigment nesocodin [2].
- Output: A color change from pale yellow to bright red, with the intensity correlating to proline concentration and thus, the stress level [2].
- Experimental Protocol:
- Sample Collection: Clip a small piece (approx. 1 cm²) of the plant leaf in question.
- Homogenization: Grind the leaf segment in 1 mL of 70% ethanol to extract proline.
- Reaction: Dip the paper-based sensor (embedded with sinapaldehyde) into the extract for 5-10 seconds.
- Detection & Quantification: Observe the color change qualitatively or use a portable scanner with image analysis software to obtain a quantitative RGB value, correlating the red channel intensity to a proline concentration standard curve [2].
Activatable Optical Nanosensors
For in vivo and real-time monitoring, nanotechnology offers sophisticated "turn-on" sensors.
- Mechanism: A nanosensor is constructed from a NIR-II fluorophore with Aggregation-Induced Emission (AIE) properties and a polymetallic oxomolybdate (POM) quencher. In the absence of the target biomarker (e.g., H₂O₂), the POM quenches the NIR-II fluorescence. Upon encountering the target, the POM is oxidized, its quenching effect diminishes, and a bright NIR-II fluorescence signal is activated [30].
- Output: A "turn-on" of fluorescence in the NIR-II window (1000-1700 nm), which avoids interference from plant autofluorescence [30].
- Experimental Protocol:
- Sensor Application: Infiltrate the nanosensor solution (e.g., 100 µL of 1 mg/mL concentration) into the leaf mesophyll using a needle-free syringe or via the plant's vascular system.
- Imaging: Place the plant under an NIR-II microscopy or macroscopic imaging system. Excitation is typically provided by a 808 nm or 980 nm laser.
- Data Acquisition: Capture fluorescence images over time. The increase in fluorescence intensity at the emission maximum (e.g., 1035 nm) is proportional to the rising concentration of the target signaling molecule [30].
Engineered Biological Sensors
This strategy uses synthetic biology to create living sensors.
- Mechanism: Genetically engineered bacteria (e.g., E. coli) are designed to express a receptor protein (e.g., PYR1) with high affinity for a specific plant hormone, such as abscisic acid (ABA). The receptor is linked to a bioluminescent reporter gene (e.g., luciferase) [55].
- Output: Upon binding ABA, the bacteria emit visible light, providing a quantifiable signal of hormone levels [55].
- Experimental Protocol:
- Sensor Internalization: Introduce the engineered bacteria into the plant rhizosphere or directly into the xylem stream.
- Incubation: Allow 12-24 hours for the bacteria to colonize and respond to the local hormone concentration.
- Bioluminescence Measurement: Use a low-light camera or a luminometer to detect and quantify the bioluminescent signal. The response time can be as short as 431 seconds [55].
Table 1: Key Plant Stress Biomarkers and Sensor Modalities
| Stress Type | Key Biomarker/Signal | Sensor Technology | Detection Modality |
|---|---|---|---|
| General Stress | Proline | Colorimetric Paper Sensor | Visible Color Change (Yellow to Red) [2] |
| Drought, Pathogen | Abscisic Acid (ABA) | Engineered Bacterial Sensor | Bioluminescence [55] |
| Multiple Stresses | Hydrogen Peroxide (H₂O₂) | NIR-II Fluorescent Nanosensor | NIR-II Fluorescence "Turn-On" [30] |
| Drought | Leaf Temperature | Thermal Imaging | Infrared Radiation [56] [57] |
| Nutrient, Pathogen | Chlorophyll Content/Fluorescence | Hyperspectral/ Fluorescence Imaging | Spectral Reflectance & Fluorescence [56] [58] |
Strategies for Enhancing Specificity Against Multiple Stressors
Overlapping stress responses represent the primary hurdle in precise diagnostics. The following strategies employ a multi-faceted approach to overcome this.
Multi-Analyte Profiling
Relying on a single biomarker is often insufficient. Multi-analyte profiling involves simultaneous measurement of several biomarkers to create a unique "fingerprint" for each stressor.
- Implementation: Develop sensor arrays, where individual sensor elements are specific to different biomarkers (e.g., proline, H₂O₂, ABA, pH). The combined pattern of responses from the array provides a highly specific diagnostic signature [2] [30] [55].
- Example: A single sensor could integrate a patch for proline (colorimetric) and an area infused with NIR-II nanosensors for H₂O₂, allowing for correlative data collection from the same leaf segment.
Integration with Machine Learning for Data Fusion
The complex, high-dimensional data generated from multi-analyte sensors and imaging platforms can be decoded using machine learning (ML).
- Implementation:
- Data Collection: Train ML models on large, annotated datasets of spectral signatures (e.g., Vis-NIR) or sensor array responses corresponding to specific, applied stresses [54] [58].
- Model Training: Use algorithms like Support Vector Machines (SVM) or Convolutional Neural Networks (CNNs) to learn the subtle patterns associated with each stress type.
- Classification: The trained model can then classify unknown stress conditions with high accuracy based on new sensor data [53].
- Exemplary Result: One study using Vis-NIR spectroscopy and an SVM model achieved 100% accuracy in differentiating between apple scab, waterlogging, and herbicide stress in apple trees before visible symptoms appeared [58]. Another study using a NIR-II nanosensor and ML accurately differentiated between four types of stress with >96.67% accuracy [30].
Spatiotemporal Resolution Enhancement
Different stresses initiate and propagate in distinct spatial patterns within the plant and over different timecourses.
- Implementation: Utilize high-resolution imaging platforms (e.g., the MADI system) that combine RGB, thermal, and chlorophyll fluorescence imaging [56]. Tracking the dynamic change of signals like H₂O₂ (e.g., using NIR-II microscopy) from localized sites of infection or injury can provide critical diagnostic information [30].
- Application: A biotic stress like a fungal infection might show a localized, spreading hotspot of H₂O₂, whereas drought stress might induce a more systemic, gradual increase in ABA.
Leveraging Plant Signaling Pathways
Precision can be dramatically improved by designing sensors that target the upstream components of specific signaling pathways rather than downstream generic stress products.
- Implementation: Engineer biosensors around the core components of specific hormone signaling pathways. The bacterial ABA sensor is a prime example, as it uses the native PYR1 receptor, making it highly specific to the ABA signaling pathway [55].
- Advantage: This provides a direct readout of a specific physiological process, reducing cross-reactivity with other stress responses.
The following diagram illustrates the logical workflow for integrating these strategies into a unified diagnostic system.
Detailed Experimental Protocol for a Multi-Modal Specificity Study
This protocol outlines a comprehensive experiment to validate sensor specificity against drought, salinity, and fungal pathogen stress.
Plant Material and Stress Induction
- Plant Selection: Use a model plant like Arabidopsis thaliana or a crop species like lettuce or tomato (n=30 per group).
- Experimental Groups:
- Control (Well-watered, no pathogen)
- Drought Stress (Withhold water for 7-10 days)
- Salt Stress (Irrigate with 150 mM NaCl solution for 10 days)
- Biotic Stress (Inoculate with a fungal pathogen like Botrytis cinerea)
- Growth Conditions: Maintain all plants in a controlled growth chamber with a 16/8 hour light/dark cycle and constant temperature/humidity.
Sensor Application and Data Collection
- Day 10 - Sensor Deployment:
- Apply the proline colorimetric sensor to one leaf per plant per protocol in Section 2.1.
- Infiltrate the NIR-II H₂O₂ nanosensor into a different leaf on the same plant per protocol in Section 2.2.
- Image all plants using the multi-modal MADI platform (RGB, thermal, chlorophyll fluorescence) [56].
- Data Recorded:
- Quantitative color value from the proline sensor.
- Time-lapsed NIR-II fluorescence intensity from the nanosensor.
- Thermal images (for leaf temperature).
- Chlorophyll fluorescence indices (Fv/Fm, PRI).
- Hyperspectral reflectance data (350-2500 nm).
Data Analysis and Model Training
- Feature Extraction: From all data modalities, extract key features: proline concentration, H₂O₂ flux rate, mean leaf temperature, NDVI, PRI, and specific spectral bands from Vis-NIR (e.g., ~684 nm, ~1800-1900 nm) known to be stress-sensitive [58].
- Dataset Construction: Assemble a dataset where each plant is a data point with multiple features and a known stress label.
- Machine Learning: Split the data into training (80%) and testing (20%) sets. Train a multi-class classifier (e.g., SVM or Random Forest) to predict the stress type based on the multi-modal features.
Table 2: Example Expected Quantitative Outcomes from Multi-Modal Sensing
| Stress Condition | Expected Proline Level | Expected H₂O₂ Burst | Expected Leaf Temp. | Key Spectral Shift |
|---|---|---|---|---|
| Control | Low | Low | Ambient | Baseline Reflectance |
| Drought | High [2] | Moderate | Increased [56] [57] | Increased reflectance at ~1800-1900 nm (water band) [58] |
| Salt Stress | High | High | Slight Increase | Increased reflectance at ~684 nm [58] |
| Fungal Pathogen | Variable | Very High (Localized) | Variable | Changes in visible green peak (~550 nm) [56] |
The Scientist's Toolkit: Research Reagent Solutions
Table 3: Essential Reagents and Materials for Advanced Plant Stress Sensing
| Item Name | Function/Application | Technical Notes |
|---|---|---|
| Sinapaldehyde-Embedded Paper Sensor | Detects proline levels as a general stress indicator via color change. | Low-cost, field-deployable. Color change can be quantified with a flatbed scanner or smartphone [2]. |
| NIR-II AIEgen / POM Nanosensor | For "turn-on" fluorescence detection of H₂O₂ signaling molecules in living plants. | Requires NIR-II imaging equipment. Offers high sensitivity and spatiotemporal resolution [30]. |
| Genetically Engineered Bacteria (e.g., ABA-sensing E. coli) | Acts as a highly specific biosensor for plant hormones like ABA. | Requires biosafety containment. Provides high specificity by leveraging natural signaling pathways [55]. |
| Field Spectroradiometer | Measures high-resolution spectral reflectance of leaves in the Vis-NIR range. | Essential for building spectral libraries and identifying key stress-specific wavelengths [58]. |
| Multi-Modal Phenotyping Platform (e.g., MADI) | Integrates RGB, thermal, and fluorescence imaging for non-destructive, holistic plant monitoring. | Captures complementary physiological data (growth, temperature, photosynthesis) simultaneously [56]. |
Visualization of Signaling Pathways and Sensor Mechanisms
The diagram below details the molecular mechanism of the NIR-II activatable nanosensor and its integration with machine learning for specificity.
The transition of agricultural technologies from controlled laboratory environments to diverse, real-world field conditions presents a significant challenge for widespread adoption. This whitepaper examines the lab-to-field generalization gap specifically for color-changing plant stress sensors, with a focus on scalability and cost-effectiveness. By analyzing recent advancements in sensor technology, materials science, and deployment strategies, we provide a comprehensive framework for overcoming implementation barriers. The analysis demonstrates that emerging colorimetric sensors based on biomarker detection offer a viable path toward accessible, real-time plant health monitoring for agricultural operations of all scales, particularly addressing the needs of smallholder farmers and developing regions.
The translation of plant stress detection technologies from research laboratories to agricultural fields represents a critical bottleneck in precision agriculture. While numerous sensing technologies have demonstrated excellent performance under controlled conditions, their effectiveness diminishes when faced with the environmental variability, scalability requirements, and economic constraints of real-world farming. This lab-to-field gap is particularly pronounced for monitoring technologies intended for widespread use across diverse agricultural landscapes.
Color-changing sensors for plant stress detection represent a promising approach to bridging this gap, particularly through their inherent simplicity, visual readout capabilities, and potentially low production costs. These sensors typically operate by detecting specific biochemical biomarkers associated with plant stress responses, such as proline, a universal stress marker that accumulates in plants under drought, temperature extremes, salinity, and other abiotic stresses [2]. The fundamental challenge lies in maintaining sensor reliability and accuracy while achieving the scalability and cost-effectiveness necessary for widespread field deployment.
Color-changing sensors for plant stress detection leverage biochemical reactions that produce visible color changes in response to specific plant stress biomarkers. The most advanced platforms utilize paper-based or biodegradable polymer substrates impregnated with colorimetric reagents that change hue based on biomarker concentration.
Proline-Based Detection Mechanism
The most well-established color-changing sensor technology exploits the reaction between proline and sinapaldehyde, inspired by the natural color-changing mechanism observed in the Nesocodon flower from Mauritius. This flower's nectar changes from yellow to bright red through the formation of nesocodin pigment when proline concentrations increase [2]. Researchers have successfully replicated this biological signaling mechanism in synthetic sensors.
Biomarker: Proline (C₅H₉NO₂)
- Role: Universal plant stress biomarker
- Detection Mechanism: Reaction with sinapaldehyde
- Color Transition: Pale yellow → Bright red
- Quantification: Dose-dependent intensity [2]
The underlying chemical pathway involves a condensation reaction where proline acts as a catalyst for the formation of nesocodin pigment. The reaction kinetics are concentration-dependent, enabling both qualitative visual assessment and quantitative analysis through digital imaging and color analysis software.
Abscisic Acid (ABA) Detection Systems
Beyond proline, advanced research explores sensors for abscisic acid (ABA), a key plant stress hormone. Emerging approaches utilize genetically engineered bacteria (GEB) as molecular transceivers within plants. Escherichia coli engineered with PYR1-derived receptors demonstrates high affinity for ABA, triggering a bioluminescent response detectable within approximately 431.52 seconds [55]. While this approach remains primarily in laboratory stages, it demonstrates the potential for highly specific in planta stress detection.
Quantitative Analysis of Scalability and Cost Parameters
The scalability and cost-effectiveness of color-changing sensors are their most significant advantages over conventional plant stress monitoring technologies. The table below compares key parameters across different detection methodologies.
Table 1: Comparative Analysis of Plant Stress Detection Technologies
| Technology | Initial Cost | Operational Cost | Analysis Time | Scalability | Technical Requirements |
|---|---|---|---|---|---|
| Color-Changing Sensors | Low (<$100 for basic kit) | Very Low | 15-30 minutes | High - suitable for small plots | Minimal - visual or smartphone analysis |
| Laboratory Analysis | High (>$1000 for equipment) | High ($100s per sample) | Days to weeks | Low - requires sample transport | Advanced - specialized technicians |
| Hyperspectral Imaging | Very High (>$10,000) | Medium | Near-real-time | Moderate - requires drones/UAVs | High - data science expertise |
| Electronic Biosensors | Medium-High (>$500) | Medium | Real-time | Low-Moderate - calibration intensive | Moderate - electronics knowledge |
Table 2: Economic Impact Assessment for Different Farm Sizes
| Farm Size | Traditional Methods Annual Cost | Color-Sensor Annual Cost | Cost Reduction | ROI Timeframe |
|---|---|---|---|---|
| Smallholder (<5 hectares) | $500-$1,000 | $50-$150 | 80-90% | <1 growing season |
| Medium Operation (5-50 hectares) | $2,000-$5,000 | $300-$800 | 80-85% | 1-2 growing seasons |
| Large Commercial (>50 hectares) | $10,000+ | $2,000-$5,000 | 50-80% | 1-2 growing seasons |
Market analysis indicates the plant stress detection sector was valued at $1.3 billion in 2024 and is forecast to reach $4.8 billion by 2033, representing a robust CAGR of 15.2% [59]. This growth is partially driven by increasing adoption of cost-effective solutions like color-changing sensors, particularly in developing regions where traditional precision agriculture technologies remain prohibitively expensive.
Experimental Protocols for Lab-to-Field Translation
Sensor Fabrication Protocol
Materials Required:
- Filter paper or biodegradable polymer substrate
- Sinapaldehyde solution (1-5% in ethanol)
- Proline standard solutions for calibration (0-1000 µM)
- Ethanol (95% or higher purity)
- Color reference cards
Procedure:
- Cut substrate into 5mm x 5mm squares using precision cutter
- Immerse squares in sinapaldehyde solution for 10 seconds
- Dry at room temperature for 60 minutes protected from light
- Store in airtight containers with desiccant until use
- Validate with proline standards before field deployment
Field Deployment and Sampling Protocol
Sample Collection:
- Select representative plants across the monitoring area
- Clip small leaf sections (approximately 1cm²) from middle canopy leaves
- Immediately place samples in labeled collection vials
Sample Processing:
- Grind leaf tissue with 5mL ethanol using mortar and pestle
- Transfer homogenate to test tubes and centrifuge at low speed (1000xg) for 2 minutes
- Dip sensors in supernatant for 30 seconds
- Record color development at 2-minute intervals
Data Interpretation:
- Compare sensor color to reference chart for qualitative assessment
- For quantitative analysis, capture sensor image with smartphone camera
- Use color analysis applications to determine RGB values
- Correlate color intensity with proline concentration using pre-established calibration curves
Implementation Framework: Bridging the Generalization Gap
The transition from laboratory validation to field implementation requires addressing several critical factors that contribute to the generalization gap. The following diagram illustrates the integrated workflow for sensor deployment and data interpretation:
Addressing Environmental Variability
Environmental factors represent the most significant challenge in lab-to-field translation. Temperature, humidity, and ambient light conditions can affect both sensor performance and color interpretation. Successful implementation requires:
- Environmental Buffering: Incorporating humectants or desiccants in sensor packaging to mitigate humidity effects
- Reference Standards: Including internal color standards on each sensor strip to control for environmental variables
- Multi-Parameter Calibration: Developing location-specific calibration curves that account for regional environmental conditions
User-Centered Design for Diverse Implementation Contexts
The effectiveness of color-changing sensors depends heavily on their usability across diverse educational backgrounds and technical capabilities. Research indicates that successful field deployment requires:
- Intuitive Interpretation: Color transitions must be distinct enough for untrained users to interpret accurately
- Minimal Equipment: Field protocols should require only basic tools accessible to smallholder farmers
- Robust Packaging: Sensors must withstand transportation and storage in challenging environments without performance degradation
The Scientist's Toolkit: Essential Research Reagents and Materials
Table 3: Key Research Reagents for Sensor Development and Validation
| Reagent/Material | Function | Specifications | Application Notes |
|---|---|---|---|
| Sinapaldehyde | Colorimetric reagent | ≥95% purity, light-sensitive | Forms red nesocodin pigment with proline |
| L-Proline | Calibration standard | ≥99% purity, pharmaceutical grade | Prepare fresh solutions for accurate calibration |
| Filter Paper | Sensor substrate | Whatman Grade 1 or equivalent | Consistent porosity critical for reproducibility |
| Ethanol | Extraction solvent | 95% denatured, technical grade | Adequate for field use; higher purity for lab |
| Biopolymer Substrate | Biodegradable alternative | Polylactic acid (PLA) or cellulose-based | Environmentally sustainable option |
| Color Reference Cards | Standardization tool | Durable, weather-resistant printing | Essential for field quantification |
| Portable Centrifuge | Sample processing | Manual or battery-powered | Field-adapted for resource-limited settings |
Future Directions and Research Opportunities
Despite significant advances, several research challenges remain for optimizing color-changing sensor technology for widespread field deployment:
Enhanced Specificity and Multi-Analyte Detection
Current proline-based sensors provide general stress indication but lack specificity for distinguishing between different stress types (e.g., drought vs. nutrient deficiency). Future development should focus on:
- Multi-analyte Arrays: Developing sensor arrays that detect multiple biomarkers simultaneously
- Pattern Recognition: Creating classification algorithms that interpret complex color patterns corresponding to specific stress conditions
- Hormone-Specific Detection: Expanding beyond proline to include sensors for ABA, jasmonic acid, and other stress hormones
Integration with Digital Agriculture Platforms
The true potential of color-changing sensors emerges when integrated with broader digital agriculture ecosystems:
- Smartphone Integration: Developing applications that use smartphone cameras for precise color quantification and immediate interpretation
- Data Fusion: Combining sensor data with environmental parameters, satellite imagery, and weather forecasts
- Decision Support Systems: Incorporating sensor outputs into automated recommendation systems for precision irrigation and nutrient management
Sustainable Materials and Lifecycle Management
As agricultural technologies scale, environmental impact becomes increasingly important:
- Biodegradable Formulations: Developing sensors that decompose harmlessly after use
- Renewable Materials: Sourcing substrates from agricultural waste products
- Circular Economy Models: Establishing collection and recycling systems for sensor materials
Color-changing sensors represent a transformative approach to bridging the lab-to-field gap in plant stress detection by fundamentally addressing scalability and cost-effectiveness challenges. Their simple design, visual readout capability, and low production costs make them uniquely suitable for widespread adoption across diverse agricultural contexts, from smallholder farms in developing regions to large-scale commercial operations. By focusing on user-centered design, environmental robustness, and integration with digital platforms, these sensors can democratize access to precision agriculture technologies that were previously available only to well-resourced operations. Continued research should focus on enhancing specificity, developing multi-analyte detection capabilities, and optimizing sustainable materials to further advance the field. As the global plant stress detection market continues its rapid growth, color-changing sensors are poised to play a critical role in making precision agriculture truly accessible and scalable worldwide.
Data Processing Challenges and Solutions for Non-Expert Users
The integration of color-changing sensors into plant science represents a significant advancement in non-destructive, real-time monitoring of plant health. These sensors detect stress by undergoing visible color changes in response to specific biochemical biomarkers, such as proline, hydrogen peroxide (H₂O₂), and pH shifts in plant tissues [2] [8] [21]. For researchers, scientists, and drug development professionals, these tools offer unprecedented access to physiological data. However, transforming raw sensor outputs into reliable, interpretable data presents substantial challenges, particularly for non-expert users without specialized training in sensor data analysis. This technical guide examines the core data processing challenges inherent in these technologies and provides structured solutions to facilitate their effective application in research settings.
The fundamental operating principle of these sensors involves specific chemical interactions. Proline-sensitive sensors leverage a reaction between sinapaldehyde and proline—a universal stress biomarker—to form a red pigment called nesocodin, with color intensity quantitatively corresponding to stress levels [2]. Hydrogen peroxide detection employs electrochemical sensors or NIR-II fluorescent nanosensors that produce measurable electrical or fluorescent signals upon contact with H₂O₂, a key distress signal in plants [8] [30]. pH-based sensors utilize Covalent Organic Frameworks (COFs) that exhibit tunable acid chromism, changing color in response to pH variations in xylem tissues, providing early drought stress detection up to 48 hours before physical symptoms manifest [21]. Each sensor type generates distinct data formats—from simple color changes to complex electrical and optical signals—requiring tailored processing approaches.
Core Data Processing Challenges
The path from sensor output to actionable insight is fraught with technical hurdles that can impede non-expert users. Understanding these challenges is the first step toward developing effective mitigation strategies.
Biomarker Specificity and Cross-Reactivity: Plant stress responses involve complex, overlapping biochemical pathways. A sensor designed to detect a specific biomarker like proline may be influenced by other compounds present in plant tissue extracts, potentially leading to false positives or signal interference [2] [47]. For non-experts, validating that a color change is indeed due to the target biomarker requires additional control experiments and data verification steps that may not be intuitively designed into the protocol.
Environmental Interference and Signal Noise: The performance of optical sensors, particularly those relying on colorimetric or fluorescent measurements, can be significantly affected by ambient conditions. Variable lighting can alter perceived color in proline sensors [2], while plant autofluorescence can interfere with NIR-II fluorescent nanosensors [30]. Electrochemical sensors for H₂O₂ may be susceptible to electrical noise. Non-experts often lack the controlled laboratory environments necessary to minimize these variables, leading to inconsistent data quality.
Quantification and Calibration Complexity: While some sensors provide qualitative "yes/no" stress indications, research typically requires quantitative data. Translating a sensor's color change or electrical signal into a precise concentration of a biomarker demands robust calibration curves. This process can be technically demanding, as it requires preparing standard solutions and establishing a linear relationship between signal intensity and analyte concentration [2] [30]. Maintaining calibration over time and across different sensor batches presents an additional operational challenge.
Data Interpretation and Contextualization: A sensor reading indicating "high stress" is of limited value without contextual data. Correlating sensor output with the specific type of stress (biotic vs. abiotic), its severity, and its potential impact on plant health requires integration with other data sources, such as environmental conditions (temperature, humidity) and plant phenotyping [47] [60]. Non-experts may struggle to build these integrative data models, risking misinterpretation of results.
Handling Multimodal Data Streams: Advanced research increasingly relies on combining data from multiple sensor types (e.g., proline, H₂O₂, and pH sensors deployed simultaneously) to gain a holistic view of plant status [60]. Fusing these multimodal, often asynchronous, data streams into a unified analytical framework is a complex task that typically requires programming skills and familiarity with data fusion algorithms, creating a significant barrier for researchers from wet-lab or biological backgrounds.
Solutions and Streamlined Workflows
To overcome these challenges, researchers can adopt a series of practical solutions and standardized workflows that simplify data acquisition, processing, and interpretation.
Integrated Hardware-Software Platforms
Utilizing integrated systems that pair specialized sensors with dedicated software can dramatically reduce the data processing burden. For example:
- Smartphone-Based Colorimetry: The proline sensor developed by Northeastern researchers can be quantified by scanning the sensor with a smartphone camera and using an associated app to analyze the RGB (Red, Green, Blue) values, converting color intensity into a quantitative proline concentration [2]. This bypasses the need for expensive spectrophotometers.
- Dedicated Reader Units: Electrochemical H₂O₂ patches and COF-based pH sensors can be designed to interface with simple, low-cost potentiostats or optical readers that automatically process the raw signal and output a calibrated measurement [8] [21]. These devices can perform onboard calibration and noise filtering.
Leveraging Machine Learning for Automated Analysis
Machine Learning (ML) models are exceptionally powerful for managing complex sensor data, offering solutions that are both robust and accessible.
- Stress Classification: As demonstrated with NIR-II fluorescent nanosensors, a trained ML model can automatically classify the type of stress (e.g., drought, pathogen, salinity) based on the sensor's signal pattern with high accuracy (>96%), eliminating the need for manual interpretation [30].
- Signal Denoising: ML algorithms can be trained to identify and filter out environmental noise from the true sensor signal, improving reliability in non-laboratory settings [53] [60].
- Cloud-Based Analysis Platforms: Non-experts can submit their sensor data to cloud-based analysis services where pre-trained models process the data and return annotated results. This model is successfully employed by platforms like Plantix, which provides disease diagnoses from user-uploaded plant images [60].
Standardized Experimental Protocols
Adherence to detailed, step-by-step protocols ensures consistency and data reliability, which is crucial for non-expert users. Key methodologies for prominent sensor types are outlined below.
Table 1: Experimental Protocol for Proline Color-Changing Sensors
| Step | Description | Critical Parameters | Data Output |
|---|---|---|---|
| 1. Sample Preparation | Clip a small leaf section (e.g., 1 cm²) and grind it in 1 mL of 70% ethanol. | Consistent leaf mass and grinding thoroughness. | Homogenized leaf extract. |
| 2. Proline Extraction | Centrifuge the homogenate and collect the supernatant. | Centrifugation speed and time (e.g., 10,000 rpm for 5 min). | Clarified liquid containing proline. |
| 3. Sensor Incubation | Dip the sinapaldehyde-embedded paper sensor into the supernatant for 15 minutes. | Precise incubation time and temperature. | Sensor with developed color. |
| 4. Data Acquisition | Capture a digital image of the sensor under standardized lighting. | Use a consistent background and lighting box. | RGB image file (e.g., JPG, PNG). |
| 5. Quantification | Analyze the image using a smartphone app or image analysis software (e.g., ImageJ) to measure Red channel intensity. | Include a calibration strip with known proline concentrations in the image. | Proline concentration in arbitrary units or µg/mL. |
Table 2: Experimental Protocol for H₂O₂ Wearable Patch Sensors
| Step | Description | Critical Parameters | Data Output |
|---|---|---|---|
| 1. Sensor Attachment | Affix the microneedle-based patch to the underside of a live plant leaf. | Ensure good contact between microneedles and leaf tissue. | Sensor attached to plant. |
| 2. Signal Measurement | Connect the patch to a portable potentiostat and apply a small voltage. Measure the resulting electrical current. | Stable voltage setting; measurement duration (~1 minute). | Electrical current in microamperes (µA). |
| 3. Data Acquisition | Record the stable current reading from the potentiostat. | Perform multiple measurements over time for kinetics. | Time-stamped current value. |
| 4. Quantification | Convert the current value to H₂O₂ concentration using a pre-loaded calibration curve (Current = k · [H₂O₂]). | Regularly recalibrate the sensor using standard solutions. | H₂O₂ concentration in µM. |
Data Fusion Frameworks
For studies employing multiple sensors, a simplified data fusion framework is essential. This can be achieved by:
- Common Timestamping: Ensuring all sensors log data with synchronized timestamps.
- Unified Data Dashboard: Using platforms like MATLAB, R Shiny, or even customized Excel templates to visualize data from different sensors (e.g., proline, H₂O₂, pH) on a single timeline, making correlations visually apparent.
- Cross-Validation Prompts: The software can be designed to flag inconsistencies between sensors (e.g., high H₂O₂ but low proline), prompting the user to investigate potential experimental errors or complex physiological states.
Visualization of Data Workflows
Visual representations of the data processing pipeline can significantly enhance understanding and implementation for users of all expertise levels. The following diagrams map the logical flow from experiment to insight for two primary sensor categories.
Colorimetric Sensor Data Processing
The workflow for sensors that detect biomarkers like proline through color changes involves a structured path from physical measurement to quantitative data, with key decision points for data quality control.
Electrochemical & Optical Sensor Data Processing
Sensors that generate electrical or fluorescent signals, such as those for H₂O₂, require a workflow focused on signal processing and validation against ground-truth measurements.
The Scientist's Toolkit: Essential Research Reagents and Materials
Successful implementation of plant stress sensing technologies relies on a suite of specific reagents and materials. The following table details key components, their functions, and considerations for use.
Table 3: Research Reagent Solutions for Plant Stress Sensing
| Item | Function / Role | Specification & Notes |
|---|---|---|
| Sinapaldehyde-Embedded Paper | Reactive substrate for proline detection. Undergoes color change to red upon reaction [2]. | Ensure freshness and dry storage. Pre-cut shapes standardize surface area. |
| Covalent Organic Framework (COF) Films | pH-sensitive chromic material integrated into silk fibroin microneedles. Changes color with xylem pH [21]. | Transparency allows for colorimetric reading. Requires stable attachment to microneedle base. |
| NIR-II Fluorophore (AIE1035) | Signal reporter for NIR-II fluorescent nanosensors. Emits light in the 1000-1700 nm range upon activation [30]. | Avoids autofluorescence interference. Requires specific NIR-II imaging equipment. |
| Polymetallic Oxomolybdates (POMs) | Fluorescence quencher in NIR-II nanosensors. Reacts with H₂O₂, leading to fluorescence "turn-on" [30]. | Mo/Cu-POM variant shows high sensitivity and selectivity for H₂O₂. |
| Chitosan-based Hydrogel | Coating for electrochemical H₂O₂ sensors. Contains enzymes that react with H₂O₂ to generate a measurable current [8]. | Biocompatible and facilitates electron transfer. Check enzyme activity for each batch. |
| Portable Potentiostat | Instrument for applying voltage and measuring current from electrochemical sensors [8]. | Essential for H₂O₂ patch sensors. Look for models with Bluetooth for mobile data logging. |
| NIR-II Imaging System | Microscope or macroscopic imager for capturing fluorescence signals from NIR-II nanosensors [30]. | Specialized and costly equipment. Core component for in vivo sensing with NIR-II probes. |
| Standard Solutions | For sensor calibration (e.g., known proline concentrations, H₂O₂ solutions, pH buffers) [2] [8]. | Critical for quantification. Prepare fresh daily and store appropriately. |
Color-changing sensors and related technologies for plant stress detection have moved beyond proof-of-concept into practical research tools. The primary barrier to their widespread adoption among non-expert users is no longer the sensor technology itself, but the complexity of the data processing pipeline. By implementing integrated hardware-software platforms, leveraging machine learning for automation and classification, adhering to standardized experimental protocols, and employing simplified data fusion frameworks, researchers can effectively overcome these challenges. The solutions outlined in this guide provide a roadmap for transforming raw, often noisy sensor outputs into reliable, interpretable, and actionable biological insights, thereby empowering a broader community of scientists to leverage these powerful tools in plant science and drug development research.
Benchmarking Performance: How Color-Changing Sensors Stack Up Against Established Methods
The early detection of plant stress is a critical component in safeguarding global food security. As climate change increases the frequency and intensity of both abiotic and biotic stressors, the development of rapid, accurate, and field-deployable diagnostic tools has become a paramount research focus [61] [62]. Within this context, a significant shift is occurring from traditional, lab-bound analytical methods toward novel sensing technologies that offer point-of-care capability. This technical guide provides a comparative analysis of two established gold-standard methods—Enzyme-Linked Immunosorbent Assay (ELISA) and Polymerase Chain Reaction (PCR)—against emerging colorimetric sensors, framing their operational principles, performance metrics, and applicability within the specific domain of plant stress detection research.
Technical Principles and Methodologies
Colorimetric Sensors
Colorimetric sensors are designed to transduce the presence of a target analyte into a visible color change, which can be quantified electronically or often assessed by the naked eye. In plant stress research, they are typically configured to detect specific biomarkers, including volatile organic compounds (VOCs), proteins, or DNA sequences associated with plant-pathogen interactions or abiotic stress responses [63] [64].
- Optoelectronic Noses for VOC Profiling: Plants release a specific bouquet of VOCs upon exposure to stressors such as pathogens, salinity, or nutrient deficiency [65] [63]. Optoelectronic noses leverage an array of chemo-responsive colorimetric dyes (e.g., metalloporphyrins, pH indicators like methyl red, and Reichardt's dye) drop-casted onto a porous substrate like filter paper. Upon exposure to plant volatiles, these dyes undergo distinct color changes, creating a unique fingerprint for each stressor [63]. As demonstrated in one study, such a sensor could detect abiotic stress in Marchantia polymorpha as early as one day after exposure to high salinity or nutrient starvation [63].
- Nucleic Acid-Based Colorimetric Assays: Techniques like Loop-Mediated Isothermal Amplification (LAMP) can be coupled with colorimetric detection. LAMP amplifies target DNA with high specificity under isothermal conditions (∼65 °C). The amplification reaction can be visualized through a color change, often using pH-sensitive dyes that shift color in response to the pyrophosphate byproduct generated during DNA polymerization [66] [67]. This eliminates the need for complex gel electrophoresis.
- Nanoparticle-Based Sensors: Functionalized gold nanoparticles (AuNPs) can serve as colorimetric reporters. Their aggregation or dispersion in the presence of a target analyte (e.g., a pathogen-specific DNA sequence or protein) causes a shift in their surface plasmon resonance, resulting in a visible color change from red to blue [67].
Traditional ELISA Tests
The Enzyme-Linked Immunosorbent Assay (ELISA) is a well-established plate-based immunoassay for detecting and quantifying proteins, including pathogen-specific antigens or stress-related plant proteins [66] [64].
- Protocol Workflow:
- Coating: A capture antibody specific to the target antigen is immobilized on a microtiter plate.
- Blocking: The plate is blocked with an inert protein (e.g., BSA) to prevent nonspecific binding.
- Sample Incubation: The plant sample extract is added. If present, the target antigen binds to the capture antibody.
- Detection Antibody Incubation: A second, enzyme-conjugated antibody (e.g., Horseradish Peroxidase - HRP) specific to a different epitope on the target antigen is added.
- Substrate Addition: A chromogenic substrate for the enzyme is added. The enzyme catalyzes a reaction that produces a colored product.
- Signal Measurement: The reaction is stopped, and the color intensity, proportional to the antigen concentration, is measured with a plate reader [66].
While highly specific, ELISA's application is limited to known pathogens for which specific antibodies are available, and it may lack the sensitivity for very early-stage detection [66] [64].
Traditional PCR Tests
Polymerase Chain Reaction (PCR) and its quantitative variant (qPCR) are DNA amplification techniques considered the gold standard for their sensitivity and specificity in detecting pathogen nucleic acids [66].
- Protocol Workflow:
- Nucleic Acid Extraction: DNA is extracted from plant tissue, often requiring lab-based kits and reagents to remove inhibitors [66].
- Amplification: The extracted DNA is mixed with sequence-specific primers, nucleotides (dNTPs), and a thermostable DNA polymerase (e.g., Taq polymerase) in a thermal cycler. The process involves:
- Denaturation: Heating to ∼95°C to separate DNA strands.
- Annealing: Cooling to ∼50-65°C to allow primers to bind to the target sequence.
- Extension: Heating to ∼72°C for the DNA polymerase to synthesize new strands.
- Detection:
- Endpoint PCR: The amplified product is visualized using gel electrophoresis.
- Real-time PCR (qPCR): The amplification is monitored in real-time using fluorescent dyes, allowing for quantification of the initial pathogen load [66].
Despite its power, conventional PCR requires sophisticated, expensive thermocycling equipment and is not suitable for field applications [66].
Comparative Performance Analysis
The table below summarizes the key technical and operational parameters of the three detection methodologies, highlighting their suitability for different aspects of plant stress research.
Table 1: Technical and Operational Comparison of Plant Stress Detection Methods
| Parameter | Colorimetric Sensors | Traditional ELISA | Traditional PCR/qPCR |
|---|---|---|---|
| Detection Principle | Chemical dye-VOC interaction; Color change from DNA amplification [63] [67] | Antigen-antibody binding with enzyme-mediated color development [66] | In vitro enzymatic amplification of target DNA [66] |
| Typical Targets | VOCs (e.g., 2-hexenal), specific DNA/RNA sequences [65] [63] | Pathogen-specific proteins (antigens) [66] | Pathogen-specific DNA/RNA sequences [66] |
| Sensitivity | Moderate to High (sub-ppm for VOCs) [63] | Moderate | Very High (can detect a few DNA copies) [66] |
| Specificity | Moderate (can be high with optimized dye arrays) [63] | High (antibody-dependent) | Very High (primer-dependent) [66] |
| Time-to-Result | Minutes to 1 hour [65] [63] | 4-6 hours [66] | 1.5 to 3 hours (excluding DNA extraction) [66] |
| Cost per Test | Very Low (~GBP 1 for paper-based sensors) [63] | Moderate | High (reagents and equipment) [66] |
| Equipment Needs | Minimal; potentially a smartphone or portable spectrometer [19] [63] | Plate washer and reader [66] | Thermal cycler (and qPCR detector) [66] |
| Point-of-Care / Field Use | Excellent (simple, portable, low-power) [63] | Poor (lab-bound) | Poor (lab-bound, requires stable power) [66] |
| Multiplexing Potential | High (via sensor arrays with multiple dyes) [63] | Low to Moderate | Moderate (with multiplex qPCR assays) [66] |
| Key Advantage | Rapid, low-cost, and field-deployable for early stress indication | High-throughput, quantitative for specific proteins | Gold standard for sensitivity and specific pathogen identification |
| Key Limitation | Can be less specific; may require pattern recognition for VOC mixtures | Requires high-quality antibodies; cannot detect unknown pathogens | Complex sample prep; not suitable for field use; risk of contamination |
Experimental Protocols for Plant Stress Detection
Protocol: Deploying a Paper-Based Optoelectronic Nose for Abiotic Stress
This protocol outlines the use of a low-cost, paper-based colorimetric sensor for detecting VOCs associated with plant abiotic stress [63].
Key Research Reagent Solutions:
- Porous Substrate: Filter paper (e.g., Amersham Protran), serving as a high-surface-area scaffold for dye deposition.
- Colorimetric Dyes: A cocktail of chemo-responsive dyes (e.g., 5 mM Methyl Red, Reichardt's dye, Ni(II) phthalocyanine-tetrasulfonate) dissolved in organic solvents like ethanol or acetone.
- Chemical Modifiers: Compounds like cyclodextrin or graphene quantum dots to enhance selectivity and sensitivity by forming inclusion complexes or providing optical activity.
- Reference Material: Pure analytical standards of target VOCs (e.g., 2-hexenal, acetic acid) for sensor calibration.
Methodology:
- Sensor Fabrication: Cut filter paper into discs. Use a drop-casting method to deposit the different dye solutions into defined sections on the paper, creating an array. Allow the solvents to evaporate completely.
- Experimental Setup: Place the potted plant (e.g., Marchantia polymorpha) and the sensor array in a sealed container to allow VOC accumulation. A control plant under optimal conditions should be run in parallel.
- Exposure and Data Acquisition: Expose the sensor to the plant's headspace for approximately 1 hour. Subsequently, capture an image of the sensor array using a smartphone or a custom-built, low-cost spectrometer.
- Data Analysis: Use image analysis software (e.g., ImageJ) or a machine learning algorithm (e.g., Support Vector Machine) to convert the RGB values of each dye spot into a digital fingerprint. Compare the fingerprint from stressed plants to that of control plants to classify the stress type [19] [63].
Protocol: Colorimetric LAMP for Plant Pathogen Detection
This protocol describes the use of a colorimetric LAMP assay for detecting specific plant pathogen DNA, suitable for point-of-care testing [66] [67].
Key Research Reagent Solutions:
- LAMP Master Mix: Contains a strand-displacing DNA polymerase (e.g., Bst polymerase), dNTPs, and a colorimetric dye like phenol red.
- Primer Set: A set of four to six specially designed primers that recognize distinct regions of the target DNA for high specificity.
- Sample Preparation Kit: A rapid, field-deployable DNA extraction kit, such as a lateral flow dipstick or Solid Phase Reversible Immobilization (SPRI) magnetic bead-based system [66].
Methodology:
- Sample Preparation: Macerate a small leaf disk (∼6 mm diameter) from the test plant in an extraction buffer. Purify the DNA using the SPRI method, which involves binding DNA to magnetic beads, washing, and eluting in a small volume.
- Reaction Setup: Prepare the LAMP reaction by mixing the extracted DNA template with the LAMP master mix and primer set in a single tube.
- Amplification: Incubate the reaction tube at a constant temperature of 60-65 °C for 15-60 minutes. A heating block or water bath suffices; no thermal cycler is needed.
- Result Interpretation: Observe the color change. A positive amplification, which produces hydrogen ions as a byproduct, will cause phenol red to shift from pinkish-red to yellow. A negative reaction will retain the original color [66] [67].
The following diagram illustrates the logical workflow and decision points in selecting an appropriate detection method based on research objectives.
The Scientist's Toolkit: Essential Research Reagents
The successful implementation of these detection technologies relies on a suite of specialized reagents. The following table details key materials and their functions in plant stress sensing experiments.
Table 2: Essential Research Reagents for Plant Stress Detection Experiments
| Reagent/Material | Function/Application | Example in Use |
|---|---|---|
| Chemo-responsive Dyes (e.g., Metalloporphyrins, Reichardt's dye, Methyl Red) | Core sensing element in optoelectronic noses; changes color upon interaction with specific volatile organic compounds (VOCs) [63]. | Detecting stress VOCs like 2-hexenal released during herbivory or pathogen attack [63]. |
| Gold Nanoparticles (AuNPs) | Colorimetric reporters; aggregation state changes color, indicating presence of target DNA or protein [67]. | Functionalized with probes to detect pathogen-specific DNA sequences in lateral flow assays. |
| Bst DNA Polymerase | Strand-displacing enzyme used in Loop-Mediated Isothermal Amplification (LAMP) for DNA amplification at constant temperature [66]. | Enabling rapid, field-deployable colorimetric detection of plant pathogen DNA without a thermal cycler. |
| Primers (PCR & LAMP) | Short, single-stranded DNA sequences that are complementary to the target pathogen DNA, enabling specific amplification. | LAMP uses 4-6 primers for high specificity in identifying a plant virus like Tomato brown rugose fruit virus [66]. |
| Capture and Detection Antibodies | Key components of ELISA; provide high specificity by binding to unique epitopes on a target protein antigen [66]. | Detecting the coat protein of a specific bacterium like Xanthomonas spp. in plant samples. |
| Magnetic SPRI Beads | Enable rapid, purification-free nucleic acid extraction by binding DNA in the presence of crowding agents like polyethylene glycol (PEG) [66]. | Preparing plant tissue DNA samples for LAMP or PCR directly in the field, minimizing sample preparation time. |
| Chromogenic Substrate (e.g., TMB for HRP) | Converted by an enzyme (e.g., Horseradish Peroxidase) into a colored product, enabling visual or spectrophotometric detection in ELISA [66]. | Generating a quantifiable color signal in an ELISA test for a fungal toxin. |
The comparative analysis reveals that colorimetric sensors, traditional ELISA, and PCR tests each occupy a distinct and valuable niche in plant stress research. PCR remains the undisputed gold standard for sensitivity and definitive pathogen identification in laboratory settings, while ELISA provides robust protein detection. However, the emergence of low-cost, rapid, and field-deployable colorimetric sensors represents a paradigm shift. These sensors, particularly in the form of optoelectronic noses and colorimetric LAMP assays, address the critical need for early warning systems in plant stress management. They empower researchers and farmers to move from reactive to proactive crop protection strategies. The future of plant stress detection lies not in the supremacy of a single method, but in the strategic selection and potential integration of these technologies based on the specific requirements of speed, sensitivity, specificity, and field applicability.
The escalating pressure on global food production systems, coupled with the increasing frequency of extreme weather events, has intensified the need for rapid and accurate plant stress monitoring [47] [68]. Traditional laboratory-based methods for detecting biotic and abiotic stresses, while precise, are often too slow and destructive for proactive intervention. This has catalyzed the development of novel, non-destructive sensor technologies capable of providing real-time, in-field diagnostics. Among the most promising advancements are color-changing sensors, which translate complex plant physiological responses into simple, visual outputs. This technical guide provides an in-depth comparison of the response times and sensitivity of these emerging sensors against established lab-based methods, framing the analysis within the broader thesis that color-changing sensors are revolutionizing plant stress research by enabling unprecedented speed and accessibility in detection.
The Paradigm Shift in Plant Stress Detection
Limitations of Traditional Laboratory Methods
Historically, assessing plant stress relied on destructive methods that required harvesting plant tissues for subsequent laboratory analysis. Common techniques included chlorophyll extraction, measurement of leaf water potential, and analysis of enzyme activities or hormone levels [47] [24]. While these methods provide valuable and precise data, they are inherently characterized by being:
- Labor-intensive and time-consuming, involving complex sample preparation and processing.
- Unsuitable for large-scale monitoring or real-time application due to their destructive nature.
- Slow to return results, often requiring days or weeks when samples are sent to external labs, costing hundreds to thousands of dollars [2]. These limitations create a critical diagnostic gap, often allowing stress conditions to progress to irreversible stages before results are available and interventions can be applied.
The Rise of Non-Destructive, Real-Time Sensors
In contrast, a new generation of non-destructive sensors leverages advances in materials science, nanotechnology, and optical engineering to monitor plant health directly and continuously without harming the plant [47] [19]. A key innovation in this domain is the development of color-changing sensors. These devices are designed to detect specific biomarkers associated with plant stress and produce an immediate, visually interpretable signal. Their operational thesis is based on transducing invisible biochemical changes—such as fluctuations in pH, the accumulation of stress metabolites like proline, or the presence of signaling molecules like hydrogen peroxide (H₂O₂)—into a visible color change [2] [30] [10]. This fundamental shift enables pre-symptomatic detection and facilitates timely management decisions.
Quantitative Comparison: Sensor Speed vs. Lab Methods
The following table summarizes the performance characteristics of various detection methodologies, highlighting the stark contrast in response times.
Table 1: Response Time and Sensitivity Comparison of Plant Stress Detection Methods
| Method Category | Specific Technology / Assay | Target / Biomarker | Typical Response Time | Key Advantages & Limitations |
|---|---|---|---|---|
| Lab-Based (Destructive) | Chlorophyll/Phytohormone Analysis | Chlorophyll content, ABA | Several hours to days | High precision; Destructive, slow, lab-bound [47] [24] |
| PCR/ELISA | Pathogen DNA/Proteins | Several hours to days | High specificity and sensitivity; Requires skilled personnel, complex prep [19] | |
| Color-Changing Sensors | Proline Colorimetric Sensor (Nesocodon-inspired) | Proline | ~15 minutes (incl. sample prep) | Low-cost, simple readout; Requires leaf clipping and extraction [2] |
| NIR-II Fluorescent Nanosensor | H₂O₂ | ~1 minute | Very high sensitivity (0.43 µM), species-independent; Requires specialized imaging [30] | |
| Other Non-Destructive Sensors | COF-Silk Microneedle pH Sensor | Xylem pH | Real-time, continuous | Early drought warning (up to 48 hrs early); Microneedle integration required [10] |
| Acoustic Emissions Sensor | Cavitation events | Real-time, continuous | Very early indicator of drought stress; Data interpretation can be complex [69] |
Experimental Protocols for Key Sensor Technologies
Protocol: Colorimetric Proline Sensor
This protocol is based on the nesocodon flower-inspired sensor developed by Northeastern University researchers [2].
Objective: To qualitatively and quantitatively assess plant stress levels by detecting leaf proline concentration. Principle: The sensor leverages a reaction between the biomarker proline and sinapaldehyde, embedded in a paper-based sensor, to form a red pigment (nesocodin). The color intensity is dose-dependent on proline concentration.
Materials: - Research Reagent Solutions: Sinapaldehyde-embedded paper sensors, Ethanol (high purity, e.g., 95%), Microcentrifuge tubes, Pestle or homogenizer, Smartphone or flatbed scanner for quantification. Procedure: 1. Sample Collection: Clip a small piece (e.g., 1 cm²) of the leaf to be tested. 2. Homogenization: Place the leaf sample in a microcentrifuge tube and grind it into smaller pieces using a pestle. 3. Analyte Extraction: Add a sufficient volume of ethanol (e.g., 500 µL) to the tube to submerge the leaf material and draw out proline. Allow it to stand for a few minutes. 4. Sensor Incubation: Dip the sinapaldehyde-based sensor into the liquid extract. 5. Result Interpretation: Observe the color change within minutes. - Qualitative: A bright red color indicates high proline concentration and significant stress. Pale yellow indicates a healthy plant. Orange is an intermediate level. - Quantitative: Scan the sensor and use image analysis software to assign a numerical value (e.g., RGB intensity) to the color, which can be correlated to proline concentration via a standard curve.
Protocol: NIR-II Fluorescent Nanosensor for H₂O₂
This protocol details the use of a machine learning-powered, activatable nanosensor for in vivo detection of hydrogen peroxide [30].
Objective: To perform real-time, non-destructive imaging of H₂O₂ signaling molecules in living plants under stress. Principle: The nanosensor comprises an aggregation-induced emission (AIE) NIR-II fluorophore co-assembled with polymetallic oxomolybdates (POMs) as a quencher. Upon encountering H₂O₂, the POMs are oxidized, reducing their quenching effect and causing a "turn-on" of the NIR-II fluorescence signal.
Materials: - Research Reagent Solutions: AIE1035NPs@Mo/Cu-POM nanosensor suspension, Syringe for infiltration, NIR-II microscopy or macroscopic whole-plant imaging system, Software for machine learning analysis (e.g., Python with scikit-learn). Procedure: 1. Sensor Application: Infiltrate the nanosensor suspension into the leaf mesophyll or apply it to the plant surface, allowing it to be taken up into the apoplastic space. 2. Stress Induction: Subject the plant to a specific stressor (e.g., pathogen, drought, high salinity, mechanical damage). 3. Image Acquisition: Use an NIR-II imaging system to capture fluorescence signals from the plant at regular intervals post-stress induction. The system's sensitivity allows for tracking of trace H₂O₂ in the µM range. 4. Data Processing and Classification: Analyze the fluorescence intensity and spatiotemporal patterns. For stress classification, feed the fluorescence data into a pre-trained machine learning model (e.g., a convolutional neural network) to accurately differentiate between multiple stress types with high accuracy (>96%).
Signaling Pathways and Experimental Workflows
The following diagram illustrates the fundamental signaling pathways that color-changing sensors target and the corresponding experimental workflow for the NIR-II nanosensor.
Diagram 1: Stress Pathways and Sensor Workflow.
The Scientist's Toolkit: Essential Research Reagents
This table details key reagents and materials used in the featured sensor technologies, as derived from the experimental protocols.
Table 2: Key Research Reagent Solutions for Featured Sensors
| Reagent / Material | Function / Role | Application Example |
|---|---|---|
| Sinapaldehyde | Key chemical reactant that complexes with proline to form the colored nesocodin pigment. | Core component of the paper-based, colorimetric proline sensor [2]. |
| AIE1035NPs@Mo/Cu-POM Nanosensor | The core "turn-on" NIR-II fluorescent probe; AIE1035NPs provide stable fluorescence, Mo/Cu-POM acts as H₂O₂-responsive quencher. | Non-destructive, real-time imaging of H₂O₂ signaling in live plants for early stress detection [30]. |
| Covalent Organic Framework (COF) Films | Porous, crystalline polymers that exhibit tunable color changes (acid chromism) in response to pH changes. | Coated on silk fibroin microneedles for in-vivo sensing of xylem pH as an indicator of drought stress [10]. |
| Silk Fibroin (SF) Microneedles | A transparent, robust, and biocompatible platform for minimally invasive deployment of sensor films into plant tissues. | Serves as the support structure to deliver COF films into plant xylem for pH monitoring [10]. |
| NIR-II Imaging System | Specialized optical equipment capable of capturing fluorescence emission in the 1000–1700 nm range, minimizing autofluorescence. | Essential for reading out the signal from the NIR-II nanosensor, enabling high-contrast, deep-tissue imaging [30]. |
The quantitative data and experimental details presented in this guide unequivocally demonstrate that modern color-changing sensors and other non-destructive technologies offer a decisive advantage in speed over traditional lab-based methods. While laboratory assays remain the gold standard for specific, high-precision validation, their slow response time renders them ineffective for the rapid interventions required in modern agriculture and plant research. Sensors that detect stress-induced changes in proline, H₂O₂, or pH can provide results—from minutes to continuously in real-time—often days before physical symptoms manifest [2] [69] [10]. The integration of these sensors with machine learning further enhances their value by enabling precise stress classification [68] [30]. This paradigm shift towards rapid, in-field diagnostics, as exemplified by color-changing sensors, is fundamental to building more resilient and data-driven agricultural systems for the future.
The escalating impact of plant diseases, responsible for approximately 220 billion USD in annual agricultural losses worldwide, has intensified the demand for advanced, automated detection systems [60]. In this context, the emergence of color-changing biosensors represents a transformative innovation for detecting early biochemical distress signals such as proline and hydrogen peroxide [2] [8]. However, these point-based measurements achieve their full potential only when integrated with imaging technologies that provide spatial and contextual understanding. This technical guide examines the strategic synergy between RGB (Red, Green, Blue) and hyperspectral imaging (HSI) systems, framing them not as competing modalities but as complementary technologies that, when combined with novel sensor platforms, create a comprehensive plant health monitoring framework capable of detecting stress across temporal scales—from pre-visual physiological changes to overt symptomatic expression.
Individual Modalities: Capabilities and Technical Constraints
RGB Imaging: Accessible Symptom Documentation
Principles and Applications: RGB imaging captures reflected visible light in three broad spectral bands (approximately 400-700 nm), replicating human vision to document visible stress symptoms like discoloration, wilting, and necrosis [60] [70]. Its primary strength lies in detecting morphological manifestations of established stress, making it invaluable for disease identification after symptom onset.
Technical Limitations: RGB systems struggle with early stress detection as they cannot capture pre-visual physiological changes [60] [71]. Their effectiveness is significantly influenced by ambient lighting conditions, and they provide limited information on specific stress etiology due to the phenomenon of symptom overlap, where different stressors produce similar visual appearances [53] [60].
Table 1: Technical Specifications and Performance of RGB Imaging Systems
| Parameter | Specifications | Performance Metrics | Implementation Cost |
|---|---|---|---|
| Spectral Range | 400-700 nm (Visible) | 70-85% accuracy in field conditions [60] | $500-$2,000 [60] |
| Spatial Resolution | High (Dependent on sensor) | 95-99% lab accuracy [60] | - |
| Key Strengths | High spatial resolution, Cost-effective, Real-time processing | SWIN Transformer: 88% real-world accuracy [60] | - |
| Early Detection Capability | Limited to visible symptoms | CNN models: 53% real-world accuracy [60] | - |
Hyperspectral Imaging (HSI): Pre-Symptomatic Stress Identification
Principles and Applications: HSI captures contiguous narrow spectral bands (typically 5-10 nm bandwidth) across a broad range (250-15,000 nm), generating a detailed spectral signature for each pixel [60]. This enables detection of subtle biochemical composition changes, such as chlorophyll degradation and water content variation, often before visual symptoms manifest [60] [71].
Technical Limitations: HSI systems generate extremely high-dimensional data, complicating processing, storage, and analysis while increasing computational demands [71]. Their high cost creates economic barriers to widespread adoption, particularly for smaller farming operations [60].
Table 2: Technical Specifications and Performance of Hyperspectral Imaging Systems
| Parameter | Specifications | Performance Metrics | Implementation Cost |
|---|---|---|---|
| Spectral Range | 250-15,000 nm | High accuracy for pre-symptomatic detection [60] | $20,000-$50,000 [60] |
| Spectral Resolution | 5-10 nm (VNIR) | 90-98% classification accuracy [71] | - |
| Data Dimensionality | High (100+ bands) | - | - |
| Key Strengths | Pre-visual stress detection, Detailed biochemical information | SPA-PLS-DA models: 90-96% accuracy with optimized bands [71] | - |
The Synergistic Integration Framework
Multi-Modal Data Fusion Methodologies
The integration of RGB and HSI data creates a powerful diagnostic system where their complementary strengths overcome individual limitations. Successful fusion requires pixel-level registration across modalities, a technical challenge addressed through automated image registration pipelines [72].
Registration Workflow: The process involves affine transformation to align multi-domain images, accounting for translation, rotation, scaling, and shearing. Performance is optimized through:
- Reference image selection based on modality-specific characteristics
- Algorithm selection (Phase-Only Correlation, Feature-Based ORB, NCC-based approaches)
- Frame/wavelength optimization to enhance registration accuracy [72]
Experimental Validation: Implemented registration pipelines have demonstrated high overlap ratios: 98.0 ± 2.3% for RGB-to-chlorophyll fluorescence and 96.6 ± 4.2% for HSI-to-chlorophyll fluorescence in Arabidopsis thaliana test sets [72].
Diagram 1: Multi-Modal Imaging Fusion Workflow. This pipeline enables pixel-level registration and synergistic analysis of complementary data modalities.
Bridging to Biosensor Technology
Color-changing sensors provide ground-truth validation for spectral interpretations. For instance, sensors detecting hydrogen peroxide confirm oxidative stress responses hypothesized from specific spectral patterns [8] [73]. Proline-detecting sensors validate drought stress indicators identified through HSI, creating a closed-loop verification system where biochemical measurements authenticate imaging findings [2].
This integration enables temporal cross-validation across detection windows: biosensors provide immediate biochemical alerts, HSI systems identify developing physiological changes, and RGB imaging confirms visual manifestations. This multi-layered approach significantly enhances detection reliability while reducing false positives.
Experimental Protocols for Multi-Modal Stress Detection
Integrated System Setup and Calibration
Imaging Platform Configuration:
- Sensor Arrangement: Deploy co-registered RGB and HSI sensors on a stable platform with consistent illumination. The HSI system should operate in the VNIR range (400-1000 nm) with a spectral resolution of ≤10 nm [72] [71].
- Spatial Registration: Implement an automated registration pipeline using phase-only correlation or feature-based algorithms. Achieve target overlap ratios >95% between modalities through affine transformation with subpixel accuracy [72].
- Biosensor Integration: Apply wearable hydrogen peroxide patches to subset plants for real-time biochemical monitoring [8] [73]. Deploy proline test strips on selected leaves for periodic biochemical validation [2].
Calibration Protocol:
- Perform geometric calibration using checkerboard targets for all imaging sensors.
- Conduct radiometric calibration for HSI using standard reflectance panels.
- Establish baseline spectral signatures for healthy plants across growth stages.
Data Acquisition and Processing Workflow
Multi-Modal Data Collection:
- Acquire synchronized RGB and HSI data at regular intervals (e.g., daily) throughout plant growth cycles.
- For HSI data collection, capture whole-plant reflectance profiles under consistent illumination conditions, extracting >3,000 data points per cultivar from leaf ROIs [71].
- Record biosensor responses (color changes, electrical measurements) concurrently with imaging sessions.
Data Processing Pipeline:
- Preprocess HSI data using Standard Normal Variate (SNV) to remove scattering effects and baseline shifts [71].
- Extract morphological features (color, texture, geometry) from RGB images.
- Apply the Successive Projections Algorithm (SPA) to identify most informative wavelengths for stress classification, reducing HSI dimensionality while maintaining 90-96% accuracy [71].
- Fuse features across modalities using early (feature-level) or late (decision-level) fusion strategies.
Diagram 2: Temporal Cascade of Stress Detection Technologies. Different modalities detect stress signals across varying timescales, enabling progressively earlier intervention.
The Scientist's Toolkit: Research Reagent Solutions
Table 3: Essential Research Materials for Multi-Modal Plant Stress Detection
| Reagent/Technology | Function | Application Protocol |
|---|---|---|
| Sinapaldehyde-Embedded Paper Sensors | Proline detection via colorimetric change (yellow to red) [2] | Leaf tissue grinding with ethanol extraction; 15-minute dip assay [2] |
| Chitosan-Based Hydrogel Microneedle Patches | Hydrogen peroxide detection via electrochemical sensing [8] [73] | Attachment to leaf undersides; <1 minute measurement; reusable up to 9× [8] |
| Hyperspectral Imaging Systems (VNIR) | High-dimensional spectral data acquisition (500-1000 nm range) [72] [71] | Push-broom or snapshot imaging; radiometric calibration; SNV preprocessing [71] |
| Chlorophyll Fluorescence Imagers | Photosynthetic efficiency measurement [72] | Kinetic imaging; often used as registration bridge between RGB and HSI [72] |
| Standard Normal Variate (SNV) Algorithm | Spectral data normalization for scattering correction [71] | Applied to raw spectral data before model development [71] |
| Successive Projections Algorithm (SPA) | Wavelength selection for model optimization [71] | Identifies most informative bands; reduces dimensionality while maintaining >90% accuracy [71] |
Implementation Challenges and Strategic Considerations
Technical and Operational Barriers
Data Management Complexity: Multi-modal systems generate massive datasets, with HSI alone producing hundreds of bands per image. This necessitates sophisticated computational infrastructure for storage, processing, and analysis [60] [71].
Economic Constraints: The significant cost disparity between RGB ($500-$2,000) and HSI systems ($20,000-$50,000) creates adoption barriers, particularly for resource-limited settings [60]. Biosensors address this gap by providing affordable, specific detection for small-scale applications [2].
Model Generalization Limitations: Performance gaps between laboratory (95-99% accuracy) and field conditions (70-85% accuracy) remain substantial [60]. This emphasizes the need for robust algorithms resilient to environmental variability.
Strategic Implementation Framework
Deployment Scenarios:
- Large-Scale Agriculture: Prioritize HSI-RGB fusion on UAV platforms for early detection across extensive operations [60] [47].
- Smallholder and Research Applications: Employ biosensors with RGB imaging for cost-effective, specific detection [2].
- Breeding Programs: Implement full multi-modal systems for high-precision phenotyping and stress resilience evaluation [72].
Algorithm Selection Guidelines:
- Transformer-based architectures (SWIN) demonstrate superior robustness (88% accuracy) compared to traditional CNNs (53%) in real-world conditions [60].
- For RGB-only systems, fine-tuned EfficientNetB0 models achieve 97% accuracy for nitrogen stress classification [70].
- Multi-task learning structures enable simultaneous stress type and severity estimation through shared network architecture [53].
The integration of RGB imaging, hyperspectral sensing, and color-changing biosensors creates a powerful synergistic framework for comprehensive plant stress detection. This multi-modal approach enables monitoring across the full stress development continuum—from initial biochemical responses (detected by biosensors) through physiological changes (identified via HSI) to visual symptoms (documented by RGB). Each technology compensates for the limitations of the others: biosensors provide specific, early biochemical detection; HSI enables pre-visual physiological assessment; and RGB offers cost-effective morphological documentation.
Future research priorities should focus on developing standardized data fusion protocols, creating lightweight model architectures for field deployment, and establishing open-source benchmarking datasets that span multiple modalities. The integration of these complementary technologies represents a paradigm shift in plant stress detection, moving from single-mode observation to multi-dimensional assessment that promises to transform crop management, breeding programs, and global food security efforts in the face of escalating climate challenges.
Quantifying Economic and Operational Advantages for Small-Scale and Family Farms
The integration of advanced, low-cost sensor technologies is revolutionizing the management paradigms for small-scale and family farms. This whitepaper provides a technical examination of color-changing sensor technology, a cornerstone of modern plant stress research, and its quantifiable benefits in agricultural operations. Framed within a broader thesis on plant stress detection mechanisms, this guide details the underlying principles of colorimetric sensors, presents validated experimental protocols for their application, and synthesizes empirical data on their economic and operational impacts. Designed for researchers and technical professionals, the document establishes that these accessible technologies can significantly enhance productivity, optimize resource allocation, and improve farm sustainability, thereby strengthening global food security.
The early and accurate detection of plant stress is a critical challenge in agricultural science. Within the context of a broader thesis on plant stress detection, color-changing sensors represent a significant advancement in point-of-care diagnostic tools for farming. These sensors operate on principles of chemical colorimetry, providing a visual or optoelectronic signal in response to specific plant biomarkers [2]. Unlike complex electronic noses or hyperspectral imaging systems that require significant capital investment and technical expertise, these sensors offer a low-cost, accessible alternative ideally suited for the resource constraints typical of small-scale and family farms [27].
The foundational mechanism involves a chemical reaction between a sensor-embedded reagent and a target biomarker. A prominent example, developed by Northeastern University researchers, leverages a reaction inspired by the Nesocodon flower. This sensor uses sinapaldehyde, which reacts with the universal plant stress biomarker proline to form nesocodin, a red pigment [2]. The intensity of the color change—from pale yellow to bright red—correlates directly with proline concentration, providing a dose-dependent, quantitative measure of plant stress levels [2]. This allows for the rapid assessment of abiotic stressors such as water deficit, soil contamination, and excessive heat, enabling timely interventions that can salvage yields and preserve farm profitability.
Detailed Experimental Protocols for Sensor Application and Validation
To ensure reproducible and reliable results in both research and field settings, adherence to a standardized experimental protocol is essential. The following methodologies are cited from peer-reviewed studies on optical sensing and sensor validation.
Protocol for Proline Stress Detection Using Paper-Based Sensors
This protocol, adapted from research published in the American Chemical Society's Agricultural Science and Technology journal, details the process for detecting plant stress via proline-induced color change [2].
- Objective: To quantitatively determine the stress level in a plant by measuring the proline concentration in a leaf sample extract using a color-changing sensor.
- Materials Required:
- Paper-based sensors embedded with sinapaldehyde [2].
- Ethanol (e.g., 70-80% for extraction).
- Analytical balance.
- 1.5 mL or 2.0 mL microcentrifuge tubes.
- Pestle or mechanical homogenizer.
- Standard camera or flatbed scanner for digitization.
- Image analysis software (e.g., ImageJ with color analysis plugins).
- Step-by-Step Procedure:
- Sample Collection: Clip a small, standardized section (e.g., 100 mg) of a leaf from the test plant.
- Homogenization: Transfer the leaf sample to a microcentrifuge tube and add 1 mL of ethanol. Homogenize thoroughly using a pestle to release proline into the solution.
- Extraction: Allow the homogenate to incubate for 15 minutes at room temperature to complete the extraction process.
- Sensor Exposure: Dip the paper-based sensor into the supernatant of the leaf extract for a predetermined period (e.g., 1-2 seconds).
- Color Development: Allow the sensor to dry and develop color for a standardized time (e.g., 5-10 minutes).
- Data Acquisition: Capture a digital image of the sensor under controlled lighting conditions.
- Quantitative Analysis: Use image analysis software to measure the Red, Green, Blue (RGB) values, particularly the intensity of the red channel, which correlates with nesocodin formation. Compare these values against a standard curve generated with known proline concentrations.
The following workflow diagram illustrates this experimental process:
Protocol for Validation of Multi-Volatile Detection Using Optoelectronic Noses
For research involving the detection of multiple volatile organic compounds (VOCs), a protocol based on work from the University of Cambridge is applicable [27]. This approach is critical for validating sensors designed to profile complex gas mixtures released by plants under stress.
- Objective: To fabricate and validate a low-cost, paper-based optoelectronic nose for the detection and discrimination of plant stress volatiles.
- Materials Required:
- Porous filter paper (e.g., Whatman Grade 1).
- Chemo-responsive dyes (e.g., Methyl Red, Reichardt's dye, Ni-phthalocyanine).
- 3D-printed or custom-built spectrometer with an RGB LED ring.
- Data processing unit (e.g., Arduino, Wio Terminal).
- Step-by-Step Procedure:
- Sensor Fabrication: Drop-cast a matrix of different chemo-responsive dyes onto discrete spots on the filter paper. Allow the solvents to evaporate completely.
- Gas Exposure: Expose the fabricated sensor array to the headspace of a sealed chamber containing a stressed plant or a calibrated volatile standard (e.g., 2-hexenal) for a fixed duration (e.g., 1 hour).
- Pre- and Post-Image Capture: Use a low-cost spectrometer to capture images of the sensor array before and after exposure under consistent illumination.
- Color Change Analysis: Employ the onboard microcontroller to analyze the changes in color intensity (RGB) for each dye spot.
- Pattern Recognition: Use the unique combinatorial color fingerprint to identify the presence and concentration of specific volatiles, enabling the discrimination between different stress types (e.g., salinity vs. nutrient deficiency).
Quantitative Analysis of Economic and Operational Advantages
The adoption of sensor technologies translates into concrete economic and operational benefits for small-scale farms. The tables below synthesize quantitative data from recent studies and field implementations.
Table 1: Operational Advantages of Agricultural Sensor Technologies
| Technology | Key Metric | Impact on Small-Scale Farms | Validation / Source |
|---|---|---|---|
| Color-Changing Proline Sensor | Stress Assessment Time | Reduced from days/weeks to ~15 minutes in-field [2] | Laboratory and field tests on brassica crops [2] |
| IoT-Based Smart Irrigation | Water Usage Efficiency | Up to 35% reduction in water consumption [74] [75] | Analysis of connected farm networks and sensor data [74] |
| AI & UAVs (Precision Agriculture) | Fertilizer & Pesticide Use | 18-30% reduction via targeted application [74] [76] | Meta-analyses of precision agriculture studies [76] |
| Automation & Robotics | Labor Productivity | 35% savings in labor hours per hectare [74] | Field studies on automated tractors and robotic systems [74] |
Table 2: Economic Impact of Precision Agriculture Technologies
| Impact Category | Quantitative Benefit | Applicable Scale | Data Source |
|---|---|---|---|
| Crop Yield Increase | 10-30% improvement [76] [75] | Small to large-scale | Global meta-analyses of precision agriculture [76] |
| Input Cost Reduction | 40-60% reduction in fertilizer and pesticide waste [76] | All scales, highest benefit for resource-constrained farms | Precision agriculture case studies [76] |
| Cost of Sensor Technology | ~$1 per diagnostic paper sensor [27] | Small-scale / Family farms | University of Cambridge research [27] |
| Return on Investment (Robotics) | ROI within 2 years for robotic thinners [77] | Smallholder farms in India | Niqo Robotics field deployment data [77] |
The Scientist's Toolkit: Essential Research Reagents and Materials
For researchers aiming to develop or replicate color-changing sensor technologies, the following table details key reagents and their functions.
Table 3: Key Research Reagents for Colorimetric Plant Stress Sensors
| Reagent / Material | Function in Experiment | Technical Specification / Example |
|---|---|---|
| Sinapaldehyde | Core reagent that reacts with proline to form the red pigment nesocodin [2] | Embedded in paper-based sensors; concentration optimized for dose-dependent response [2] |
| Proline | Universal plant stress biomarker; the target analyte for the reaction [2] | Used for creating standard curves (e.g., 0-100 µM concentrations) for quantification [2] |
| Chemo-responsive Dyes | Create colorimetric fingerprint in response to multiple volatiles [27] | Methyl Red (pH indicator), Reichardt's Dye (polarity sensor), Metal Phthalocyanines (Lewis acid/base) [27] |
| Porous Filter Paper | Substrate for sensor fabrication; allows for gas/liquid wicking and dye immobilization [27] | Standard filter paper (e.g., Whatman); porosity affects dye dispersion and response time [27] |
| RGB Color Sensor | Digitizes analog color change into quantifiable RGB values [78] | Electronic sensor (e.g., TAOS TCS34725); measures reflected light frequency and intensity [78] |
The empirical evidence presented in this whitepaper unequivocally demonstrates that color-changing sensors and related low-cost technologies offer profound economic and operational advantages for small-scale and family farms. By enabling rapid, on-site diagnosis of plant stress, these tools facilitate preemptive management interventions that directly boost yields and resource efficiency while curtailing input costs. The detailed experimental protocols provide a roadmap for scientific validation and further innovation. As this field evolves, the continued development and democratization of such sensing technologies are imperative for building a more resilient, productive, and sustainable agricultural future, directly contributing to the core objectives of global food security.
The integration of advanced sensor technologies into plant science has created a paradigm shift from reactive to proactive agriculture. Within the broader thesis exploring how color-changing sensors detect plant stress, this technical guide addresses a critical component: the rigorous validation of these sensors' accuracy under controlled laboratory and real-world field conditions. The reliability of any plant stress detection technology ultimately depends on robust validation frameworks that establish its sensitivity, specificity, and practical utility across diverse environments. This document provides researchers and drug development professionals with a comprehensive overview of the accuracy metrics, experimental protocols, and key reagents essential for validating the next generation of plant stress detection sensors, with particular emphasis on color-changing and wearable technologies.
Sensor Technologies and Their Accuracy Profiles
Recent research has yielded multiple sensor paradigms for detecting early plant stress, each with distinct mechanisms and validation pathways. These technologies primarily detect universal stress biomarkers or physiological changes, providing a quantifiable signal that can be correlated with plant health status.
Color-Changing Proline Sensors: Inspired by the nesocodon flower, these sensors use a reaction between the biomarker proline and sinapaldehyde to produce a red pigment, nesocodin. The color intensity provides a qualitative and quantitative measure of stress levels [2]. Validation studies report this method reduces assessment time from days to minutes and cost from hundreds of dollars to a minimal expense, making it particularly suitable for small-scale farms and developing regions [2].
Wearable Hydrogen Peroxide Patches: These electrochemical sensors feature micro-needles that penetrate leaf surfaces to detect hydrogen peroxide (H₂O₂), a key distress signal. Research reports a rapid response time of under one minute and a cost of less than one dollar per test [8]. The patches demonstrated reusability for up to nine cycles before needle degradation and showed a direct correlation between electrical current output and H₂O₂ concentration in infected vs. healthy plants [8].
NIR-II Fluorescent Nanosensors: These species-independent nanosensors use near-infrared-II (NIR-II) fluorescence imaging to detect trace amounts of endogenous H₂O₂, avoiding interference from plant autofluorescence. A machine learning model integrated with this technology achieved exceptional accuracy, successfully differentiating between four stress types with 96.67% accuracy [30]. The sensor exhibited high sensitivity (0.43 μM) and a rapid response time of one minute [30].
Table 1: Comparative Accuracy Metrics of Featured Plant Stress Sensors
| Sensor Technology | Target Analyte | Reported Accuracy/Performance | Key Advantages | Limitations |
|---|---|---|---|---|
| Color-Changing Proline Sensor [2] | Proline | Qualitative (color change) and quantitative via scanning; 15-min processing | Low-cost, accessible, no complex instrumentation required | Destructive (requires leaf clipping); semi-quantitative |
| Wearable H₂O₂ Patch [8] | Hydrogen Peroxide | Quantitative electrical signal; reusable (9x); <1 min response | Real-time, in-situ monitoring, low cost per test | Limited reuse cycle; mechanical durability |
| NIR-II Fluorescent Nanosensor [30] | Hydrogen Peroxide | 96.67% classification accuracy for 4 stress types; 1 min response | Species-independent; avoids autofluorescence; ML-integrated | Complex synthesis; requires specialized imaging equipment |
| Lightweight DL Model (AgarwoodNet) [79] | Visual Symptoms (Biotic Stress) | Macro-average F1 Score: 0.9859; Kappa: 0.9859 | Lightweight (37 MB), suitable for low-memory devices | Requires visible symptom development |
Table 2: Validation Metrics Across Laboratory and Field Studies
| Validation Metric | Color-Changing Sensor [2] | Wearable H₂O₂ Patch [8] | NIR-II Nanosensor [30] | Acoustic & Stomatal Sensors [69] |
|---|---|---|---|---|
| Sensitivity | Dose-dependent color change | Current proportional to [H₂O₂] | 0.43 μM detection limit | Reacted within 24h of drought onset |
| Specificity | High for proline | High for H₂O₂; confirmed via lab assays | Specific response to H₂O₂; validated across species | Clear indicators for early drought stress |
| Laboratory Validation | Cabbage, kale, broccoli, brussel sprouts | Soybean, tobacco (healthy vs. infected) | Arabidopsis, lettuce, spinach, pepper, tobacco | Tomato plants in greenhouse |
| Field/Application Context | Small farms, developing world | Potential for real-time crop monitoring | Species-independent precision agriculture | Greenhouse environment |
| Key Performance Indicator | Cost & time reduction | Reusability & speed | Classification accuracy | Early detection before visible wilting |
Detailed Experimental Protocols for Validation
To ensure the reliability and reproducibility of sensor data, rigorous experimental protocols are essential. The following methodologies detail the validation procedures for the featured sensor technologies.
Objective: To validate that the colorimetric change in the sensor accurately reflects the proline concentration in plant tissues as a biomarker for stress.
Sample Preparation:
- A small piece of leaf (approx. 1 cm²) is clipped from the test plant (e.g., cabbage, kale).
- The leaf tissue is mechanically ground into fine pieces using a mortar and pestle or a homogenizer.
- Ethanol is added to the ground tissue to extract proline and other soluble compounds. The mixture is allowed to settle.
Sensor Assay:
- A paper-based sensor strip embedded with sinapaldehyde is immersed in the ethanolic extract.
- The sensor is incubated for a period of up to 15 minutes to allow the proline-sinapaldehyde reaction to proceed.
Data Acquisition and Analysis:
- Qualitative Assessment: The color change is visually inspected. A pale yellow indicates low proline (healthy), while bright red indicates high proline (stressed).
- Quantitative Assessment: The sensor strip is scanned using a flatbed scanner or digital camera under controlled lighting. The resulting image is analyzed using image analysis software (e.g., ImageJ) to measure the intensity of the red channel or calculate RGB values, which are correlated with proline concentration using a pre-established calibration curve.
Objective: To confirm that the electrochemical signal from the wearable patch corresponds to hydrogen peroxide levels in living plant leaves during pathogen attack.
Sensor Calibration:
- Prior to plant application, the patch sensor is calibrated using solutions with known concentrations of H₂O₂ to establish a standard curve of electrical current versus concentration.
Plant Infection and Sensor Deployment:
- Test plants (soybean, tobacco) are inoculated with the bacterial pathogen Pseudomonas syringae pv. tomato DC3000. Control plants are kept healthy.
- The flexible patch, with its array of micro-needles coated with a chitosan-based hydrogel containing H₂O₂-sensitive enzyme and reduced graphene oxide, is affixed to the underside of leaves on both infected and healthy plants.
Real-Time Monitoring and Validation:
- The patch is connected to a potentiostat or a simple multimeter to measure the electrical current generated.
- Measurements are taken at regular intervals (e.g., every minute). A significant increase in current from patches on infected plants versus controls is recorded.
- Correlative Validation: Concurrently, leaf disc samples are taken from adjacent areas on the same leaf and analyzed using conventional laboratory techniques (e.g., colorimetric assay) to independently quantify H₂O₂ levels. The results from the traditional method are compared with the sensor's output to confirm accuracy.
Signaling Pathways and Experimental Workflows
The following diagrams illustrate the core biochemical logic of color-changing sensors and the workflow for validating a wearable sensor, linking molecular mechanisms to experimental verification.
Diagram 1: Generalized Signaling Logic
Diagram 2: Validation Workflow
The Scientist's Toolkit: Essential Research Reagents and Materials
The development and validation of advanced plant stress sensors require a specialized toolkit. The table below details key reagents, materials, and their functions as derived from the cited research.
Table 3: Key Research Reagent Solutions for Sensor Development and Validation
| Reagent / Material | Function / Description | Experimental Role |
|---|---|---|
| Sinapaldehyde [2] | A small molecule that reacts with proline to form a red pigment (nesocodin). | Core reactive component in color-changing proline sensors. |
| Chitosan-based Hydrogel [8] | A biopolymer matrix that can be functionalized with enzymes and conductive materials. | Used in wearable patches to house the enzymatic reaction and facilitate electron transfer. |
| Reduced Graphene Oxide [8] | A highly conductive form of carbon. | Serves as the electron conductor in electrochemical H₂O₂ patches, translating chemical signal to electrical current. |
| NIR-II AIE Fluorophore [30] | A fluorophore with Aggregation-Induced Emission properties in the second near-infrared window (1000-1700 nm). | Acts as the signal reporter in NIR-II nanosensors, providing high-contrast imaging by avoiding plant autofluorescence. |
| Polymetallic Oxomolybdates (POMs) [30] | Nanoclusters with oxygen vacancies that act as H₂O₂-selective fluorescence quenchers. | Core component of the activatable "turn-on" NIR-II nanosensor; its oxidation by H₂O₂ triggers fluorescence recovery. |
| Abscisic Acid (ABA) [80] | A key phytohormone involved in plant stress response. | Primary analyte for bacterial-based biosensors; used to validate sensor response to hormonal stress signals. |
| Genetically Engineered E. coli [80] | Bacteria engineered with ABA receptors (PYR1) that trigger bioluminescence upon ABA binding. | Functions as a living, self-replicating biosensor within plant tissues for detecting hormonal stress. |
The validation of plant stress sensors through rigorous accuracy metrics in both laboratory and field conditions is fundamental to their adoption in research and commercial agriculture. The technologies highlighted herein—from low-cost colorimetric strips to sophisticated NIR-II imaging systems—demonstrate a common trajectory toward higher sensitivity, specificity, and practical applicability. The integration of machine learning, as seen with the NIR-II nanosensor and lightweight models like AgarwoodNet, further enhances diagnostic precision by enabling stress classification and prediction. Future advancements will likely focus on improving sensor durability, reducing costs, and enhancing the seamless integration of these technologies into decision-support systems for precision agriculture, ultimately fulfilling the promise of detecting and mitigating plant stress at its earliest, most reversible stages.
Conclusion
Color-changing sensors represent a paradigm shift in plant health monitoring, moving from reactive observation to proactive, molecular-level detection. By leveraging universal stress biomarkers like proline and hydrogen peroxide, these technologies offer a direct, rapid, and often low-cost window into plant physiology. The convergence of materials science (with paper-based assays, nanomaterials, and hydrogels) and data analytics (through machine learning) is pushing the boundaries of sensitivity, specificity, and field robustness. While challenges in environmental stability and widespread adoption remain, the trajectory points toward integrated, multimodal systems. Future research should focus on developing fully biodegradable sensors, expanding the library of detectable biomarkers, and creating seamless interfaces with precision agriculture platforms. For the global agricultural community, the successful translation of these tools from lab prototypes to field-ready solutions holds the key to enhancing crop resilience, optimizing resource use, and securing food production in the face of climate change and growing populations.
References
- 1. Plant biomarkers as early detection tools in stress ... [https://pmc.ncbi.nlm.nih.gov/articles/PMC10838863/]
- 2. These Color-Changing Sensors Could Revolutionize Agriculture [https://news.northeastern.edu/2025/08/01/color-changing-sensors-northeastern-research/]
- 3. Proline Mechanisms of Stress Survival - PMC [https://pmc.ncbi.nlm.nih.gov/articles/PMC3763223/]
- 4. Evaluation of the molecular mechanism underlying proline ... [https://bmcplantbiol.biomedcentral.com/articles/10.1186/s12870-025-06262-x]
- 5. Effect of hydrogen peroxide on growth and activity of some ... [https://www.sciencedirect.com/science/article/pii/S0304423813004901]
- 6. Hydrogen Peroxide Signaling in Plant Development and ... [https://www.frontiersin.org/journals/plant-science/articles/10.3389/fpls.2016.00230/full]
- 7. Proteomic and physiological assessment of stress sensitive ... [https://www.sciencedirect.com/science/article/abs/pii/S0308814619305060]
- 8. Plant patch can detect stress signals in real time [https://www.acs.org/pressroom/presspacs/2025/march/plant-patch-can-detect-stress-signals-in-real-time.html]
- 9. Advanced Colorimetric Sensors: Cutting-Edge Materials ... [https://www.intechopen.com/chapters/1203335]
- 10. A new method to detect dehydration in plants [https://news.mit.edu/2024/new-method-detect-dehydration-plants-1216]
- 11. Colorimetric Sensors for Chemical and Biological Sensing ... [https://pmc.ncbi.nlm.nih.gov/articles/PMC10007638/]
- 12. AI and Sensors for Plant Stress Detection [https://agri-food.ai/news/ai-and-sensors-for-plant-stress-detection/]
- 13. Frontiers | Current methods and future needs for visible and non-visible... [https://www.frontiersin.org/journals/plant-science/articles/10.3389/fpls.2025.1585413/full]
- 14. as early Plant tools in biomarkers management in... detection stress [https://pubmed.ncbi.nlm.nih.gov/38311674/]
- 15. Application of electrochemical methods for the detection ... [https://www.sciencedirect.com/science/article/abs/pii/S0956566321001421]
- 16. A novel dual-responsive colorimetric/fluorescent probe for ... [https://www.sciencedirect.com/science/article/abs/pii/S0304389424006848]
- 17. Visualization of Hg2+ Stress on Plant Health at the Subcellular ... [https://pmc.ncbi.nlm.nih.gov/articles/PMC11704093/]
- 18. Methods to optimize optical sensing of biotic plant stress ... [https://plantmethods.biomedcentral.com/articles/10.1186/s13007-024-01292-2]
- 19. Proximal Methods for Plant Stress Detection Using Optical ... [https://pmc.ncbi.nlm.nih.gov/articles/PMC7760370/]
- 20. Multi-Dimensional Optical Remote Sensing in Agriculture [https://www.sciencedirect.com/science/article/pii/S2772375525008147]
- 21. SMART researchers pioneer method to detect dehydration ... [https://www.eurekalert.org/news-releases/1065984]
- 22. Multi-omic analyses reveal the waterlogging induced ... [https://www.frontiersin.org/journals/plant-science/articles/10.3389/fpls.2025.1653464/full]
- 23. Mechanisms of plant acclimation to multiple abiotic stresses [https://www.nature.com/articles/s42003-025-08077-w]
- 24. A comprehensive review of crop stress detection: destructive ... [https://pmc.ncbi.nlm.nih.gov/articles/PMC12447170/]
- 25. Data-Driven Approach to Assessing Plant Stress Through ... [https://www.mdpi.com/1424-8220/25/10/3149]
- 26. Quantitative proteomic analysis of Arabidopsis thaliana with ... [https://bmcgenomics.biomedcentral.com/articles/10.1186/s12864-025-12041-7]
- 27. Paper-Based Multiplex Sensors for the Optical Detection of ... [https://www.mdpi.com/2072-666X/14/2/314]
- 28. Low-Cost Sensing and Classification for Early Stress ... [https://arxiv.org/html/2508.13379v1]
- 29. Highly sensitive enclosed multilayer paper-based ... [https://www.sciencedirect.com/science/article/abs/pii/S0003267020300891]
- 30. Machine learning-powered activatable NIR-II fluorescent ... [https://www.nature.com/articles/s41467-025-60182-w]
- 31. Advanced NIR-II Fluorescence Imaging Technology for ... [https://www.mdpi.com/2227-9040/12/6/113]
- 32. NIR-II AIEgens with Photodynamic Effect for Advanced ... [https://pmc.ncbi.nlm.nih.gov/articles/PMC9573674/]
- 33. Design, Synthesis of Hydrogen Peroxide Response AIE ... [https://pmc.ncbi.nlm.nih.gov/articles/PMC10891862/]
- 34. A novel AIE fluorescent probe for the detection and ... [https://www.sciencedirect.com/science/article/abs/pii/S0045206824004978]
- 35. Ratiometric fluorescent probe with AIE property for ... [https://www.nature.com/articles/s41598-017-07465-5]
- 36. New Electrochemical Sensor for the Early Detection of ... [https://www.azosensors.com/news.aspx?newsID=16325]
- 37. Plant patch can detect stress signals in real time [https://www.eurekalert.org/news-releases/1076912]
- 38. Microneedles: materials, fabrication, and biomedical ... [https://pmc.ncbi.nlm.nih.gov/articles/PMC10242236/]
- 39. A study on the fabrication of metal microneedle array ... [https://www.nature.com/articles/s41598-023-50472-y]
- 40. MLVI-CNN: a hyperspectral stress detection framework ... [https://pmc.ncbi.nlm.nih.gov/articles/PMC12484074/]
- 41. Hyperspectral imaging to characterize the vegetative tissue ... [https://www.frontiersin.org/journals/plant-science/articles/10.3389/fpls.2025.1515998/full]
- 42. Plant Stress Detection Using a Three-Dimensional Analysis ... [https://pmc.ncbi.nlm.nih.gov/articles/PMC11645006/]
- 43. Detecting plant physiological changes under stress using ... [https://www.sciencedirect.com/science/article/pii/S0034425725004894]
- 44. Visualization Techniques for Machine Learning [https://www.allpcb.com/allelectrohub/visualization-techniques-for-machine-learning]
- 45. Decoding early stress signaling waves in living plants ... [https://www.nature.com/articles/s41467-024-47082-1]
- 46. Visualized in-sensor computing [https://www.nature.com/articles/s41467-024-47630-9]
- 47. A comprehensive review of crop stress detection [https://www.frontiersin.org/journals/plant-science/articles/10.3389/fpls.2025.1638675/full]
- 48. Colorimetric sensing for translational applications [https://pmc.ncbi.nlm.nih.gov/articles/PMC11585252/]
- 49. Humidity /temperature/ pH multi-responsive fabric-based ... [https://www.sciencedirect.com/science/article/abs/pii/S0143720824001554]
- 50. Chameleon-Inspired Colorimetric Sensors for Real-Time ... [https://pmc.ncbi.nlm.nih.gov/articles/PMC10745728/]
- 51. Advances in mechanisms, designs, and applications of ... [https://www.sciencedirect.com/science/article/abs/pii/S0924224425001359]
- 52. Advanced Sensor Technology for Enhanced Plant Stress ... [https://www.azosensors.com/article.aspx?ArticleID=3042]
- 53. Deep learning for plant stress detection: A comprehensive ... [https://www.sciencedirect.com/science/article/pii/S0168169924011256]
- 54. Advancements in Imaging Sensors and AI for Plant Stress ... [https://pmc.ncbi.nlm.nih.gov/articles/PMC10905704/]
- 55. Bacterial network for precise plant stress detection and ... [https://bmcbioinformatics.biomedcentral.com/articles/10.1186/s12859-025-06082-8]
- 56. New imaging platform tracks plant stress in real time [https://www.eurekalert.org/news-releases/1098266]
- 57. Proximal Methods for Plant Stress Detection Using Optical ... [https://www.mdpi.com/2079-6374/10/12/193]
- 58. In vivo spectroscopy and machine learning for the early ... [https://www.nature.com/articles/s41598-023-42428-z]
- 59. Plant Stress Detection Market Research Report 2033 [https://marketintelo.com/report/plant-stress-detection-market]
- 60. Recent advances in plant disease detection: challenges and ... [https://plantmethods.biomedcentral.com/articles/10.1186/s13007-025-01450-0]
- 61. Past and Future of Plant Stress Detection: An Overview From ... [https://pmc.ncbi.nlm.nih.gov/articles/PMC7873487/]
- 62. Current methods and future needs for visible and non ... [https://pmc.ncbi.nlm.nih.gov/articles/PMC12515932/]
- 63. Paper-Based Multiplex Sensors for the Optical Detection of ... [https://pmc.ncbi.nlm.nih.gov/articles/PMC9968015/]
- 64. Sensing Methodologies in Agriculture for Monitoring Biotic ... [https://www.mdpi.com/2411-5134/6/2/29]
- 65. Real-time monitoring of plant stresses via chemiresistive ... [https://www.sciencedirect.com/science/article/pii/S2590238521002794]
- 66. Advanced DNA-Based Point-of-Care Diagnostic Methods ... [https://www.frontiersin.org/journals/plant-science/articles/10.3389/fpls.2017.02016/full]
- 67. Colorimetric biosensors for point-of-care virus detections [https://www.sciencedirect.com/science/article/pii/S2589299119301090]
- 68. A comprehensive review of AI-driven plant stress ... [https://www.sciencedirect.com/science/article/abs/pii/S2452414X25001542]
- 69. Comparison of multiple plant sensors aimed at early ... [https://www.sciencedirect.com/science/article/pii/S0378377425002495]
- 70. Comparative Analysis of Machine Learning Techniques ... [https://www.mdpi.com/2673-2688/5/3/62]
- 71. Detection of Abiotic Stress in Potato and Sweet ... [https://www.mdpi.com/2223-7747/14/19/3049]
- 72. Automated image registration of RGB, hyperspectral and ... [https://plantmethods.biomedcentral.com/articles/10.1186/s13007-024-01296-y]
- 73. Wearable Sensor Detects Plant Stress Before It's Visible [https://scitechdaily.com/wearable-sensor-detects-plant-stress-before-its-visible/]
- 74. How Technology Has Changed Farming: 2025 Advances [https://farmonaut.com/precision-farming/how-technology-has-changed-farming-2025-advances]
- 75. Revolutionizing agriculture: a review of smart farming ... [https://link.springer.com/article/10.1007/s42452-025-07561-6]
- 76. The role of modern agricultural technologies in improving ... [https://pmc.ncbi.nlm.nih.gov/articles/PMC12481170/]
- 77. Top 25 SMEs Driving AI-Driven Precision Agriculture in 2025 [https://www.omdena.com/blog/top-25-smes-driving-ai-driven-precision-agriculture-in-2025]
- 78. Designing, Optimizing, and Validating a Low-Cost, Multi- ... [https://www.mdpi.com/2077-0472/13/9/1824]
- 79. A lightweight deep learning model for multi-plant biotic ... [https://www.nature.com/articles/s41598-025-90487-1]
- 80. Bacterial network for precise plant stress detection and ... [https://pmc.ncbi.nlm.nih.gov/articles/PMC11863917/]