Beyond Angiosperms: Unveiling Unique NBS Domain Architectures and Evolutionary Innovation in Bryophyte Immune Receptors
This article provides a comprehensive comparison of Nucleotide-Binding Site (NBS) domain architectures between bryophytes, the most ancient land plants, and angiosperms.
Beyond Angiosperms: Unveiling Unique NBS Domain Architectures and Evolutionary Innovation in Bryophyte Immune Receptors
Abstract
This article provides a comprehensive comparison of Nucleotide-Binding Site (NBS) domain architectures between bryophytes, the most ancient land plants, and angiosperms. It explores the foundational discovery of bryophyte-specific NBS classes (PNL and HNL), contrasting them with the canonical TNL and CNL architectures of flowering plants. We detail methodological approaches for identifying these divergent genes and discuss the challenges in their functional annotation. By validating these architectural differences through recent pan-genomic studies, the article highlights bryophytes' unexpected genetic toolkit for pathogen defense. The synthesis offers new evolutionary perspectives on plant immunity, suggesting that early land plants explored a wider array of genetic solutions than their vascular descendants, with implications for understanding the fundamental principles of immune receptor evolution and function.
Deconstructing Plant Immunity: Foundational NBS Architectures from Ancient Bryophytes to Modern Angiosperms
Nucleotide-binding site leucine-rich repeat (NBS-LRR) genes constitute the largest family of plant disease resistance (R) genes, encoding intracellular immune receptors that detect pathogen effectors and activate effector-triggered immunity [1]. These proteins feature a characteristic tripartite domain architecture: a variable N-terminal domain, a central nucleotide-binding site (NBS) domain, and C-terminal leucine-rich repeats (LRRs) [2] [1]. The N-terminal domain determines the signaling pathway employed and classifies NBS-LRRs into distinct subfamilies: TIR-NBS-LRR (TNL) with a Toll/Interleukin-1 receptor domain, CC-NBS-LRR (CNL) with a coiled-coil domain, and RPW8-NBS-LRR (RNL) with a resistance to powdery mildew 8 domain [2] [3]. The NBS domain converts ADP to ATP upon pathogen recognition, activating downstream defense responses, while the LRR domain facilitates pathogen recognition and protein-protein interactions [1] [4]. Genomic analyses across diverse plant species reveal that NBS-LRR genes are not randomly distributed but are frequently organized in rapidly evolving clusters, resulting in dramatic variation in gene number and composition across species [2] [5].
Comparative Domain Architecture: Bryophytes vs. Angiosperms
Domain Composition and Novel Configurations
The comparison of NBS-LRR domain architectures between bryophytes and angiosperms reveals both conservation and striking innovation, highlighting the dynamic evolution of the plant immune system. Bryophytes, representing early diverging land plant lineages, possess not only the ancestral forms of known NBS-LRR classes but also novel domain configurations lost in later angiosperm lineages.
Table 1: Comparative NBS-LRR Domain Architectures in Land Plants
| Plant Group | Species Example | NBS-LRR Classes Identified | Key Domain Features | Significance |
|---|---|---|---|---|
| Bryophytes | Physcomitrella patens (moss) | TNL, CNL, PNL | Protein Kinase (PK) domain at N-terminus [6] | First reported PNL class; suggests early domain experimentation [6] |
| Marchantia polymorpha (liverwort) | CNL, HNL | α/β-hydrolase domain at N-terminus [6] | Novel HNL class; indicates independent diversification [6] | |
| Basal Angiosperms | Euryale ferox | TNL, CNL, RNL | Standard TNL, CNL, RNL domains [3] | All three major angiosperm classes present [3] |
| Monocots | Dendrobium officinale (orchid) | CNL, RNL | Absence of TNL; CC domain in CNL [7] | TNL loss characteristic of most monocots [8] [7] |
| Eudicots | Arabidopsis thaliana | TNL, CNL, RNL | Standard TNL, CNL, RNL domains [2] | Maintains ancestral eudicot NBS-LRR repertoire [2] |
The discovery of PNL (Protein Kinase-NBS-LRR) in moss and HNL (Hydrolase-NBS-LRR) in liverwort demonstrates that early land plants employed a wider array of N-terminal domain combinations than most extant angiosperms [6]. Phylogenetic analysis suggests the CNL class has a more divergent status from HNL, PNL, and TNL classes, which share a closer relationship [6]. In angiosperms, the domain architecture became somewhat stabilized, though significant lineage-specific changes occurred, most notably the loss of TNL genes in most monocots [8] [7]. This loss is potentially driven by deficiencies in the NRG1/SAG101 downstream signaling pathway [7].
Genomic Distribution and Evolutionary Patterns
The evolution of NBS-LRR genes is characterized by dynamic patterns of gene duplication and loss, driven by the constant evolutionary arms race with pathogens. These dynamics result in significant variation in gene number and genomic organization across plant lineages.
Table 2: Evolutionary Patterns of NBS-LRR Genes in Different Plant Families
| Plant Family | Example Species | Evolutionary Pattern | Implied Driver |
|---|---|---|---|
| Rosaceae | Rosa chinensis | "Continuous expansion" [2] | High selection pressure from diverse pathogens |
| Fragaria vesca | "Expansion, contraction, then further expansion" [2] | Fluctuating or shifting pathogen pressures | |
| Three Prunus species | "Early sharp expansion to abrupt shrinking" [2] | Possible adaptation followed by genome fractionation | |
| Orchidaceae | Dendrobium species | Significant gene degeneration [7] | Relaxed selection or host life history strategy |
| Fabaceae | Medicago truncatula, Soybean | "Consistently expanding" [2] | Strong diversifying selection for pathogen recognition |
| Poaceae | Rice, Maize, Brachypodium | "Contracting" pattern [2] | Possible specialization in CNL-based immunity |
These evolutionary patterns are influenced by multiple factors, including plant life history, effective population size, and co-evolutionary history with specific pathogen communities [2] [5]. The clustered arrangement of NBS-LRR genes in plant genomes facilitates the generation of variation through unequal crossing over and gene conversion, enabling a rapid response to evolving pathogen populations [5].
Research Methodologies and Experimental Protocols
Genome-Wide Identification and Classification
A standard pipeline for identifying and classifying NBS-LRR genes from plant genomes involves a combination of homology and domain-based search methods, followed by manual curation.
- Sequence Retrieval: Obtain the complete genome sequence and annotated protein sequences for the target species [2] [3].
- HMMER Search: Perform a Hidden Markov Model (HMM) search against the protein sequences using the profile of the NB-ARC domain (Pfam: PF00931). A typical threshold E-value is 1.0, with a more stringent follow-up scan (E-value ≤ 0.0001) to confirm true positives [2] [3].
- BLAST Search: Conduct a complementary BLASTp search using the sequence of the NB-ARC HMM profile or known NBS-LRR sequences as a query (E-value = 1.0) [2] [3].
- Data Merging and Redundancy Removal: Merge the hits from both methods and remove redundant sequences [2].
- Domain Verification and Classification: Submit the non-redundant candidate sequences to domain databases like Pfam (http://pfam.sanger.ac.uk/) or NCBI's Conserved Domain Database (CDD) (http://www.ncbi.nlm.nih.gov/Structure/cdd/) to verify the presence of N-terminal (CC, TIR, RPW8) and C-terminal (LRR) domains [2] [3]. Classification into TNL, CNL, or RNL subfamilies is based on the identity of the N-terminal domain.
- Structural and Motif Analysis: Use tools like MEME (Multiple Em for Motif Elicitation) to identify conserved motifs within the NBS domain and GSDS (Gene Structure Display Server) to analyze gene exon-intron structures [2].
Functional Characterization through Expression Analysis
Transcriptomic approaches are crucial for linking NBS-LRR genes to defense responses. A common protocol involves:
- Pathogen/Elicitor Treatment: Treat plant tissues with a pathogen of interest or a defense hormone, such as salicylic acid (SA), which is central to systemic acquired resistance. A control group is treated with a mock solution [7].
- RNA Extraction and Sequencing: Collect tissue samples at multiple time points post-treatment (e.g., 0, 6, 12, 24 hours). Extract total RNA and prepare cDNA libraries for RNA-seq sequencing [7] [4].
- Differential Expression Analysis: Map sequencing reads to the reference genome and quantify gene expression levels. Identify differentially expressed genes (DEGs) between treated and control samples using tools like DESeq2, with a defined threshold (e.g., \|log2 Fold Change\| > 1 and adjusted p-value < 0.05) [7].
- Candidate Gene Validation: Select NBS-LRR genes that are significantly up-regulated for further validation. Techniques like quantitative RT-PCR (qRT-PCR) can confirm expression patterns, and virus-induced gene silencing (VIGS) can be used to knock down candidate genes and test for loss of resistance [4].
NBS-LRR Gene Identification Workflow
Visualization of Evolutionary and Functional Relationships
The following diagram synthesizes the evolutionary relationships of NBS-LRR classes across plant lineages and their position in the plant immune signaling network.
NBS-LRR Evolution and Immune Function
Table 3: Key Reagents and Resources for NBS-LRR Research
| Reagent/Resource | Function in Research | Example Application |
|---|---|---|
| HMM Profile PF00931 | Core tool for identifying NBS domains in protein sequences via HMMER software [2] [3] | Genome-wide discovery of NBS-encoding genes |
| Pfam & CDD Databases | Online tools for verifying protein domains (CC, TIR, RPW8, LRR) to classify NBS-LRRs [2] | Distinguishing between TNL, CNL, and RNL subfamilies |
| Salicylic Acid (SA) | Defense hormone used as an elicitor to activate the NBS-LRR-mediated immune pathway in experiments [7] | Studying NBS-LRR gene expression and signaling in transcriptomics |
| Virus-Induced Gene Silencing (VIGS) | A technique to transiently knock down the expression of a candidate NBS-LRR gene [4] | Functional validation of NBS-LRR genes in plant-pathogen interactions |
| IWGSC RefSeq Genome | High-quality reference genome for wheat and related species [9] | Anchoring and identifying candidate NBS-LRR genes in complex genomes |
The comparative analysis of NBS-LRR genes across the plant kingdom reveals a sophisticated immune system shaped by continuous innovation, loss, and adaptation. Bryophytes display an ancestral diversity of domain combinations, including novel classes like PNL and HNL, which were largely lost in vascular plants. The subsequent evolutionary history in angiosperms is marked by lineage-specific trajectories, such as the complete loss of TNLs in most monocots, resulting in the distinct NBS-LRR repertoires observed today. The integration of genomic, transcriptomic, and functional methodologies provides a powerful framework for deciphering the role of these genes in plant immunity, offering critical insights for future crop improvement strategies.
Evolutionary Origin and Genomic Context
The Nucleotide-Binding Site Leucine-Rich Repeat (NLR) gene family constitutes the largest and most important class of plant disease resistance (R) genes, encoding intracellular receptors that initiate effector-triggered immunity (ETI) upon detecting pathogen-derived molecules [10] [11]. Angiosperm NLR genes are phylogenetically divided into three major subclasses distinguished by their N-terminal domains: TIR-NBS-LRR (TNL), CC-NBS-LRR (CNL), and RPW8-NBS-LRR (RNL) [10] [12]. The evolutionary history of these architectures reveals a complex pattern of conservation, expansion, and loss across plant lineages.
The NLR immune recognition system predates the emergence of land plants, with proteins of similar architecture found in green algae (Charophyta) and red algae (Rhodophyta) [11]. While the CNL and TNL subclasses emerged early and are present in green algae and bryophytes [12], the evolutionary trajectory diverged significantly between bryophytes and vascular plants. Genomic analyses reveal that bryophytes possess a substantially larger gene family space than vascular plants, including a higher number of unique and lineage-specific gene families [13]. This expanded genetic toolkit likely facilitated their adaptation to diverse ecological niches despite their simple morphological structure.
Table 1: Genomic Scale of NLR Diversity in Major Plant Groups
| Plant Group | Total Gene Families | Unique Gene Families | Core Gene Families | NLR Subclasses Present |
|---|---|---|---|---|
| Bryophytes | 637,597 | 532,840 | 6,233 | CNL, TNL, HNL (liverworts), PNL (mosses) |
| Vascular Plants | 373,581 | 324,552 | 6,647 | CNL, TNL, RNL |
| Angiosperms | Variable | Variable | ~6,647 | CNL, TNL, RNL (TNL absent in some lineages) |
Architectural Divergence: TNL vs. CNL Protein Structures
The fundamental distinction between TNL and CNL architectures lies in their N-terminal domains, which dictate both pathogen recognition specificity and downstream signaling pathways.
TNL (TIR-NBS-LRR) Architecture
- N-terminal Domain: Toll/Interleukin-1 Receptor-like (TIR) domain
- Central Domain: Nucleotide-Binding (NB-ARC) domain that undergoes conformational changes upon activation
- C-terminal Domain: Leucine-Rich Repeat (LRR) region responsible for pathogen recognition
- Signaling Dependence: Genetically depends on the EDS1-PAD4-SAG101 signaling complex and helper RNLs (NRG1, ADR1) [11]
- Enzymatic Activity: Recent evidence indicates TIR domains possess NADase activity that catalyzes NAD+ hydrolysis, activating EDS1 signaling [11]
CNL (CC-NBS-LRR) Architecture
- N-terminal Domain: Coiled-Coil (CC) domain
- Central Domain: Conserved NB-ARC domain
- C-terminal Domain: LRR recognition domain
- Signaling Dependence: Some CNLs signal via NDR1, while others require EDS1/PAD4 and helper RNLs [11]
- Calcium Signaling: Emerging evidence suggests some CNL and RNL proteins function as Ca2+-permeable channels that trigger immunity and cell death [12]
RNL (RPW8-NBS-LRR) Architecture
RNLs represent a distinct subclass characterized by an N-terminal RPW8 (Resistance to Powdery Mildew 8) domain. Unlike sensor TNLs and CNLs, RNLs primarily function as "helper" NLRs that assist downstream immune signal transduction for both TNLs and some CNLs [11] [12].
NLR Signaling Pathways in Angiosperm Immunity
Comparative Genomic Distribution Across Angiosperms
The distribution of TNL and CNL genes varies dramatically across angiosperm lineages, reflecting diverse evolutionary paths shaped by ecological adaptation and genomic history.
Table 2: NLR Distribution Across Representative Angiosperms
| Species | Total NLRs | TNLs | CNLs | RNLs | TNL Presence |
|---|---|---|---|---|---|
| Arabidopsis thaliana | 165 | 106 | 52 | 7 | Present |
| Medicago truncatula | 571 | Not specified | Not specified | Not specified | Present |
| Oryza sativa (rice) | 498 | 0 | 497 | 1 | Absent |
| Amborella trichopoda | 105 | 15 | 89 | 1 | Present |
| Thellungiella salsuginea | 88 | Not specified | Not specified | Not specified | Varies |
Large-scale analyses of over 300 angiosperm genomes reveal that NLR copy numbers differ up to 66-fold among closely related species due to rapid gene loss and gain events [14] [15]. Several key evolutionary patterns emerge:
Lineage-Specific TNL Losses
- Monocots: TNL genes are uniformly absent from grass genomes (Poaceae), despite their presence in basal angiosperms like Amborella trichopoda [10] [11]
- Eudicots: Multiple independent losses occurred in specific lineages including Ranunculales, Lamiales, and some magnoliids [12]
- Ecological Specialization: NLR reduction is associated with adaptations to aquatic, parasitic, and carnivorous lifestyles [14]
Differential Expansion Patterns
- Brassicaceae: "First expansion and then contraction" pattern with TNL predominance [10] [12]
- Fabaceae: Consistent expansion pattern with high total NLR counts [12]
- Poaceae: Contraction pattern with complete TNL absence [12]
- Magnoliids: Dramatic expansions of CNLs with multiple independent TNL losses [12]
Experimental Methodologies for NLR Characterization
Genome-Wide NLR Identification Protocol
The standard workflow for comprehensive NLR annotation involves:
Sequence Retrieval: Obtain whole genome sequences and annotation files from Phytozome, NCBI, or specialized databases like ANNA (Angiosperm NLR Atlas) [14] [15]
Domain Architecture Analysis:
- Scan proteomes using HMMER with Pfam domain models: TIR (PF01582), NB-ARC (PF00931), CC (PF05725), LRR (PF00560, PF07723, PF07725, PF12799, PF13306), RPW8 (PF05659)
- Apply gathering cutoffs to minimize false positives
- Validate domain organization and order
Phylogenetic Classification:
- Perform multiple sequence alignment using MAFFT or ClustalOmega
- Construct maximum-likelihood trees with RAxML or IQ-TREE
- Classify sequences into TNL, CNL, and RNL subclasses based on conserved N-terminal domains
Evolutionary Analysis:
- Estimate gene gains/losses using COUNT or CAFE software
- Identify tandem duplication events through genomic synteny analysis
- Detect positive selection using PAML or similar packages
NLR Identification and Analysis Workflow
Functional Validation Approaches
- Heterologous Expression: Transfer NLR genes between species to test functionality conservation (e.g., barley MLA CNL functional in Arabidopsis) [11]
- VIGS (Virus-Induced Gene Silencing): Knock down candidate NLRs to assess resistance impairment
- EMS Mutagenesis: Generate mutant populations to identify loss-of-resistance phenotypes
- Transcriptional Profiling: Measure NLR expression across tissues, developmental stages, and pathogen challenges
The Scientist's Toolkit: Essential Research Reagents
Table 3: Key Reagents for NLR Research
| Reagent/Catalog | Type | Application | Key Features |
|---|---|---|---|
| ANNA Database | Computational Resource | Angiosperm NLR Atlas | Contains curated NLR genes from 300+ angiosperm genomes [14] [15] |
| Pfam Domain Models | HMM Profiles | Domain Architecture Analysis | TIR (PF01582), NB-ARC (PF00931), LRR models for sequence annotation |
| pCAMIA vectors | Binary Vectors | Plant Transformation | Gateway-compatible vectors for NLR overexpression/silencing |
| EDS1/PAD4 Antibodies | Immunological Reagents | Protein Complex Detection | Detect EDS1-PAD4 interactions in TNL signaling |
| NLR Tilling Collections | Mutant Populations | Reverse Genetics | Identify NLR loss-of-function mutants |
| Pathogen Isolates | Biological Materials | Phenotypic Assays | Strain collections with known Avr genes for ETI activation |
Evolutionary Trajectory and Functional Diversification
The evolutionary history of NLR genes in angiosperms proceeded in two distinct stages. The first was a prolonged conservative stage from the origin of angiosperms until the Cretaceous-Paleogene (K-Pg) boundary (~66 Mya), during which NLR genes were maintained in relatively low numbers. The second was a drastic expansion stage after the K-Pg boundary that generated the extensive NLR diversity observed in contemporary angiosperm genomes [12]. This expansion coincided with dramatic environmental changes and an explosion in fungal diversity, suggesting convergent adaptive responses across multiple angiosperm families [10].
The differential retention of TNL and CNL architectures across angiosperm lineages reflects both shared and lineage-specific evolutionary pressures. The complete absence of TNLs in monocots and their independent loss in several eudicot lineages coincides with deletions in downstream signaling components, particularly the EDS1-PAD4-SAG101 module [11] [12]. This pattern suggests co-evolution between NLR subclasses and their signaling pathways, where loss of specific signaling components may drive subsequent NLR simplification.
Recent evidence has identified a conserved TNL lineage that may function independently of the canonical EDS1-SAG101-NRG1 module, revealing unexpected complexity in NLR signaling networks [14] [15]. This finding, coupled with the discovery of NLRs functioning as calcium-permeable channels [12], underscores that the standard canon of TNL and CNL architectures continues to evolve through ongoing research at the intersection of genomics, molecular biology, and evolutionary genetics.
The colonization of land by plants approximately 500 million years ago required the evolution of novel immune mechanisms to contend with terrestrial pathogens. Bryophytes (mosses, liverworts, and hornworts), as the sister lineage to all vascular plants (tracheophytes), provide an exceptional window into the early evolution of plant immunity [16] [17]. Recent genomic analyses reveal that despite their simple structure and lack of vascular tissue, bryophytes possess a remarkably diverse genetic toolkit for pathogen defense, including a larger total number of gene families than vascular plants (637,597 versus 373,581 gene families) [18] [16]. This review focuses specifically on comparing nucleotide-binding site (NBS) domain architectures—key components of intracellular immune receptors—between bryophytes and angiosperms, examining how these evolutionary pioneers employ both conserved and lineage-specific strategies for pathogen recognition and defense.
Comparative Genomic Analysis of NBS Domain Architectures
Diversity and Distribution of NBS Domain Genes
NBS domain genes encode one of the largest superfamilies of plant resistance (R) genes involved in pathogen recognition and defense activation. These genes typically contain nucleotide-binding and leucine-rich repeat (NLR) domains and function as major immune receptors for effector-triggered immunity in plants [19]. A recent comparative analysis of 12,820 NBS-domain-containing genes across 34 plant species revealed significant architectural diversity, with genes classified into 168 distinct classes encompassing both classical and species-specific structural patterns [19].
Table 1: Comparative Analysis of NBS Domain Genes in Land Plants
| Plant Group | Representative Species | NBS Gene Repertoire Size | Dominant Domain Architectures | Notable Features |
|---|---|---|---|---|
| Bryophytes | Physcomitrium patens | ~25 NLRs [19] | Limited classical NLR types | Minimal NLR expansion |
| Bryophytes | Selaginella moellendorffii | ~2 NLRs [19] | Simple NBS domains | Extremely compact NLR repertoire |
| Angiosperms | Gossypium hirsutum (cotton) | 1,201-2,012 NBS genes [19] | NBS, NBS-LRR, TIR-NBS, TIR-NBS-LRR | Extensive gene expansion |
| Angiosperms | Various (285 species) | ~90,000 NLR genes in angiosperm atlas [19] | Multiple complex architectures | Significant structural diversification |
The genomic data reveals a striking contrast in NBS gene repertoire size between bryophytes and angiosperms. While surveyed angiosperm genomes contain thousands of NBS encoding genes, bryophytes maintain dramatically smaller NLR repertoires—approximately 25 NLRs in Physcomitrium patens and only 2 in Selaginella moellendorffii [19]. This indicates that substantial gene expansion of NLR families occurred primarily in flowering plants after their divergence from bryophyte lineages.
Lineage-Specific Domain Architectures and Structural Innovation
Beyond differences in repertoire size, bryophytes and angiosperms exhibit distinct patterns in NBS domain architectures. Angiosperms display both classical architectures (NBS, NBS-LRR, TIR-NBS, TIR-NBS-LRR) and numerous species-specific structural patterns (TIR-NBS-TIR-Cupin1-Cupin1, TIR-NBS-Prenyltransf, Sugar_tr-NBS, etc.) [19]. Orthogroup analysis identified 603 orthogroups with some core (OG0, OG1, OG2) and unique (OG80, OG82) orthogroups with tandem duplications, with expression profiling showing putative upregulation of OG2, OG6, and OG15 in different tissues under various biotic and abiotic stresses [19].
Bryophytes, despite their smaller NLR repertoires, have evolved unique immune components that differ from those in flowering plants. Research on the liverwort Marchantia polymorpha has revealed that bryophytes possess novel classes of disease-resistance genes and insect-toxic proteins with potential applications in agriculture [18]. One highlighted example is a small protein containing an FB-lectin domain that caused up to 97.62% mortality in cotton bollworm larvae in laboratory assays [18]. These findings demonstrate that bryophytes employ distinct molecular solutions for pathogen defense that complement the extensive NLR diversification observed in angiosperms.
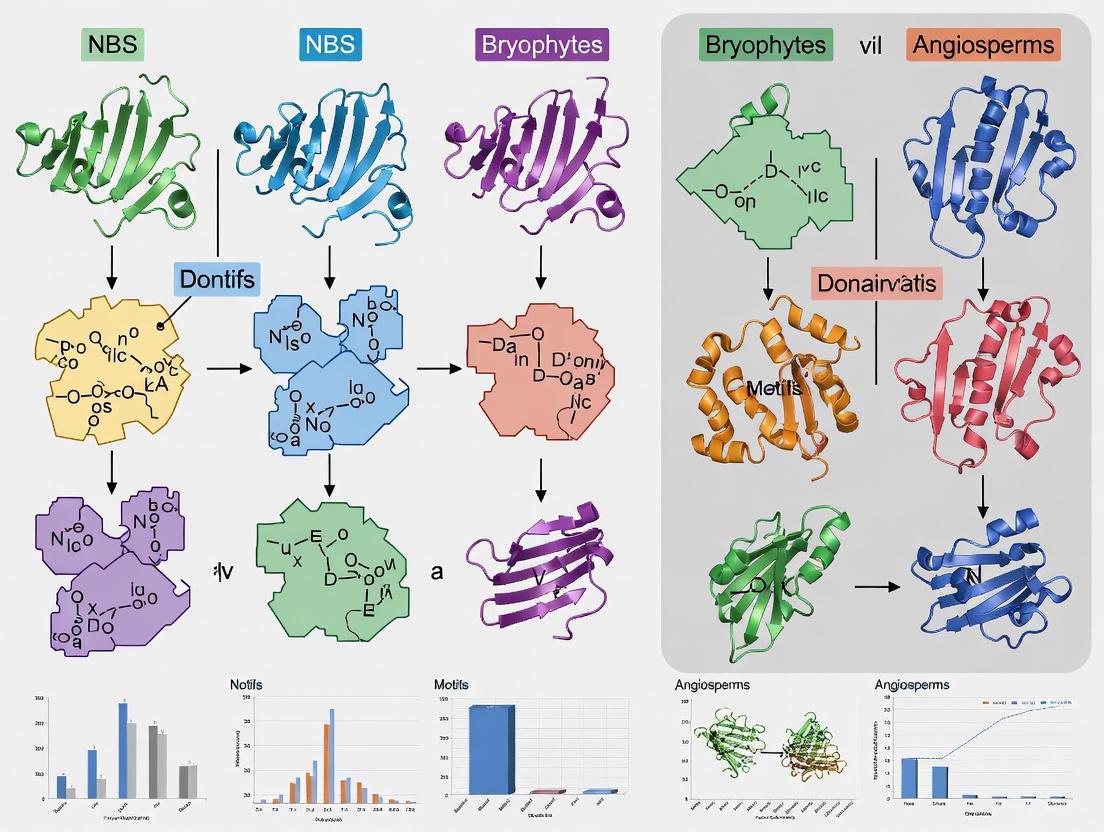
Diagram 1: Evolutionary divergence of NBS immunity in land plants. Bryophytes and vascular plants have developed distinct genetic strategies for pathogen defense following their divergence from a common ancestor.
Experimental Models and Methodologies for Bryophyte Immunity Research
Established Bryophyte Model Systems and Research Tools
Several bryophyte species have emerged as model systems for investigating early land plant immunity, each offering unique experimental advantages and genetic resources.
Table 2: Key Model Bryophytes for Immunity Research
| Model Species | Research Advantages | Key Immune Findings | Genetic Tools Available |
|---|---|---|---|
| Marchantia polymorpha (Liverwort) | Simple genetics, single SERK gene [20] | SERK-BIR module functions in development and bacterial defense [20] | Genome editing, transgenic lines |
| Physcomitrium patens (Moss) | Efficient homologous recombination, space survivability [21] | Novel immune receptors, extreme stress tolerance [21] | Knockout libraries, transcriptomic databases |
| Various bryophyte species | Pan-genome resource (138 genomes) [16] | Novel insect-toxic proteins, unique R genes [18] | Comparative genomics platform |
The establishment of the Bryogenomes.org portal with 138 genome assemblies and annotations has dramatically expanded resources for bryophyte immunity research, providing free global access to genomic data spanning 47 of the 55 recognized bryophyte orders [18] [16]. This comprehensive dataset enables researchers to explore plant evolution and discover new immune applications through comparative genomics.
Core Experimental Protocols in Bryophyte Immunity Research
Genomic Identification and Classification of NBS Genes
The standard methodology for identifying NBS-domain-containing genes involves using PfamScan.pl HMM search script with default e-value (1.1e-50) using background Pfam-A_hmm model [19]. All genes containing NB-ARC domains are considered NBS genes and filtered for further analysis. Additional associated decoy domains are observed through domain architecture analysis, with similar domain-architecture-bearing genes placed under the same classes according to established classification systems [19].
For evolutionary studies, OrthoFinder v2.5.1 package tools are employed, utilizing the DIAMOND tool for fast sequence similarity searches among NBS sequences [19]. Clustering of genes is performed using the MCL clustering algorithm, with orthologs and orthogrouping carried out with DendroBLAST [19]. Multiple sequence alignment is conducted using MAFFT 7.0, and gene-based phylogenetic trees are constructed by the maximum likelihood algorithm in FastTreeMP with 1000 bootstrap value [19].
Functional Validation Through Genetic Approaches
Virus-Induced Gene Silencing (VIGS) has been successfully employed to validate NBS gene function in bryophytes. For example, silencing of GaNBS (OG2) in resistant cotton demonstrated its putative role in virus tittering, providing a methodology applicable to bryophyte models [19]. Protein-ligand and protein-protein interaction studies have also been utilized to examine interactions between putative NBS proteins with ADP/ATP and different core proteins of viral pathogens [19].
Single-cell transcriptomic approaches have recently been adapted to bryophyte systems, with techniques like time-resolved single-cell multiomics and spatial transcriptomics used to identify novel immune cell states [22]. These methods enabled the discovery of PRimary IMmunE Responder (PRIMER) cells that emerge at immune hotspots and express specific transcription factors like GT-3a, likely serving as upstream alarms for alerting other cells to active immune responses [22].
Diagram 2: Experimental workflow for bryophyte immunity research. The standard pipeline progresses from gene identification to functional validation using complementary genomic and molecular approaches.
The Scientist's Toolkit: Essential Research Reagents and Solutions
Table 3: Key Research Reagent Solutions for Bryophyte Immunity Studies
| Reagent/Resource | Function/Application | Example Sources |
|---|---|---|
| Bryogenomes.org Portal | Centralized genomic data for 138 bryophyte species | [18] [16] |
| Pfam-A HMM Models | Identification of NBS domains using hidden Markov models | [19] |
| OrthoFinder Pipeline | Orthogroup inference and comparative genomics | [19] |
| VIGS (Virus-Induced Gene Silencing) Systems | Functional validation of NBS genes through targeted silencing | [19] |
| Single-Cell Multiomics Platforms | Identification of rare immune cell states (PRIMER cells) | [22] |
| Spatial Transcriptomics Tools | Mapping immune responses with tissue context | [22] |
| Horizontal Gene Transfer Detection Algorithms | Identifying microbial-derived genes in bryophyte genomes | [18] [16] |
Emerging Insights and Future Directions
The study of bryophyte immunity continues to yield unexpected discoveries with broad implications for understanding plant evolution. Recent research has revealed that bryophytes exhibit unprecedented levels of horizontal gene transfer, acquiring an average of 229 genes from microbes compared to 163 in vascular plants [18]. These horizontally transferred genes are often stress-responsive and may enhance ecological adaptability across diverse environments [18] [17]. Additionally, bryophyte disease-resistance genes have been shown to trigger immune responses in tobacco plants, revealing that bryophytes evolved unique plant immunity mechanisms over 500 million years that remain functional in distantly related species [18].
Future research directions include elucidating the complete signaling networks of bryophyte immune systems, particularly the interactions between PRIMER cells and bystander cells that appear important for transmitting immune responses throughout the plant [22]. There is also growing interest in harnessing bryophyte-derived resistance genes for crop improvement, with several bryophyte genes showing potent insecticidal or antimicrobial activity when transferred to flowering plants [18] [23]. As genomic resources continue to expand and gene editing technologies become more refined in bryophyte models, researchers are poised to uncover fundamental principles of plant immunity conserved across land plants, as well as lineage-specific innovations that have enabled the persistence of bryophytes in diverse environments for millions of years.
The nucleotide-binding site-leucine-rich repeat (NBS-LRR) gene family constitutes the largest and most crucial class of plant disease resistance (R) genes, encoding intracellular immune receptors that recognize pathogen effectors and trigger robust defense responses [24] [25]. For decades, research in angiosperms established a dichotomy between two principal NBS-LRR classes: those with Toll/Interleukin-1 receptor (TIR) domains (TNLs) and those with coiled-coil (CC) domains (CNLs) [26] [6]. This paradigm persisted until a groundbreaking investigation into bryophytes—the most ancient lineages of land plants comprising mosses, liverworts, and hornworts—unveiled a broader genetic arsenal for plant immunity. A seminal study focusing on the moss Physcomitrella patens and the liverwort Marchantia polymorpha discovered two entirely novel NBS classes: PK-NBS-LRR (PNL) and Hydrolase-NBS-LRR (HNL) [26] [27] [6]. This discovery not only reshapes our understanding of the plant immune system's evolution but also demonstrates that bryophytes, far from being evolutionarily primitive, harbor unique and sophisticated genetic toolkits for pathogen defense, including a "substantially greater diversity of gene families than vascular plants" [13] [16].
Comparative Analysis of NBS Domain Architectures Across Land Plants
Table 1: Comparative Overview of NBS-LRR Classes in Bryophytes and Angiosperms
| Feature | Bryophyte-Specific PNL Class | Bryophyte-Specific HNL Class | Angiosperm TNL Class | Angiosperm CNL Class |
|---|---|---|---|---|
| N-Terminal Domain | Protein Kinase (PK) | α/β-Hydrolase | Toll/Interleukin-1 Receptor (TIR) | Coiled-Coil (CC) |
| Representative Species | Physcomitrella patens (Moss) | Marchantia polymorpha (Liverwort) | Arabidopsis thaliana, Salvia miltiorrhiza | Arabidopsis thaliana, Oryza sativa, Capsicum annuum |
| Key Conserved NBS Motifs | P-loop, Kinase-2, GLPL, RNBS-D | P-loop, Kinase-2, GLPL, RNBS-D | P-loop, RNBS-A, Kinase-2, RNBS-B, RNBS-C, GLPL, RNBS-D, MHDV | P-loop, RNBS-A, Kinase-2, RNBS-B, RNBS-C, GLPL, RNBS-D, MHDV |
| Genomic Abundance | 45 genes (~69% of NBS genes in P. patens) [26] | 36 unique genes identified in M. polymorpha [6] | Varies widely (e.g., 2 in S. miltiorrhiza [24], 4 in C. annuum [28]) | Typically the most abundant (e.g., 61 in S. miltiorrhiza [24], 248 nTNLs in C. annuum [28]) |
| Phylogenetic Relationship | Closer to TNL and HNL | Closer to TNL and PNL | Closer to HNL and PNL | More divergent from HNL, PNL, and TNL [26] |
Table 2: Quantitative Distribution of NBS-LRR Genes in Selected Plant Species
| Plant Species | Total NBS Genes Identified | TNL Count | CNL Count | PNL Count | HNL Count | RNL/Other Count |
|---|---|---|---|---|---|---|
| Physcomitrella patens (Moss) [26] | 65 | 9 | 11 | 45 | 0 | - |
| Marchantia polymorpha (Liverwort) [6] | 43 | - | 7 | 0 | 36 | - |
| Salvia miltiorrhiza (Angiosperm) [24] | 196 | 2 | 61 | 0 | 0 | 1 |
| Capsicum annuum (Angiosperm) [28] | 252 | 4 | 48 (CC-containing) | 0 | 0 | 200 (Other nTNL) |
| Arabidopsis thaliana (Angiosperm) [24] | ~207 | ~100 | ~101 | 0 | 0 | ~6 |
The discovery of PNL and HNL genes was a direct result of investigating the evolutionary origin of plant immunity. Prior research had established that the integration of the NBS and LRR domains coincided with plants colonizing land [6]. To test this hypothesis, researchers turned to bryophytes, the sister group to all other extant land plants that diverged from vascular plants approximately 500 million years ago [13] [16]. The search for NBS-encoding genes in their genomes revealed not only the ancestral forms of TNL and CNL genes but also entirely new chimerical structures.
In the moss Physcomitrella patens, 65 NBS-encoding genes were identified. Among the 18 intact NBS-LRR genes, six possessed a previously unobserved N-terminal domain with homology to protein kinase, leading to their classification as the PNL class. When truncated genes with high sequence similarity to these six were included, the PNL class constituted 45 members, representing about two-thirds of all NBS-encoding genes in the moss genome [26] [6]. Concurrently, work on the liverwort Marchantia polymorpha yielded 43 non-redundant NBS-encoding genes. The majority (36 genes) did not belong to TNL, CNL, or PNL classes. Rapid amplification of cDNA ends (RACE) experiments identified their N-terminal domains as α/β-hydrolase folds, defining the novel HNL class [6].
Experimental Protocols for Novel NBS Gene Identification
Genome-Wide Identification and Domain Analysis
The foundational methodology for discovering novel NBS classes relies on comprehensive genome-wide surveys using a combination of bioinformatic tools and experimental validation.
- Bioinformatic Screening: The initial step involves searching whole-genome sequences using BLAST and Hidden Markov Model (HMM) profiles. HMM searches are typically performed using conserved domain models (e.g., PF00931 for the NBS domain) with a strict E-value cutoff (e.g., 1×10⁻⁵) [26] [29]. Candidate sequences containing the NB-ARC (NBS) domain are retained for further analysis.
- Domain Architecture Validation: The protein sequences of candidates are analyzed using domain databases such as Pfam and the NCBI Conserved Domain Database (CDD) to identify the presence and completeness of N-terminal (TIR, CC, RPW8, PK, Hydrolase) and C-terminal (LRR) domains [24] [29] [28]. This step is crucial for distinguishing typical, intact genes from truncated forms and for identifying novel N-terminal domains.
- Motif and Structural Analysis: Conserved motifs within the NBS domain (P-loop, RNBS-A, Kinase-2, RNBS-B, RNBS-C, GLPL, RNBS-D, MHDV) can be identified using tools like MEME. Novel classes like HNL may show lower sequence similarity in specific motifs (RNBS-A, -B, -C) while conserving others (P-loop, Kinase-2, GLPL) [26] [6].
- Intron Analysis: Examining the positions and phases of introns within the genes provides additional evidence for novelty. The HNL and PNL classes were confirmed to possess specific intron location and phase characteristics distinct from TNL and CNL classes [26] [6].
Experimental Isolation and Validation in Bryophytes
For non-model organisms or to confirm bioinformatic predictions, targeted experimental approaches are employed.
- PCR-Based Gene Isolation: Degenerate primers are designed based on the most conserved regions of the NBS domain (e.g., P-loop and GLPL motifs) to amplify NBS-homolog fragments from genomic DNA or cDNA. The resulting PCR products are cloned and sequenced to generate a dataset of unique NBS sequences [6].
- Rapid Amplification of cDNA Ends (RACE): To obtain full-length transcripts and identify unknown N-terminal and C-terminal domains, 5'- and 3'-RACE are performed. This technique was pivotal in identifying the α/β-hydrolase domain of the HNL class in Marchantia polymorpha [6].
- Phylogenetic Reconstruction: Full-length protein sequences or NBS domain sequences from the newly identified genes and reference genes from other species are aligned. Maximum Likelihood (ML) phylogenetic trees are constructed using tools like IQ-TREE with high bootstrap replicates (e.g., 1000) to elucidate evolutionary relationships and confirm the distinct clustering of novel classes [26] [29].
Experimental Workflow for Novel NBS Gene Identification
The Scientist's Toolkit: Key Research Reagents and Solutions
Table 3: Essential Research Reagents for NBS-LRR Gene Family Studies
| Reagent / Resource | Specific Example / Type | Critical Function in Research |
|---|---|---|
| Genomic/Transcriptomic Data | Physcomitrella patens v3.3; Marchantia polymorpha genome; 123 Bryophyte Genomes [13] | Provides the foundational sequence data for genome-wide identification and evolutionary analysis. |
| Conserved Domain Databases | Pfam (PF00931: NB-ARC); NCBI Conserved Domain Database (cd00204) | Validates the presence of NBS and other integrated domains (TIR, CC, Kinase, Hydrolase). |
| HMM Profiles & Software | HMMER v3.3.2; Custom HMM for NBS domain | Enables sensitive and specific identification of distantly related NBS domain members in proteomes. |
| Degenerate PCR Primers | Primers targeting P-loop & GLPL motifs [6] | Amplifies unknown or divergent NBS-encoding gene fragments from genomic DNA/cDNA. |
| RACE Kits | 5'- and 3'-RACE Systems | Determines the full-length cDNA sequence, revealing unknown N- and C-terminal domains. |
| Phylogenetic Software | IQ-TREE; Muscle v5 (alignment) | Reconstructs evolutionary relationships to classify genes and reveal novel lineages. |
| Motif Analysis Tools | MEME Suite; Multiple Em for Motif Elicitation | Identifies conserved sequence motifs within the NBS domain for structural comparison. |
Evolutionary and Functional Implications of PNL and HNL Discovery
The identification of PNL and HNL genes has profound implications for our understanding of plant immunity evolution. Phylogenetic analysis suggests a closer relationship between the HNL, PNL, and TNL classes, with the CNL class appearing more divergent [26] [6]. The presence of specific introns in these genes supports a possible origin via exon-shuffling during the rapid lineage separation of early land plants, a mechanism for creating novel chimerical genes with new functions [26] [6].
These discoveries also highlight the immense and untapped genetic diversity within bryophytes. Recent super-pangenome analysis of 123 bryophyte genomes confirms that they possess a "considerably larger cumulative number of nonredundant gene families compared to vascular plants," including a higher number of unique and lineage-specific gene families [13] [16]. This rich genetic toolkit, which includes novel immune receptors like PNL and HNL, likely contributes to their remarkable ecological success and adaptability across diverse and extreme habitats.
Evolution of NBS Classes in Land Plants
The groundbreaking discovery of PNL and HNL classes in bryophytes fundamentally rewrites the textbook understanding of the plant immune system's architecture. It demonstrates that the evolutionary history of NBS-LRR genes is far more complex and diverse than previously appreciated, with key innovations occurring in the earliest-diverging land plant lineages. The comparison between bryophytes and angiosperms reveals a dynamic evolutionary process: while vascular plants streamlined and expanded upon a core of TNL and CNL genes, often through tandem duplication as seen in crops like pepper [29] [28], bryophytes explored alternative genetic solutions, resulting in unique classes like PNL and HNL.
These findings open up exciting new avenues for research. The functional characterization of PNL and HNL proteins could reveal novel pathogen recognition and signaling mechanisms. Furthermore, the immense "gene family space" of bryophytes represents a vast, untapped reservoir of genetic diversity [13]. Exploring this biodiversity may lead to the discovery of even more novel resistance mechanisms. In the long term, these ancestral or alternative resistance genes could potentially be harnessed and transferred into crop plants through genetic engineering, providing new tools to bolster disease resistance and enhance global food security. The study of bryophytes, therefore, is not merely an academic pursuit of evolutionary history but a promising frontier for future crop improvement.
The nucleotide-binding site (NBS) domain serves as the central molecular switch in the largest class of plant disease resistance (R) genes, enabling plants to detect pathogens and activate immune responses [19] [30]. The diversification of domain architectures surrounding this conserved core represents a crucial evolutionary record of how different plant lineages have tailored their immune systems. While the NBS-LRR (Nucleotide-Binding Site Leucine-Rich Repeat) genes of angiosperms have been extensively characterized, comprehensive comparisons with early land plants like bryophytes reveal both deeply conserved structural motifs and striking lineage-specific innovations [26] [6]. This guide provides a systematic comparison of NBS domain architectures and motifs between bryophytes and angiosperms, synthesizing recent genomic findings to illuminate the evolutionary dynamics of plant immunity.
Comparative Analysis of NBS Domain Architectures
Major Architectural Classes Across Lineages
Table 1: Comparative Overview of NBS Domain Architectures in Bryophytes and Angiosperms
| Architectural Class | Domain Structure | Primary Lineage Distribution | Prevalence | Key Features |
|---|---|---|---|---|
| CNL | CC-NBS-LRR | Widespread in angiosperms and bryophytes | Dominant in angiosperms (e.g., 25/156 in N. benthamiana) [31] | Coiled-coil N-terminal domain; Common in vascular plants |
| TNL | TIR-NBS-LRR | Primarily angiosperms, limited in bryophytes | 3 in P. patens [26]; Often lost in monocots [32] | Toll/Interleukin-1 Receptor domain |
| PNL | PK-NBS-LRR | Mosses (e.g., Physcomitrella patens) | 6 intact + 39 truncated in P. patens [26] [6] | Protein Kinase N-terminal domain; Bryophyte-specific |
| HNL | Hydrolase-NBS-LRR | Liverworts (e.g., Marchantia polymorpha) | 36 genes in M. polymorpha [26] [6] | α/β-hydrolase N-terminal domain; Bryophyte-specific |
| RNL | RPW8-NBS-LRR | Limited distribution across lineages | 1 in S. miltiorrhiza [32] | RPW8 N-terminal domain; Involved in signal transduction |
| NL | NBS-LRR | Both bryophytes and angiosperms | 23 in N. benthamiana [31] | Lacks distinct N-terminal domain |
| N | NBS-only | Both bryophytes and angiosperms | 60 in N. benthamiana [31] | Truncated form; May regulate full-length genes |
The domain architecture analysis reveals fundamental differences in how bryophytes and angiosperms have constructed their NBS-based immune receptors. While angiosperms predominantly utilize CNL and TNL architectures, bryophytes exhibit unique configurations, particularly PNL (Protein Kinase-NBS-LRR) in mosses and HNL (Hydrolase-NBS-LRR) in liverworts [26] [6].
Bryophytes demonstrate remarkable architectural diversity despite their morphological simplicity. In Physcomitrella patens, 65 NBS-encoding genes were identified with only 18 possessing intact N-terminal, NBS, and LRR domains [6]. The PNL class represents approximately two-thirds (45 genes) of all NBS-encoding genes in this moss genome [26] [6], suggesting this innovation provides specific adaptive advantages in basal land plants.
Angiosperms show different patterns of architectural distribution, with significant variations between species. In Nicotiana benthamiana, from 156 NBS-LRR homologs, only 30 possess complete three-domain architectures (5 TNL, 25 CNL), while the majority (126) represent truncated forms (NL, TN, CN, N-type) [31]. This pattern of abundant truncated forms appears consistent across land plants, though the specific dominant architectures differ between lineages.
Genomic Distribution and Evolutionary Dynamics
The genomic organization of NBS-encoding genes differs substantially between bryophytes and angiosperms. Angiosperm NBS-LRR genes frequently organize in clusters driven by tandem duplications - in pepper (Capsicum annuum), 54% of 252 NBS-LRR genes form 47 gene clusters [30]. This clustering facilitates rapid evolution of novel recognition specificities through gene duplication and diversifying selection.
Recent pangenome analyses of 123 bryophyte species reveal they possess a substantially larger diversity of gene families than vascular plants (637,597 versus 373,581 nonredundant gene families) despite having smaller genomes with fewer total genes [16] [13]. This expanded gene family diversity includes unique immune receptors that likely contribute to bryophyte adaptation across diverse habitats [13].
Table 2: Conserved Motif Patterns in NBS Domains Across Plant Lineages
| Conserved Motif | Location in NBS | Conservation Level | Lineage-Specific Variations | Putative Function |
|---|---|---|---|---|
| P-loop | N-terminal | High across all lineages | Minimal variation in sequence | ATP/GTP binding |
| RNBS-A | Middle | Moderate with lineage-specific variation | Distinct in TNL vs. CNL/NL [30] | Structural stability |
| Kinase-2 | Middle | High across all lineages | Conserved "LIVLDDVW" motif [30] | ATP hydrolysis |
| RNBS-B | Middle | Moderate | Lower similarity in HNL class [6] | Unknown function |
| RNBS-C | Middle | Moderate | Lower similarity in HNL class [6] | Unknown function |
| GLPL | C-terminal | High across all lineages | Minimal variation in sequence | Structural role |
| RNBS-D | C-terminal | Moderate with lineage-specific variation | Distinct in TNL vs. CNL/NL [30] | Unknown function |
| MHDV | C-terminal | High across all lineages | Conserved "MHD" motif | Regulatory role |
Comparative analysis of conserved motifs within the NBS domain reveals both universal and lineage-specific patterns. The P-loop, Kinase-2, GLPL, and MHDV motifs show high conservation across bryophytes and angiosperms, reflecting their essential roles in nucleotide binding and hydrolysis [6] [30]. However, the RNBS-A, RNBS-B, and RNBS-C motifs display lower sequence similarity in the bryophyte-specific HNL class, suggesting potential functional divergence [6].
In angiosperms like pepper, motif patterns clearly distinguish between TNL and CNL/NL subfamilies, particularly in the RNBS-A and RNBS-D motifs [30]. The RNBS-A-TIR motif in TNL proteins contains "RWKKVLFILDDVNHRE," while CNL proteins feature "VLLEVIGCISNTND" or similar sequences at the equivalent position [30].
Experimental Protocols for NBS Gene Identification and Validation
Genomic Identification and Classification
Step 1: Sequence Identification
- HMMER Search: Use HMMER3 with Pfam NBS (NB-ARC: PF00931) model with expectation value (E-value) cutoff of 1.1e-50 [19] or 1*10⁻²⁰ [31] to identify candidate NBS-encoding genes from genome assemblies.
- Domain Verification: Validate putative genes through PfamScan, SMART, and Conserved Domain Database to confirm complete NBS domain presence [19] [31].
Step 2: Architectural Classification
- N-terminal Domain Prediction: Identify N-terminal domains using TMHMM2 for transmembrane regions, nCoil for coiled-coil domains, and Phobius for general domain architecture [33].
- LRR Detection: Scan for C-terminal LRR domains using Pfam LRR models (LRR1, LRR2, LRR_8) [30].
- Classification System: Categorize genes based on domain presence/absence into canonical classes (TNL, CNL, RNL) or lineage-specific classes (PNL, HNL) [26] [6].
Step 3: Motif Analysis
- Multiple Sequence Alignment: Use MAFFT 7.0 or Clustal W for aligning NBS domain sequences [19] [31].
- Conserved Motif Identification: Apply MEME suite with motif width set to 6-50 amino acids and default parameters to identify conserved motifs [31].
- Motif Validation: Verify biological significance through comparison with known motif databases and phylogenetic conservation patterns.
Functional Validation Approaches
Expression Profiling
- RNA-seq Analysis: Process RNA-seq data from various tissues and stress conditions to determine expression patterns [19]. Calculate FPKM values and categorize into tissue-specific, abiotic stress-specific, and biotic stress-specific expression profiles.
- Differential Expression: Identify putative resistance genes through upregulated expression in response to pathogen challenge. Studies in cotton have shown specific orthogroups (OG2, OG6, OG15) upregulated in tolerant accessions under cotton leaf curl disease pressure [19].
Functional Characterization
- Virus-Induced Gene Silencing (VIGS): Implement VIGS in resistant plants to validate gene function. Silencing of GaNBS (OG2) in resistant cotton demonstrated its role in reducing virus titers [19].
- Protein Interaction Studies: Conduct protein-ligand and protein-protein interaction assays to confirm mechanistic roles. Studies have shown strong interaction of putative NBS proteins with ADP/ATP and core proteins of the cotton leaf curl disease virus [19].
- Genetic Variation Analysis: Identify unique variants in tolerant versus susceptible accessions through whole-genome comparison. Between susceptible (Coker 312) and tolerant (Mac7) cotton accessions, 6,583 unique variants were identified in NBS genes of the tolerant line [19].
Table 3: Essential Research Reagents and Resources for NBS Gene Studies
| Category | Specific Tool/Reagent | Application | Key Features |
|---|---|---|---|
| Bioinformatics Tools | HMMER3 [31] [33] | Domain identification | Hidden Markov Model search for NBS domain |
| PfamScan [19] | Domain architecture analysis | Pfam domain annotation | |
| MEME Suite [31] | Motif discovery | Identifies conserved protein motifs | |
| OrthoFinder [19] | Evolutionary analysis | Orthogroup inference across species | |
| PRGminer [33] | R-gene prediction | Deep learning-based classification | |
| Experimental Resources | Virus-Induced Gene Silencing (VIGS) [19] [31] | Functional validation | Transient gene silencing in plants |
| 5'/3' RACE [6] | Full-length cDNA isolation | Rapid Amplification of cDNA Ends | |
| Phytozome [19] [33] | Genomic data source | Plant genome database | |
| CottonFGD [19] | Expression data | Cotton Functional Genomics Database | |
| Classification Databases | Pfam [31] | Domain reference | Curated protein family database |
| COILS [30] | Coiled-coil prediction | Detects coiled-coil domains | |
| PlantCARE [31] | cis-element analysis | Identifies regulatory elements |
This toolkit enables researchers to progress from genomic identification to functional characterization of NBS-encoding genes. The combination of bioinformatics tools like HMMER3 and PRGminer with experimental approaches such as VIGS and RACE provides a comprehensive pipeline for studying these important immune receptors across plant lineages [19] [6] [33].
Emerging resources like the bryophyte pangenome (www.bryogenomes.org), which incorporates 123 newly sequenced bryophyte genomes, provide unprecedented opportunities for comparative studies of NBS gene evolution across land plants [16] [13]. These resources are particularly valuable for investigating the unique PNL and HNL classes found in bryophytes but absent from most angiosperm genomes.
The comparative analysis of NBS domain architectures reveals both conserved principles and lineage-specific innovations in plant immune receptor evolution. While the core NBS domain with its conserved motifs remains largely unchanged across land plants, the modular domain architectures surrounding this core have diversified substantially, giving rise to bryophyte-specific PNL and HNL classes not found in angiosperms [26] [6]. The extensive gene family diversity in bryophytes, recently revealed through pangenome analysis, challenges previous assumptions about the simplicity of early land plant genomes and suggests alternative evolutionary strategies for environmental adaptation [16] [13]. These findings not only illuminate the evolutionary history of plant immunity but also identify novel structural configurations that could potentially be harnessed for crop improvement through biotechnological approaches.
From Genomes to Gene Families: Methodologies for Isolating and Classifying Divergent NBS Genes
Nucleotide-binding site (NBS) domain genes represent the largest class of plant disease resistance (R) genes, encoding proteins crucial for pathogen recognition and defense activation [26] [10]. These genes typically exhibit a modular structure consisting of an N-terminal domain, a central NBS domain, and C-terminal leucine-rich repeats (LRR) [6] [10]. In angiosperms, NBS-LRR genes are primarily classified into TIR-NBS-LRR (TNL), CC-NBS-LRR (CNL), and RPW8-NBS-LRR (RNL) classes based on their N-terminal domains [10] [19]. However, genomic investigations in bryophytes have revealed a more complex evolutionary picture, with the discovery of novel NBS classes such as PK-NBS-LRR (PNL) in the moss Physcomitrella patens and Hydrolase-NBS-LRR (HNL) in the liverwort Marchantia polymorpha [26] [6]. This guide objectively compares Hidden Markov Model (HMM) and BLAST strategies for identifying these diverse NBS genes across plant lineages, providing researchers with experimental protocols and performance data to inform their genome mining approaches.
Comparative Analysis of NBS Domain Architectures Across Plant Lineages
Evolutionary Distribution of NBS Gene Classes
Table 1: Distribution of NBS Gene Classes in Major Plant Lineages
| Plant Lineage | Species Example | TNL | CNL | RNL | PNL | HNL | Total NBS Genes |
|---|---|---|---|---|---|---|---|
| Bryophytes | Physcomitrella patens (moss) | 3 | 9 | - | 45 | - | 65 [26] |
| Bryophytes | Marchantia polymorpha (liverwort) | - | 7 | - | - | 36 | 43 [6] |
| Basal Angiosperms | Amborella trichopoda | 15 | 89 | 1 | - | - | 105 [10] |
| Eudicots | Medicago truncatula | 199 | 372 | - | - | - | 571 [10] |
| Monocots | Oryza sativa (rice) | - | 355 | 16 | - | - | 371 [10] |
The table above illustrates the dramatic diversification of NBS genes across plant evolution. Bryophytes possess not only typical CNL and TNL classes but also unique architectures like PNL and HNL not found in angiosperms [26] [6]. Angiosperms exhibit lineage-specific patterns, with TNLs completely absent from monocots like rice and the Poaceae family [10] [34]. Recent research analyzing 34 species from mosses to monocots and dicots identified 12,820 NBS-domain-containing genes classified into 168 distinct domain architecture classes, revealing significant diversity across species [19].
Structural Characteristics of NBS Domain Architectures
Table 2: Domain Architecture and Motif Composition of Major NBS Classes
| NBS Class | N-terminal Domain | Central NBS Motifs | C-terminal Domain | Representative Species |
|---|---|---|---|---|
| TNL | Toll/Interleukin-1 Receptor (TIR) | P-loop, RNBS-A, Kinase-2, RNBS-B, RNBS-C, GLPL, RNBS-D, MHDV [6] | LRR | Arabidopsis thaliana |
| CNL | Coiled-Coil (CC) | P-loop, RNBS-A, Kinase-2, RNBS-B, RNBS-C, GLPL, RNBS-D, MHDV [6] | LRR | Oryza sativa |
| RNL | RPW8 | P-loop, RNBS-A, Kinase-2, RNBS-B, RNBS-C, GLPL, RNBS-D, MHDV [10] | LRR | Glycine max |
| PNL | Protein Kinase (PK) | P-loop, Kinase-2, GLPL, RNBS-D (RNBS-A, -B, -C show lower conservation) [26] [6] | LRR | Physcomitrella patens |
| HNL | α/β-hydrolase | P-loop, Kinase-2, GLPL, RNBS-D (RNBS-A, -B, -C show lower similarity) [6] | LRR | Marchantia polymorpha |
The PNL and HNL classes identified in bryophytes show distinct motif conservation patterns, with their RNBS-A, RNBS-B, and RNBS-C motifs demonstrating lower sequence similarity to angiosperm NBS classes compared to the more conserved P-loop, Kinase-2, GLPL, and RNBS-D motifs [6]. Phylogenetic analyses suggest a closer relationship between HNL, PNL, and TNL classes, with CNLs representing a more divergent group [6].
Methodological Approaches: HMM versus BLAST Strategies
Hidden Markov Model (HMM) Profiling
Experimental Protocol: HMM-based NBS Gene Identification
Domain Model Selection: Use established protein family databases (Pfam) to obtain HMM profiles for the NB-ARC domain (PF00931). Additional models for TIR (PF01582), CC (PF05725), RPW8 (PF05659), and kinase domains (PF00069) can aid in classifying N-terminal domains [19].
Genome Screening: Execute HMMER suite tools (hmmsearch) against the target proteome or translated genome with a conservative e-value threshold (e.g., 1.1e-50) to ensure specificity [19].
Domain Architecture Analysis: Process hits with domain prediction tools (PfamScan) to identify associated domains and determine complete class architecture (e.g., TNL, CNL, PNL) [19].
Validation and Filtering: Remove redundant hits and verify domain integrity through manual inspection or additional tools like InterProScan.
A recent large-scale analysis applied this HMM approach across 34 plant species, successfully identifying 12,820 NBS genes with diverse domain architectures [19]. The strict e-value threshold helps minimize false positives while capturing divergent bryophyte-specific NBS classes.
BLAST-based Sequence Similarity Searching
Experimental Protocol: BLAST-based NBS Gene Identification
Query Sequence Curation: Compile a diverse set of known NBS sequences representing all major classes (TNL, CNL, RNL, and where applicable, bryophyte-specific PNL and HNL) from related species [26] [6].
Iterative Searching:
- Perform initial tBLASTn search against the target genome with moderate e-value threshold (e.g., 1e-10).
- Extract significant hits and use as new queries for iterative search expansion.
- Continue until no new significant sequences are detected.
Domain Verification: Subject all putative NBS sequences to domain prediction to verify the presence of NBS domain and classify based on N-terminal and C-terminal domains.
Structure Determination: For novel or truncated genes, use RACE PCR to recover complete coding sequences, as demonstrated in the identification of HNL genes in Marchantia polymorpha [6].
This approach proved successful in the initial discovery of novel NBS classes in bryophytes, where 65 NBS-encoding genes were identified from the Physcomitrella patens genome, including 45 PNL genes representing two-thirds of all NBS genes in this moss [26].
Performance Comparison and Method Selection Guidelines
Table 3: Comparative Performance of HMM and BLAST for NBS Gene Identification
| Parameter | HMM Approach | BLAST Approach |
|---|---|---|
| Sensitivity for Divergent Sequences | Moderate (depends on model breadth) | High with iterative searching |
| Specificity | High with proper e-value thresholds | Moderate, requires additional validation |
| Novel Class Discovery | Limited to existing domain models | High potential with iterative approaches |
| Computational Efficiency | Fast single-pass search | Slower, especially with iteration |
| Classification Capability | Direct through domain profiling | Indirect, requires additional analysis |
| Bryophyte-Specific Adaptation | Requires custom models for PNL/HNL | Adaptable with bryophyte-specific queries |
| Handling Partial Genes | Effective for identifying isolated domains | Can detect fragmented homologs |
The HMM strategy excels in comprehensive surveys across broad phylogenetic distances where consistent domain architecture is expected, while BLAST approaches offer advantages for detecting highly divergent or novel NBS classes, particularly in understudied lineages like bryophytes [26] [6] [19]. For non-model bryophytes with limited genomic resources, combining both strategies provides the most robust results.
Experimental Workflow for Comprehensive NBS Gene Mining
NBS Gene Identification Workflow
Research Reagent Solutions for NBS Gene Studies
Table 4: Essential Research Reagents for NBS Gene Identification and Validation
| Reagent/Category | Specific Examples | Function/Application |
|---|---|---|
| Domain Databases | Pfam, InterPro | HMM profiles for NB-ARC (PF00931) and associated domains |
| Bioinformatics Tools | HMMER, BLAST+, PfamScan, OrthoFinder | Sequence searching, domain prediction, evolutionary analysis |
| Genomic Resources | 123 bryophyte genomes [13], Phytozome, NCBI | Reference sequences for query design and comparative analysis |
| PCR and Cloning Reagents | RACE kits, high-fidelity polymerases, cloning vectors | Experimental validation of gene models and domain architecture |
| Expression Analysis | RNA-seq databases, qPCR reagents | Expression profiling across tissues and stress conditions |
| Evolutionary Analysis | MAFFT, FastTree, OrthoFinder | Phylogenetic reconstruction and orthogroup identification |
The recent expansion of genomic resources, particularly the sequencing of 123 bryophyte genomes representing 47 of the 55 known bryophyte orders, has dramatically enhanced our ability to mine NBS genes across the plant kingdom [13] [35]. These resources provide essential reference data for both HMM profile refinement and BLAST query selection.
The comparative analysis of HMM and BLAST strategies reveals complementary strengths for NBS gene identification across diverse plant lineages. HMM approaches provide standardized, efficient classification of known NBS architectures, while BLAST methods offer greater flexibility for discovering novel classes like the PNL and HNL genes in bryophytes. The continuing expansion of genomic resources, especially for non-model plants, will further enhance the sensitivity of both approaches. Future methodology development should focus on integrating machine learning approaches with traditional homology-based methods to better predict divergent resistance gene candidates and functionally characterize the vast diversity of NBS genes identified through genome mining efforts.
In the pursuit of characterizing novel gene families, degenerate polymerase chain reaction (PCR) has served as a foundational, sequence-independent method for genomic exploration, particularly in non-model organisms. This guide objectively evaluates its performance against modern alternatives, using the comparative analysis of Nucleotide-Binding Site (NBS) domain architectures in bryophytes and angiosperms as a critical case study. We detail experimental protocols, present quantitative data on method efficacy, and contextualize findings within the broader understanding of plant immune receptor evolution. While newer genomic technologies offer superior throughput, degenerate PCR remains a cost-effective and accessible tool for targeted gene discovery, evidenced by its pivotal role in identifying two novel classes of NBS genes in bryophytes that were absent from angiosperm genomes.
Degenerate PCR is a technique designed to find gene sequences in organisms for which there are no genomic resources available. It uses primers that are mixtures of oligonucleotide sequences, allowing for some 'wiggle room' in their binding sites. This flexibility is possible because genetic code is degenerate—multiple codons can encode the same amino acid—and protein sequences are often more conserved than the underlying nucleotide sequences. By targeting conserved amino acid motifs, researchers can amplify unknown gene homologs from a target organism using primers designed from known sequences of related species [36].
This method was particularly crucial for studying gene family evolution in non-model organisms, which, until recent advances in sequencing technology, lacked available genome assemblies. The investigation of NBS-LRR (Nucleotide-Binding Site-Leucine-Rich Repeat) disease resistance gene families across the plant kingdom serves as a prime example. While these genes had been extensively cataloged in angiosperms, their composition in early land plants like bryophytes remained largely unexplored until researchers employed degenerate PCR to penetrate this unexplored genomic space [26] [6].
Experimental Protocols: A Methodological Comparison
Degenerate PCR Workflow and Protocol
The standard workflow for degenerate PCR involves a series of deliberate steps, from primer design to sequence analysis [36].
Step 1: Acquiring Related Sequence Data The process begins by gathering protein coding sequences of the gene-of-interest from several closely related organisms. These sequences are compiled in FASTA format for alignment.
Step 2: Multiple Sequence Alignment The collected protein sequences are aligned using tools like ClustalX or web-based Clustal interfaces to identify conserved amino acid regions.
Step 3: Designing Degenerate Primers The aligned sequences are analyzed to find stretches of conserved amino acids 6-8 residues long that have low degeneracy—meaning the sequence can be coded by a relatively small number of possible nucleotide sequences. The degeneracy of a primer is calculated by multiplying the degeneracy of each amino acid in the sequence. For example, a primer targeting the sequence GWEFAK has a degeneracy of 4 (G) x 1 (W) x 2 (E) x 2 (F) x 4 (A) x 2 (K) = 128. Lower degeneracy (under 400 is great, under 1000 is acceptable) significantly increases the chance of success [36].
Step 4: PCR Amplification and Analysis For the PCR reaction itself, several adjustments from standard PCR are recommended:
- Use larger reaction volumes (50 µL)
- Use 3-5 times the normal amount of primer (e.g., 3 µL of each primer at 10 mM per 50 µL reaction)
- Optimal amplicon size is 200–600 bp
- Nested PCR (using a second set of primers internal to the first amplicon) greatly enhances specificity and success rates [36].
Modern Alternative Methods
Hybridization Capture Metabarcoding: This method uses designed probes to target and capture specific genomic regions from complex DNA samples. It is particularly useful for analyzing environmental samples (eDNA) and can target multiple loci simultaneously without the amplification biases of PCR [37].
Whole Genome Sequencing (WGS): With falling costs, WGS of non-model organisms has become increasingly feasible. The Bryophyte Genome Portal (www.bryogenomes.org) now hosts 123 high-quality bryophyte genomes, enabling comprehensive gene family analysis without targeted amplification [13].
Comparison of Experimental Requirements
Table 1: Methodological Comparison of Gene Discovery Approaches
| Parameter | Degenerate PCR | Hybridization Capture | Whole Genome Sequencing |
|---|---|---|---|
| Primary Resource Requirement | Known protein sequences from related organisms | DNA probes designed from known sequences | High-quality DNA; computational resources |
| Technical Expertise Level | Intermediate molecular biology skills | Advanced library preparation skills | Advanced bioinformatics expertise |
| Typical Workflow Duration | 3-7 days | 5-10 days | 1-3 weeks (including analysis) |
| Equipment/Tool Needs | Standard thermocycler; sequencer | Sequencing library prep equipment; sequencer | High-throughput sequencer; high-performance computing |
| Optimal Sample Quality | Moderately degraded DNA often acceptable | High-quality, high-molecular-weight DNA preferred | High-quality DNA essential for assembly |
| Key Limitation | Primer bias; limited to known conserved regions | Probe design constraints; cost | High cost; computational complexity |
Figure 1: Degenerate PCR Experimental Workflow. The process involves iterative bioinformatics and laboratory phases, with optimization cycles for primer design and PCR conditions.
Case Study: Discovering Novel NBS Domain Architectures in Bryophytes
Background on NBS Domain Genes
NBS domain genes form the largest family of plant disease resistance (R) genes. In angiosperms, these genes typically have a chimerical structure consisting of an N-terminal domain (TIR or CC), a central NBS domain, and a C-terminal LRR domain, classifying them as TNL (TIR-NBS-LRR) or CNL (CC-NBS-LRR) [6] [19]. Before the application of degenerate PCR to bryophytes, it was unknown whether these early land plants possessed similar NBS domain architectures or had evolved distinct resistance gene repertoires.
Experimental Application and Findings
In a seminal study, researchers used degenerate PCR to survey NBS-encoding genes in two bryophyte species: the moss Physcomitrella patens and the liverwort Marchantia polymorpha [26] [6]. The methodological approach was comprehensive:
Primer Design and Amplification: Degenerate primers were designed to target conserved motifs within the NBS domain. From Marchantia polymorpha, 416 clones were sequenced, yielding 389 NBS-homologous sequences that assembled into 43 non-redundant NBS-encoding genes [6].
RACE for Full-Length Sequences: Rapid Amplification of cDNA Ends (5'- and 3'-RACE) was employed to obtain full-length sequences, successfully identifying N-terminal and LRR domains for several genes [6].
Surprising Discoveries: The investigation revealed two completely novel classes of NBS-encoding genes not found in angiosperms:
- PNL Class: PK-NBS-LRR genes identified in P. patens, featuring an N-terminal Protein Kinase (PK) domain.
- HNL Class: Hydrolase-NBS-LRR genes identified in M. polymorpha, featuring an N-terminal α/β-hydrolase domain [26] [6].
Table 2: NBS Gene Diversity in Bryophytes vs. Angiosperms
| Organism Group | Species | Total NBS Genes | TNL | CNL | PNL | HNL | Reference |
|---|---|---|---|---|---|---|---|
| Moss | Physcomitrella patens | 65 | 9 | 11 | 45 | 0 | [26] [6] |
| Liverwort | Marchantia polymorpha | 43 | 0 | 7 | 0 | 36 | [6] |
| Angiosperms | Various (e.g., Arabidopsis, rice) | ~20-600 | Present | Present | 0 | 0 | [19] |
Methodological Advantages and Limitations in this Context
The success of degenerate PCR in this case study highlights several key advantages:
- Sequence-Independent Discovery: Without prior knowledge of bryophyte-specific NBS genes, the method enabled de novo identification of entirely new gene classes.
- Cost-Effectiveness: At the time of this research, genome sequencing for non-model organisms was prohibitively expensive.
- Accessibility: The technology required was available in most molecular biology laboratories.
However, the method also showed limitations:
- Sequence Bias: The predominance of PNL genes in P. patens (45 of 65 genes) may reflect primer bias toward these sequences.
- Incomplete Coverage: The approach likely missed highly divergent NBS genes that didn't contain the conserved motifs targeted by the degenerate primers.
Performance Comparison with Modern Methods
Efficiency and Comprehensiveness
Recent comprehensive analyses using whole genome sequencing have revealed that bryophytes possess a "larger gene family space than vascular plants," including a "higher number of unique and lineage-specific gene families" [13]. A 2024 study that analyzed 12,820 NBS-domain-containing genes across 34 species confirmed the PNL and HNL classes as bryophyte-specific innovations [19]. These findings suggest that while degenerate PCR successfully identified the major novel NBS classes in bryophytes, modern genomic approaches provide a more complete picture of gene family diversity.
Technical Performance Metrics
Table 3: Performance Comparison for Gene Family Characterization
| Performance Metric | Degenerate PCR | Hybridization Capture | Whole Genome Sequencing |
|---|---|---|---|
| Sensitivity | Moderate (primer bias) | High | Highest |
| Specificity | Variable (requires optimization) | High | N/A (untargeted) |
| Multiplexing Capacity | Low (limited targets per reaction) | High (multiple loci simultaneously) | Highest (entire genome) |
| DNA Input Requirements | Low (can work with degraded DNA) | Moderate | High (quality dependent) |
| Cost Per Sample | Low | Moderate | High |
| Discovery Potential | Limited to related sequences | Moderate | Unlimited |
| Time to Results | Days | 1-2 weeks | Weeks to months |
Sample Preservation Considerations
For field-based research on non-model organisms like bryophytes, sample preservation method significantly impacts downstream success. A 2022 study compared drying methods for bryophyte specimens and found that hot-air drying (40-80°C) provided superior DNA quality for PCR compared to traditional silica gel or natural drying methods, offering practical advantages for field researchers [38].
The Scientist's Toolkit: Essential Research Reagents
Table 4: Key Research Reagents for Degenerate PCR and Gene Family Analysis
| Reagent / Solution | Function / Application | Considerations for Use |
|---|---|---|
| Degenerate Primers | Mixtures of oligonucleotides that allow amplification of unknown homologs | Keep degeneracy <1000; aim for 17-24 nt length; include M/W residues where possible |
| High-Fidelity DNA Polymerase | PCR amplification with reduced error rates | Essential for accurate sequence representation of amplified products |
| mCTAB Lysis Buffer | DNA extraction from plant tissues, particularly polysaccharide-rich bryophytes | Effective for breaking down tough plant cell walls [38] |
| Silica Gel or Hot-Air Drying Equipment | Field preservation of specimen DNA quality | Hot-air drying (40-80°C) shows superior results for bryophytes [38] |
| TA Cloning Vector | Efficient cloning of PCR products for sequencing | Standard method for capturing individual amplification products |
| RACE Kit (5'/3') | Obtaining full-length cDNA sequences from partial fragments | Crucial for characterizing complete domain architectures of novel genes [6] |
Degenerate PCR established itself as a historically vital tool for probing unexplored genomic space, convincingly demonstrated by its role in discovering novel NBS domain architectures in bryophytes. While modern genomic methods now provide more comprehensive approaches for gene family characterization, degenerate PCR remains relevant for hypothesis-driven research in non-model organisms, particularly in resource-limited settings. The continued discovery of lineage-specific immune receptors across the plant kingdom [25] suggests there remains unexplored genetic diversity that could be mined using both traditional and modern approaches. For researchers today, the choice between these methods depends on specific project goals, resources, and the balance between targeted discovery and comprehensive genomic exploration.
For decades, genetic and genomic studies of plants have relied on single reference genomes, creating what scientists now recognize as a "reference bias" that severely limits our understanding of true genetic diversity within species. This approach inevitably misses rare variants, structural variations, and presence-absence polymorphisms that constitute the fundamental raw material for evolution and adaptation [39]. The limitations of single-reference genomics become particularly problematic when studying disease resistance genes, such as those containing nucleotide-binding site (NBS) domains, which often display remarkable structural variation and complex evolutionary histories [26] [40].
The pangenome concept emerged to address these limitations by capturing the complete set of genes and sequences found across all individuals within a species [39]. A pangenome typically comprises three components: (1) the core genome present in all individuals, (2) the dispensable genome found in two or more individuals, and (3) the private genome unique to single individuals [39]. This framework has recently evolved into the more comprehensive super-pangenome, which integrates genomic information across multiple species within a genus, particularly incorporating wild relatives that possess genetic diversity lost during domestication bottlenecks [41]. The super-pangenome provides unprecedented opportunities for cataloging complete gene repertoires and structural variations at the genus level, offering powerful insights into plant evolution, domestication, and molecular breeding [39].
This review examines how super-pangenome analysis transforms our ability to capture gene family diversity, with a specific focus on comparative analysis of NBS domain architectures between bryophytes and angiosperms. We present experimental data, methodological frameworks, and visualization tools that empower researchers to leverage this innovative approach in their investigations of plant genomic diversity.
Super-Pangenome Construction: Methodological Framework
Strategic Approaches to Super-Pangenome Assembly
Current methodologies for constructing plant super-pangenomes can be classified into three distinct approaches based on sampling scope and dataset composition [39]:
Table 1: Strategies for Plant Super-Pangenome Construction
| Approach Type | Sampling Scope | Construction Method | Key Advantage |
|---|---|---|---|
| Simple Super-Pangenome | Species level (one accession per species) | Conventional pangenome methods | Reflects genomic diversity at genus level |
| Intermediate Super-Pangenome | Accession level (multiple accessions for some species) | Conventional pangenome methods | Incorporates intraspecies variation |
| Complete Super-Pangenome | Comprehensive (full pangenomes for each species) | Integration of multiple species pangenomes | Captures both intra- and interspecies diversity |
The complete super-pangenome represents the most comprehensive approach, where individual pangenomes are first constructed for each species and then integrated into a multi-species framework. Although this method is computationally intensive, it simultaneously incorporates genomic information of target taxa and the pangenomes of sampled species, providing the most complete representation of genus-level diversity [39].
Technical Workflow for Super-Pangenome Construction
The construction of a super-pangenome involves multiple coordinated steps, from genome sequencing to final graph-based representation. The following diagram illustrates the core workflow:
This workflow generates several key data outputs: (1) a graph-based genome representing sequence and structural variations across all accessions, (2) a pan-gene set categorized into core, dispensable, and private genomes, and (3) structural variant maps highlighting large-scale genomic differences [42]. For example, in tomato super-pangenome construction, researchers assembled chromosome-scale genomes from nine wild species and two cultivated accessions, representing Solanum section Lycopersicon. This enabled the creation of a graph-based genome that empowered structural-variant-based genome-wide association studies, identifying numerous signals associated with tomato flavor-related traits and fruit metabolites [42].
Comparative Analysis of NBS Domain Architectures: Bryophytes vs. Angiosperms
NBS Domain Diversity in Angiosperms
In angiosperms, NBS-encoding genes represent the largest class of plant disease resistance (R) genes and are typically divided into two major architectural classes based on their N-terminal domains [26] [40]:
- TNL Class: Characterized by an N-terminal Toll/interleukin-1 receptor (TIR) domain, a central NBS domain, and a C-terminal leucine-rich repeat (LRR) region. This class appears to be absent in cereal genomes [40].
- CNL Class: Features a coiled-coil (CC) domain at the N-terminus instead of the TIR domain, along with the central NBS and C-terminal LRR domains [26].
These NBS-LRR genes typically display a conserved modular structure with specific motifs within the NBS domain, including P-loop, RNBS-A, Kinase-2, RNBS-B, RNBS-C, GLPL, RNBS-D, and MHDV, arranged consecutively from N- to C-terminus [26]. Angiosperm genomes contain substantial numbers of these genes; for example, rice possesses more than 600 NBS-LRR genes, approximately three to four times the complement found in Arabidopsis [40].
Novel NBS Domain Architectures in Bryophytes
Recent super-pangenome analyses of bryophytes have revealed unexpectedly diverse NBS domain architectures that differ significantly from those in angiosperms. A comprehensive survey of 123 bryophyte genomes uncovered two novel classes of NBS-encoding genes not found in vascular plants [26] [6] [13]:
Table 2: Novel NBS Domain Architectures in Bryophytes
| Class Name | Domain Architecture | Species Discovery | Key Features |
|---|---|---|---|
| PNL | PK-NBS-LRR | Physcomitrella patens (moss) | N-terminal protein kinase (PK) domain |
| HNL | Hydrolase-NBS-LRR | Marchantia polymorpha (liverwort) | N-terminal α/β-hydrolase domain |
The PNL class was identified from the Physcomitrella patens genome, where it represents approximately two-thirds (45 out of 65) of all NBS-encoding genes in this species. Among these, six are intact PNL genes containing all three domains (PK-NBS-LRR), while the remaining 39 are truncated versions lacking one or more domains [26] [6]. The HNL class was discovered in liverworts, with 36 out of 43 identified NBS-encoding genes in Marchantia polymorpha belonging to this novel class, characterized by an N-terminal α/β-hydrolase domain [26] [6].
Phylogenetic analysis covering all four classes of NBS-encoding genes (TNL, CNL, PNL, and HNL) revealed a closer evolutionary relationship among HNL, PNL, and TNL classes, suggesting that the CNL class has a more divergent status from the others [26]. The discovery of these novel NBS architectures in bryophytes highlights the value of comprehensive super-pangenome analyses in uncovering previously hidden genetic diversity.
Quantitative Comparison of Gene Family Diversity
Super-pangenome analysis of 343 Archaeplastida species (138 bryophytes, 146 tracheophytes, and 59 algae) revealed striking differences in gene family diversity between bryophytes and vascular plants [13]:
Table 3: Gene Family Diversity Comparison: Bryophytes vs. Vascular Plants
| Metric | Bryophytes | Vascular Plants |
|---|---|---|
| Cumulative Gene Families | 637,597 | 373,581 |
| Core Gene Families | 6,233 | 6,647 |
| Accessory Gene Families | 4,021 | 1,583 |
| Unique Gene Families | 3,862 per taxon | 2,223 per taxon |
| Total Unique + Accessory | 7,883 per genome (56%) | 3,806 per genome (36%) |
These data demonstrate that despite their morphological simplicity, bryophytes possess substantially greater diversity of gene families than vascular plants, with a higher number of unique and lineage-specific gene families originating from extensive new gene formation and continuous horizontal transfer of microbial genes over their long evolutionary history [13]. This rich and diverse genetic toolkit, which includes unique immune receptors like PNL and HNL classes, likely facilitated their spread across diverse biomes and adaptation to extreme habitats [13].
The following diagram illustrates the evolutionary relationships and NBS domain architecture distribution across land plants:
Experimental Protocols for Super-Pangenome Analysis
Genome Sequencing and Assembly
High-quality genome assembly forms the foundation of super-pangenome construction. The following multi-platform approach has proven effective for comprehensive genome representation:
- Sequencing Technologies: Employ hybrid sequencing strategies combining Pacific Biosciences (PacBio) long-read sequencing, Oxford Nanopore long reads, Illumina short reads, and Bionano Genomics optical mapping [42].
- Chromosome Conformation Capture: Utilize Hi-C (high-throughput chromosome conformation capture) technology for chromosome-scale scaffolding [42].
- Assembly Validation: Assess assembly quality using metrics such as contig N50, BUSCO completeness scores, and alignment rates of ESTs and Illumina short reads to the assembly [42].
For example, in the tomato super-pangenome study, researchers achieved an 802-Mb final assembly of S. galapagense with a contig N50 of 15.5 Mb, anchoring more than 99.5% of sequences to the 12 chromosomes. The assemblies showed high completeness, with more than 99% of Illumina short reads and 95.7% of ESTs mapping successfully to the genomes, and 94.0% of embryophyte BUSCO genes captured [42].
Identification and Classification of NBS-Domain Genes
The protocol for identifying and classifying NBS-domain genes involves both domain prediction and experimental validation:
- Domain Prediction: Use PfamScan with HMMER models (e-value cutoff 1.1e-50) against the Pfam-A_hmm database to identify NB-ARC domains [19]. Consider all genes containing NB-ARC domains as NBS genes for further analysis.
- Architecture Classification: Classify domain architectures using established systems that group genes with similar domain patterns into the same classes [19].
- Experimental Validation: For novel NBS classes, employ rapid amplification of cDNA ends (RACE) to identify N-terminal and C-terminal domains. 5'-RACE helps identify N-terminal domains, while 3'-RACE confirms C-terminal LRR domains [6].
In bryophyte studies, this approach successfully identified the novel PNL and HNL classes. Researchers confirmed these novel architectures through intron position analysis and phase characteristics, which revealed specific intron locations that distinguished them from classical NBS classes [26].
Orthogroup Analysis and Evolutionary Studies
To understand evolutionary relationships and diversification patterns:
- Orthogroup Clustering: Use OrthoFinder v2.5.1 with DIAMOND for fast sequence similarity searches and the MCL clustering algorithm for gene clustering [19].
- Phylogenetic Reconstruction: Perform multiple sequence alignment with MAFFT 7.0 and construct gene-based phylogenetic trees using maximum likelihood algorithms in FastTreeMP with 1000 bootstrap replicates [19].
- Gene Family Evolution: Estimate gene family gains and losses across the phylogeny using computational models that account for differential evolutionary rates among lineages [13].
These methods have revealed that bryophytes show a long history of gene family innovation, especially notable in mosses since the early Cretaceous (~100 Mya), potentially linked to successive whole-genome duplications [13].
Table 4: Essential Research Reagents and Computational Tools for Super-Pangenome Analysis
| Category | Specific Tools/Reagents | Application | Key Features |
|---|---|---|---|
| Sequencing Platforms | PacBio Sequel, Oxford Nanopore, Illumina NovaSeq | Genome sequencing | Long-read vs short-read technologies |
| Assembly Tools | Hi-C scaffolding, Bionano optical mapping | Genome assembly | Chromosome-scale scaffolding |
| Gene Prediction | AUGUSTUS, BRAKER | Gene annotation | Ab initio and evidence-based prediction |
| Domain Analysis | PfamScan, HMMER | Domain identification | Hidden Markov Model searches |
| Orthology Analysis | OrthoFinder, DIAMOND | Orthogroup clustering | Fast sequence similarity searches |
| Phylogenetics | MAFFT, FastTreeMP | Phylogenetic reconstruction | Multiple alignment and tree building |
| Expression Analysis | RNA-seq, VIGS | Functional validation | Gene expression and silencing |
| Data Resources | Bryophyte genome database (bryogenomes.org) | Data access | Centralized genomic resources |
Super-pangenome analysis represents a transformative approach in plant genomics that effectively captures the full spectrum of gene family diversity, moving beyond the limitations of single-reference genomes. Through comparative analysis of NBS domain architectures in bryophytes and angiosperms, we have demonstrated how this framework reveals novel genetic elements, evolutionary relationships, and functional diversity that would remain hidden using conventional genomic approaches.
The discovery of PNL and HNL classes in bryophytes, which are absent in angiosperms, highlights the power of super-pangenomics to uncover previously unknown genetic diversity and provide insights into the evolution of plant immune systems. The remarkable gene family diversity in bryophytes, despite their morphological simplicity, challenges traditional assumptions about the relationship between structural complexity and genetic repertoire size.
As sequencing technologies continue to advance and computational methods become more sophisticated, super-pangenome analysis will play an increasingly central role in plant comparative genomics, functional genetics, and breeding programs. The integration of wild relatives through super-pangenomes provides unprecedented opportunities for crop improvement by tapping into genetic diversity lost during domestication bottlenecks. This approach will undoubtedly yield further surprises and insights as it is applied more broadly across the plant kingdom.
Orthogroup clustering represents a fundamental methodology in comparative genomics, enabling researchers to trace the evolutionary relationships of genes across multiple species. By grouping genes into orthogroups—sets of genes descended from a single gene in the last common ancestor of all species being considered—this approach provides a coherent framework for extrapolating biological knowledge between organisms and understanding evolutionary dynamics [43]. The accuracy of orthogroup inference is particularly crucial for studying gene families with complex evolutionary histories, such as nucleotide-binding site (NBS) domain genes that play vital roles in plant immunity pathways [19].
This guide offers a comprehensive comparison of orthogroup inference methodologies, with a specific focus on their application for comparing NBS domain architectures between bryophytes and angiosperms. We present performance benchmarks, detailed experimental protocols, and essential resources to empower researchers in selecting appropriate tools for their evolutionary studies.
Orthogroup Inference Algorithms: A Comparative Analysis
Several algorithms have been developed to address the challenges of orthogroup inference, each employing distinct computational strategies:
- OrthoFinder: A phylogenetically informed tree-based inference algorithm that utilizes sequence similarity searches, often with DIAMOND for speed, and can incorporate phylogenetic tree inference for orthogroup delimitation [44] [19]. It applies a novel gene length normalization to correct for sequence length bias in similarity scores [43].
- SonicParanoid: A graph-based inference algorithm modified from the InParanoid algorithm that provides rapid orthology assignments but does not incorporate phylogenetic information in its orthogroup inference [44].
- Broccoli: A tree-based algorithm that employs network analyses to determine orthology networks and considers gene length biases before clustering proteins based on sequence similarity [44].
- OrthNet: A synteny-aware workflow that incorporates gene colinearity information for determining orthogroups using the Markov Clustering algorithm (MCL) [44].
Performance Comparison on Plant Genomes
A recent study evaluating these algorithms on Brassicaceae genomes with varying ploidy levels provides insightful performance data:
Table 1: Performance comparison of orthology inference algorithms on Brassicaceae genomes
| Algorithm | Computational Approach | Strengths | Limitations | Consistency with Other Methods |
|---|---|---|---|---|
| OrthoFinder | Phylogenetic tree-based | High accuracy, comprehensive statistics, gene tree inference | Longer run times for large datasets | High agreement with SonicParanoid and Broccoli |
| SonicParanoid | Graph-based (MCL) | Fast computation, user-friendly | No phylogenetic information | High agreement with OrthoFinder and Broccoli |
| Broccoli | Tree-based with network analysis | Fast, low memory requirements | Limited functional annotations | High agreement with OrthoFinder and SonicParanoid |
| OrthNet | Synteny-aware with MCL | Provides gene colinearity information | Divergent results from other methods | Generally an outlier in comparisons |
Three algorithms—OrthoFinder, SonicParanoid, and Broccoli—produced largely consistent orthogroup predictions for Brassicaceae species, with OrthoFinder generally regarded as the most accurate according to OrthoBench benchmarks [44]. OrthNet tended to produce divergent results, though it could still provide valuable information about gene colinearity [44].
Orthogroup Analysis of NBS Domain Genes in Bryophytes vs. Angiosperms
Experimental Design and Methodology
Genome Selection and Curation: Researchers should select representative genomes from both bryophyte lineages (hornworts, liverworts, and mosses) and angiosperm species with well-annotated genomes. The bryophyte sampling should encompass their considerable phylogenetic diversity, ideally including recently sequenced species from the 123 new bryophyte genomes now available [13].
NBS Gene Identification: Identify NBS-domain-containing genes using PfamScan with the NB-ARC domain model (PF00931) at a strict e-value cutoff (e.g., 1.1e-50) [19]. All genes containing the NB-ARC domain should be considered NBS genes for subsequent analysis.
Domain Architecture Classification: Classify NBS genes based on their domain architectures using established classification systems [19]. This includes identifying classical patterns (NBS, NBS-LRR, TIR-NBS, TIR-NBS-LRR) and novel, species-specific structural patterns.
Orthogroup Inference: Perform orthogroup clustering using OrthoFinder v2.5.1 or higher with the following parameters [19]:
- Sequence similarity search: DIAMOND tool for fast comparison
- Clustering algorithm: MCL for orthogroup delineation
- Ortholog identification: DendroBLAST for phylogenetic orthology assessment
- Multiple sequence alignment: MAFFT 7.0 for alignment
- Phylogenetic analysis: FastTreeMP with 1000 bootstrap replicates for gene tree inference
Key Findings in Bryophyte vs. Angiosperm NBS Genes
Expanded Gene Family Diversity in Bryophytes: Recent super-pangenome analyses incorporating 123 bryophyte genomes have revealed that bryophytes possess a substantially larger diversity of gene families than vascular plants, including higher numbers of unique and lineage-specific gene families [13]. This diversity originates from extensive new gene formation and continuous horizontal transfer of microbial genes over their long evolutionary history.
Novel NBS Domain Architectures: Bryophytes possess novel classes of NBS-encoding genes not found in angiosperms [27]:
- PNL Class: Found in the moss Physcomitrella patens, featuring a Protein Kinase (PK) domain at the N-terminus and an LRR domain at the C-terminus (PK-NBS-LRR)
- HNL Class: Identified in the liverwort Marchantia polymorpha, possessing an α/β-hydrolase domain at the N-terminus and an LRR domain at the C-terminus (Hydrolase-NBS-LRR)
Table 2: Comparison of NBS domain gene characteristics in bryophytes versus angiosperms
| Characteristic | Bryophytes | Angiosperms |
|---|---|---|
| Total NBS Genes | Relatively small repertoires (e.g., ~25 in Physcomitrella patens) | Extensive expansions (e.g., >12,000 across 34 species in one study) |
| Novel Domain Architectures | PNL (Kinase-NBS-LRR) and HNL (Hydrolase-NBS-LRR) classes | Primarily TNL (TIR-NBS-LRR) and CNL (CC-NBS-LRR) classes |
| Genetic Redundancy | Low genetic redundancy in regulatory pathways | High genetic redundancy |
| Evolutionary Origin | More representative of ancestral land plant NBS genes | Extensive lineage-specific expansions |
| Genomic Features | Relatively small genomes with fewer total genes | Larger genomes with more total genes |
Evolutionary Dynamics: Phylogenetic analyses of NBS genes reveal a closer relationship between the HNL, PNL, and TNL classes, suggesting that the CNL class has a more divergent status [27]. The presence of specific introns in bryophyte NBS genes highlights their chimerical structures and implies possible origins via exon-shuffling during the rapid lineage separation processes of early land plants [27].
Orthogroup Clustering Workflow
The following diagram illustrates the comprehensive workflow for orthogroup clustering analysis, from data preparation to evolutionary interpretation:
Table 3: Essential research reagents and computational tools for orthogroup analysis
| Resource Category | Specific Tools/Databases | Primary Function | Application in NBS Studies |
|---|---|---|---|
| Orthology Inference Software | OrthoFinder, SonicParanoid, Broccoli, OrthNet | Orthogroup clustering from protein sequences | Comparative analysis of NBS genes across species |
| Sequence Analysis Tools | DIAMOND, BLAST, HMMER, PfamScan | Sequence similarity searches, domain identification | Identification of NB-ARC domains and associated domains |
| Multiple Sequence Alignment | MAFFT, MUSCLE | Protein sequence alignment | Preparing NBS gene alignments for phylogenetic analysis |
| Phylogenetic Analysis | FastTree, IQ-TREE, RAxML | Phylogenetic tree inference | Reconstructing evolutionary relationships of NBS genes |
| Genomic Databases | Phytozome, PLAZA, GreenPhylDB, NCBI | Access to annotated plant genomes | Retrieving protein sequences for analysis |
| Specialized NBS Resources | ANNA (Angiosperm NLR Atlas) | Curated database of NLR genes | Reference for angiosperm NBS gene comparisons |
| Bryophyte Genomic Resources | Bryophyte Genomes Portal (bryogenomes.org) | Access to bryophyte genomic data | Source of bryophyte sequences for comparative studies |
Orthogroup clustering provides an essential framework for tracing evolutionary relationships across species, with particular utility for understanding the diversification of pathogen defense mechanisms like NBS domain genes in land plants. Among available algorithms, OrthoFinder consistently demonstrates high accuracy in benchmark assessments and offers comprehensive phylogenetic analysis capabilities, making it particularly suitable for comparative studies between bryophytes and angiosperms.
The emerging picture from orthogroup analyses reveals that bryophytes, despite their morphological simplicity, possess unexpectedly diverse gene families including novel NBS domain architectures not found in vascular plants. These findings highlight the importance of selecting appropriate orthology inference methods and leveraging the expanding genomic resources for both bryophytes and angiosperms to fully understand the evolutionary trajectories of plant immune systems.
The functional annotation of protein sequences represents a critical bottleneck in modern genomics, determining how effectively we can bridge the raw sequence data with biological understanding. This challenge is particularly acute when studying rapidly evolving gene families like those containing the nucleotide-binding site (NBS) domain, which play crucial roles in plant pathogen recognition and immunity. The comparative analysis of NBS domain architectures between bryophytes (non-vascular plants) and angiosperms (flowering plants) provides an ideal system for examining annotation challenges, as it reveals both conserved evolutionary patterns and lineage-specific innovations that test the limits of current bioinformatics methods [19] [45].
Within the broader thesis of plant immunity evolution, this comparison highlights a fundamental dichotomy: while angiosperms possess extensively characterized NBS-LRR genes classified primarily as TNL (TIR-NBS-LRR) or CNL (CC-NBS-LRR) types, bryophytes harbor previously overlooked structural diversity including novel classes such as PNL (Protein Kinase-NBS-LRR) and HNL (Hydrolase-NBS-LRR) domains [26]. These discoveries not only reshape our understanding of plant immune system evolution but also expose critical gaps in functional annotation pipelines, which have historically been trained and validated on angiosperm-centric datasets. The exponential growth of genomic data from diverse plant lineages has far outpaced our ability to experimentally characterize protein functions, with only approximately 2.7% of UniProtKB entries having been manually reviewed [46]. This annotation deficit is particularly pronounced for bryophytes, where up to 84% of gene families lack functional characterization despite their remarkable diversity [16].
Comparative Genomic Landscape: Bryophytes vs. Angiosperms
Taxon Sampling and Gene Family Diversity
Recent super-pangenome analyses incorporating 123 newly sequenced bryophyte genomes have revealed that bryophytes possess substantially greater diversity of gene families than vascular plants, despite their seemingly simpler morphological organization [16]. Bryophytes exhibit a cumulative 637,597 nonredundant gene families compared to 373,581 in vascular plants, with an average of 3,862 gene families unique to single taxa versus 2,223 in vascular plants. This expanded genetic toolkit likely contributes to their ecological success across diverse habitats.
Table 1: Genomic Feature Comparison Between Bryophytes and Angiosperms
| Genomic Feature | Bryophytes | Angiosperms | Data Source |
|---|---|---|---|
| Cumulative gene families | 637,597 | 373,581 | [16] |
| Average unique gene families per taxon | 3,862 | 2,223 | [16] |
| Core gene families (≥80% of samples) | 6,233 | 6,647 | [16] |
| Accessory gene families (2-80% of samples) | 4,021 | 1,583 | [16] |
| Percentage of functionally annotated gene families | 27% (accessory), 16% (unique) | ~91% (core) | [16] |
| Average total genes per genome | 27,959 | 34,794 | [16] |
NBS Domain Architecture Diversity
The NBS domain genes represent one of the largest resistance gene superfamilies involved in plant pathogen responses. A comprehensive 2024 study identified 12,820 NBS-domain-containing genes across 34 plant species, classifying them into 168 distinct classes with both classical and species-specific structural patterns [19]. The architectural differences between bryophytes and angiosperms are particularly striking, revealing divergent evolutionary trajectories in plant immunity mechanisms.
Table 2: NBS Domain Architecture Comparison Between Bryophytes and Angiosperms
| Architectural Class | Bryophyte Representation | Angiosperm Representation | Key Features |
|---|---|---|---|
| TNL (TIR-NBS-LRR) | Limited presence | Abundant in dicots | Toll-Interleukin Receptor domain; absent in grasses |
| CNL (CC-NBS-LRR) | Limited presence | Ubiquitous across angiosperms | Coiled-Coil domain; major class in monocots |
| PNL (PK-NBS-LRR) | Unique to bryophytes | Not found | Protein Kinase domain; novel class in mosses [26] |
| HNL (Hydrolase-NBS-LRR) | Unique to bryophytes | Not found | α/β-hydrolase domain; novel class in liverworts [26] |
| RNL (RPW8-NBS-LRR) | Limited | Limited | RPW8 domain; functions in signal transduction [19] |
The evolutionary relationship between these NBS classes reveals a closer phylogenetic relationship among HNL, PNL and TNL classes, with the CNL class representing a more divergent evolutionary lineage [26]. This phylogenetic distribution supports the hypothesis that bryophytes and tracheophytes diverged from a complex common ancestor during the Cambrian period (515-494 million years ago), with each lineage subsequently experiencing distinct evolutionary trajectories [47].
Methodological Framework: Experimental and Computational Approaches
Genomic Identification and Classification Pipeline
The standard workflow for NBS gene identification and classification employs a multi-step process that integrates sequence similarity searches, domain architecture analysis, and evolutionary relationship mapping. The following diagram illustrates this comprehensive pipeline:
Critical Assessment of Functional Annotation Methods
The performance of functional annotation methods has been systematically evaluated through community challenges like the Critical Assessment of Functional Annotation (CAFA), which has documented significant improvements over the past decade [45]. The most successful approaches integrate machine learning with sequence alignment and complementary data sources. The GOLabeler method, which integrates GO term frequency, sequence alignments, amino acid patterns, domain presence, and biophysical properties using a learning-to-rank application of machine learning, has demonstrated superior performance in recent challenges [45].
However, significant limitations persist, particularly for non-model organisms and rapidly evolving gene families. Traditional similarity-based methods like BLAST and HMMER struggle with remote homology detection and are susceptible to propagating existing annotation errors [48] [46]. De novo methods using machine learning (K-nearest neighbors, probabilistic neural networks, support vector machines) can predict distantly related proteins but often suffer from high false discovery rates due to insufficient training data representativeness [48]. Deep learning approaches show promise but require systematic evaluation of their ability to control false annotation rates [48].
Experimental Validation and Case Studies
Functional Characterization of NBS Genes in Cotton
A comprehensive 2024 study on NBS genes in Gossypium species provides an exemplary case of integrated functional validation [19]. The research combined expression profiling, genetic variation analysis, protein interaction studies, and virus-induced gene silencing (VIGS) to validate the role of specific NBS genes in response to cotton leaf curl disease (CLCuD). The experimental workflow revealed:
- Expression Profiling: Putative upregulation of orthogroups OG2, OG6, and OG15 in different tissues under various biotic and abiotic stresses in both susceptible and tolerant cotton plants.
- Genetic Variation Analysis: Identification of 6,583 unique variants in tolerant (Mac7) versus 5,173 in susceptible (Coker 312) G. hirsutum accessions.
- Protein Interaction Studies: Demonstration of strong interaction between putative NBS proteins and ADP/ATP as well as core proteins of the cotton leaf curl disease virus.
- Functional Validation: Silencing of GaNBS (OG2) in resistant cotton through VIGS demonstrated its putative role in virus tittering, confirming functional importance.
Cross-Species Comparative Analyses
Comparative analysis of NBS sequences from sunflower, lettuce, and chicory (Asteraceae family) revealed distinct families of R-genes with different evolutionary dynamics between closely versus distantly related species [49]. The most closely related species (lettuce and chicory) showed striking similarity in CC subfamily composition, while more distantly related sunflower showed less structural similarity. Comparison with Arabidopsis thaliana revealed that Asteraceae NBS gene subfamilies are distinct from Arabidopsis gene clades, suggesting both ancient origins and lineage-specific diversification [49].
Similarly, analysis of Citrus NBS genes revealed that hybrid Citrus sinensis and original Citrus clementina possess similar types of NBS genes, with phylogenetic analysis revealing three approximately evenly numbered groups: one TIR-containing group and two different non-TIR groups with distinct evolutionary origins [50]. This highlights how comparative genomics can reveal complex evolutionary histories obscured by simple domain architecture classifications.
Table 3: Key Research Reagents and Resources for NBS Gene Analysis
| Resource Category | Specific Tools/Databases | Primary Function | Application Context |
|---|---|---|---|
| Genome Databases | NCBI Genome, Phytozome, Plaza | Access to genome assemblies and annotations | Foundational data for comparative analyses [19] |
| Domain Annotation | PfamScan, HMMER | Identification of protein domains using hidden Markov models | NBS domain identification with e-value cutoffs [19] |
| Orthogroup Analysis | OrthoFinder v2.5.1 with MCL clustering | Clustering of genes into orthologous groups | Evolutionary relationship inference across species [19] |
| Expression Databases | IPF Database, CottonFGD, Cottongen | RNA-seq data from multiple tissues and stress conditions | Expression profiling of NBS genes [19] |
| Structure Prediction | AlphaFold, Phyre2 | Protein structure prediction from sequence | Functional inference from structural features [45] |
| Specialized Collections | Enzyme Portal, MoonProt, DisProt | Curated information on specific protein types | Functional annotation of enzymes and multifunctional proteins [45] |
| Experimental Validation | VIGS vectors, Yeast two-hybrid systems | Functional characterization of candidate genes | In planta validation of NBS gene function [19] |
Remaining Challenges and Future Directions
Despite significant methodological advances, substantial challenges remain in protein function prediction. Many types of biochemical or biophysical functions lack correlated sequence or structural motifs that can support reliable prediction algorithms [45]. Protein-protein interaction sites often consist of relatively smooth surface regions with weak conservation, making them difficult to predict from sequence alone. The problem is compounded by proteins with multiple functions and homologous proteins with small sequence differences that result in different functions [45].
For bryophyte genomics specifically, the challenges are even more pronounced. While 50-80% of accessory and unique gene families in bryophytes show evidence of expression, only 27% of accessory and 16% of unique gene families have functional annotations based on protein domains, compared to 91% for core families [16]. This represents a significant knowledge gap in understanding the functional roles of bryophyte-specific genes.
Future progress will require integrated approaches that combine advanced computational methods with targeted experimental validation. Deep learning strategies that control false discovery rates, integration of multiple data types (sequence, structure, expression, interaction networks), and development of lineage-specific training datasets will be essential for advancing functional annotation accuracy [48] [45]. For the specific challenge of NBS gene annotation, expanding taxonomic sampling beyond model angiosperms to better represent bryophyte and other non-traditional species will be crucial for uncovering the full evolutionary complexity of plant immune systems.
The comparative analysis of NBS domain architectures between bryophytes and angiosperms ultimately reveals a dynamic evolutionary history characterized by both conservation and innovation. As functional annotation methods improve, they will continue to bridge the gap between sequence data and biological role, providing new insights into plant immunity and the molecular mechanisms underlying plant adaptation to changing environmental challenges.
Navigating Analytical Challenges: Troubleshooting NBS Gene Identification and Functional Prediction
Genome annotation serves as the critical bridge between raw sequence data and biological insight, yet significant gaps persist in standard automated pipelines, particularly for non-model organisms and rapidly evolving gene families. This challenge is acutely demonstrated in comparative plant genomics, where the dramatic differences in nucleotide-binding site (NBS) domain architectures between bryophytes and angiosperms reveal the limitations of conventional annotation methods. This guide objectively evaluates multi-evidence integration approaches that combine transcriptomic, proteomic, and evolutionary data to overcome these limitations, providing supporting experimental data and standardized protocols for researchers investigating plant immunity genes across diverse species.
The identification of resistance gene analogs, particularly NBS-domain-containing genes, represents a formidable challenge for genome annotation pipelines. These genes exhibit remarkable architectural diversity and rapid evolution, creating substantial gaps in standard annotations. Comprehensive analyses have identified 12,820 NBS-domain-containing genes across 34 plant species, revealing significant differences between bryophytes and angiosperms [19]. Bryophytes like Physcomitrella patens possess relatively small NLR repertoires with approximately 25 NLRs, while angiosperms have undergone substantial gene expansion, with some species containing thousands of these immune receptors [19].
Recent super-pangenome analyses of bryophytes have further underscored annotation limitations, revealing that bryophytes possess a substantially greater diversity of gene families than vascular plants, including a higher number of unique and lineage-specific gene families [16] [13]. These "orphan genes" often escape detection in standard pipelines due to their lack of similarity to known genes, with studies showing that less than 15% of unique genes in bryophyte models show sequence similarity to existing orthogroups [16]. This annotation gap fundamentally impedes our understanding of plant immunity evolution and necessitates improved methodological approaches.
Comparative Analysis of NBS Domain Architectures: Bryophytes vs. Angiosperms
Quantitative Differences in NBS Gene Repertoires
Table 1: Comparative Analysis of NBS Domain Genes in Bryophytes and Angiosperms
| Characteristic | Bryophytes | Angiosperms | Data Source |
|---|---|---|---|
| Average NLR Repertoire Size | ~25 NLRs in Physcomitrella patens | Up to thousands of NLRs | [19] |
| NBS Domain Architecture Classes | Limited classical patterns (NBS, NBS-LRR, TIR-NBS) | 168 classes with numerous novel domain architectures | [19] |
| Species-Specific Structural Patterns | Few identified | Multiple (TIR-NBS-TIR-Cupin1, TIR-NBS-Prenyltransf, Sugartr-NBS, etc.) | [19] |
| Gene Family Evolution | Long history of gene family innovation, especially in mosses since Early Cretaceous | Constant, small numbers of total gene families in lineages arising over last 65 million years | [16] [13] |
| Unique Gene Families | Higher absolute number (532,840 versus 324,552) | Lower absolute number but higher percentage (87% vs 84%) | [16] [13] |
Technical Challenges in Annotating Bryophyte Genomes
Bryophytes present particular annotation difficulties that extend beyond NBS genes. Their genomes contain a substantially larger cumulative number of nonredundant gene families compared to vascular plants (637,597 versus 373,581), despite having fewer average genes per genome (27,959 versus 34,794) [16] [13]. These unique genes often exhibit characteristics that challenge standard annotation pipelines, including fewer introns, shorter coding regions, and lower expression levels [16]. Additionally, bryophyte genomes show evidence of continuous horizontal transfer of microbial genes over their long evolutionary history, further complicating homology-based annotation methods [16].
Experimental Strategies for Comprehensive Gene Annotation
Integrated Evidence Annotation Pipeline
The most effective approach for overcoming annotation gaps involves integrating multiple lines of evidence through structured computational workflows. The following diagram illustrates a comprehensive annotation pipeline that combines ab initio prediction with experimental evidence:
Proteomic Validation of Gene Models
Mass spectrometry provides orthogonal validation for gene predictions by confirming translation of predicted genes. Experimental protocols for proteomic validation include:
Sample Preparation and Analysis:
- Protein extraction using RapiGest in TNE buffer followed by reduction with TCEP and alkylation with iodoacetamide [51]
- Trypsin digestion (1:50 ratio) overnight at 37°C [51]
- LC-MS/MS analysis using systems such as Agilent 1100 HPLC with capillary columns [51]
- Database searching against six-frame translations or exon graph databases with false discovery rate control at 2.5% [51]
This approach has been shown to validate 39,000 exons and 11,000 introns at the translation level and can discover novel or extended exons in known genes [51]. When applied to annotation improvement, proteomic evidence can add hundreds of correct exons to gene predictions through simple rescoring strategies [51].
Transcriptomic Evidence Integration
RNA-seq data provides critical evidence for exon boundaries and splice variants. Standardized protocols include:
Library Preparation and Analysis:
- RNA extraction using TRIzol or column-based methods with DNase treatment
- Library preparation using stranded mRNA-seq protocols
- Sequencing on Illumina platforms to achieve minimum 30 million read pairs per sample
- Alignment using splice-aware aligners (TopHat, HISAT2) [52]
- Transcript assembly using StringTie or Cufflinks [53] [52]
The integration of RNA-seq evidence is particularly valuable for identifying species-specific splicing patterns in NBS genes, which may be missed in pipelines trained on model organisms.
Evolutionary Genomics Approaches
Comparative genomics strategies leverage evolutionary relationships to improve annotation:
Orthogroup Analysis:
- Orthogroup clustering using OrthoFinder with DIAMOND for sequence similarity searches and MCL for clustering [19]
- Multiple sequence alignment with MAFFT followed by maximum likelihood phylogenetic analysis with FastTreeMP [19]
- Identification of core orthogroups (present in ≥80% of samples) versus accessory and unique gene families [16]
This approach has revealed that bryophytes exhibit substantially different patterns of gene family evolution compared to vascular plants, with bryophyte ancestral nodes maintaining more gene family diversity over time [16] [13].
Comparative Performance Assessment of Annotation Strategies
Table 2: Performance Metrics of Different Annotation Improvement Strategies
| Method | Key Advantages | Limitations | Impact on NBS Gene Discovery | Validation Metrics |
|---|---|---|---|---|
| Proteomics (MS/MS) | Direct evidence of translation; identifies novel coding regions | Limited by protein abundance; may miss low-expression NBS genes | Confirmed translation of 224 hypothetical proteins; discovered 40+ alternative splicing events [51] | 39,000 exons and 11,000 introns validated at translation level [51] |
| RNA-seq Integration | Identifies splice variants and UTRs; captures expression data | Does not confirm translation; technical artifacts in assembly | Critical for determining exon-boundaries in complex NBS architectures [52] | BUSCO completeness scores; alignment coverage statistics [53] |
| Comparative Genomics | Reveals evolutionary patterns; identifies conserved domains | Limited for lineage-specific genes; requires multiple genomes | Identified 603 orthogroups with core and unique NBS genes across species [19] | Orthogroup occupancy; phylogenetic support values [19] |
| Manual Curation | Resolves complex loci; integrates disparate evidence | Time-intensive; requires expertise | Essential for correcting mis-annotated NBS domain boundaries and gene models [53] | Agreement with external evidence; consistency with domain architecture [53] |
Table 3: Essential Research Reagents and Computational Tools for Comprehensive Annotation
| Category | Specific Tools/Reagents | Primary Function | Application in NBS Gene Annotation |
|---|---|---|---|
| Gene Prediction Software | AUGUSTUS [53], BRAKER [53], GeneMark-ES [52] | Ab initio gene prediction | Initial identification of candidate NBS domain genes |
| Evidence Integrators | MAKER [53], EvidenceModeler [53] | Combine multiple evidence sources | Integrate RNA-seq, homology evidence for NBS genes |
| Proteomic Tools | MaxQuant, Proteome Discoverer, PeptideShaker | MS/MS data analysis | Validate translated NBS genes and alternative isoforms |
| Comparative Genomics | OrthoFinder [19], DIAMOND [19], FastTreeMP [19] | Evolutionary analysis | Classify NBS genes into orthogroups; evolutionary history |
| Visualization & Curation | IGV [52], GenomeView [52], Geneious [52] | Manual annotation curation | Verify NBS domain boundaries and gene structures |
| Functional Annotation | InterProScan [52], PfamScan [19] | Domain identification | Identify NBS (NB-ARC) domains and associated domains |
| Specialized Databases | ANNA: Angiosperm NLR Atlas [19], PLAZA [19] | Comparative genomics resources | Context for newly annotated NBS genes across species |
The integration of multiple evidence types represents the most effective strategy for overcoming annotation gaps in plant genomics research. As demonstrated in the comparison of NBS domain architectures between bryophytes and angiosperms, standard annotation pipelines consistently underestimate gene diversity, particularly for rapidly evolving immune receptor genes. The methodological framework presented here—combining transcriptomic, proteomic, and evolutionary evidence within a structured curation workflow—provides a robust approach for generating more complete gene annotations. These improved annotations are fundamental for understanding the evolution of plant immunity and other complex biological systems across the plant phylogeny.
Future directions should emphasize the development of lineage-specific training parameters for gene prediction tools, expanded proteogenomic databases for non-model species, and machine learning approaches that can better identify atypical gene structures characteristic of rapidly evolving gene families like NBS domain genes.
The reconstruction of evolutionary history, or phylogenetics, forms the cornerstone of modern biology, enabling scientists to trace the relationships between species across deep time. However, a significant challenge persists in distinguishing truly novel evolutionary lineages from cases of rapid divergence, where accelerated evolutionary change can create the illusion of deeper separation. This phylogenetic ambiguity becomes particularly pronounced when examining the deep divergences in the tree of life, such as the origin and early evolution of land plants.
The emergence of land plants from aquatic ancestors approximately 500 million years ago represented a pivotal evolutionary transition that fundamentally altered Earth's terrestrial ecosystems [13]. Among extant land plants, bryophytes (including mosses, liverworts, and hornworts) and angiosperms (flowering plants) represent two major evolutionary lineages that diverged from a common ancestor and pursued dramatically different evolutionary trajectories. Recent phylogenomic evidence has resolved bryophytes as a monophyletic group sister to all living vascular plants, with the split between these lineages dating to the Paleozoic Era [13] [54]. This deep evolutionary divergence provides an ideal natural experiment for investigating how different selective pressures and genetic mechanisms have shaped distinct evolutionary outcomes over geological timescales.
Central to this investigation are nucleotide-binding site (NBS) domain genes, which encode one of the largest superfamilies of disease resistance (R) genes in plants [6] [19]. These genes play crucial roles in plant immunity through pathogen recognition and defense activation. The comparative analysis of NBS domain architectures between bryophytes and angiosperms offers a powerful framework for differentiating true evolutionary novelty from rapid divergence, as these genes exhibit both conserved essential functions and lineage-specific innovations reflective of distinct evolutionary pressures.
Comparative Analysis of NBS Domain Architectures
Fundamental Structural Divergence Between Lineages
NBS-encoding genes typically display a modular structure consisting of an N-terminal domain, a central NBS domain, and a C-terminal leucine-rich repeat (LRR) domain [6]. The N-terminal domain primarily determines the classification of these genes and reveals the most striking evolutionary divergence between bryophytes and angiosperms.
In angiosperms, research has consistently identified two principal classes of NBS-encoding genes: TIR-NBS-LRR (TNL), characterized by an N-terminal Toll/Interleukin-1 Receptor domain, and CC-NBS-LRR (CNL), defined by an N-terminal coiled-coil domain [6] [19]. These canonical structures represent the dominant architectures across flowering plants and have been extensively characterized in model species such as Arabidopsis thaliana and Oryza sativa.
In contrast, genomic investigations of bryophytes have revealed unexpectedly novel NBS domain architectures that diverge fundamentally from the angiosperm paradigm. The moss Physcomitrella patens possesses a unique class designated PK-NBS-LRR (PNL), featuring an N-terminal protein kinase (PK) domain [6]. Even more remarkably, the liverwort Marchantia polymorpha exhibits a distinct Hydrolase-NBS-LRR (HNL) class containing an N-terminal α/β-hydrolase domain [6]. These structural innovations represent genuine evolutionary novelties rather than simple modifications of existing angiosperm architectures.
Table 1: Comparative Overview of NBS Domain Architectures in Bryophytes and Angiosperms
| Plant Group | Representative Species | Major NBS Classes | N-terminal Domain Types | Genomic Abundance |
|---|---|---|---|---|
| Bryophytes | Physcomitrella patens (moss) | PNL | Protein Kinase (PK) | ~45 PNL genes |
| Marchantia polymorpha (liverwort) | HNL | α/β-hydrolase | ~36 HNL genes | |
| Various bryophytes | CNL, TNL | Coiled-coil, TIR | Limited representation | |
| Angiosperms | Arabidopsis thaliana | TNL, CNL | TIR, Coiled-coil | Extensive repertoires |
| Oryza sativa (rice) | CNL, TNL | Coiled-coil, TIR | 70,000+ CNL genes across angiosperms |
Quantitative Genomic Comparisons
The scale of divergence between bryophyte and angiosperm NBS genes extends beyond structural innovation to encompass fundamental differences in genomic abundance and diversity. Angiosperms typically harbor extensive NBS gene repertoires, with the Angiosperm NLR Atlas documenting over 90,000 NLR genes across 304 angiosperm genomes, including approximately 18,707 TNL and 70,737 CNL genes [19]. This dramatic expansion represents one of the largest and most variable plant protein families.
Bryophytes present a striking contrast with considerably more constrained NBS gene numbers. The moss Physcomitrella patens contains only 65 NBS-encoding genes, while the liverwort Marchantia polymorpha possesses just 43 [6] [19]. This minimal repertoire in early-diverging land plant lineages suggests that the substantial gene expansion observed in angiosperms occurred later in plant evolutionary history, primarily within flowering plants [19].
Despite their smaller NBS gene families, bryophytes exhibit remarkable genetic innovation elsewhere in their genomes. Recent super-pangenome analysis incorporating 123 bryophyte genomes revealed that bryophytes possess a substantially larger diversity of gene families than vascular plants (637,597 versus 373,581 gene families) [13]. This includes a higher number of unique and lineage-specific gene families, suggesting that bryophytes have developed extensive genetic tools for ecological adaptation through mechanisms other than NBS gene expansion.
Table 2: Genomic Features of Bryophytes and Angiosperms
| Genomic Feature | Bryophytes | Angiosperms |
|---|---|---|
| Average Number of Gene Families | 637,597 | 373,581 |
| Average Number of Genes | 27,959 | 34,794 |
| Average Unique Gene Families per Taxon | 3,862 | 2,223 |
| NBS Gene Repertoire Size | Minimal (25 in P. patens) | Extensive (70,737 CNL genes across angiosperms) |
| Mechanisms of Gene Innovation | New gene formation, horizontal gene transfer from microbes | Gene duplication, whole genome duplication |
Methodological Framework for Phylogenetic Resolution
Experimental Approaches for NBS Gene Characterization
Resolving phylogenetic ambiguity requires robust experimental methodologies capable of distinguishing true evolutionary novelty from rapid divergence. The identification and characterization of NBS domain genes follows a multi-step process integrating computational genomics with experimental validation.
Genome-Wide Identification Protocols:
- Initial Sequence Retrieval: Obtain complete genome assemblies from public databases (NCBI, Phytozome, Plaza) for both bryophyte and angiosperm species [19].
- HMM-Based Domain Screening: Utilize PfamScan with Hidden Markov Models (HMM) of the NB-ARC domain (PF00931) to identify candidate NBS-encoding genes using a stringent e-value cutoff (1.1e-50) [19].
- Domain Architecture Annotation: Employ domain architecture analysis tools (e.g., Pfam, InterProScan) to classify NBS genes based on their associated domains and structural configurations [19].
- Orthogroup Construction: Perform comparative genomic analysis using OrthoFinder v2.5.1 with DIAMOND for sequence alignment and MCL for gene clustering to identify evolutionarily conserved orthogroups [19].
Experimental Validation Methods:
- RACE assays: Implement Rapid Amplification of cDNA Ends (RACE) to isolate full-length transcript sequences and verify domain predictions, particularly for novel NBS classes [6].
- Gene Expression Profiling: Conduct RNA-seq analysis under various biotic and abiotic stress conditions to assess functional conservation and divergence [19].
- Functional Characterization: Employ Virus-Induced Gene Silencing (VIGS) to validate the role of specific NBS genes in disease resistance pathways [19].
Diagram 1: Experimental workflow for comparative analysis of NBS domain genes
Analytical Techniques for Divergence Assessment
Distinguishing true novelty from rapid divergence requires sophisticated analytical approaches that account for various evolutionary pressures and potential confounding factors.
Molecular Evolutionary Analyses:
- Selection Pressure Assessment: Calculate nonsynonymous to synonymous substitution rates (dN/dS) using codon-based models (e.g., PAML, HyPhy) to identify sites under positive selection [55].
- Convergence Testing: Implement statistical tests for convergent evolution at the molecular level, particularly focusing on amino acid substitutions that might artificially inflate phylogenetic relationships [55].
- Gene Family Evolution: Reconstruct gene birth-death dynamics using tools like CAFE to model gene family expansion and contraction across lineages [13] [19].
Phylogenetic Reconstruction Methods:
- Data Partitioning Strategies: Compare phylogenetic signals from different data partitions, including amino acid sequences versus nucleotide sequences (particularly 3rd codon positions) to detect potential biases introduced by convergent evolution [55].
- Model Selection: Employ appropriate models of sequence evolution selected through criteria such as AIC or BIC to avoid model misspecification [55].
- Divergence Time Estimation: Implement relaxed molecular clock methods with multiple fossil calibrations to estimate divergence times and identify periods of accelerated evolution [56].
Case Studies in Phylogenetic Resolution
Bryophyte NBS Genes: True Evolutionary Novelty
The discovery of novel NBS domain architectures in bryophytes provides compelling evidence for true evolutionary novelty rather than rapid divergence from ancestral forms. Several lines of evidence support this interpretation:
First, the PNL class in Physcomitrella patens and HNL class in Marchantia polymorpha exhibit distinct intron positions and phase characteristics that differentiate them from canonical TNL and CNL classes [6]. These structural differences in gene architecture represent fundamental genomic innovations that are unlikely to result from rapid divergence alone.
Second, phylogenetic analyses covering all four classes of NBS-encoding genes (TNL, CNL, PNL, HNL) reveal a closer relationship between HNL, PNL and TNL classes, with the CNL class showing more divergent status [6]. This phylogenetic distribution suggests independent origins for these distinct domain architectures rather than rapid modification of a common ancestral form.
Third, the identification of chimerical gene structures with unique domain combinations implies origin through exon-shuffling during the early lineage separation processes of land plants [6]. This mechanism of gene birth represents genuine genomic innovation rather than modification of existing genetic material.
Apparent Divergence: Convergent Evolution in Plant Immunity
In contrast to the true novelty observed in bryophyte NBS genes, some apparent divergences between lineages actually represent cases of convergent evolution, where similar selective pressures lead to analogous outcomes through different genetic mechanisms.
Studies have demonstrated that even a relatively small proportion of convergent amino acid substitutions can strongly bias phylogenetic reconstruction, particularly when analyses are based on amino acid sequences [55]. For example, simulations show that a single convergent codon out of 400 can significantly impact topological inference under certain conditions [55].
This phenomenon has practical implications for interpreting NBS gene evolution. For instance, the independent expansion of specific NBS subfamilies in different angiosperm lineages in response to similar pathogen pressures might be misinterpreted as shared ancestry rather than convergent evolution [19]. Similarly, recurrent amino acid substitutions at key functional sites in NBS domains across distant lineages could create the illusion of phylogenetic affinity where none exists [55].
Diagram 2: Differentiation of evolutionary patterns in NBS gene evolution
Table 3: Essential Research Reagents and Resources for NBS Gene Analysis
| Category | Specific Tools/Reagents | Application/Function |
|---|---|---|
| Genomic Resources | Bryophyte genomes (P. patens, M. polymorpha) | Reference sequences for gene identification and comparative analysis |
| Angiosperm NBS gene databases (ANNA) | Curated collections of NBS genes for evolutionary comparisons | |
| Bioinformatics Tools | PfamScan/HMMER | Domain identification and classification |
| OrthoFinder | Orthogroup construction and evolutionary analysis | |
| MAFFT/FastTree | Multiple sequence alignment and phylogenetic reconstruction | |
| Experimental Reagents | β-glucosyl Yariv reagent | AGP purification and characterization [54] |
| RACE kits | Full-length cDNA isolation for novel transcript verification | |
| VIGS vectors | Functional validation of NBS gene function through silencing | |
| Analytical Resources | PAML/HyPhy | Selection pressure analysis and detection of convergent evolution |
| CAFE | Gene family evolution and birth-death dynamics |
Discussion and Future Perspectives
The comparative analysis of NBS domain architectures in bryophytes and angiosperms reveals a complex evolutionary history characterized by both deep conservation and striking innovation. The discovery of novel NBS classes in bryophytes (PNL and HNL) represents genuine evolutionary novelty that fundamentally expands our understanding of plant immune receptor diversity. These findings demonstrate that early land plant evolution involved more extensive experimentation with domain architectures than previously recognized, with only a subset of these innovations persisting in the vascular plant lineage.
Methodologically, resolving phylogenetic ambiguity requires integrative approaches that combine genomic, transcriptomic, and experimental validation. The reliance on multiple data types and analytical methods provides crucial validation against potential artifacts introduced by convergent evolution or rapid sequence divergence. Future research in this field would benefit from expanded taxonomic sampling, particularly from understudied bryophyte lineages, and functional characterization of novel NBS domains to elucidate their specific roles in plant immunity and other biological processes.
From an evolutionary perspective, the contrasting strategies of NBS gene evolution in bryophytes and angiosperms—limited repertoire with high architectural diversity versus expanded repertoire with conserved architectures—highlight different evolutionary solutions to the challenge of pathogen defense. This diversity of evolutionary strategies underscores the importance of considering multiple lineages when reconstructing general patterns of gene family evolution and developing comprehensive models of plant evolutionary history.
The resolution of phylogenetic ambiguity through careful comparison of domain architectures thus not only clarifies deep evolutionary relationships but also reveals the diverse genetic mechanisms underlying biological innovation across the plant kingdom.
Orphan Genes (OGs), also known as taxonomically restricted genes, represent a significant frontier in genomics, defined as genes that lack identifiable sequence homologs in other lineages. These enigmatic genetic elements can constitute up to 17% of all genes in a genome, with typical ranges of 1-5% across plant species, presenting a substantial challenge for functional annotation [57]. The "Orphan Gene Problem" refers to the significant difficulty in predicting the functions of these genes using standard comparative genomics approaches due to their rapid evolution and absence of recognizable domains or motifs in databases derived primarily from cultivated organisms [58].
In the specific context of plant immunity genes, particularly those encoding nucleotide-binding site (NBS) domains, this problem becomes particularly pronounced when comparing deeply divergent lineages such as bryophytes and angiosperms. While angiosperm NBS-encoding genes have been extensively classified into TIR-NBS-LRR (TNL) and CC-NBS-LRR (CNL) classes [26] [6], recent investigations into early land plants have revealed a surprising diversity of novel NBS architectures that defy this conventional classification [26] [6]. This article systematically compares the NBS domain architectures between bryophytes and angiosperms, providing experimental frameworks for characterizing these lineage-specific gene families and addressing the fundamental challenges they present to evolutionary and functional genomics.
Comparative Analysis of NBS Domain Architectures Across Land Plants
Bryophyte-Specific NBS Architectures: Novel Structural Classes
Genomic surveys of bryophytes, representing the most ancient lineages of land plants, have revealed unexpected diversity in NBS-encoding genes that substantially expands the known architectural repertoire beyond the classical TNL and CNL classes found in angiosperms.
Table 1: Novel NBS Domain Architectures Discovered in Bryophytes
| Architectural Class | Species Discovery | Domain Structure | Proposed Functional Role | Proportion of NBS Repertoire |
|---|---|---|---|---|
| PNL (Protein Kinase-NBS-LRR) | Physcomitrella patens (moss) | PK-NBS-LRR | Potential integration of kinase-mediated signaling with pathogen recognition | ~69% (45 of 65 NBS genes) [26] |
| HNL (Hydrolase-NBS-LRR) | Marchantia polymorpha (liverwort) | α/β-hydrolase-NBS-LRR | Possible hydrolytic activity coupled with defense signaling | ~84% (36 of 43 NBS genes) [6] |
| TNL (TIR-NBS-LRR) | Both moss and liverwort | TIR-NBS-LRR | Pathogen recognition and defense activation | ~7% in moss, ~16% in liverwort [26] [6] |
| CNL (CC-NBS-LRR) | Both moss and liverwort | CC-NBS-LRR | Pathogen recognition and defense activation | ~17% in moss, ~16% in liverwort [26] [6] |
The discovery of PNL and HNL classes in bryophytes demonstrates that early land plants evolved chimerical NBS architectures that fuse the core NBS-LRR framework with entirely different protein domains not observed in angiosperm NLRs. The PK domain in PNL genes potentially integrates protein kinase-mediated phosphorylation signals with pathogen recognition, while the α/β-hydrolase domain in HNL genes may confer catalytic activity alongside defense signaling [26] [6]. Phylogenetic analyses suggest a closer evolutionary relationship between HNL, PNL, and TNL classes, with CNL representing a more divergent lineage [6].
Angiosperm NBS Architectures: Expansion and Specialization
In contrast to bryophytes, angiosperm NBS-encoding genes have undergone substantial expansion and diversification primarily within the TNL, CNL, and RNL (RPW8-NBS-LRR) structural classes, with numerous species-specific architectural variants emerging through continuous evolution.
Table 2: Comparative NBS Gene Repertoire Across Land Plants
| Plant Group | Representative Species | Total NBS Genes | TNL Percentage | CNL Percentage | RNL Percentage | Novel Architectures |
|---|---|---|---|---|---|---|
| Liverworts | Marchantia polymorpha | 43 | 16% | 16% | 0% | 84% HNL [6] |
| Mosses | Physcomitrella patens | 65 | 7% | 17% | 0% | 69% PNL [26] |
| Basal Angiosperms | Euryale ferox | 131 | 56% | 31% | 14% | Limited novel architectures [59] |
| Crops | Gossypium hirsutum (cotton) | Hundreds to thousands | Variable | Variable | Variable | Species-specific variants [19] |
Angiosperm NBS genes exhibit several distinctive evolutionary trends compared to bryophytes. They display massive repertoire expansion, with some species containing hundreds to thousands of NBS-encoding genes compared to the幾十 (dozens) typically found in bryophytes [19] [59]. There is functional specialization into "sensor" (TNL, CNL) and "helper" (RNL) NLRs, a distinction not observed in bryophytes [59]. They are frequently organized in complex clusters resulting from tandem duplications, whereas bryophyte NBS genes show simpler genomic distributions [59]. Research has also identified significant lineage-specific structural variations, such as unusual domain combinations including TIR-NBS-TIR-Cupin1-Cupin1 and TIR-NBS-Prenyltransf observed in comprehensive surveys across 34 plant species [19].
Evolutionary Significance of Lineage-Specific NBS Architectures
The striking architectural differences between bryophyte and angiosperm NBS genes reflect deep evolutionary divergences in plant immune system organization. The presence of novel classes like PNL and HNL in bryophytes suggests that early land plants experimented with diverse domain combinations before the TNL/CNL/RNL paradigm became stabilized in angiosperms [26] [6]. Recent super-pangenome analyses of 123 bryophyte genomes reveal that bryophytes possess substantially more unique and lineage-specific gene families than vascular plants, highlighting their extensive genetic innovation throughout evolution [16].
These lineage-specific NBS architectures likely represent evolutionary innovations tailored to distinct pathogen pressures and physiological constraints. The dominance of PNL genes in moss and HNL genes in liverwort suggests lineage-specific adaptations possibly related to their different life history strategies and habitat preferences [26] [6]. The evolutionary trajectory shows a trend toward architectural simplification from multiple novel classes in early-diverging lineages to the conserved TNL/CNL/RNL framework in angiosperms, possibly reflecting optimization of immune signaling networks [26] [6] [59].
Methodological Framework for Characterizing Lineage-Specific Genes
Genomic Identification and Annotation Pipeline
The reliable identification and annotation of lineage-specific NBS genes requires specialized approaches that address their unique characteristics, including rapid sequence evolution, atypical domain architectures, and absence of close homologs in reference databases.
Figure 1: Computational workflow for identifying and validating lineage-specific NBS genes, incorporating both sequence-based and evolutionary evidence.
The initial identification of NBS-encoding genes typically begins with HMMER searches using the NB-ARC domain (Pfam: PF00931) as query, followed by BLAST searches against non-redundant databases to identify divergent homologs [19] [59]. For lineage-specific NBS genes, several validation criteria are essential: testing for purifying selection (dN/dS < 0.5) to distinguish functional genes from pseudogenes, confirming expressibility through RNA-seq data or RT-PCR, and analyzing synteny conservation where possible to identify true orthologs [58]. Domain architecture analysis using tools like CDD and Pfam reveals novel domain combinations, while orthogroup clustering with tools like OrthoFinder helps distinguish lineage-specific families from widely conserved ones [19].
Experimental Characterization of Novel NBS Classes
Functional characterization of novel NBS classes requires integrated approaches combining molecular biology, biochemistry, and phenotypic assays. The discovery of PNL and HNL classes in bryophytes exemplifies the experimental framework needed to validate lineage-specific NBS genes.
Structural and Biochemical Characterization:
- RACE (Rapid Amplification of cDNA Ends): Essential for obtaining full-length transcripts of novel NBS genes, as demonstrated in the characterization of M. polymorpha HNL genes where 5'- and 3'-RACE confirmed the fusion of α/β-hydrolase domains with NBS-LRR frameworks [6].
- Domain-Specific Functional Assays: For PNL genes, protein kinase assays validate the enzymatic activity of the novel N-terminal domain; for HNL genes, hydrolase activity tests confirm the predicted catalytic function of the fused domain [26].
- Structural Modeling and Prediction: Tools like ColabFold generate protein structure predictions that can reveal unexpected similarities to known proteins despite low sequence conservation, as successfully applied to characterize novel gene families from uncultivated taxa [58].
Functional Validation in Plant Immunity:
- Virus-Induced Gene Silencing (VIGS): Effective for functional characterization in non-model plants, as demonstrated by silencing of GaNBS (OG2) in resistant cotton, which confirmed its role in defense against cotton leaf curl disease [19].
- Heterologous Expression Systems: Expressing novel NBS genes in model plants like Arabidopsis or Nicotiana benthamiana to test for constitutive defense activation or enhanced pathogen resistance.
- Protein-Protein Interaction Studies: Co-immunoprecipitation and yeast two-hybrid screens to identify interaction partners of novel NBS domains, elucidating their position in defense signaling networks.
Expression Profiling and Regulatory Analysis
Lineage-specific genes often exhibit distinctive expression patterns characterized by lower overall expression levels and higher tissue specificity compared to conserved genes [60] [16]. Comprehensive expression analysis is therefore crucial for understanding their biological roles.
Multi-Condition Transcriptomics:
- Tissue-Specific Expression: Orphan genes in Cucurbitaceae species show predominant expression in male flowers, suggesting specialized roles in reproductive processes [60].
- Stress-Responsive Profiling: Many orphan genes exhibit induced expression under biotic and abiotic stresses, as observed in rice and Arabidopsis where numerous OGs respond to pathogen challenge and environmental stresses [57].
- Single-Cell Expression Analysis: Particularly valuable for bryophytes with dominant gametophyte generations, enabling resolution of expression patterns in specific cell types potentially involved in pathogen recognition.
Regulatory Mechanism Investigation:
- Promoter Analysis: Identification of cis-regulatory elements that drive the distinctive expression patterns of lineage-specific NBS genes.
- Epigenetic Profiling: Characterization of chromatin states and DNA methylation patterns that may influence the regulation of rapidly evolving gene families.
- Non-coding RNA Interactions: Investigation of potential regulation by miRNAs or siRNAs, which have been shown to target conserved motifs within NBS genes in angiosperms [19].
Table 3: Key Research Reagent Solutions for Lineage-Specific Gene Characterization
| Reagent/Resource | Specific Application | Function and Utility | Example Implementation |
|---|---|---|---|
| HMMER Suite | Domain-based gene identification | Identifies divergent NBS domains using profile hidden Markov models | NB-ARC domain (PF00931) searching in bryophyte genomes [19] [59] |
| OrthoFinder | Gene family clustering | Groups genes into orthogroups based on sequence similarity, identifying lineage-specific families | Comparative analysis of NBS genes across multiple species [19] |
| RACE Systems | Full-length transcript amplification | Obtains complete coding sequences when genomic annotations are incomplete | Characterization of M. polymorpha HNL gene structures [6] |
| VIGS Vectors | Functional gene validation | Rapidly tests gene function through targeted silencing in non-model plants | GaNBS silencing in cotton for CLCuD resistance validation [19] |
| ColabFold | Protein structure prediction | Generates 3D structure models using AlphaFold2 for functional hypothesis generation | Structural characterization of novel gene families from uncultivated taxa [58] |
| dN/dS Calculation Tools | Evolutionary analysis | Tests for purifying selection to confirm functional significance | Validation of FESNov gene families in uncultivated prokaryotes [58] |
The systematic comparison of NBS domain architectures between bryophytes and angiosperms reveals deep evolutionary plasticity in plant immune genes, with lineage-specific innovations playing crucial roles in adapting to distinct pathogenic challenges. The discovery of novel classes like PNL and HNL in bryophytes underscores the limitations of angiosperm-centric models and highlights the value of broad taxonomic sampling in evolutionary genomics.
Addressing the orphan gene problem requires integrated methodologies that combine sophisticated computational identification with rigorous experimental validation. The experimental frameworks presented here for characterizing lineage-specific NBS genes provide a roadmap for functional analysis of rapidly evolving gene families beyond the well-established model systems. As genomic resources continue to expand across the plant tree of life, particularly for non-model organisms like bryophytes [16] [61], opportunities will grow to explore the full diversity of plant immune systems and harness lineage-specific genes for crop improvement strategies.
Future research should prioritize the development of more sensitive homology detection methods, expanded functional screening platforms, and enhanced computational prediction of protein structure-function relationships specifically optimized for rapidly evolving gene families. Through these advances, the scientific community can transform the "orphan gene problem" from a computational challenge into a source of biological discovery, revealing novel mechanisms of plant immunity that have remained hidden through conventional comparative genomics approaches.
Optimizing Primer Design for Degenerate PCR in Non-Model Organisms
Genomic research has increasingly expanded beyond traditional model organisms, driven by the need to understand the vast diversity of plant biology. Degenerate polymerase chain reaction (PCR) has emerged as a critical technique for investigating genes across divergent species, particularly when working with non-model organisms where complete genome sequences are unavailable. This approach is especially valuable for studying large, diverse gene families such as the nucleotide-binding site (NBS) domain-containing genes, which constitute the largest family of plant disease resistance (R) genes [19].
The evolutionary context of these genes presents both challenges and opportunities for researchers. Recent studies have revealed that bryophytes (mosses, liverworts, and hornworts) and angiosperms (flowering plants) display significant divergence in their NBS domain architectures. While angiosperms primarily possess TIR-NBS-LRR (TNL) and CC-NBS-LRR (CNL) classes, bryophytes have been found to contain novel configurations such as PK-NBS-LRR (PNL) and Hydrolase-NBS-LRR (HNL) classes [26] [6]. This architectural diversity complicates primer design while offering fascinating insights into plant evolution and adaptation.
This guide provides a comprehensive comparison of degenerate PCR optimization strategies specifically for NBS domain research, presenting experimental data and protocols to maximize success rates across diverse plant lineages.
NBS Domain Diversity: Bryophytes vs. Angiosperms
Architectural Divergence Across Plant Lineages
The NBS domain gene family exhibits remarkable structural diversity across the plant kingdom, reflecting divergent evolutionary paths. Understanding these differences is crucial for designing effective degenerate primers that can capture the full spectrum of NBS genes in non-model organisms.
Table 1: Comparative Analysis of NBS Domain Architectures in Bryophytes and Angiosperms
| Feature | Bryophytes | Angiosperms |
|---|---|---|
| Major NBS Classes | PNL (PK-NBS-LRR), HNL (Hydrolase-NBS-LRR), CNL, TNL | CNL, TNL, RNL (RPW8-NBS-LRR) |
| Representative Species | Physcomitrella patens (moss), Marchantia polymorpha (liverwort) | Arabidopsis thaliana, Oryza sativa, Euryale ferox |
| Gene Family Complexity | 65 NBS genes in P. patens [26] | 131 NBS genes in E. ferox [59] |
| Unique Characteristics | Protein kinase (PK) and α/β-hydrolase domains at N-terminus [6] | RPW8 domain at N-terminus for helper NLRs (RNL class) [59] |
| Genomic Distribution | Clustered and singleton arrangements | Primarily clustered in complex genomes |
Recent research has revealed that bryophytes possess a substantially larger gene family space than vascular plants, with a higher number of unique and lineage-specific gene families originating from extensive new gene formation and continuous horizontal transfer of microbial genes over their long evolutionary history [13]. This diversity presents both challenges and opportunities for researchers using degenerate PCR to explore NBS genes in these non-model organisms.
Evolutionary Insights from Comparative Genomics
The evolutionary trajectory of NBS genes reveals why degenerate primer design must be tailored to specific plant lineages. Bryophytes, as the sister group to all living vascular plants, diverged approximately 500 million years ago and have since followed independent evolutionary paths [13]. This deep divergence has resulted in:
- Novel domain combinations not found in angiosperms, such as the PNL and HNL classes discovered in bryophytes [6]
- Different intron positions and phases that reflect the chimerical structures of HNL, PNL and TNL genes, suggesting possible origin via exon-shuffling during early land plant evolution [26]
- Expanded gene family diversity in bryophytes compared to vascular plants (637,597 versus 373,581 gene families) despite smaller genome sizes [13]
These evolutionary patterns directly impact primer binding site conservation and must be considered when designing degenerate primers for cross-species applications.
Primer Design Strategies: Balancing Specificity and Degeneracy
Foundational Principles for Degenerate Primer Design
Degenerate primers are mixtures of similar primer sequences that incorporate variations at specific positions to account for the degeneracy of the genetic code. This approach is essential when the precise nucleotide sequence of the target DNA is unknown but can be inferred from amino acid sequences [62]. Effective design requires balancing several competing factors:
- Minimize 3' end degeneracy: Avoid degeneracy in the 3 nucleotides at the 3' end, using Met- or Trp-encoding triplets when possible due to their single-codon representation [62]
- Control degeneracy level: Design primers with less than 4-fold degeneracy at any given position to maintain annealing efficiency [62]
- Optimize primer length: Include between 6 and 7 amino acids in the primers, equating to approximately 15-20 base pairs [63]
- Target conserved regions: Position forward and reverse primers in more conserved regions—the less degenerate, the further apart these can be [63]
Table 2: Codon Usage Strategies for Reducing Primer Degeneracy
| Amino Acid | Codon Options | Degeneracy | Recommendation |
|---|---|---|---|
| Methionine (M) | ATG | 1 | Ideal for 3' end |
| Tryptophan (W) | TGG | 1 | Ideal for 3' end |
| Leucine (L) | TTA, TTG, CTT, CTC, CTA, CTG | 6 | Avoid in high-degeneracy regions |
| Serine (S) | TCT, TCC, TCA, TCG, AGT, AGC | 6 | Avoid in high-degeneracy regions |
| Arginine (R) | CGT, CGC, CGA, CGG, AGA, AGG | 6 | Avoid in high-degeneracy regions |
| Lysine (K) | AAA, AAG | 2 | Moderate degeneracy |
Computational Tools for Degenerate Primer Design
Several specialized software tools can assist in designing degenerate primers while managing complexity:
- iCODEHOP (COnsensus-DEgenerate Hybrid Oligonucleotide Primers): Generates the minimum number of degenerate primers while maintaining optimal PCR requirements [63]
- NCBI Primer-BLAST: Allows designing degenerate primers while checking specificity against known sequences [63]
- HYDEN (HighlY DEgeNerate primers): Specialized for handling highly degenerate primer sets [63]
These tools utilize multiple sequence alignments of related proteins to identify conserved regions and calculate optimal degenerate primer sequences, significantly improving success rates compared to manual design.
Experimental Optimization and Validation
PCR Protocol Optimization for Degenerate Primers
Standard PCR protocols often require modification when using degenerate primers due to the mixture of sequences and potential for non-specific binding. Based on experimental data from successful NBS gene isolation studies, the following optimizations are recommended:
- Initial primer concentration: Begin with a primer concentration of 0.2 µM [62]
- Concentration adjustments: In case of poor PCR efficiency, increase primer concentrations in increments of 0.25 µM until satisfactory results are obtained [62]
- Touchdown PCR protocols: Implement progressive annealing temperature reduction to enhance specificity while maintaining sensitivity
- Additive incorporation: Include betaine or DMSO to reduce secondary structure formation and improve amplification of AT- or GC-rich regions
Experimental research on NBS genes in bryophytes successfully applied these principles to identify novel gene classes. For example, the discovery of PNL genes in Physcomitrella patens and HNL genes in Marchantia polymorpha required carefully optimized degenerate PCR protocols that accounted for the unique domain architectures of these non-angiosperm plants [6].
Addressing Amplification Bias in Multi-Template PCR
A significant challenge in degenerate PCR is the non-homogeneous amplification efficiency across different templates, which can result in skewed representation of target sequences. Recent research has demonstrated that:
- Sequence-specific factors independent of GC content significantly impact amplification efficiency [64]
- Just a 5% reduction in amplification efficiency relative to other templates can lead to approximately 50% under-representation after only 12 PCR cycles [64]
- Adapter-mediated self-priming has been identified as a major mechanism causing low amplification efficiency, challenging long-standing PCR design assumptions [64]
Advanced approaches to mitigate these biases include:
- Unique molecular identifiers (UMIs) to account for amplification skewing in quantitative applications [64]
- Deep learning models (e.g., 1D-CNNs) that predict sequence-specific amplification efficiencies based on sequence information alone, achieving high predictive performance (AUROC: 0.88) [64]
Degenerate Primer Design Workflow: A systematic approach to designing effective degenerate primers for non-model organisms.
Case Study: NBS Gene Isolation in Bryophytes
Experimental Protocol for Bryophyte NBS Gene Discovery
The groundbreaking discovery of novel NBS gene classes in bryophytes provides an excellent case study in optimized degenerate primer application. The experimental approach included [6]:
- Sample Preparation: Collected fresh gametophytic tissues of Marchantia polymorpha and Physcomitrella patens
- RNA Extraction: Used standard Trizol-based methods with additional purification steps
- Degenerate Primer Design:
- Designed based on conserved motifs within the NBS domain (P-loop, RNBS-A, Kinase-2, RNBS-B, RNBS-C, GLPL, RNBS-D, MHDV)
- Targeted regions approximately 200-500 base pairs for optimal PCR amplification
- Positioned primers in conserved regions with minimal 3' degeneracy
- PCR Amplification:
- Reaction volume: 25 µL
- Primer concentration: 0.2-0.5 µM (optimized empirically)
- Touchdown protocol: Initial annealing at 55°C, decreasing by 0.5°C per cycle for 15 cycles, followed by 25 cycles at constant annealing temperature
- Cloning and Sequencing: Gel-purified PCR products were cloned, and 416 clones were picked and sequenced
- Sequence Analysis: 389 obtained sequences were homologous to NBS domain, yielding 43 non-redundant NBS-encoding genes
This methodology successfully identified 36 novel NBS sequences in M. polymorpha that did not belong to any known TNL, CNL, or PNL classes, leading to the discovery of the HNL class [6].
Troubleshooting Common Issues in Degenerate PCR
Based on experimental data from bryophyte studies, common challenges and solutions include:
- Low yield or no product: Increase primer concentration incrementally (0.25 µM steps) and extend annealing time [62]
- Non-specific amplification: Implement touchdown PCR or increase annealing temperature gradually
- Skewed representation of targets: Incorporate betaine (1-1.3 M final concentration) to equalize amplification efficiency across templates
- Incomplete gene coverage: Use 5'- and 3'-RACE (Rapid Amplification of cDNA Ends) to obtain full-length sequences after initial degenerate PCR identification [6]
Research Reagent Solutions Toolkit
Table 3: Essential Research Reagents for Degenerate PCR in Non-Model Organisms
| Reagent/Category | Specific Examples | Function/Application |
|---|---|---|
| Polymerase Systems | High-fidelity DNA polymerases with proofreading activity | Reduces mutation rates during amplification of complex mixtures |
| Cloning Kits | TA cloning kits, blunt-end cloning systems | Facilitates efficient cloning of degenerate PCR products |
| RNA Extraction Kits | Trizol-based systems, column purification kits | High-quality RNA from challenging bryophyte tissues |
| RACE Systems | 5'- and 3'-RACE kits | Obtains full-length cDNA sequences after initial degenerate PCR |
| Specialized Additives | Betaine, DMSO, BSA | Improves amplification efficiency and reduces bias |
| Vector Systems | pGEM-T Easy, other TA vectors | Efficient cloning of PCR products with A-overhangs |
Degenerate PCR remains an indispensable tool for exploring gene families in non-model organisms, particularly for investigating the diverse NBS domain architectures across bryophytes and angiosperms. The key to success lies in carefully balanced primer design that maintains adequate degeneracy to capture unknown variants while preserving sufficient specificity for efficient amplification.
The experimental evidence presented demonstrates that lineage-specific considerations are critical when designing degenerate primers for cross-species applications. The discovery of novel NBS classes in bryophytes underscores the importance of these optimized approaches for uncovering evolutionary innovations that would remain hidden with angiosperm-centric experimental designs.
As genomic resources continue to expand for non-model organisms, degenerate PCR will maintain its essential role as a bridge between comparative genomics and functional studies, enabling researchers to unravel the genetic basis of plant adaptation and diversification across the entire plant kingdom.
Handling Gene Fragmentation and Pseudogenes in Genomic Assemblies
The study of nucleotide-binding site (NBS) domain architectures, particularly in plant disease resistance (R) genes, provides critical insights into plant immunity mechanisms across evolutionarily diverse species. However, genomic assembly quality substantially impacts the accurate characterization of these genes, with gene fragmentation and pseudogenization representing major analytical challenges. These issues are particularly pronounced when comparing lineages with distinct genomic architectures, such as bryophytes (mosses, liverworts, and hornworts) and angiosperms (flowering plants).
Gene fragmentation in assemblies occurs when sequencing or assembly errors disrupt single genes into multiple contigs, creating artificial gene fragments that misrepresent true genomic structure. Pseudogenes are defunct genomic sequences homologous to functional genes but containing disablements (premature stop codons, frameshifts, or structural disruptions) that abolish protein function [65]. Addressing these artifacts is essential for accurate evolutionary comparisons, particularly for rapidly evolving gene families like NBS-leucine-rich repeat (LRR) genes that exhibit remarkable diversification across land plants.
Comparative Genomics of NBS Domain Architectures: Bryophytes vs. Angiosperms
Diversity and Distribution of NBS-Type Genes
NBS-containing genes encode critical immune receptors that recognize pathogen-derived molecules and initiate defense responses. Comprehensive genomic surveys reveal striking differences in the composition and architecture of these genes between bryophytes and angiosperms.
Table 1: Comparative Analysis of NBS Domain Genes in Bryophytes and Angiosperms
| Characteristic | Bryophytes | Angiosperms | Research Implications |
|---|---|---|---|
| Genomic Diversity | Larger cumulative gene family space (637,597 nonredundant families) [13] | Smaller cumulative gene family space (373,581 nonredundant families) [13] | Bryophytes offer expanded genetic repertoire for immunity studies |
| NBS-LRR Representation | Relatively small NLR repertoires (e.g., ~25 NLRs in Physcomitrella patens) [19] | Extensive NLR repertoires (e.g., 18,707 TNLs, 70,737 CNLs in angiosperm atlas) [19] | Differential expansion of immune receptor families |
| Unique Gene Families | Higher average number per taxon (3,862) [13] | Lower average number per taxon (2,223) [13] | Bryophytes contain substantial lineage-specific innovation |
| Domain Architecture Patterns | Species-specific structural patterns observed [19] | Classical patterns (NBS, NBS-LRR, TIR-NBS, TIR-NBS-LRR) prevalent [19] | Distinct evolutionary trajectories in immune receptor configuration |
| TIR Domain Presence | Present in some bryophyte species (e.g., 12 VmNBS-LRRs contained TIR domains in Vernicia montana) [4] | Absent in some angiosperm lineages (e.g., lost in Vernicia fordii and monocots) [4] | Lineage-specific domain loss events |
Genomic Features Influencing Assembly Quality
Fundamental differences in genomic architecture between bryophytes and angiosperms present distinct assembly challenges:
- Bryophyte genomes are relatively small but exhibit substantial gene family diversity with numerous unique and accessory gene families [13]. Their genome size evolution shows distinct patterns in each bryophyte lineage (hornworts, liverworts, mosses) that are not correlated with whole-genome duplication events [66].
- Angiosperm genomes, particularly those of crops, often experience recent polyploidization events and possess complex repetitive landscapes that complicate assembly [19].
- Plastome structural variation in mosses demonstrates considerable size variability (122,213 bp in Funaria hygrometrica to 149,016 bp in Takakia lepidozioides) mediated by inverted repeat loss, gene absence, and intergenic space reduction [67].
Technical Approaches for Handling Gene Fragmentation
Error Detection and Correction Methods
Gene-fragmenting errors in draft assemblies introduce frameshifts and premature stop codons that pseudogenize functional genes. Long-read sequencing technologies, while generating highly contiguous assemblies, exhibit higher relative error rates that exacerbate this problem [68].
Table 2: Approaches for Addressing Gene Fragmentation in Genomic Assemblies
| Method | Mechanism | Advantages | Limitations |
|---|---|---|---|
| Kastor | Reference-based comparative approach detecting gene-fragmenting errors through alignment with curated reference genomes [68] | Reduces pseudogenes from 23.3% to 5.6% in example assemblies; doesn't require additional sequencing [68] | Effectiveness depends on quality and phylogenetic proximity of reference genomes |
| Hybrid Assembly | Combination of long-read and short-read sequencing with polishing [68] | Achieves >99.99% accuracy; resolves repetitive regions [68] | Higher cost and computational requirements |
| Medaka/Nanopolish | Long-read-based polishing using signal data or consensus [68] | Effective for homopolymer error correction | Less effective for complex structural errors |
| Polypolish/FMLRC2 | Short-read polishing of long-read assemblies [68] | Leverages high accuracy of short reads | Mapping challenges in repetitive regions |
Experimental Workflow for Error Correction
The following diagram illustrates a integrated workflow for addressing gene fragmentation using the Kastor approach combined with complementary techniques:
Kastor Implementation Protocol:
- Input Preparation: Collect draft assembly and curated reference genome sequences from closely related species.
- Comparative Analysis: Perform pairwise alignments to identify consistent differences marked as candidate errors.
- Error Validation: Cross-reference candidate errors with raw read data to confirm genuine assembly artifacts.
- Correction Implementation: Adjust or remove validated errors using supported corrections.
- Validation: Assess improvements through pseudogene reduction rates and BUSCO completeness scores [68].
Strategies for Pseudogene Identification and Analysis
Classification and Characterization of Pseudogenes
Pseudogenes are classified into distinct categories based on their mechanism of origin and structural attributes:
- Non-processed (duplicated) pseudogenes: Arise from genome or chromosomal duplications, typically retaining the exon-intron structure of ancestral genes [65].
- Processed (retroposed) pseudogenes: Derive from reverse-transcribed mRNA integration, lacking introns and often containing poly-A tails and flanking direct repeats [65].
- Fragmented pseudogenes: Represent partial gene duplicates missing significant portions of the parental coding sequence.
- Single-exon pseudogenes: Intron-less sequences derived from multi-exon parental genes.
In plants, non-processed pseudogenes significantly outnumber processed types, contrasting with mammalian genomes where retroposition dominates pseudogene formation [65]. This indicates double-strand break repair mechanisms rather than retroposition drive sequence duplication in plant genomes.
Experimental Framework for Pseudogene Identification
Accurate pseudogene identification requires integrated bioinformatic approaches:
Detailed Methodology:
- Homology Search: Use tBlastN to identify genomic regions with similarity to functional coding sequences but lacking complete coding capacity [65].
- Structural Annotation: Compare genomic regions with parental gene models to determine exon-intron structure.
- Disablement Identification: Identify frameshifts, premature stop codons, and splice site mutations that disrupt coding potential.
- Classification: Categorize pseudogenes based on structural features relative to parental genes.
- Evolutionary Analysis: Assess selection pressures, duplication mechanisms, and evolutionary trajectories.
Table 3: Key Research Reagents and Computational Tools for Handling Gene Fragmentation and Pseudogenes
| Tool/Resource | Function | Application Context |
|---|---|---|
| Kastor Software | Gene-fragmenting error detection and correction [68] | Reference-based assembly polishing without additional sequencing |
| OrthoFinder | Orthogroup inference and comparative genomics [19] | Evolutionary analysis of NBS genes across species |
| BUSCO | Assembly completeness assessment using universal single-copy orthologs [68] | Quality evaluation of genome assemblies and annotations |
| PfamScan | Protein domain identification and classification [19] | NBS domain architecture characterization |
| CpGAVAS2 | Plastome annotation and validation [67] | Organellar genome analysis in bryophytes |
| tRNAscan-SE | tRNA gene detection [67] | Comprehensive genome annotation |
| DIAMOND | Accelerated sequence similarity searches [19] | Large-scale comparative analyses |
| VIGS (Virus-Induced Gene Silencing) | Functional validation of candidate NBS genes [19] [4] | Experimental confirmation of disease resistance gene function |
Accurate handling of gene fragmentation and pseudogenes is paramount for meaningful evolutionary comparisons of NBS domain architectures between bryophytes and angiosperms. The presented approaches enable researchers to distinguish genuine evolutionary differences from technical artifacts, revealing that bryophytes maintain a larger gene family space despite their morphological simplicity [13]. Reference-based correction tools like Kastor significantly improve assembly quality, reducing pseudogene rates from >23% to <6% in long-read assemblies [68]. These methodological advances support more accurate characterization of plant immune gene evolution, facilitating the discovery of novel resistance mechanisms from bryophyte genomes that might be harnessed for crop improvement.
Validating Evolutionary Divergence: A Head-to-Head Comparison of Bryophyte and Angiosperm NBS Genes
The study of genes at a pan-genomic scale—encompassing the entire gene repertoire across individuals and varieties within a species or lineage—has revolutionized our understanding of plant evolution, adaptation, and functional diversity. Two critical areas where pan-genomic analyses provide profound insights are the evolution of disease resistance genes and the origin of novel genetic functions. This guide objectively compares the performance of different genomic approaches for analyzing nucleotide-binding site (NBS) domain architectures across the evolutionary divide between bryophytes and angiosperms, while simultaneously quantifying the phenomenon of orphan genes that lack recognizable homologs in other lineages. We present supporting experimental data and standardized protocols to enable researchers to conduct robust cross-species comparative analyses, with particular relevance for scientists investigating plant-pathogen interactions and novel gene discovery for pharmaceutical development.
Methodological Framework for Pan-Genomic Comparisons
Orthology Inference and Gene Family Classification
The foundation of reliable pan-genomic comparison rests on accurate orthology inference. The PlantTribes framework provides a scalable solution for objective gene family classification using graph-based clustering algorithms, primarily MCL (Markov Cluster Algorithm) [69] [70]. The standard workflow begins with all-against-all BLASTP searches of proteomes (e-value cutoff: 1e-10), followed by MCL clustering at multiple stringency levels (inflation parameters: I=1.2, 3.0, 5.0) to generate orthologous gene families, or "tribes" [69]. For specialized analyses focusing on specific gene families such as NBS-encoding genes, HMMER with Pfam domain models (e.g., NB-ARC domain, PF00931) provides additional precision, typically using an e-value cutoff of 1e-50 [19].
Table 1: Standard Parameters for Gene Family Identification
| Analysis Type | Tool | Key Parameters | Typical E-value Cutoff | Application Scope |
|---|---|---|---|---|
| Genome-wide orthology | OrthoFinder + MCL | Inflation=1.2-5.0 | 1e-10 | Cross-species gene families |
| Domain-focused identification | HMMER/PfamScan | NB-ARC domain (PF00931) | 1e-50 | NBS gene identification |
| Orphan gene detection | BLAST suite | Species-specific filtering | 1e-01 to 1e-10 | Lineage-specific genes |
| Synteny-based validation | Cactus/MCScanX | Progressive alignment | N/A | De novo gene verification |
Orphan Gene Identification Pipeline
Orphan genes (OGs), also termed taxonomically restricted genes, are identified through homology-based filtering against comprehensive databases. The standard protocol employs BLASTP or TBLASTN with sequential filters: initial e-value cutoff (typically 1e-10), followed by iterative searches against expanding taxonomic groups [71] [72]. For example, species-specific OGs are identified when no significant hits are found in any other species, while lineage-specific OGs (e.g., bryophyte-specific) lack homologs outside the lineage. The ORFanFinder pipeline automates this process with configurable e-value thresholds and taxonomic scopes [72]. Recent advancements incorporate synteny-based detection using tools like Cactus for whole-genome alignments to distinguish true de novo genes from rapidly diverging sequences [73].
Comparative Analysis of NBS Domain Architectures: Bryophytes vs. Angiosperms
Domain Architecture Diversity
The NBS domain gene superfamily represents a crucial component of plant innate immunity, exhibiting remarkable architectural diversity across land plants. Comparative analysis between bryophytes and angiosperms reveals both conserved and lineage-specific structural innovations.
Table 2: NBS Domain Architecture Comparison Between Bryophytes and Angiosperms
| Architectural Class | Domain Composition | Bryophyte Representation | Angiosperm Representation | Remarks |
|---|---|---|---|---|
| TNL | TIR-NBS-LRR | Limited (3 intact in P. patens) | Extensive expansion | Ancestral class with differential expansion |
| CNL | CC-NBS-LRR | Moderate (9 intact in P. patens) | Dominant class (70,737 in angiosperms) | Major expansion in flowering plants |
| PNL | PK-NBS-LRR | Moss-specific (45 in P. patens) | Absent | Bryophyte innovation with kinase domain |
| HNL | Hydrolase-NBS-LRR | Liverwort-specific (36 in M. polymorpha) | Absent | α/β-hydrolase domain fusion |
| RNL | RPW8-NBS-LRR | Limited | Moderate (1,847 in angiosperms) | Signal transduction component |
The architectural diversity of NBS genes reveals profound evolutionary trajectories. In the moss Physcomitrella patens, comprehensive genome screening identified 65 NBS-encoding genes, with the surprising discovery of a novel PNL class (Protein Kinase-NBS-LRR) comprising 45 members, representing approximately two-thirds of its NBS repertoire [6]. Equally remarkable, the liverwort Marchantia polymorpha employs a different innovation, with 36 of its 43 NBS-encoding genes belonging to the HNL class (Hydrolase-NBS-LRR), featuring an N-terminal α/β-hydrolase domain [6]. This stands in stark contrast to angiosperms, where the CNL and TNL classes dominate, with the Angiosperm NLR Atlas documenting 70,737 CNL and 18,707 TNL genes across 304 angiosperm species [19].
Genomic Distribution and Evolutionary Dynamics
The quantitative disparity in NBS gene repertoires between bryophytes and angiosperms is striking. While bryophytes like P. patens and Selaginella moellendorffii maintain modest NBS repertoires of approximately 25 and 2 genes respectively, angiosperms frequently possess hundreds to thousands of these genes [19]. This expansion is primarily attributed to tandem duplications and whole-genome duplications in flowering plants, with subsequent functional diversification.
Orthogroup analysis across 34 plant species reveals 603 NBS orthogroups (OGs), with certain core orthogroups (OG0, OG1, OG2) conserved across land plants, while others (OG80, OG82) exhibit species-specific distributions [19]. Expression profiling demonstrates that these orthogroups respond differentially to biotic and abiotic stresses, with OG2, OG6, and OG15 showing particular upregulation in response to pathogen challenge [19].
Diagram Title: NBS Gene Analysis Workflow
Orphan Genes: Quantification and Characteristics
Genomic Distribution and Identification
Orphan genes (OGs), defined as genes lacking detectable homologs outside a specific taxonomic group, represent a significant component of plant genomes, contributing to lineage-specific adaptations. Quantitative analyses reveal that OGs typically constitute 1-17% of plant gene catalogs, with 1-5% being the normal range, though some species contain up to 30% OGs in their genomes [71] [72].
Table 3: Orphan Gene Distribution Across Plant Lineages
| Plant Species/Lineage | Total Genes | Orphan Genes | Percentage | Identification Method |
|---|---|---|---|---|
| Arabidopsis thaliana | ~27,000 | 1,369-2,099 | 5.1-7.8% | BLAST (E=1e-10) |
| Oryza sativa | ~42,000 | 638-1,926 | 1.5-4.6% | BLAST/BLAT |
| Triticum aestivum | ~150,000 | 993 | 0.7% | Homology search (94 species) |
| Bryophytes | Varies | Lineage-specific | 5-15% (estimated) | Comparative genomics |
| Poaceae family | Varies | 1,178 | Lineage-specific | Phylogenetic distribution |
Molecular Characteristics and Evolutionary Origins
Orphan genes exhibit distinctive molecular signatures compared to conserved genes. They typically encode shorter proteins (often <100 amino acids), contain fewer exons, display higher isoelectric points, and are enriched in intrinsically disordered regions [71] [73]. These features may facilitate rapid functional exploration and adaptation. OGs also show restricted spatiotemporal expression patterns, often being activated during specific developmental stages or in response to environmental stresses [73] [72].
The origins of OGs involve multiple mechanisms:
- De novo origination from non-coding genomic regions, facilitated by transposable elements that provide regulatory sequences [73]
- Rapid divergence following gene duplication events, resulting in loss of detectable homology [71]
- Horizontal gene transfer, though less common in plants [71]
- Exon shuffling and gene fusion events creating novel combinations [6]
Experimental Validation and Functional Analysis
Functional Characterization of NBS Genes
The gold standard for validating NBS gene function involves virus-induced gene silencing (VIGS) combined with pathogen challenge assays. In a recent study investigating cotton leaf curl disease resistance, researchers silenced GaNBS (OG2) in resistant cotton, demonstrating its direct role in reducing viral titers [19]. The protocol involves:
- Vector construction: Inserting 150-300 bp gene-specific fragment into TRV-based VIGS vector
- Agroinfiltration: Infiltrating cotyledons or true leaves with Agrobacterium carrying the VIGS construct
- Pathogen challenge: Inoculating with target pathogen (e.g., cotton leaf curl virus) 10-14 days post-silencing
- Phenotypic assessment: Monitoring disease symptoms and quantifying pathogen load via qPCR
- Expression analysis: Confirming gene silencing via RT-qPCR
Protein-ligand interaction studies further demonstrated strong binding of specific NBS proteins with ADP/ATP and viral proteins, confirming their role in pathogen recognition and defense signaling [19].
Validation of Orphan Gene Function
Functional characterization of orphan genes presents unique challenges due to their lack of conserved domains and rapid evolution. Successful approaches include:
- CRISPR/Cas9 knockout screens to assess phenotypic consequences [73]
- Heterologous expression in model systems to determine biochemical functions
- Weighted Gene Co-expression Network Analysis (WGCNA) to identify potential functional associations [73]
- Population genetics analyses (dN/dS ratios, selection tests) to detect signatures of adaptation
Notable examples include the Arabidopsis AtQQS orphan gene, which regulates carbon-nitrogen allocation and provides pathogen resistance [71] [73], and the rice OsDR10 de novo gene that confers pathogen resistance [73].
Research Reagent Solutions
Table 4: Essential Research Reagents and Resources
| Reagent/Resource | Function/Application | Example Sources/Platforms |
|---|---|---|
| PlantTribes2 | Gene family classification & comparative genomics | Galaxy Platform, Bioconda [70] |
| ORFanFinder | Orphan gene identification | Standalone pipeline [72] |
| VIGS Vectors | Functional gene validation | TRV-based systems [19] |
| Pfam HMM Models | Domain annotation (e.g., NB-ARC PF00931) | Pfam database [19] |
| GreenPhylDB | Phylogenomic database for orphan genes | Public database [72] |
| ANNA Database | Angiosperm NBS-LRR gene atlas | Curated repository [19] |
| CPGAVAS2 | Chloroplast genome annotation | Web server [74] |
| GET_HOMOLOGUES | Orthology inference | Bioconda package |
Pan-genomic analyses reveal profound differences in gene family evolution between bryophytes and angiosperms. Bryophytes employ lineage-specific NBS domain architectures (PNL and HNL classes), while angiosperms have massively expanded the canonical TNL and CNL classes through duplication and diversification. Orphan genes contribute significantly to lineage-specific adaptations in both groups, with distinct molecular characteristics and expression patterns. The methodologies and resources presented here provide a foundation for systematic comparison of gene family diversity across plant lineages, with important implications for understanding plant immunity and engineering disease resistance in crop species. Future research directions should include more comprehensive sampling of early land plant lineages, functional characterization of lineage-specific genes, and integration of pan-genome analyses with metabolic pathway data to link genetic novelty to functional innovation.
Plant immunity relies heavily on a diverse arsenal of nucleotide-binding site leucine-rich repeat (NLR) genes that function as intracellular immune receptors. These proteins recognize pathogen effector molecules and initiate defense responses through a process known as effector-triged immunity (ETI). NLR genes are categorized based on their N-terminal domains, with the Toll/Interleukin-1 Receptor (TIR) domain defining one major class: TIR-NBS-LRR (TNL) genes. A fascinating aspect of NLR evolution is their differential distribution across plant lineages. While TNLs are prevalent in bryophytes, gymnosperms, and eudicots, they are remarkably absent or highly reduced in monocots. This distribution pattern provides a compelling narrative of gene expansion, loss, and functional diversification throughout plant evolution, offering insights into how different plant lineages have tailored their immune systems in response to evolutionary pressures.
Comparative Analysis of NBS Domain Architectures Across Land Plants
The Broader NBS Gene Family
The NBS domain forms the core of plant NLR immune receptors. A recent study analyzing 34 plant species identified 12,820 NBS-domain-containing genes, revealing significant diversity in domain architecture with 168 distinct classes [19]. These range from classical structures like NBS, NBS-LRR, and TIR-NBS-LRR to more unusual, species-specific patterns such as TIR-NBS-TIR-Cupin1-Cupin1 and TIR-NBS-Prenyltransf [19]. This architectural diversity underscores the dynamic evolution of the plant immune system.
Distribution of TNL Genes Across Plant Lineages
Table 1: Distribution of TNL Genes Across Major Plant Lineages
| Plant Lineage | Representative Species | TNL Presence | Key Evidence |
|---|---|---|---|
| Bryophytes | Physcomitrella patens (moss) | Present | 3 intact TNL genes identified [26] |
| Basal Angiosperms | Amborella trichopoda, Nuphar advena | Present | TIR-type sequences confirmed via kinase-2 motif [75] [8] |
| Gymnosperms | Cycas revoluta, Pinus species | Present | Successfully amplified via PCR [75] [8] |
| Eudicots | Arabidopsis thaliana, Fragaria species | Present | Large repertoires; over 50% of NLRs in some species [76] |
| Monocots | Grasses (Poales), Spathiphyllum sp. (Alismatales) | Absent/Rare | Not found by PCR or database searches across 5 orders [75] [8] |
| Magnoliids | Persea americana (avocado) | Absent | Only non-TIR sequences found [8] |
The distribution of TNL genes reveals a clear phylogenetic pattern. These genes are present in bryophytes, the most ancient group of land plants, where they surprisingly co-exist with novel NBS classes not found in vascular plants, such as PK-NBS-LRR (PNL) and Hydrolase-NBS-LRR (HNL) [26]. This finding in mosses and liverworts indicates that the genetic machinery for TNL-based immunity was established very early in land plant evolution. Both gymnosperms and basal angiosperms possess TNL genes, confirming their presence in seed plant ancestors [75] [8]. Within angiosperms, a major divergence occurs: eudicots typically maintain substantial TNL repertoires, while monocots and magnoliids have experienced a significant reduction or complete loss of these genes [75] [8]. Research across five monocot orders (Poales, Zingiberales, Arecales, Asparagales, and Alismatales) consistently failed to find TNL sequences, indicating this loss was a broad evolutionary event in the monocot lineage [75] [8].
Experimental Evidence for TNL Absence in Monocots
Key Methodologies for NLR Gene Identification
Researchers employ several core experimental approaches to identify and classify NLR genes across plant species:
- Degenerate Polymerase Chain Reaction (PCR): This method uses primers designed to target conserved motifs within the NBS domain, such as the P-loop and GLPL motifs, allowing for the amplification of unknown NLR sequences. Primers can be biased toward TIR or non-TIR classes based on the final residue of the kinase-2 motif (aspartic acid in TIRs vs. tryptophan in non-TIRs) [75] [8].
- Hidden Markov Model (HMM) Searches: Pfam domain profiles (e.g., NB-ARC, TIR, LRR) are used to systematically scan whole genome or proteome sequences for potential NLR genes [19] [76] [4].
- Phylogenetic Analysis: Identified NBS sequences are aligned and used to construct phylogenetic trees, which help classify sequences into clades (TIR, non-TIR) and reveal evolutionary relationships [75] [76].
- Genome-Wide Comparative Analyses: With the availability of complete genomes, researchers can comprehensively catalog and compare the entire NLR repertoire (the "NLRome") between species, offering a complete picture of gene family expansions and losses [19] [11].
Experimental Workflow for Phylogenetic Comparison
The following diagram illustrates the logical workflow and relationships involved in the comparative analysis of NLR genes across plant lineages.
Critical Findings from Cross-Lineage Studies
A pivotal study by Tarr and Alexander investigated the presence of TNL genes across diverse monocot orders (Poales, Zingiberales, Arecales, Asparagales, and Alismatales) using degenerate PCR and database searches. While they successfully amplified TNL sequences from control eudicot (Coffea canephora) and gymnosperm (Cycas revoluta) species, no TNL sequences were obtained from any of the monocot species tested [75] [8]. This finding was further corroborated by a large-scale genomic analysis that revealed the absence of TNL genes coincides with the loss of the downstream signaling components EDS1 and PAD4 in specific lineages within Alismatales, suggesting a co-evolutionary loss of both the receptors and their signaling pathway in these plants [11]. Genomic analyses of specific eudicots, such as the tung tree (Vernicia fordii), have also revealed independent losses of TNL genes, indicating that this can be a recurrent evolutionary phenomenon [4].
The Functional Consequences and Compensatory Mechanisms
Co-Loss of the TNL Signaling Pathway
The absence of TNL genes in monocots is not an isolated phenomenon. Research shows it is often accompanied by the loss of key components of the associated signaling pathway. A comprehensive genome analysis revealed that several plant lineages, including the monocot order Alismatales, have convergently lost the ENHANCED DISEASE SUSCEPTIBILITY 1 (EDS1) and PHYTOALEXIN DEFICIENT 4 (PAD4) signaling complex, which is essential for TNL-mediated immunity in eudicots [11]. This co-loss suggests an evolutionary streamlining of the immune system where redundant or costly components are discarded.
Expansion of Non-TNL Genes
In the absence of TNLs, monocots rely heavily on non-TNL-type NLRs, primarily those with coiled-coil (CC) N-terminal domains (CNLs). Wild strawberries illustrate this compensatory dynamic: species with a higher proportion of non-TNL genes demonstrated significantly greater resistance to the fungal pathogen Botrytis cinerea [76]. Furthermore, a significantly higher number of non-TNLs were found to be under positive selection compared to TNLs in these species, indicating their rapid diversification and central role in pathogen defense [76]. This expansion and adaptation of the non-TNL repertoire likely compensates for the lack of TNLs and represents a key evolutionary strategy for immune system optimization in monocots.
The Scientist's Toolkit: Key Reagents for NLR Research
Table 2: Essential Research Reagents and Resources for Comparative NLR Genomics
| Reagent/Resource | Function and Application in NLR Research |
|---|---|
| Pfam Domain HMMs (e.g., NB-ARC PF00931, TIR PF01582, LRR PF00560) | Hidden Markov Models used for systematic identification of NBS-LRR genes and their domain architecture from genomic sequences [19] [76]. |
| Degenerate PCR Primers (targeting P-loop, GLPL, Kinase-2 motifs) | Amplify unknown NBS sequences from cDNA or genomic DNA; primers can be biased toward TIR or non-TIR classes based on the kinase-2 motif [75] [8]. |
| OrthoFinder / MCL Algorithm | Software tools for clustering genes into orthogroups (OGs), enabling evolutionary tracking of NLR lineages across species [19]. |
| Virus-Induced Gene Silencing (VIGS) System | Functional validation tool to knock down candidate NLR genes in planta and assess changes in disease resistance phenotypes [19] [4]. |
| Genome Databases (e.g., Phytozome, NCBI, Plaza, GDR) | Provide annotated genome sequences and annotations essential for genome-wide identification and comparative analyses [19] [76]. |
The tale of TIR genes in monocots is a powerful example of lineage-specific gene loss shaping the evolution of complex biological systems. The ancestral presence of TNLs in bryophytes and their subsequent loss in monocots highlights that a complete immune repertoire is not always necessary for evolutionary success. Instead, different lineages can undergo significant simplification and specialization. Monocots have evidently thrived by focusing on and expanding their non-TNL repertoire, a strategy that may be coupled with alternative, as-yet-unknown immune mechanisms. Future research, particularly in understudied monocot orders and basal angiosperms, will be crucial to fully unravel the evolutionary drivers and molecular consequences of this major reorganization of the plant immune system.
Nucleotide-binding site (NBS) domain genes constitute one of the largest superfamilies of plant disease resistance (R) genes, playing crucial roles in pathogen perception and activation of immunity [19] [77]. In angiosperms, NBS-LRR genes are typically classified into two major subfamilies: TIR-NBS-LRR (TNL) and CC-NBS-LRR (CNL) [78] [77]. However, investigations into early-diverging land plants have revealed a more complex evolutionary picture. Genomic analyses of bryophytes—the sister group to vascular plants that diverged approximately 500 million years ago—have uncovered novel NBS classes absent in angiosperms [26] [6] [79]. These include the PK-NBS-LRR (PNL) class identified in the moss Physcomitrella patens and the Hydrolase-NBS-LRR (HNL) class found in the liverwort Marchantia polymorpha [26] [6].
Understanding the transcriptional activity of these novel NBS classes provides crucial insights into the evolutionary dynamics of plant immune systems. This guide objectively compares the expression profiles of bryophyte-specific NBS classes with canonical angiosperm NBS genes, supported by experimental data on their domain architectures, transcriptional responses under stress conditions, and methodological approaches for their characterization.
Comparative Domain Architecture of NBS Genes Across Plant Lineages
Classification and Distribution of NBS Classes
Table 1: Comparative Analysis of NBS Domain Architectures in Bryophytes and Angiosperms
| Plant Category | Species | NBS Class | N-terminal Domain | Representative Genes | Genomic Abundance |
|---|---|---|---|---|---|
| Bryophytes | Physcomitrella patens (moss) | PNL | Protein Kinase (PK) | PpPNL1-PpPNL6 | 45 genes (69% of total NBS) |
| Marchantia polymorpha (liverwort) | HNL | α/β-hydrolase | MpHNL1-MpHNL9 | 36 genes (84% of isolated NBS) | |
| Physcomitrella patens | TNL | TIR | 3 intact genes | 9 total genes | |
| Physcomitrella patens | CNL | Coiled-Coil | 9 intact genes | 11 total genes | |
| Angiosperms | Arabidopsis thaliana | TNL | TIR | RPS4, RPP1 | ~100 genes |
| Arabidopsis thaliana | CNL | Coiled-Coil | RPM1, RPS2 | ~50 genes | |
| Oryza sativa | CNL | Coiled-Coil | Xa1, Pib | ~400 genes |
The domain architecture of NBS genes reveals fundamental differences between bryophytes and angiosperms. While angiosperms predominantly possess TNL and CNL classes, bryophytes harbor distinctive N-terminal domain combinations [26] [6]. In Physcomitrella patens, the PNL class represents the majority (69%) of NBS-encoding genes, featuring an N-terminal protein kinase domain, central NBS domain, and C-terminal LRR domain [26]. Similarly, Marchantia polymorpha expresses predominantly HNL-class genes (84% of isolated sequences), characterized by an N-terminal α/β-hydrolase domain [6]. Phylogenetic analyses suggest a closer relationship between HNL, PNL, and TNL classes, with the CNL class showing more divergent status [6].
Recent super-pangenome analysis of 123 bryophyte genomes confirms they possess substantially greater diversity of gene families than vascular plants, including unique immune receptors [16] [13]. This expanded gene family space contributes to their ecological adaptability and likely includes specialized NBS variants not found in tracheophytes.
Methodological Framework for NBS Gene Expression Analysis
Experimental Protocols for Identification and Expression Profiling
Table 2: Key Methodologies for NBS Gene Identification and Expression Analysis
| Method Category | Specific Technique | Application Purpose | Key Parameters | Reference Implementation |
|---|---|---|---|---|
| Gene Identification | HMMER Search with Pfam models | Genome-wide identification of NBS domains | Pfam NBS (NB-ARC) domain PF00931; e-value 1.1e-50 | [19] [78] |
| 5'- and 3'-RACE | Full-length cDNA isolation for novel NBS classes | Gene-specific primers; rapid amplification of cDNA ends | [6] | |
| Transcriptional Profiling | RNA-seq | Expression quantification across tissues/stresses | FPKM values; differential expression analysis | [19] |
| Orthogroup analysis | Cross-species comparison of NBS gene expression | OrthoFinder v2.5.1; MCL clustering algorithm | [19] | |
| Functional Validation | Virus-Induced Gene Silencing (VIGS) | Functional characterization of NBS genes | TRV-based vectors; pathogen challenge assays | [19] |
The experimental workflow for characterizing novel NBS genes involves sequential phases from identification to functional validation. Initial genome-wide identification typically employs Hidden Markov Model (HMM) searches using the Pfam NBS (NB-ARC) domain model (PF00931) with stringent e-value cutoffs (1.1e-50) [19] [78]. For novel NBS classes, rapid amplification of cDNA ends (RACE) is crucial for obtaining complete coding sequences, particularly for determining novel N-terminal domains like the α/β-hydrolase in HNL classes [6].
Transcriptional activity assessment typically employs RNA-seq with FPKM quantification across various tissues and stress conditions. For comparative analysis, orthogroup clustering using tools like OrthoFinder with the MCL algorithm groups NBS genes with common evolutionary origins, enabling cross-species expression comparisons [19]. Functional validation often utilizes virus-induced gene silencing (VIGS) to knock down candidate NBS genes followed by pathogen challenge assays to assess immunity phenotypes [19].
Figure 1: Experimental workflow for transcriptional analysis of novel NBS classes, spanning identification, expression profiling, and functional validation phases.
Transcriptional Activity of Novel NBS Classes in Bryophytes
Expression Patterns Under Basal and Stress Conditions
Comprehensive expression profiling reveals distinct transcriptional behaviors for novel NBS classes in bryophytes compared to canonical angiosperm NBS genes. In Physcomitrella patens, PNL genes demonstrate tissue-specific expression patterns with particular enrichment in gametophytic tissues [16]. Similarly, HNL genes in Marchantia polymorpha show constitutive expression in thallus tissues with upregulation following microbial challenge [6] [79].
Global expression analyses indicate that approximately 50-80% of accessory and unique gene families in bryophytes, including specialized NBS variants, show detectable expression under standard growth conditions [16]. Under stress conditions, specific orthogroups containing NBS genes demonstrate significant transcriptional upregulation. For instance, orthogroups OG2, OG6, and OG15 show increased expression in response to biotic and abiotic stresses in comparative analyses across plant species [19].
Notably, genes within accessory and unique orthogroups in bryophytes, including lineage-specific NBS variants, generally exhibit lower expression levels than core orthogroups, a pattern consistent with observations of newly evolved genes in angiosperms [16]. These novel NBS genes also display structural characteristics associated with younger genes, including fewer introns and shorter coding regions compared to conserved NBS genes [16].
The Scientist's Toolkit: Essential Research Reagents and Solutions
Table 3: Key Research Reagent Solutions for NBS Gene Expression Studies
| Reagent Category | Specific Product/Resource | Experimental Function | Application Context |
|---|---|---|---|
| Genomic Resources | Bryophyte genome assemblies (www.bryogenomes.org) | Reference sequences for gene identification | Pangenome analysis of 123 bryophyte species [16] [13] |
| Domain Databases | Pfam NB-ARC domain (PF00931) | HMM profile for NBS domain identification | Curated multiple sequence alignment for NBS recognition [19] [78] |
| Analysis Tools | OrthoFinder v2.5.1 + DIAMOND | Orthogroup inference and comparative analysis | Cross-species clustering of NBS genes [19] |
| Expression Databases | IPF database (http://ipf.sustech.edu.cn/pub/) | RNA-seq data for expression profiling | Tissue-specific and stress-induced expression patterns [19] |
| Functional Validation | TRV-based VIGS vectors | Transient gene silencing in plants | Functional characterization of NBS genes [19] |
Critical research reagents for investigating novel NBS class expression include comprehensive genomic resources, specialized databases, and analytical tools. The recent expansion of bryophyte genomic data, particularly the super-pangenome incorporating 123 bryophyte genomes, provides essential reference sequences for identifying lineage-specific NBS variants [16] [13]. For domain identification, the Pfam NB-ARC domain (PF00931) HMM profile serves as the standard for NBS recognition, while specialized tools like OrthoFinder enable evolutionary classification through orthogroup clustering [19].
Expression analysis relies on curated RNA-seq databases such as the IPF database, which houses tissue-specific and stress-responsive transcriptomic data across multiple plant species [19]. For functional studies, virus-induced gene silencing (VIGS) systems, particularly Tobacco Rattle Virus (TRV)-based vectors, enable efficient transient silencing of candidate NBS genes for phenotypic validation [19].
The transcriptional activity of novel NBS classes in bryophytes reveals fundamental aspects of plant immunity evolution. The discovery of transcriptionally active PNL and HNL classes demonstrates that early land plants employed diverse domain architectures for immune signaling that were subsequently lost in vascular plant lineages [26] [6]. The expression of these novel NBS genes under both basal and stress conditions suggests their functional importance in bryophyte immunity, potentially through unique signaling pathways distinct from canonical TNL and CNL classes in angiosperms [79].
Recent evidence indicates that bryophytes maintain a larger gene family space than vascular plants, with extensive innovation in immune receptors over their evolutionary history [16] [13]. The transcriptional activity of novel NBS classes represents one aspect of this genetic innovation, contributing to bryophyte adaptation to diverse ecological niches. Future research characterizing the specific pathogen recognition capabilities and signaling mechanisms of these novel NBS classes will further illuminate the evolutionary dynamics of plant immune systems and potentially provide new genetic resources for crop improvement.
The analysis of evolutionary rates, particularly through the ratio of non-synonymous to synonymous substitutions (dN/dS), provides a powerful framework for understanding molecular evolution and selective pressures acting on genomes. In plant evolutionary biology, this approach reveals fundamental differences between major lineages. Bryophytes, which include mosses, liverworts, and hornworts, represent the earliest diverging lineages of land plants and possess unique genomic characteristics that distinguish them from vascular plants. Meanwhile, angiosperms (flowering plants) have evolved complex genomes with extensive gene family expansions. The comparison of evolutionary dynamics between these groups, especially concerning crucial gene families like the nucleotide-binding site (NBS) genes involved in pathogen defense, offers profound insights into plant adaptation mechanisms. This review synthesizes current understanding of evolutionary rate patterns between bryophytes and angiosperms, with specific focus on NBS domain architectures and their evolutionary trajectories.
Evolutionary Rate Landscapes: Bryophytes vs. Angiosperms
Comparative analyses of molecular evolutionary rates between bryophytes and angiosperms reveal distinct patterns influenced by life history traits, population genetics, and genomic architecture.
Table 1: Comparative Evolutionary Rates Between Bryophytes and Angiosperms
| Aspect | Bryophytes | Angiosperms | Key Findings |
|---|---|---|---|
| Silent site substitution rate | Lower than angiosperms but higher than gymnosperms [80] | Generally higher than bryophytes [80] | Liverworts exhibit lower neutral evolution rates |
| Selection pressure (dN/dS) | Not remarkably lower despite haploid dominance [80] | Variable across lineages and gene families [19] | Masking hypothesis not fully supported in bryophytes |
| Gene family diversity | Higher number of unique and lineage-specific gene families [16] | More conserved gene family repertoires [16] | Bryophytes show extensive gene family innovation |
| NBS gene repertoire size | Relatively small (e.g., ~25 NLRs in Physcomitrella patens) [19] | Greatly expanded (e.g., 2012 NBS genes in wheat) [19] | Substantial expansion occurred in flowering plants |
The haploid-dominant life cycle of bryophytes presents a theoretically compelling case for studying evolutionary rates. According to the "masking hypothesis," the prevalence of haploid expression in bryophytes should expose mutations directly to selection, potentially increasing its efficacy. However, empirical evidence challenges this expectation. A focused study on molecular evolution in bryophytes, particularly complex thalloid liverworts (Marchantiopsida), found that the selection pressure, measured as dN/dS, was "not remarkably lower for bryophytes as compared to other diploid dominant plants as would be expected by the masking hypothesis" [80]. This suggests that other factors, such as gene expression level and breadth, may be more important determinants of selection efficacy than ploidy level alone [81].
Recent super-pangenome analysis of 123 bryophyte genomes has revealed that bryophytes possess a substantially greater diversity of gene families than vascular plants, including a higher number of unique and lineage-specific gene families [16]. This expanded gene family space originates from extensive new gene formation and continuous horizontal transfer of microbial genes over their long evolutionary history. Despite this diversity, bryophyte genomes are generally characterized by relatively small NLR repertoires (approximately 25 in Physcomitrella patens) compared to the massive expansions observed in many angiosperms (e.g., 2012 NBS-encoding genes in wheat) [19].
NBS Domain Architecture Diversity
Nucleotide-binding site (NBS) domain genes constitute one of the largest superfamilies of plant resistance (R) genes involved in pathogen defense responses. These genes typically encode proteins with a modular structure consisting of an N-terminal domain, a central NBS domain, and C-terminal leucine-rich repeats (LRRs). Comparative analysis of NBS domain architectures across land plants reveals both conserved and lineage-specific patterns.
Table 2: NBS Domain Architecture Classes in Bryophytes and Angiosperms
| Architecture Class | Domain Structure | Distribution | Key Features |
|---|---|---|---|
| TNL | TIR-NBS-LRR | Limited in bryophytes, common in angiosperms [26] [6] | Toll/Interleukin-1 Receptor domain |
| CNL | CC-NBS-LRR | Limited in bryophytes, predominant in angiosperms [26] [6] | Coiled-Coil domain |
| PNL | PK-NBS-LRR | Specific to mosses (e.g., Physcomitrella patens) [26] [6] | Protein Kinase domain; 45 members in P. patens |
| HNL | Hydrolase-NBS-LRR | Specific to liverworts (e.g., Marchantia polymorpha) [26] [6] | α/β-hydrolase domain |
| RNL | RPW8-NBS-LRR | Present in angiosperms [19] | Resistance to Powdery Mildew 8 domain |
Analysis of 12,820 NBS-domain-containing genes across 34 plant species identified 168 classes with several novel domain architecture patterns [19]. While angiosperms predominantly feature TIR-NBS-LRR (TNL) and CC-NBS-LRR (CNL) architectures, bryophytes exhibit distinct structural innovations. In the moss Physcomitrella patens, researchers discovered a novel class designated PK-NBS-LRR (PNL), characterized by an N-terminal protein kinase (PK) domain [26] [6]. This PNL class represents approximately two-thirds of all NBS-encoding genes in the P. patens genome, with 45 members identified [6].
Similarly, in the liverwort Marchantia polymorpha, investigations revealed another novel class: Hydrolase-NBS-LRR (HNL), which possesses an N-terminal α/β-hydrolase domain [26] [6]. Phylogenetic analysis of these four classes of NBS-encoding genes revealed a closer relationship among HNL, PNL, and TNL classes, suggesting the CNL class has a more divergent status from the others [6]. The presence of specific introns in these novel bryophyte NBS genes highlights their chimerical structures and implies possible origins via exon-shuffling during the rapid lineage separation processes of early land plants [26].
Methodological Framework for Evolutionary Rate Analysis
Genomic Data Collection and Processing
Comparative analyses of evolutionary rates and NBS domain architectures require comprehensive genomic datasets. The following workflow outlines the standard methodology for such investigations:
Experimental Protocol 1: Genomic Data Collection and Orthology Assessment
- Genome Selection: Curate high-quality genome assemblies spanning the phylogenetic diversity of interest. A recent study analyzed 12,820 NBS-domain-containing genes across 34 species covering from mosses to monocots and dicots [19].
- Gene Family Identification: Employ Hidden Markov Model (HMM) searches using domain-specific profiles. Studies typically use PfamScan with default e-value (1.1e-50) and the Pfam-A_hmm model to identify NBS domains [19].
- Orthogroup Delineation: Utilize orthology inference tools such as OrthoFinder with the DIAMOND algorithm for sequence similarity searches and MCL for gene clustering [19].
- Domain Architecture Classification: Classify genes based on associated domains following established classification systems that group similar domain-architecture-bearing genes into the same classes [19].
Evolutionary Rate Calculation and Selection Pressure Analysis
Experimental Protocol 2: Evolutionary Rate and Selection Pressure Analysis
- Sequence Alignment: Perform multiple sequence alignment of coding sequences using MAFFT 7.0 or similar tools [19].
- Evolutionary Rate Calculation: Calculate non-synonymous (dN) and synonymous (dS) substitution rates using maximum likelihood methods implemented in programs such as CODEML from the PAML package.
- Selection Pressure Assessment: Interpret dN/dS ratios where:
- dN/dS < 1 indicates purifying selection
- dN/dS ≈ 1 indicates neutral evolution
- dN/dS > 1 suggests positive selection
- Population Genetic Analyses: Complement dN/dS analyses with population genetic statistics such as nucleotide diversity (π) and Tajima's D to detect balancing selection [81].
Table 3: Key Research Reagents and Computational Tools for Evolutionary Rate Analysis
| Category | Specific Tool/Resource | Application | Key Features |
|---|---|---|---|
| Genome Databases | NCBI Genome, Phytozome, Plaza [19] | Genome assembly retrieval | Curated plant genomic resources |
| Domain Annotation | PfamScan, HMMER [19] | NBS domain identification | Hidden Markov Model-based detection |
| Orthology Assessment | OrthoFinder, DIAMOND [19] | Gene family clustering | Fast orthogroup delineation |
| Sequence Alignment | MAFFT [19] | Multiple sequence alignment | Accurate alignment of divergent sequences |
| Phylogenetic Analysis | FastTreeMP, Maximum Likelihood [19] | Evolutionary relationship inference | Bootstrap support assessment |
| Selection Analysis | PAML (CODEML) | dN/dS calculation | Site/branch-specific models |
| Expression Analysis | RNA-seq, DESeq2 [82] | Sex-biased/specific expression | Differential expression detection |
| Population Genetics | Variant calling pipelines, PopGenome | Diversity statistics (π, Tajima's D) | Selection signature detection |
Evolutionary rate analysis through dN/dS and selection pressure assessment provides crucial insights into the divergent evolutionary trajectories of bryophytes and angiosperms. Bryophytes exhibit lower silent site substitution rates than angiosperms but surprisingly similar selection pressures despite their haploid-dominant life cycles. The discovery of novel NBS domain architectures (PNL and HNL) in bryophytes highlights the extensive innovation in early land plant lineages, while angiosperms have undergone massive gene family expansions, particularly in NBS-encoding genes. The methodological framework integrating genomic, transcriptomic, and population genetic approaches enables comprehensive understanding of selective forces shaping plant genomes. These insights not only illuminate fundamental evolutionary processes but also inform crop improvement strategies by revealing the evolutionary dynamics of disease resistance genes.
Land plants, descended from a single algal ancestor, comprise two major sister groups: the bryophytes (liverworts, mosses, and hornworts) and the vascular plants (tracheophytes). These lineages diverged approximately 500 million years ago, following plant colonization of land [13] [16]. Bryophytes, characterized by their dominant gametophyte generation and lack of lignified vascular tissue, have thrived in diverse and often extreme habitats worldwide [13]. The genetic basis for their remarkable ecological success and long-term survival, particularly concerning their immune systems, has only recently begun to be understood.
Intracellular immune sensing in plants is largely mediated by Nucleotide-Binding and Leucine-Rich Repeat (NLR) receptors, which detect pathogen effectors and activate robust defense responses [83]. In flowering plants (angiosperms), NLRs are well-studied and typically feature a central NB-ARC (Nucleotide-Binding Adaptor shared with APAF-1, plant R proteins, and CED-4) domain, a C-terminal Leucine-Rich Repeat (LRR) region, and variable N-terminal domains that execute immune functions [19] [83]. These N-terminal domains are predominantly of the coiled-coil (CC), Resistance to Powdery Mildew 8 (RPW8), or Toll/Interleukin-1 receptor (TIR) types [83].
Emerging genomic evidence now reveals that bryophytes possess a significantly larger and more diverse genetic toolkit than previously assumed, including a rich and largely unexplored repertoire of immune receptors [13] [83]. This review synthesizes recent evidence comparing the NLR domain architectures of bryophytes and angiosperms, positioning bryophytes as a critical reservoir of novel immune diversity with potential applications in crop protection and biotechnology.
Comparative Genomic Landscape: Bryophytes vs. Angiosperms
A comprehensive super-pangenome analysis incorporating 123 newly sequenced bryophyte genomes has fundamentally altered our understanding of their genetic space. Despite having smaller genomes and fewer genes on average (approximately 27,959) than vascular plants (approximately 34,794), bryophytes exhibit a substantially larger cumulative number of non-redundant gene families (637,597 versus 373,581) [13] [16]. This includes a higher number of unique (orphan) and lineage-specific gene families, stemming from extensive de novo gene formation and continuous horizontal gene transfer from microbes over their long evolutionary history [13].
Table 1: Comparative Genomic and Immune Receptor Diversity between Bryophytes and Angiosperms
| Feature | Bryophytes | Angiosperms | Significance/Notes |
|---|---|---|---|
| Average Number of Genes | ~27,959 [13] | ~34,794 [13] | Bryophyte genomes are generally smaller. |
| Cumulative Gene Families | 637,597 [13] | 373,581 [13] | Indicates a larger "gene family space" in bryophytes. |
| Average Unique Gene Families per Taxon | 3,862 [13] | 2,223 [13] | Suggests high lineage-specific innovation. |
| NLR Repertoire Size | Relatively small (~25 in Physcomitrella patens) [19] | Very large (e.g., >12,000 genes in wheat) [19] | NLRs underwent massive expansion in flowering plants. |
| Characterized N-terminal Domains | CC, RPW8, TIR, Atypical (αβ-hydrolase, Protein Kinase) [83] | CC, RPW8, TIR [83] | Bryophytes possess unique, lineage-specific NLR domain architectures. |
| Conserved CC-domain Motif | "MAEPL" [83] | "MADA" or "MADA-like" [83] | Different motifs, similar pore-forming function in cell death. |
| TIR-NLR Status | Lost in liverworts; replaced by TIR-NB-ARC-TPR (TNP) receptors [83] | Widespread and functionally characterized [83] | Illustrates divergent evolutionary paths. |
This expansive gene family diversity is reflected in their immune systems. While bryophytes possess a relatively small number of NLRs compared to the massively expanded repertoires of angiosperms, they exhibit a remarkable diversity in NLR domain architectures, including unique forms that have been lost in flowering plant lineages [19] [83].
Comparative Analysis of NBS Domain Architectures
Conserved and Common Domains
Bioinformatic surveys across the plant kingdom show that the common N-terminal domains of angiosperm NLRs—CC, RPW8, and TIR—are widely distributed and evolutionarily conserved. These domains are found in streptophyte algae (the sister group to all land plants), suggesting their origins predate the colonization of land [83].
Functional conservation is also evident. For instance, the CC domains from non-flowering plants, including bryophytes, possess a distinct N-terminal "MAEPL" motif in their first alpha helix. This motif is functionally analogous to the "MADA" motif in angiosperm CC-NLRs and is essential for activating cell death, likely through the formation of ion-permeable pores in the plasma membrane [83]. This indicates that the core biochemical mechanism of CC-domain function is ancient and shared across land plants.
Lineage-Specific and Atypical Domains in Bryophytes
The most exciting discoveries in bryophyte immunity are the atypical NLR configurations with N-terminal domains not found in angiosperm NLRs. Genomic studies have identified bryophyte-specific NLRs that feature N-terminal αβ-hydrolase or protein kinase domains instead of the canonical CC, RPW8, or TIR domains [83].
- αβ-hydrolase domains: These are common catalytic domains found in a wide range of enzymes (e.g., esterases, lipases). Their fusion with the NB-ARC domain suggests bryophytes may have evolved unique biochemical mechanisms for pathogen sensing or immune signal transduction.
- Protein kinase domains: The integration of a kinase domain into an NLR structure creates a potential for direct phosphorylation-based signaling cascades upon pathogen perception, a mechanism distinct from the oligomerization-based models characterized in angiosperms.
These novel architectures represent a significant diversification of the plant immune system and highlight bryophytes as a repository of alternative evolutionary solutions to pathogen defense.
Experimental Protocols for Characterizing Immune Diversity
Research in bryophyte immunity relies on a combination of modern genomic, genetic, and biochemical techniques. The following protocols outline key methodologies used to generate the evidence discussed in this review.
Protocol 1: Super-Pangenome Construction and Orthogroup Analysis
This methodology is used to comprehensively catalog gene family diversity across a lineage [13] [16].
- Genome Sequencing and Assembly: Sequence, assemble, and annotate high-quality genomes from a diverse phylogenetic sampling of bryophytes (e.g., 123 genomes representing 47 of 55 known orders).
- Proteome Compilation: Compile the predicted proteomes of the target bryophytes, along with those of outgroups (e.g., vascular plants and algae).
- Orthogroup Inference: Use orthology inference software (e.g., OrthoFinder) to cluster all amino acid sequences into groups of homologous genes (orthogroups). This identifies gene families.
- Pangenome Categorization: For a given lineage (e.g., all bryophytes), classify orthogroups into:
- Core: Present in ≥80% of samples.
- Accessory: Present in at least two but fewer than 80% of samples.
- Unique (Orphan): Present in only a single sample.
- Comparative Analysis: Compare the accumulation curves and total counts of these categories between bryophytes and vascular plants to assess relative genetic diversity.
Protocol 2: Identification and Classification of NBS Domain Genes
This protocol is specialized for mining the immune receptor repertoire from genomic data [19].
- Data Collection: Download publicly available genome assemblies from databases like NCBI, Phytozome, or Plaza.
- HMMER Scan: Use the
PfamScan.plscript with the Pfam-A.hmm model to scan all predicted proteins for the presence of the NB-ARC (NBS) domain (Pfam: PF00931). Use a strict e-value cutoff (e.g., 1.1e-50). - Architecture Classification: Analyze the domain architecture of all identified NBS-containing genes using HMMER and SMART/Pfam tools. Classify genes into groups based on their combination of domains (e.g., TIR-NBS-LRR, CC-NBS-LRR, NBS-LRR, TNP).
- Orthogrouping of NBS Genes: Cluster the identified NBS proteins from multiple species into orthogroups using a tool like OrthoFinder to identify evolutionarily conserved lineages of immune receptors.
- Evolutionary Analysis: Construct phylogenetic trees and map domain architectures and orthogroups to visualize the diversification of NBS genes across land plants.
Protocol 3: Functional Validation of Immune Receptors
To confirm the function of candidate immune receptors, several validation strategies are employed.
- Heterologous Expression (Cell Death Assay):
- Clone the candidate gene (or its N-terminal domain) into an expression vector.
- Transiently express the construct in a model system like Nicotiana benthamiana via Agrobacterium-mediated infiltration.
- Visually monitor the infiltrated leaf patches for a hypersensitive response (HR), a form of programmed cell death, over 2-7 days. Cell death indicates potential immune-executor activity [83].
- Gene Silencing (Virus-Induced Gene Silencing - VIGS):
- Design a VIGS construct targeting the candidate gene of interest.
- Infect the host plant (e.g., a resistant bryophyte or angiosperm) with the engineered virus.
- Challenge the silenced plants with a pathogen and assess for a loss of resistance, indicated by increased pathogen titer and disease symptoms [19].
- Gene Expression Profiling:
Visualization of Immune Signaling and Experimental Workflows
The following diagrams illustrate key signaling pathways and experimental workflows in bryophyte immunity research.
Bryophyte NLR Signaling Pathways
Workflow for Comparative NBS Gene Analysis
Table 2: Essential Research Reagents and Resources for Bryophyte Immunity Studies
| Reagent/Resource | Function/Application | Example/Specification |
|---|---|---|
| Bryophyte Genomic Data | Foundation for pangenome, phylogenomic, and gene family analyses. | Centralized platform www.bryogenomes.org [13]; 123 high-quality genomes across 47 orders [13]. |
| Orthology Inference Software | Clusters genes into families (orthogroups) across species. | OrthoFinder [19]; uses DIAMOND for sequence alignment and MCL for clustering. |
| Hidden Markov Model (HMM) Profiles | Identifies protein domains (e.g., NB-ARC, TIR, CC) in predicted proteomes. | Pfam database (e.g., PF00931 for NB-ARC domain) [19]. |
| Model Organisms | Provides a genetically tractable system for functional validation experiments. | Marchantia polymorpha (liverwort) and Physcomitrium patens (moss) [13] [83]. |
| Heterologous Expression System | Used for transient expression and cell death assays of candidate immune receptors. | Nicotiana benthamiana [83]. |
| Virus-Induced Gene Silencing (VIGS) Vectors | Knocks down gene expression in planta to test gene function in resistance. | TRV-based vectors for Gossypium spp. and other plants [19]. |
| RNA-sequencing (RNA-seq) Data | Profiles gene expression under stress conditions to identify responsive immune genes. | Data from public databases (e.g., IPF, NCBI BioProject) [19]. |
The synthesis of recent genomic evidence firmly establishes bryophytes as a formidable reservoir of unexplored immune diversity. While they share a conserved core of NLR components with vascular plants, their distinct evolutionary trajectory has yielded a wealth of unique gene families and novel immune receptor architectures, including NLRs with αβ-hydrolase and protein kinase domains [13] [83]. This diversity, coupled with their expansive "gene family space," suggests that bryophytes have explored alternative genetic solutions to pathogen defense that are absent from the well-studied angiosperm lineage.
Future research must focus on moving beyond bioinformatic identification to functional characterization of these novel receptors and pathways. The established experimental protocols and model systems provide a solid foundation for this work. Exploring this "immunobiodiversity" holds immense promise for uncovering completely novel sources of resistance, which could be harnessed through biotechnological approaches—such as transferring wild immune receptors or engineering novel forms—to bolster disease resistance in crops [25]. The dawn of bryophyte genomics has just begun, and it promises to revolutionize our understanding of plant immunity's evolutionary past and its applied future.
Conclusion
The comparative analysis of NBS domain architectures reveals that bryophytes are not simple relics but possess a rich and unique immune repertoire, characterized by novel gene classes like PNL and HNL and a larger gene family space than vascular plants. This underscores a deep evolutionary history of innovation in pathogen recognition mechanisms. The divergent paths taken by bryophytes and angiosperms illustrate that multiple evolutionary strategies can lead to terrestrial success. For biomedical and clinical research, these findings are profoundly significant. Bryophyte-specific NBS genes represent an untapped reservoir of genetic novelty. Studying their structure and function could reveal new mechanisms of pathogen sensing and immune activation, potentially inspiring the engineering of novel disease resistance in crops and offering fresh perspectives on nucleotide-binding domain function across biology, including in human innate immunity pathways. Future research must focus on functional validation of these unique receptors and exploration of their downstream signaling components to fully unlock their potential.
References
- 1. Plant NBS-LRR proteins in pathogen sensing and host defense [https://pmc.ncbi.nlm.nih.gov/articles/PMC1973153/]
- 2. Genome-wide analysis of NBS-LRR genes in Rosaceae ... [https://pmc.ncbi.nlm.nih.gov/articles/PMC9685399/]
- 3. Genome-Wide Analysis of NBS-LRR Genes From an Early ... [https://pmc.ncbi.nlm.nih.gov/articles/PMC9140740/]
- 4. Functional characterization of NBS-LRR genes reveals an ... [https://bmcbiol.biomedcentral.com/articles/10.1186/s12915-024-01836-x]
- 5. Multilevel evolution shapes the function of NB-LRR ... [https://www.frontiersin.org/journals/plant-science/articles/10.3389/fpls.2022.1007288/full]
- 6. A Primary Survey on Bryophyte Species Reveals Two ... [https://pmc.ncbi.nlm.nih.gov/articles/PMC3352924/]
- 7. Evolution patterns of NBS genes in the genus Dendrobium ... [https://bmcplantbiol.biomedcentral.com/articles/10.1186/s12870-022-03904-2]
- 8. TIR-NBS-LRR genes are rare in monocots [https://bmcresnotes.biomedcentral.com/articles/10.1186/1756-0500-2-197]
- 9. Identification and Cloning of a CC-NBS-NBS-LRR Gene as ... [https://www.mdpi.com/1422-0067/22/19/10239]
- 10. Large-Scale Analyses of Angiosperm Nucleotide-Binding Site ... [https://pmc.ncbi.nlm.nih.gov/articles/PMC4825152/]
- 11. Convergent Loss of an EDS1/PAD4 Signaling Pathway in ... [https://pmc.ncbi.nlm.nih.gov/articles/PMC7346574/]
- 12. Evolution of NLR Resistance Genes in Magnoliids [https://www.frontiersin.org/journals/plant-science/articles/10.3389/fpls.2021.777157/full]
- 13. Bryophytes hold a larger gene family space than vascular ... [https://www.nature.com/articles/s41588-025-02325-9]
- 14. An angiosperm NLR Atlas reveals that NLR gene reduction ... [https://www.sciencedirect.com/science/article/pii/S1674205221003142]
- 15. An angiosperm NLR Atlas reveals that NLR gene reduction ... [https://pubmed.ncbi.nlm.nih.gov/34364002/]
- 16. Bryophytes hold a larger gene family space than vascular plants [https://pmc.ncbi.nlm.nih.gov/articles/PMC12513842/]
- 17. from microbial interaction to horizontal gene transfer [https://www.sciencedirect.com/science/article/abs/pii/S1360138525002845]
- 18. Bryophytes Hold More Gene Families Than Vascular ... [https://en.genomics.cn/en-scientificdiscoverie-7197.html]
- 19. Comparative analysis, diversification, and functional ... [https://www.nature.com/articles/s41598-024-62876-5]
- 20. Tracing evolution in Plants' Transition to Land - mpipz [https://www.mpipz.mpg.de/5683322/pr-nakagami-2025-04]
- 21. This tiny plant survived the vacuum of space and still grows [https://www.sciencedaily.com/releases/2025/11/251124231900.htm]
- 22. Plant cells gain immune capabilities when it's time to fight ... [https://www.salk.edu/news-release/plant-cells-gain-immune-capabilities-when-its-time-to-fight-disease/]
- 23. Rewriting the code of plant immunity | Nature Biotechnology [https://www.nature.com/articles/s41587-025-02886-4]
- 24. Genome-Wide Characterization and Expression Pattern ... [https://pmc.ncbi.nlm.nih.gov/articles/PMC12469828/]
- 25. Conserved and specific immunity across land plants ... [https://www.sciencedirect.com/science/article/pii/S1674205223003994]
- 26. A Primary Survey on Bryophyte Species Reveals Two Novel ... [https://journals.plos.org/plosone/article?id=10.1371/journal.pone.0036700]
- 27. A primary survey on bryophyte species reveals two novel ... [https://pubmed.ncbi.nlm.nih.gov/22615795/]
- 28. Phylogenetic, Structural, and Evolutionary Insights into ... [https://www.mdpi.com/1422-0067/26/5/1828]
- 29. Genome-Wide Identification and Functional Evolution of NLR ... [https://pmc.ncbi.nlm.nih.gov/articles/PMC12562843/]
- 30. Phylogenetic, Structural, and Evolutionary Insights into ... [https://pmc.ncbi.nlm.nih.gov/articles/PMC11899730/]
- 31. Genome-wide identification and characterization of NBS ... [https://www.nature.com/articles/s41598-025-03507-5]
- 32. Genome-Wide Characterization and Expression Pattern ... [https://www.mdpi.com/1422-0067/26/18/9063]
- 33. PRGminer: harnessing deep learning for the prediction of ... [https://www.frontiersin.org/journals/plant-science/articles/10.3389/fpls.2025.1411525/full]
- 34. A Genome-Wide Comparison of NB-LRR Type ... [https://www.sciencedirect.com/science/article/pii/S1016847823071157]
- 35. New publication on bryophytes - Bryology (and Lichenology) [https://bryology.eeb.uconn.edu/2025/09/22/new-publication-on-mosses-13/]
- 36. Degenerate PCR – A guide and tutorial - Skeetersays! [https://skeetersays.wordpress.com/2008/07/10/degenerate-pcr-a-guide-and-tutorial/]
- 37. A comparative analysis of hybridisation capture and PCR ... [https://mbmg.pensoft.net/article/154548/]
- 38. A comparison of drying methods on the quality ... [https://pmc.ncbi.nlm.nih.gov/articles/PMC9683613/]
- 39. The developments and prospects of plant super- ... [https://pmc.ncbi.nlm.nih.gov/articles/PMC11897476/]
- 40. Diversity in Nucleotide Binding Site–Leucine-Rich Repeat ... [https://pmc.ncbi.nlm.nih.gov/articles/PMC187567/]
- 41. Super-Pangenome by Integrating the Wild Side of a ... [https://www.sciencedirect.com/science/article/pii/S136013851930281X]
- 42. Super-pangenome analyses highlight genomic diversity ... [https://www.nature.com/articles/s41588-023-01340-y]
- 43. OrthoFinder: solving fundamental biases in whole genome ... [https://genomebiology.biomedcentral.com/articles/10.1186/s13059-015-0721-2]
- 44. Different orthology inference algorithms generate similar ... [https://pmc.ncbi.nlm.nih.gov/articles/PMC11788906/]
- 45. Current successes and remaining challenges in protein ... [https://www.frontiersin.org/journals/bioinformatics/articles/10.3389/fbinf.2023.1222182/full]
- 46. Current challenges in genome annotation through ... [https://www.sciencedirect.com/science/article/abs/pii/S0959440X12001091?utm_source=chatgpt.com]
- 47. Divergent evolutionary trajectories of bryophytes and ... [https://www.nature.com/articles/s41559-022-01885-x]
- 48. Protein functional annotation of simultaneously improved ... [https://pmc.ncbi.nlm.nih.gov/articles/PMC7412958/]
- 49. Comparative analysis of NBS domain sequences ... [https://www.sciencedirect.com/science/article/abs/pii/S1055790303002744]
- 50. Genome-Wide Comparative Analysis Reveals Similar Types ... [https://journals.plos.org/plosone/article?id=10.1371/journal.pone.0121893]
- 51. Improving gene annotation using peptide mass spectrometry [https://pmc.ncbi.nlm.nih.gov/articles/PMC1781355/]
- 52. Essential Concepts in Gene Prediction and Annotation [https://expertcytometry.com/essential-concepts-in-gene-prediction-and-annotation/]
- 53. Tips for improving genome annotation quality [https://www.maxapress.com/article/id/67e36fa6fa6c5866a7a3e810]
- 54. New insights into bryophyte arabinogalactan‐proteins from a ... [https://pmc.ncbi.nlm.nih.gov/articles/PMC12209756/]
- 55. Effect of genetic convergence on phylogenetic inference [https://www.sciencedirect.com/science/article/abs/pii/S1055790311005082]
- 56. Phylogenetic analysis suggests early divergence followed by ... [https://phytokeys.pensoft.net/article/165998/]
- 57. Research Advances and Prospects of Orphan Genes in ... [https://pmc.ncbi.nlm.nih.gov/articles/PMC9305701/]
- 58. Functional and evolutionary significance of unknown ... [https://www.nature.com/articles/s41586-023-06955-z]
- 59. Genome-Wide Analysis of NBS-LRR Genes From an Early ... [https://www.frontiersin.org/journals/genetics/articles/10.3389/fgene.2022.880071/full]
- 60. Identification, Characterization and Function of Orphan ... [https://www.frontiersin.org/journals/plant-science/articles/10.3389/fpls.2022.872137/full]
- 61. Insights into Land Plant Evolution Garnered from the ... [https://www.sciencedirect.com/science/article/pii/S0092867417311248]
- 62. Guidelines for degenerate primer design and use [https://www.qiagen.com/us/knowledge-and-support/knowledge-hub/bench-guide/pcr/introduction/guidelines-for-degenerate-primer-design-and-use]
- 63. A Primer for Designing Degenerate Primers [https://bitesizebio.com/18992/a-primer-for-designing-degenerate-primers/]
- 64. Predicting sequence-specific amplification efficiency in ... [https://www.nature.com/articles/s41467-025-64221-4]
- 65. Structural characterization and duplication modes of ... [https://www.nature.com/articles/s41598-021-84778-6]
- 66. Distinct patterns of genome size evolution in each ... [https://pubmed.ncbi.nlm.nih.gov/39868530/]
- 67. Plastome diversity and evolution in mosses: Insights from ... [https://www.sciencedirect.com/science/article/abs/pii/S0141813023055071]
- 68. Kastor: a reference-based comparative approach for ... [https://pmc.ncbi.nlm.nih.gov/articles/PMC12007338/]
- 69. PlantTribes: a gene and gene family resource for comparative ... [https://pmc.ncbi.nlm.nih.gov/articles/PMC2238917/]
- 70. PlantTribes2: Tools for comparative gene family analysis in ... [https://www.frontiersin.org/journals/plant-science/articles/10.3389/fpls.2022.1011199/full]
- 71. The Lost and Found: Unraveling the Functions of Orphan Genes [https://pmc.ncbi.nlm.nih.gov/articles/PMC10299390/]
- 72. Research Advances and Prospects of Orphan Genes in ... [https://www.frontiersin.org/journals/plant-science/articles/10.3389/fpls.2022.947129/full]
- 73. Rethinking de novo genes in plants: mechanisms ... [https://www.frontiersin.org/journals/plant-science/articles/10.3389/fpls.2025.1724832/full]
- 74. A Comprehensive Comparative Analysis and Phylogenetic ... [https://www.mdpi.com/1467-3045/47/12/978]
- 75. TIR-NBS-LRR genes are rare in monocots - PubMed Central [https://pmc.ncbi.nlm.nih.gov/articles/PMC2763876/]
- 76. Evolutionary analysis of TIR- and non-TIR-NBS-LRR ... [https://www.frontiersin.org/journals/plant-science/articles/10.3389/fpls.2024.1452251/full]
- 77. Plant NBS-LRR proteins: adaptable guards - PubMed Central [https://pmc.ncbi.nlm.nih.gov/articles/PMC1557992/]
- 78. Genome-wide comparative analysis of NBS-encoding genes ... [https://bmcgenomics.biomedcentral.com/articles/10.1186/1471-2164-15-3]
- 79. Evolution of immunity networks across embryophytes [https://www.sciencedirect.com/science/article/abs/pii/S1369526623001152]
- 80. Rates and patterns of molecular evolution in bryophyte ... [https://pubmed.ncbi.nlm.nih.gov/34438050/]
- 81. Testing for the Genomic Footprint of Conflict Between Life ... [https://pmc.ncbi.nlm.nih.gov/articles/PMC12351284/]
- 82. Selection drives convergent gene expression changes ... [https://www.nature.com/articles/s41559-022-01692-4]
- 83. Taking the lead: NLR immune receptor N‐terminal domains ... [https://pmc.ncbi.nlm.nih.gov/articles/PMC10952240/]