Automating Harvest: How Robotics and AI Are Reducing Labor Costs in Vertical Farming by up to 95%
This article examines the transformative impact of automation on labor requirements in vertical farming.
Automating Harvest: How Robotics and AI Are Reducing Labor Costs in Vertical Farming by up to 95%
Abstract
This article examines the transformative impact of automation on labor requirements in vertical farming. It explores the foundational technologies—including autonomous robotics, AI, and IoT—that are reshaping harvesting processes. For researchers and scientists, the content provides a methodological analysis of system implementation, a troubleshooting guide for operational optimization, and a comparative validation of performance metrics. The synthesis of current data and future trends offers critical insights for the application of controlled-environment agriculture principles in technologically demanding fields.
The Imperative for Automation: Addressing Labor Shortages and Scaling Production
Frequently Asked Questions (FAQs)
Q1: What is the core hypothesis linking vertical farm automation to the global agricultural labor gap?
The core hypothesis is that the stagnating growth of global agricultural productivity, coupled with a structural decline in the agricultural labor force, is creating a critical workforce gap. Automated vertical farming presents a potential research pathway to address this by fundamentally restructuring agricultural labor. It shifts the required workforce from a large number of manual laborers to a smaller number of skilled technicians operating automated systems, thereby mitigating the risks associated with labor scarcity [1] [2] [3].
Q2: What quantitative evidence supports the existence of a global agricultural labor challenge?
Recent data reveals a dual challenge of slowing productivity and shifting labor patterns, creating a significant gap between agricultural output and future demand.
- Table 1: Global Agricultural Productivity and Labor Metrics
| Metric | Current Value | Target Value | Source / Context |
|---|---|---|---|
| Global Total Factor Productivity (TFP) Growth | 0.76% per year | 2.0% per year | Virginia Tech 2025 GAP Report [3] |
| U.S. TFP Growth (2011-2020) | -0.05% per year | Positive growth required | Virginia Tech 2025 GAP Report [3] |
| People Employed in Agrifood Systems (2022) | 1.3 billion | ~40% of global workforce | FAOSTAT [4] |
| People Employed in Agriculture (2023) | 916 million | 26.1% of global employment | FAOSTAT [4] |
| Agricultural Labor Force in Africa (2023) | 46% of total employment | Highest regional share | FAOSTAT [4] |
| Agricultural Labor Force in Europe (2023) | 5% of total employment | Lowest regional share | FAOSTAT [4] |
| Projected Agtech Market Growth (CAGR) | 16.6% | $43.3B by 2029 | Alphabridge Market Report [5] |
Q3: Which automated vertical farming technologies show the highest potential for labor reduction in harvesting?
Research indicates that integrated systems, rather than single technologies, are most effective. The following technologies are critical for automating the harvesting workflow and reducing direct human labor.
- Table 2: High-Impact Automation Technologies for Vertical Farm Harvesting
| Technology | Estimated Adoption Rate (2025) | Primary Function in Harvesting | Impact on Labor |
|---|---|---|---|
| Autonomous Robotics & AGVs | 55% | Handles planting, crop maintenance, harvesting, and packaging with precision 24/7 [1]. | Dramatically reduces manual harvesting and handling tasks [1] [2]. |
| AI-Powered Environmental Control & Sensors | 70% | Optimizes pre-harvest growth conditions to maximize yield and synchronize crop maturity [1]. | Reduces labor for manual climate monitoring and adjustments, leading to more efficient harvest cycles [1]. |
| IoT-Driven Resource Management | 68% | Enables predictive maintenance on harvesting equipment and real-time monitoring of crop readiness [1]. | Minimizes system downtime and labor lost to equipment failure [1]. |
| Cloud-Based Management Platforms | 80% | Integrates data from all systems for remote oversight, analytics, and optimization of the entire harvest workflow [1]. | Allows a smaller, more skilled workforce to manage a larger operation [1]. |
Q4: My experimental automated harvesting rig is experiencing inconsistent cut quality. What are the primary troubleshooting steps?
Inconsistent cuts can compromise produce shelf-life and invalidate experimental results. Follow this systematic protocol to isolate and resolve the issue.
- Experimental Workflow: Troubleshooting Harvesting Rig Performance
Q5: Our research on energy consumption in automated vertical farms is yielding highly variable data. How can we standardize our measurement protocol?
Energy consumption is a critical variable in evaluating the economic and environmental viability of automated vertical farms. A standardized experimental protocol is essential for generating reproducible and comparable data.
- Experimental Protocol: Standardized Energy Consumption Profiling
The Scientist's Toolkit: Research Reagent Solutions
This table details essential materials and technologies for constructing and analyzing automated vertical farming systems, with a focus on labor reduction research.
- Table 3: Key Research Reagents and Technologies
| Item / Solution | Function in Research | Specific Application Example |
|---|---|---|
| Robotic Arms & End-Effectors | To automate repetitive physical tasks, replacing manual labor. | Integrating soft-gripper or blade end-effectors for autonomous harvesting of delicate leafy greens to study yield loss and cycle time [1] [6]. |
| IoT Sensor Network | To provide real-time, granular data on the growth environment and system performance. | Deploying clusters of sensors for temperature, humidity, and CO2 to correlate environmental stability with automated harvest success rates [1]. |
| AI & Machine Learning Platforms | To analyze complex datasets and enable predictive, automated decision-making. | Training computer vision models to identify harvest-ready crops and direct robotic harvesters, measuring accuracy against human scouts [1] [5]. |
| Cloud-Based Data Integration Platforms | To serve as the digital backbone for aggregating and analyzing data from all subsystems. | Using platforms like the proposed GAP IQ to model the relationship between automation, energy use, and labor efficiency [1] [3]. |
| Hydroponic/Aeroponic Nutrient Solutions | To provide the essential nutrients for plant growth in a soil-less, controlled environment. | Formulating standardized nutrient solutions to ensure consistent plant growth, which is critical for testing the reliability of automated systems across multiple crop cycles [7] [6]. |
| Modular Farm Hardware (e.g., AutoStore Grid) | To provide a physical testbed that maximizes space utilization and integrates with robotics. | Utilizing cube-based storage grids to automate the movement of plant trays, studying the impact on labor hours required for plant maintenance and logistics [6]. |
Vertical farming, the practice of growing crops in vertically stacked layers within controlled environments, is undergoing a profound transformation driven by three core technologies: Robotics, Artificial Intelligence (AI), and the Internet of Things (IoT). These technologies are central to a new agricultural paradigm that maximizes space, conserves resources, and fundamentally redefines the role of labor. Automation shifts the focus from manual, repetitive tasks to high-skill, data-centric oversight—a transition often described as a Capital-for-Code substitution vector [8]. This document provides a technical overview and troubleshooting guide for researchers integrating these systems into their vertical farming experiments.
Core Technology Deep Dive
Robotics: The Physical Labor Force
Robotics in vertical farming replaces labor-intensive manual processes with precision automation, directly targeting operational expenditure (OpEx) reductions from 30-50% to less than 10% [8].
- Primary Functions: Key automated tasks include seeding, monitoring, harvesting, and the movement of growing trays within the farm [9] [10]. Advanced systems use robotic arms on gantries or autonomous mobile robots (AMRs) to navigate the growing facility [11].
- System Architecture: A common implementation is the cube-based Grid system, where robots travel atop a dense matrix of storage Bins containing growing trays, delivering them to centralized workstations [9]. This design eliminates aisles, maximizing space efficiency, which is critical in urban settings [9].
Common Challenge: Robotic Harvesting Precision
- Problem Statement: Robotic harvesters struggle to harvest delicate fruits (e.g., tomatoes) without damaging the plant, leading to yield loss and system downtime [10].
- Troubleshooting Protocol:
- Calibrate Machine Vision: Recalibrate the system's cameras and sensors under the specific LED lighting spectrum used in the growth chamber. Ensure lighting is uniform and free of flicker that can interfere with sensors.
- Validate End-Effector Parameters: Check the grip force and tactile feedback of the end-effector (gripper). Test on a sample of plant stems and fruits to fine-tune pressure settings.
- Update Harvesting Algorithm: Verify that the harvesting path algorithm incorporates collision-avoidance protocols for adjacent plants and support structures.
Artificial Intelligence: The Cognitive Engine
AI, particularly machine learning (ML) and deep learning (DL), serves as the brain of the automated vertical farm, enabling predictive modeling and complex decision-making [12].
- Primary Functions:
- Yield Prediction: Analyzing historical and real-time data to forecast harvest windows and volumes [12].
- Disease Detection: Using computer vision to identify plant stress, pests, or diseases from image data [12].
- Climate & Nutrient Control: Employing advanced algorithms to tailor the environment (e.g., temperature, humidity, CO2) and nutrient recipes for different crop species and growth stages [11].
Common Challenge: Inaccurate AI Yield Predictions
- Problem Statement: AI models for predicting crop yield are providing inaccurate forecasts, leading to supply chain and resource allocation issues.
- Troubleshooting Protocol:
- Audit Training Data: Verify the quantity, quality, and diversity of the dataset used to train the model. Ensure it includes data from multiple growth cycles and accounts for phenotypic variations.
- Cross-Validate Input Variables: Correlate yield predictions with all input variables (light, nutrients, CO2, plant health indicators) to identify potential sensor drift or data corruption in a key metric.
- Retrain with New Data: Implement a continuous learning pipeline where the model is periodically retrained with the most recent operational data to adapt to system drifts.
Internet of Things (IoT): The Peripheral Nervous System
IoT networks, comprised of interconnected sensors, provide the real-time data required for AI and robotic systems to function [13]. They form the biocybernetic feedback loops that enable micro-adjustments to the growing environment [8].
- Primary Sensors and Functions:
- Temperature & Humidity Sensors: Maintain optimal climatic conditions [13].
- Light Sensors: Ensure crops receive the correct light intensity and duration [13].
- Nutrient Sensors: Measure concentrations of essential elements (N, P, K) in hydroponic solutions [13].
- CO2 Sensors: Regulate carbon dioxide levels to maximize photosynthetic efficiency [13].
- Soil Moisture Sensors: Manage irrigation in substrate-based systems [13].
Common Challenge: IoT Sensor Data Inconsistency
- Problem Statement: Sensor readings (e.g., nutrient concentration, humidity) are inconsistent or drifting, leading to flawed automated responses.
- Troubleshooting Protocol:
- Check Calibration Schedules: Confirm that all sensors are calibrated according to the manufacturer's recommended schedule. Implement a digital log for calibration dates.
- Diagnose Signal Integrity: Use a network analyzer to check for packet loss or interference in the wireless sensor network, especially in environments with high water and metal content.
- Inspect for Biofouling: Physically inspect sensor probes, particularly nutrient and pH sensors, for biofilm or mineral buildup, which can cause significant reading drift.
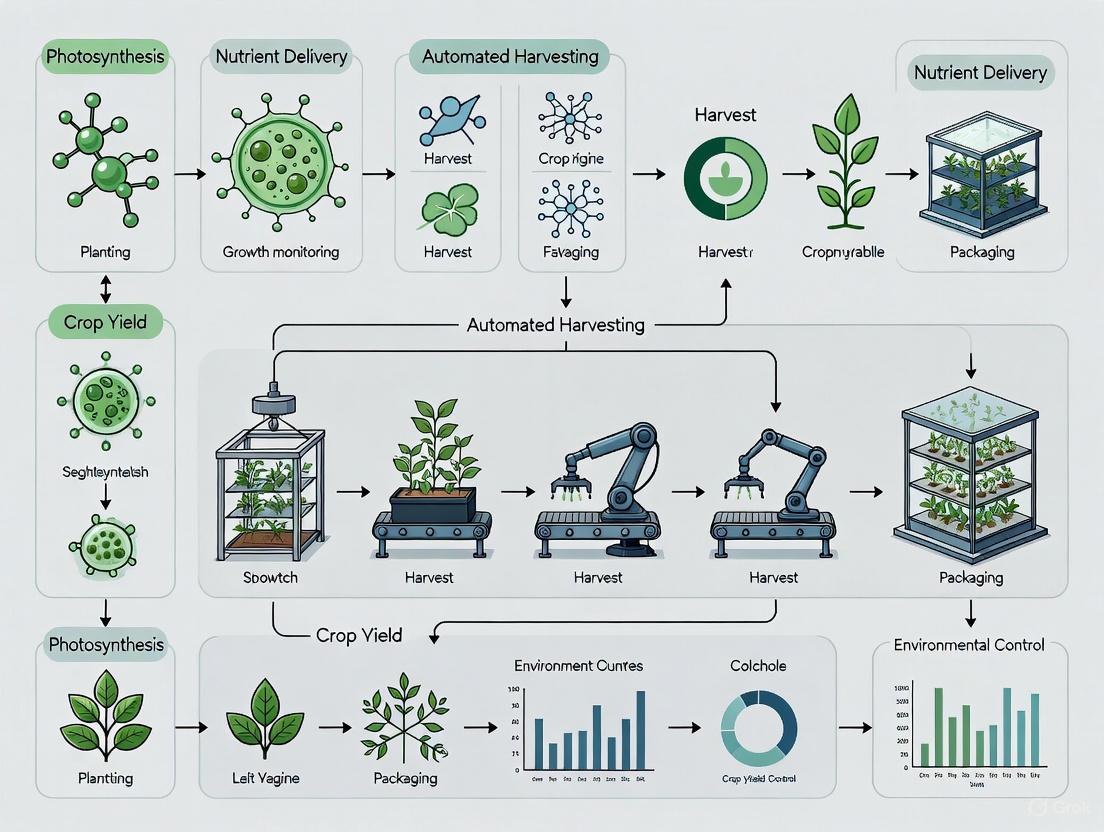
Integrated System Workflow
The following diagram illustrates the logical relationship and data flow between the core technologies in an automated vertical farm.
Quantitative Performance Data
The integration of these technologies yields measurable gains in efficiency, productivity, and sustainability. The table below summarizes key performance metrics.
Table 1: Performance Metrics of Core Vertical Farming Technologies
| Technology | Key Metric | Impact/Value | Source |
|---|---|---|---|
| Robotic Automation | Labor Cost Reduction | Decreases OpEx from 30-50% to <10% | [8] |
| IoT & Automation | Water Usage Efficiency | Up to 95% less water than traditional farming | [9] [11] |
| AI & IoT Monitoring | Pesticide Use Reduction | Up to 85% reduction in pesticide application | [14] |
| Cube Storage Robotics | System Uptime | 99.7% operational reliability | [9] |
| Intelligent Spray Systems | Spray Drift Reduction | Reduces spray drift by up to 87% | [14] |
Essential Research Reagents & Materials
For researchers replicating or building upon these technologies, the following table details key components of an automated vertical farming research platform.
Table 2: Research Reagent Solutions for Automated Vertical Farming
| Item / Solution | Function / Application | Technical Specification / Purpose |
|---|---|---|
| Universal Intelligent Spray Control System | Precision application of pesticides/nutrients [14]. | Retrofit unit for conventional sprayers; uses sensors for targeted application, reducing chemical use. |
| Low-Cost Wireless HTP System | High-throughput phenotyping for breeding and stress assessment [14]. | Portable sensor suite (multispectral camera, IR thermometer, LiDAR) for UAV or indoor platform mounting. |
| Open-Source Biocybernetic Protocols | Prevents vendor lock-in and fosters reproducible research [8]. | Standardized communication and control interfaces for sensors, actuators, and AI models. |
| AI-Powered Environmental Suites | Real-time feedback on plant health and growth conditions [11]. | Integrated sensor arrays (temp, humidity, nutrients) with AI for data analysis and predictive adjustment. |
| Modular Robotic Grow Modules | Enables experimental flexibility and scalable system design [11]. | Standardized, stackable units that can be assembled/disassembled for various experimental layouts. |
Frequently Asked Questions (FAQs)
Q1: What is the most significant technical barrier to scaling vertical farming with full automation? The primary challenge is achieving economic viability at scale. High initial capital expenditure (CapEx) and intense energy demands for lighting and HVAC are major hurdles [10] [7]. Furthermore, developing robotics sophisticated enough to handle delicate tasks like harvesting without damaging plants remains a technical bottleneck that limits the variety of profitable crops [10].
Q2: Our AI model for nutrient management is overfitting to our test environment. How can we improve its generalizability? This is a common issue. The solution involves:
- Federated Learning: Collaborate with other research institutions to train the model on diverse, decentralized datasets without sharing raw data, improving its robustness [8].
- Data Augmentation: Artificially expand your training dataset by creating variations of your existing sensor data (e.g., introducing noise, simulating sensor drift).
- Incorporate Traditional Agronomy: Integrate domain knowledge from plant scientists and traditional agronomy to constrain the model's decisions within biologically plausible parameters, preventing absurd outputs.
Q3: From a labor perspective, what is the net effect of automation in vertical farming? Automation creates a labor polarization. It systematically reduces low-skill, high-volume manual jobs (e.g., planting, harvesting, packing) while creating demand for high-skill, low-volume technical roles such as Agri-Informatics Engineers, Mechatronics Technicians, and Data Stewards [8]. The net effect is a shift from physical labor to data stewardship and code-centric oversight.
Q4: How can we ensure data security and system resilience in a highly automated farm? The risk of a "Brittle Technocratic Archipelago" is real [8]. Mitigation strategies include:
- Open-Source Platforms: Advocate for and use open-source biocybernetic protocols to avoid proprietary system monocultures [8].
- Modular Design: Implement a system of smaller, interconnected farms. A failure in one module does not cascade into a system-wide collapse.
- Cybersecurity Hygiene: Implement standard IT security practices: network segmentation, regular software patches, and strict access controls for the farm's operational technology (OT) network.
Q5: What crops are most suitable for current automated vertical farming systems? The economics currently favor high-value, fast-growing crops with a high harvest index. The most profitable crops are typically leafy greens (lettuce, kale), herbs (basil, cilantro), and microgreens [9] [15]. Their compact size and short growth cycles align well with the high-cost structure of controlled environments and the capabilities of existing automation.
Vertical farming represents a fundamental shift in agricultural methodology, moving food production into enclosed, controlled environments where crops are grown in vertically stacked layers [7]. This transition from traditional, manual farming to highly automated systems is driven by the need to address global challenges such as food security, labor shortages, and climate uncertainty [16]. For researchers in controlled environment agriculture (CEA), understanding this trajectory is crucial for designing experiments that optimize automation technologies, reduce labor dependencies, and maximize system efficiency. This technical support center provides the foundational knowledge and troubleshooting guidance necessary for advancing research in automated vertical farm harvesting.
Current Landscape and Quantitative Metrics
The vertical farming market is experiencing accelerated growth and technological adoption. The following tables summarize key quantitative metrics essential for research benchmarking and experimental design.
Table 1: 2025 Vertical Farming Market and Performance Metrics
| Metric Category | 2025 Value or Range | Context and Significance |
|---|---|---|
| Global Market Value | USD ~9.5 billion | Projected market size for commercial vertical farming systems [17]. |
| Market Growth Rate (CAGR) | ~23% | Annual growth rate, signaling rapid industry expansion [17]. |
| Labor Cost Reduction | 20-30% | Reduction in costs for repetitive tasks through automation [16]. |
| Yield Increase (vs. Traditional) | Up to 70% | Potential yield increase for automated vertical farms [1]. |
| Water Usage Reduction | Up to 95% | Efficiency of closed-loop hydroponic systems compared to traditional agriculture [17]. |
| Crop Cycle Acceleration | Up to 50% faster | Example: Lettuce cycle completed in under 30 days [17]. |
Table 2: 2025 Adoption Rates and Impact of Core Automation Technologies
| Automation Technology | Estimated Adoption Rate (2025) | Primary Research Impact |
|---|---|---|
| Cloud-Based Management Platforms | 80% | Enables seamless data integration and remote system control [1]. |
| AI-Powered Environmental Control | 70% | Optimizes growth conditions via real-time sensor data and algorithms [17] [1]. |
| IoT-Driven Resource Management | 68% | Provides predictive maintenance and granular tracking of inputs [1]. |
| Satellite & AI Crop Monitoring | 62% | Allows for non-invasive crop health and stress detection [1]. |
| Autonomous Robotics | 55% | Addresses harvesting, planting, and maintenance labor challenges [17] [1]. |
Troubleshooting Common Technical Challenges
Even in controlled environments, researchers encounter operational hurdles. Below is a troubleshooting guide for common issues in automated vertical farming research.
Problem: Inconsistent Yield and Crop Quality Across Growth Layers
- Possible Cause 1: Non-uniform lighting intensity or spectrum across vertical layers.
- Solution: Use a PAR (Photosynthetic Photon Flux Density) meter to measure light levels at multiple points on each layer. Calibrate or reposition LEDs to ensure consistent PPFD levels as per crop-specific requirements [18].
- Possible Cause 2: Inadequate air circulation creating microclimates with varying temperature and humidity.
- Solution: Install and strategically position circulation fans to ensure consistent air velocity and climate conditions across all layers. Monitor with multiple, calibrated sensors [18].
Problem: Robotic Harvesting System Damaging Delicate Produce
- Possible Cause 1: End-effector grip force is incorrectly calibrated for the target crop.
- Solution: Utilize a force gauge to measure and adjust the gripper's pressure settings. For soft fruits like strawberries, employ bio-inspired or soft robotic grippers to minimize mechanical stress [19].
- Possible Cause 2: Computer vision system misidentifying ripeness or stem location.
- Solution: Retrain the AI model with a more diverse and extensive dataset of images under different lighting conditions. Improve accuracy by integrating multispectral imaging to better assess maturity [19].
Problem: Nutrient Imbalance or Lockout in Hydroponic Systems
- Symptom: Yellowing (chlorosis), purple/red leaves, or leaf tip burn [18].
- Solution Protocol:
- Measure Electrical Conductivity (EC): High EC indicates nutrient toxicity or salt buildup, while low EC suggests deficiency.
- Measure pH Level: For hydroponics, maintain pH between 5.5 and 6.5. A pH outside this range causes nutrient lockout, where plants cannot absorb nutrients even if they are present [18].
- Corrective Action: If EC is high and pH is off, flush the system with a pH-balanced, mild nutrient solution. If EC is low, incrementally increase nutrient concentration to the target level.
Problem: Persistent Mold (e.g., Powdery Mildew) or Pest Infestation
- Possible Cause: High humidity and poor air circulation, or introduction via new plant material [18].
- Solution Protocol:
- Environmental Control: Use a hygrometer to monitor humidity, maintaining it between 40-60%. Use dehumidifiers and increase airflow with fans [18].
- Prevention: Strictly quarantine and inspect all new plant materials before introducing them to the main growth environment.
- Treatment: Apply neem oil or insecticidal soap. For larger, enclosed research setups, introduce beneficial insects like ladybugs for aphid control [18].
Experimental Protocols for Automation Research
Protocol 1: Quantifying Labor Reduction in Automated Harvesting
- Objective: To empirically measure the reduction in manual labor hours and increase in harvesting efficiency using an autonomous robotic system compared to traditional manual methods.
- Materials: Robotic harvester (e.g., with soft-touch end effectors), controlled growth environment, target crop (e.g., leafy greens, strawberries), timer, data logging software.
- Methodology:
- Setup: Establish two identical growth chambers with the same crop at the same maturity stage.
- Control Group: In Chamber A, trained personnel will harvest the crop using standard manual tools and techniques.
- Experimental Group: In Chamber B, the robotic harvesting system will perform the harvest.
- Data Collection:
- Record the total time taken to harvest all viable produce in each chamber.
- Record the number of personnel/robots involved.
- Weigh the total yield and classify the produce based on quality (e.g., marketable vs. damaged).
- Analysis: Calculate labor hours per kilogram of yield. Compare the percentage of damaged produce and overall throughput (kg/hour) between the two groups.
Protocol 2: Optimizing AI-Driven Nutrient Dosing Algorithms
- Objective: To develop and validate a machine learning algorithm that dynamically adjusts nutrient composition based on real-time plant physiology data.
- Materials: IoT sensors (pH, EC, multi-ion), AI control platform (e.g., Farmonaut, Autogrow), actuator-controlled nutrient dosing system, spectral imaging camera.
- Methodology:
- Baseline: Grow a control crop with a standard, static nutrient recipe.
- Sensor Integration: Set up sensors to continuously monitor nutrient solution and environmental data.
- Plant Phenotyping: Use spectral imaging (e.g., NDVI) to non-destructively track plant health and growth metrics.
- Algorithm Training: Train a model to correlate sensor inputs and spectral phenotypes with optimal nutrient adjustments. Use reinforcement learning to allow the algorithm to iteratively improve dosing strategies.
- Validation: Run an experimental group where the AI algorithm controls nutrient dosing. Compare final yield, biomass, and resource use efficiency (e.g., water and nutrients per gram of biomass) against the control group.
The logical workflow for this experimental setup is outlined below.
Essential Research Reagents and Solutions
Table 3: Key Research Reagent Solutions for Automated Vertical Farming
| Reagent / Material | Function in Research | Technical Notes |
|---|---|---|
| Hydroponic Nutrient Solutions | Provides essential macro and micronutrients for plant growth in soilless systems. | Formulations are crop-specific. Critical to monitor and adjust EC and pH for different growth stages [20]. |
| pH Buffers (4.0, 7.0, 10.0) | For precise calibration of pH meters to ensure accurate nutrient management. | Regular calibration is necessary for data integrity, especially in closed-loop systems [18]. |
| Spectral Reflectance Standards | Calibrates multispectral and hyperspectral imaging systems for consistent plant phenotyping. | Essential for quantitative comparison of vegetation indices (e.g., NDVI) across experiments [1] [19]. |
| Sterilization Agents (e.g., Ethanol, Bleach) | Prevents microbial contamination and cross-contamination in tissue culture and system components. | Used for surface sterilization of seeds, tools, and growth chambers [18]. |
| Sensor Calibration Solutions | Ensures accuracy of critical sensors for EC, CO2, and dissolved oxygen. | Using uncalibrated sensors is a common source of experimental error and non-reproducible results. |
Frequently Asked Questions (FAQs)
Q1: What are the most significant technical bottlenecks preventing the widespread automation of vertical farms for large-scale fruit production? The primary bottlenecks involve robotic manipulation and computer vision. Harvesting fragile fruits like tomatoes requires sophisticated grippers to avoid bruising, and vision systems must reliably identify ripe fruit occluded by leaves and stems in dense foliage [19]. Furthermore, the high energy cost of providing sole-source lighting for fruiting crops, which have higher light requirements than leafy greens, remains a major economic challenge [7] [20].
Q2: How can researchers accurately model and quantify the return on investment (ROI) for implementing automation in a vertical farm? ROI models must extend beyond simple yield comparisons. Researchers should track metrics such as labor hours saved per kilogram of output, reduction in crop loss from improved monitoring, and changes in energy and water consumption per unit of produce [17] [16]. The high initial capital expenditure for robotics and control systems should be analyzed against long-term operational savings and potential yield increases of 20-35% [1] [16].
Q3: Our research facility is experiencing intermittent failures in the IoT sensor network monitoring our growth chambers. What are the first steps in troubleshooting? Begin by diagnosing power and connectivity. Check for inadequate power supply to sensor nodes and test network signal strength at the location of failed nodes. Then, verify the integrity of data logging protocols and look for data packet loss or corruption. Using a systematic diagnostic workflow, as illustrated below, can efficiently isolate the root cause.
Q4: From a experimental design perspective, what are the key variables to control when comparing the performance of different cultivars in an automated vertical farm? To ensure valid comparisons, researchers must rigidly control the microenvironment: light (intensity, spectrum, and photoperiod), air (temperature, humidity, and CO2 concentration), and root zone (nutrient solution composition, pH, EC, and temperature) [7] [20]. Automation systems themselves can be used to maintain these variables consistently. The key is to ensure the only major variable between experimental groups is the cultivar being tested.
Q5: What are the emerging technologies most likely to impact vertical farming automation beyond 2025? Research should focus on swarm robotics for collaborative task execution, explainable AI for transparent and trustworthy environmental control decisions, and the integration of renewable energy sources to mitigate the high carbon footprint associated with LED lighting and HVAC systems [17] [19]. Furthermore, the expansion of "Robot-as-a-Service" (RaaS) models could make advanced automation more accessible for research institutions with limited capital funding [19].
For researchers and scientists in agricultural technology, understanding the precise relationship between labor automation and financial performance is critical. This technical support center provides a foundational framework and troubleshooting guide for modeling this relationship within the context of vertical farming. The following FAQs, data tables, and experimental protocols are synthesized from current market analyses and economic research to support your investigations into automation's impact on unit economics and profitability.
Frequently Asked Questions
FAQ 1: What is the primary economic mechanism through which automation improves unit economics in vertical farming? The primary mechanism is the reduction of high-variable costs, particularly labor, and the optimization of resource use, which together lower the cost per unit produced. Automation transforms manual, repetitive tasks—such as planting, monitoring, and harvesting—into fixed capital costs. This shift allows for greater operational scalability without a proportional increase in variable expenses. Key operational metrics affected include:
- Labor Cost per Kilogram: Automated systems can reduce the labor required for harvesting and handling by 20-40% [1].
- Yield per Square Meter: AI-controlled environments can increase yields by 30-45% by optimizing growing conditions [1].
- Resource Efficiency: Automation enables precise control, leading to water savings of up to 90% and significant reductions in fertilizer use [21].
FAQ 2: Our financial model shows automation's capital expenditure (CAPEX) erasing projected labor savings. What are we missing? This common miscalculation often stems from an over-emphasis on direct labor replacement and an under-appreciation of automation's secondary benefits. A complete model should account for:
- Increased Throughput: Automated systems enable 24/7 operation and faster crop cycles, leading to more harvests per year and higher asset utilization [21].
- Improved Quality and Consistency: Automated handling reduces damage, and controlled environments produce more uniform, premium-grade produce, which can command higher prices and reduce loss [9].
- Reduced Shrinkage: Precision in environmental control and harvesting minimizes crop loss due to disease, pests, or human error.
- Data-Driven Optimization: The operational data collected by automated systems allows for continuous refinement of growth recipes, further boosting yields and efficiency over time [1].
FAQ 3: Which specific automation technologies currently demonstrate the strongest return on investment (ROI) for vertical farms? Current market data indicates that ROI is strongest for technologies that directly impact core cost centers and throughput. The following table summarizes the impact of key technologies based on 2025 adoption trends [1]:
Table 1: ROI Profile of Key Vertical Farming Automation Technologies
| Technology Trend | Core Impact | Estimated Yield Increase | Estimated Resource Savings |
|---|---|---|---|
| AI-Powered Environmental Control | Optimizes light, temperature, and CO2 for maximum growth. | 30-45% | 35-50% |
| Autonomous Robotics (Planting/Harvesting) | Reduces labor costs and enables 24/7 operation. | 20-35% | 20-40% |
| IoT-Driven Resource Management | Monitors and controls water and energy use in real-time. | 15-25% | 30-55% |
FAQ 4: From a labor economics perspective, how does automation differentially affect high-skill vs. low-skill wages in this sector, and how should this be modeled? Automation's impact is not uniform. Research indicates it often displaces manual, low-skill tasks while increasing demand for high-skill technical oversight [22]. This can lead to a "hollowing out" of mid-skill roles and a polarization of the workforce.
- Modeling Low-Skill Labor: Assume a decrease in demand and downward pressure on wages for manual tasks like harvesting and packing, as these are prime targets for automation [23].
- Modeling High-Skill Labor: Assume an increase in demand and upward pressure on wages for roles in data science, robotics maintenance, and agricultural biology, as these roles manage and optimize the automated systems [22]. The net effect on a farm's total wage bill depends on the ratio of displaced to created jobs.
Experimental Protocols & Methodologies
Protocol 1: Measuring the Impact of Harvesting Automation on Unit Labor Cost
1. Objective: To quantify the change in unit labor cost ($/kg) before and after the implementation of an autonomous harvesting robotics system.
2. Hypothesis: The integration of a robotic harvesting system will reduce the unit labor cost for harvesting operations by a minimum of 25% while maintaining or improving harvest quality.
3. Materials & Reagents:
- Mature crop growth cycle (e.g., leafy greens, strawberries).
- Automated harvesting robotic system (e.g., robotic arms, vision systems).
- Manual harvest control group.
- Data logging equipment (time-tracking software, scales).
- Quality assessment toolkit (grading scales, spectrophotometer for color consistency).
4. Methodology:
1. Baseline Phase: For a minimum of three harvest cycles, measure and record:
* Total person-hours required for manual harvesting.
* Total weight of marketable yield harvested.
* Labor cost per hour.
* Quality metrics (e.g., damage rate, uniformity).
2. Intervention Phase: Integrate the autonomous harvesting system. For the subsequent three harvest cycles, measure and record:
* Total system operating hours (including human supervision time).
* Total weight of marketable yield harvested.
* Fully-loaded operational cost of the system (amortized CAPEX + energy + maintenance).
* The same quality metrics from the baseline phase.
3. Calculation:
* Unit Labor Cost (Manual): (Total Person-Hours * Hourly Wage) / Total Yield (kg)
* Unit Operational Cost (Automated): (Total System Cost for Harvest) / Total Yield (kg)
4. Analysis: Compare the two unit costs. Perform a t-test to determine if the observed reduction is statistically significant. Correlate with quality metrics to ensure no degradation.
Protocol 2: Modeling the Effect of AI-Driven Environmental Control on Yield and Profitability
1. Objective: To build a deterministic financial model that projects the impact of AI-driven environmental control on crop yield, revenue, and gross margin.
2. Hypothesis: AI optimization of climate variables will increase annual yield by over 30%, leading to a payback period for the system of under 24 months.
3. Methodology:
1. Data Collection: Gather one year of historical data on:
* Yield per harvest cycle (kg/m²).
* Energy consumption (kWh).
* Water consumption (liters).
* Average selling price ($/kg).
2. Model Inputs:
* CAPEX: Total cost of the AI and sensor system.
* Assumed Yield Increase: Apply a conservative 30% increase to historical yield data [1].
* Assumed Resource Savings: Model a 40% reduction in energy and water costs based on real-time optimization [1].
* Revenue Calculation: (Historical Yield * 1.3) * Selling Price
* Cost Calculation: Reduce historical utility costs by 40%; add system depreciation.
3. Output Metrics:
* Gross Margin: (Revenue - Cost of Goods Sold) / Revenue
* Payback Period: CAPEX / (Annual Incremental Cash Flow)
* Return on Investment (ROI): (Net Financial Gain / CAPEX) * 100
Mandatory Visualizations
Diagram 1: Automation's Path to Profitability
This diagram illustrates the logical sequence and key drivers through which automation in vertical farming impacts unit economics and ultimately leads to improved profitability.
Diagram 2: Automation System Data Flow
This workflow details the data collection, processing, and actuation loop of an AI-powered environmental control system, a core component of automated vertical farms.
The Scientist's Toolkit: Key Research Reagent Solutions
This table details essential materials and their functions for conducting research on automation and unit economics in controlled environment agriculture.
Table 2: Essential Research Materials for Automation and Economics Studies
| Research Reagent / Material | Function & Application in Experimental Protocols |
|---|---|
| Precision Sensors (IoT) | Measures real-time environmental variables (light, CO2, humidity, nutrients). Provides the foundational data for Protocol 2 and cost-benefit analysis. |
| Automated Harvesting Robotics | Serves as the primary intervention in Protocol 1. Used to measure the direct impact of automation on labor hours and unit cost. |
| Cloud-Based Data Platform | Aggregates and stores sensor, yield, and cost data. Essential for longitudinal analysis and building the financial model in Protocol 2. |
| Modular Grow Racks & Systems | Provides a standardized, replicable physical growing environment. Critical for running controlled experiments and A/B testing different automation strategies. |
| Financial Modeling Software | Platform for integrating operational data (yield, resource use) with cost data to build the profitability models outlined in Protocol 2. |
Systems in Action: Implementing Robotic Harvesting and AI Workflows
Technical Support Center
Frequently Asked Questions (FAQs)
Q1: What are the most common causes of a low fruit detection success rate in our robotic harvesting system? Low success rates often stem from suboptimal lighting conditions that create shadows and highlights, confusing the vision algorithm. Ensure consistent, diffuse lighting in your testing environment. Furthermore, the deep learning model may not be sufficiently generalized; this requires training with a more extensive and varied dataset that includes fruits under different occlusion levels, at various stages of ripeness, and in diverse orientations [24]. Regular re-calibration of the RGB-D camera is also critical to maintain detection accuracy.
Q2: Our robotic gripper frequently damages delicate fruits during harvesting. How can this be mitigated? Fruit damage is frequently caused by excessive grip force or a poorly designed end-effector. Investigate the use of soft robotic grippers made from low-modulus materials, which provide a secure yet yielding contact surface to distribute pressure and prevent bruising [24]. Additionally, integrate force sensors to provide real-time feedback, allowing the system to use the minimum necessary force for a secure grip.
Q3: How can we reduce the high post-harvest losses observed in our automated leafy green system? High losses in leafy greens are often related to the harvesting and handling process. For systems using cutters, ensure blades are consistently sharp to create clean cuts that heal quickly. Consider redesigning the harvesting path and conveyor system to minimize the drop height and reduce impact forces on the produce. Companies like Rooted Robotics have developed harvesters specifically designed to significantly reduce loss for microgreens, baby greens, and whole-head crops [25].
Q4: Our autonomous weeding robot's laser is ineffective. What could be the issue? The efficacy of laser weeding depends on precise targeting and sufficient energy delivery. Verify that the computer vision system for weed identification is accurately segmenting weeds from the crop and soil. The laser system must be correctly focused on the identified weed meristems. Also, ensure the robot's power system can supply adequate energy for the laser to induce severe damage to the targeted weeds [25].
Q5: What is a typical benchmark for harvesting speed and success rate we should aim for? Performance metrics have improved significantly. Early prototypes had recognition rates of around 80% and harvesting times of tens of seconds per apple [26]. Modern systems, leveraging advanced computer vision and AI, can achieve fruit identification success rates above 95% with a reduced number of reattempts [24]. The harvesting cycle time is now a key focus for research to match human picker speeds.
Troubleshooting Guides
Problem: Inconsistent Seed Distribution in Automated Planting
- Problem Description: In microgreen operations, uneven seed casting leads to low yields due to plant crowding [25].
- Required Materials: Automated seed caster or precision seeder.
- Step-by-Step Resolution:
- Inspect and Clean: Power down the seeder and inspect the seed dispensing mechanism for blockages or debris. Clean thoroughly.
- Calibrate Dispensing Rate: Conduct test runs with a representative sample of seeds. Adjust the vibration intensity or aperture size of the seeder to achieve a uniform flow.
- Validate Distribution: Run the seeder over a sticky surface and analyze the seed distribution pattern. Continue to adjust until uniformity is achieved.
- Verify Nozzle Height: Ensure the dispensing nozzle or mechanism is at the correct and consistent height above the growth tray.
- Verification Method: The seeded tray should show a statistically even distribution of seeds without clumps or bare patches.
Problem: Robotic Arm Fails to Compute a Viable Grasping Pose
- Problem Description: The vision system detects the fruit, but the path planning algorithm fails to generate a collision-free approach for the manipulator.
- Required Materials: RGB-D camera (e.g., Intel RealSense), robotic arm with 6+ degrees of freedom, point cloud processing software (e.g., OpenCV, PCL) [24].
- Step-by-Step Resolution:
- Verify Point Cloud Quality: Check that the depth camera is providing a clean and accurate point cloud of the workspace, free from excessive noise.
- Check Obstacle Mapping: Ensure that all environmental obstacles (e.g., branches, support structures) are correctly identified and incorporated into the path planner's collision model.
- Analyze Fruit Point Class: Use OpenCV to analyze the contour and edge points of the target fruit from the RGB image and align it with the point cloud to better predict the correct approach position [24].
- Adjust Path Planning Parameters: Relax the path planning constraints incrementally, if possible, to find a solution, while prioritizing a collision-free path.
- Verification Method: The system should successfully generate and execute a grasping trajectory in a simulated environment before attempting a physical harvest.
Experimental Data & Protocols
The following tables summarize key performance metrics from research in robotic harvesting.
Table 1: Performance Metrics for Apple Harvesting Robots [26]
| Metric | Early Prototypes (c. 1985) | Modern Systems (Post-2020) |
|---|---|---|
| Fruit Recognition Rate | ~80% | >90% (often >95%) |
| Harvesting Time per Fruit | Tens of seconds | Significantly reduced (seconds) |
Table 2: Impact of Automation Trends in Vertical Farming (Projected for 2025) [1]
| Trend Name | Estimated Adoption Rate (2025) | Estimated Yield Increase | Estimated Resource Savings |
|---|---|---|---|
| AI-Powered Environmental Control | 70% | 30–45% | 35–50% |
| Autonomous Robotics | 55% | 20–35% | 20–40% |
| IoT-Driven Resource Management | 68% | 15–25% | 30–55% |
Detailed Experimental Methodology
Protocol: Intelligent Robotics Harvesting System for Fruit Grasping Prediction
This protocol details the methodology for implementing a vision-based fruit harvesting system, as described in Scientific Reports [24].
- Objective: To enable a robotic system to reliably detect, segment, and compute a grasping pose for fruits such as apples and oranges for autonomous harvesting.
Key Experimental Components:
- Mobile Base: A vehicle with a main control unit, electric wheels, and power supply [24].
- Robotic Manipulator: A 6-degree-of-freedom robotic arm [24].
- End-Effector: Soft robotic grippers designed for secure yet gentle contact [24].
- Vision Subsystem: An RGB-D camera (e.g., Intel RealSense) [24].
- Software: Frameworks for computer vision (OpenCV) and deep learning.
Step-by-Step Workflow:
- Data Acquisition: The RGB-D camera captures both color (RGB) and depth (D) images of the orchard environment.
- Fruit Recognition & Instance Segmentation: A lightweight, one-stage Fully Convolutional detection network (e.g., an SSD-based architecture) processes the RGB image. This network performs two tasks simultaneously:
- Detection: Identifies and localizes fruits in the image.
- Instance Segmentation: Predicts a pixel-wise mask for each detected fruit, separating it from the background and other fruits.
- Point Cloud Generation & Contour Analysis: The depth image is converted into a 3D point cloud. The predicted mask from step 2 is combined with this point cloud. Using OpenCV, the system extracts the contours of each fruit, which define its shape and size in 3D space.
- Grasping Pose Estimation: By analyzing the fruit's contour and 3D position, the system calculates a stable and collision-free approach pose for the robotic gripper. This involves determining the optimal point of contact and the orientation of the gripper.
- Robotic Execution: The computed grasping pose is sent to the robotic arm's controller. The arm executes the trajectory, the gripper harvests the fruit, and the mobile base may then reposition for the next operation.
The workflow for this methodology is detailed in the diagram below.
The Scientist's Toolkit
Table 3: Essential Research Reagents & Solutions for Harvesting Robotics
| Item | Function / Relevance |
|---|---|
| RGB-D Camera (e.g., Intel RealSense) | Provides both color (RGB) and depth (D) visual data, which is fundamental for fruit recognition and 3D spatial mapping for grasping [24]. |
| Soft Robotic Grippers | End-effectors made from low-modulus materials that prevent damage to delicate fruits through compliant and secure contact [24]. |
| OpenCV (Open Computer Vision) | An open-source library crucial for real-time image processing, contour detection, and point cloud manipulation in robotic vision systems [24]. |
| Fully Convolutional Network (FCN) | A class of deep learning architectures used for pixel-wise prediction tasks like instance segmentation, enabling precise fruit isolation from the background [24]. |
| Autonomous Mobile Robot (AMR) | A mobile base that provides navigation within farm environments using sensors like cameras, GPS, and LiDAR, essential for scalable harvesting [25]. |
Technical Support Center
Troubleshooting Guides and FAQs
This technical support center addresses common challenges researchers and professionals face when deploying weeding and maintenance robots in automated vertical farming environments. The guidance supports the broader research thesis on labor reduction through automation in vertical farm harvesting.
Frequently Asked Questions
Q1: What are the primary causes of inaccurate weed identification by robotic systems, and how can researchers improve detection accuracy?
A: Inaccurate weed identification typically stems from several technical challenges:
- Varying Light Conditions: Shadows and direct sunlight can disrupt computer vision algorithms. Solutions include using multispectral or hyperspectral imaging systems that operate beyond the visible light spectrum to maintain consistent performance under different lighting [27].
- Similar Visual Characteristics: Differentiating crops from weeds with similar appearances remains difficult. Implement advanced machine learning models, particularly deep neural systems, trained on extensive datasets of both crop and weed species to improve differentiation [27].
- Dense Vegetation: Occlusion in densely planted areas can hide weeds. Employing 3D sensing technologies like LIDAR or RGB-D cameras can provide spatial information that helps isolate individual plants [27]. Ensuring your training datasets include images from your specific growth phases and environmental conditions is critical for reliability.
Q2: Our robotic weeding system is causing unintended damage to crop plants during operation. What protocols can minimize crop harm?
A: Unintended crop damage is often a failure in precision. Address this by:
- High-Precision Seeding: Ensure your initial planting is performed with high accuracy. Systems using RTK GPS with millimeter-level accuracy create a precise seeding pattern, which the robot can then use as a known map to navigate around crops [28].
- Actuator Calibration: Regularly calibrate the physical weeding tools (e.g., blades, lasers) to ensure their operational boundaries are well within the safe distance from crop stems. Implement real-time adjustment of tool positioning based on the sensed location of crop plants [28].
- Crop Row Recognition: For intra-row weeding, utilize systems that can identify the specific arrangement of crop rows rather than just detecting weeds. This allows the robot to remove weeds located near individual crop plants with minimal disturbance [27].
Q3: The operational efficiency of our farming robots does not meet projected runtimes. What factors should we investigate?
A: Efficiency shortfalls often relate to power management and operational workflow.
- Energy Source: Robots reliant solely on on-board batteries may have limited uptime. Consider solar-powered options, such as models with solar panels that can provide up to 24 hours of daily CO2-neutral operation, eliminating downtime for external charging [28].
- Path Planning and Speed: Evaluate the robot's navigation algorithm. Inefficient path planning can lead to redundant movement and energy waste. While operation may be slow (e.g., under 1 km/h), optimal pathing ensures full area coverage without backtracking [28].
- Systematic Workflow: Structure the robotic workflow to automate multiple tasks in a single pass. For instance, use a platform that can perform both seeding and weeding, thereby reducing the total operational time and energy spent per unit of output [28].
Q4: How can we design experiments to quantify the impact of robotic weeding on both crop yield and weed biodiversity?
A: Maintaining biodiversity is an emerging research focus. Design your protocols to measure the following variables [29]:
- Alpha Diversity: The average number of weed species per plot within your field. Maintaining this requires spatially explicit data.
- Gamma Diversity: The total number of weed species across the entire research area. Studies show this can be maintained even without highly granular within-field data.
- Experimental Protocol:
- Divide Research Area: Mark out multiple experimental plots.
- Apply Different Treatments: Implement different weeding strategies (e.g., full robotic weeding, selective weeding, no weeding) across these plots.
- Data Collection: Pre- and post-intervention, meticulously document:
- Weed Species Identity: Count and identify all weed species in each plot.
- Weed Quantity: Measure weed cover per species.
- Crop Yield: Precisely harvest and weigh the crop from each plot.
- Analysis: Correlate the weeding intensity and strategy with changes in alpha and gamma diversity and final crop yield. This data will help define trade-offs and synergies.
Research Reagent Solutions and Essential Materials
The table below details key technologies and their functions in robotic weeding research, serving as essential "reagents" for experimental setup.
Table 1: Key Research Reagent Solutions for Robotic Weeding Systems
| Item Category | Specific Examples | Primary Function in Research |
|---|---|---|
| Imaging Sensors | RGB Cameras, Multispectral/Hyperspectral Imaging, Thermal Cameras [27] | Captures visual and non-visual data (e.g., specific wavelengths) for plant identification, health assessment, and species differentiation. |
| Non-Imaging Sensors | LIDAR, Ultrasonic Sensors, Time-of-Flight (ToF) Sensors [27] | Generates 3D point clouds and measures distance to map the physical structure of the environment and locate plants. |
| AI & Software Platforms | Deep Neural Systems, Computer Vision Algorithms, IoT Monitoring Platforms (e.g., IUNU LUNA AI) [27] [17] | Processes sensor data in real-time to identify weeds, make decisions, and optimize weeding patterns. |
| Precision Actuators | Robotic Weeding Tools (e.g., mechanical blades, lasers), Precision Sprayers [28] [16] | Executes the physical task of removing or destroying the identified weed with minimal soil disturbance or crop damage. |
| Positioning Systems | High-Precision RTK GPS [28] | Provides centimeter-level accuracy for robot navigation and mapping of plant locations, enabling repeatable and precise interventions. |
Experimental Workflow and System Logic
The following diagrams illustrate the core operational workflow of a robotic weeding system and the logical decision process for maintaining biodiversity, providing a visual guide for experimental design.
Robotic Weeding Workflow
Biodiversity Conservation Logic
Core Concepts & Performance Data
Machine learning (ML) and deep learning (DL) analyze complex datasets to enable data-driven decision-making, reducing reliance on subjective expertise and improving management strategies in automated vertical farming [30]. The tables below summarize the performance of key AI technologies.
Table 1: Performance of AI-Powered Harvest Optimization Techniques [31]
| AI Technique | Description | Estimated Yield Increase (%) | Estimated Waste Reduction (%) |
|---|---|---|---|
| Harvest Timing Optimization | AI analyzes maturity, weather, and field data to recommend ideal harvest timing. | 8–15% | 10–20% |
| Autonomous Harvesting Machines | Robotics and AI vision for automatic, selective picking of ripe crops. | 10–20% | 12–18% |
| Predictive Yield Forecasting | Machine learning models predict harvest volume weeks or months in advance. | 9–18% | 8–15% |
| Post-Harvest Loss Prevention | AI detects contamination, pest damage, and spoilage for targeted removal. | 4–9% | 20–26% |
Table 2: Impact of Vertical Farming Automation Trends (Projected for 2025) [1]
| Automation Trend | Core Technology | Estimated Yield Increase (%) | Estimated Resource Savings (%) |
|---|---|---|---|
| AI-Powered Environmental Control | AI, IoT, Precision Sensors | 30–45% | 35–50% |
| Autonomous Robotics | Robotics, Automated Guided Vehicles (AGVs) | 20–35% | 20–40% |
| Satellite & AI Crop Monitoring | Multispectral Imaging, AI Analytics | 16–28% | 24–33% |
Experimental Protocols
Protocol: Predictive Yield Forecasting using Satellite Monitoring
Objective: To generate highly accurate yield estimates weeks or months before harvest to optimize labor, equipment, and logistics [31].
Materials: Satellite imagery source (e.g., Farmonaut platform), data processing unit with ML capabilities, historical yield data from the target farm.
Methodology:
- Data Acquisition: Collect real-time satellite data for the target field, including vegetation indices (e.g., NDVI), soil moisture levels, and crop health metrics [31] [1].
- Feature Extraction: Calculate key dataset features, including the number of categorical and quantitative fields, and statistical properties like entropy and correlation between fields [32].
- Model Training and Prediction: Train a machine learning model (e.g., Neural Network, Random Forest) on historical datasets of crop health, growth stages, and environmental conditions paired with final yield outcomes. The trained model is then used to generate yield forecasts for the current growing season [31] [30].
- Validation: Compare predicted yields with actual harvested volumes at the end of the season to continuously refine the model's accuracy.
Protocol: Cotton Leaf Disease Detection using a Convolutional Neural Network (CNN)
Objective: To achieve early and accurate prediction of cotton crop diseases from leaf image data to enable timely intervention [33].
Materials: Dataset of labeled cotton leaf images (e.g., containing Aphids, Armyworms, Bacterial Blight, Powdery Mildew, Target Spot, and Healthy leaves), computational hardware with GPU support, deep learning framework (e.g., TensorFlow, PyTorch).
Methodology:
- Data Preprocessing: Resize all images to a uniform dimensions. Apply data augmentation techniques (e.g., rotation, flipping) to increase dataset size and improve model generalizability [33].
- Model Configuration: Implement a Convolutional Neural Network (CNN) architecture with multiple layers for feature extraction and classification. Alternatively, a pre-trained model (e.g., DenseNet-121) can be used with transfer learning [33].
- Model Training: Train the CNN model on the pre-processed image dataset, using a portion of the data (e.g., 80%) for training and the remainder for validation.
- Performance Evaluation: Evaluate the trained model on a held-out test set. Record overall accuracy, class-specific accuracy, and F1-scores. This protocol has achieved an overall accuracy of 98.7% in research settings [33].
Technical Support Center
Troubleshooting Guides & FAQs
Q1: Our predictive yield model is consistently overestimating harvest volume. What could be the cause?
- A: This is often a data quality or model drift issue. Investigate the following:
- Data Integrity: Verify the accuracy of input data streams, especially real-time satellite NDVI and soil moisture sensors. Calibrate sensors regularly.
- Feature Set: Re-evaluate the features used in your model. Changes in climate patterns or new crop varieties may require incorporating new data points, such as specific weather events (e.g., untimely frost) or updated maturity indicators [31].
- Model Retraining: Models can become stale. Retrain your model with the most recent seasonal data that includes the anomalous yields to help it adjust to new conditions [30].
Q2: The AI-based quality control system is misclassifying healthy produce as defective, increasing waste. How can we improve its accuracy?
- A: Misclassification typically stems from issues with the training data or the visual input system.
- Training Data Bias: Audit your training dataset. Ensure it contains a large and diverse set of images of "premium" produce under various lighting conditions and angles. The model may have learned from an unrepresentative sample [15].
- Camera and Sensor Calibration: Check the cameras and sensors on the conveyor belt. Variations in lighting, lens smudges, or incorrect calibration can alter the appearance of the produce, leading the AI to make errors based on inaccurate visual data [31].
- Confidence Thresholding: Adjust the confidence threshold of the classification algorithm. A threshold that is too high might cause the system to reject items it is unsure about, even if they are healthy [34].
Q3: Our autonomous harvesting robots are damaging delicate fruits during picking. What steps should we take?
- A: Damage during harvesting points to a problem with the robot's manipulation system.
- Computer Vision Fine-Tuning: Retrain the computer vision model that determines ripeness and grip points. Use a dataset enriched with images of the target fruit at the precise optimal harvest stage, focusing on identifying the best points for the gripper to make contact without causing bruising [31].
- Gripper Force Calibration: The most likely cause is excessive gripper pressure. Recalibrate the force feedback sensors on the robotic grippers. Conduct tests to determine the minimum effective pressure required to securely hold the fruit without causing damage [1].
- Path Planning Review: Analyze the robot's movement path from picking to placement. Sudden jerks or collisions with other objects can cause damage. Optimize the path planning algorithm for smoother, more direct trajectories [2].
Q4: We are experiencing high energy consumption in our automated vertical farm, eroding profitability. Where should we look for efficiencies?
- A: High energy use is a common challenge, often linked to climate control and lighting.
- AI-Powered Environmental Control: Implement an AI system that uses precision sensors to monitor temperature, humidity, and CO2 in real-time. The AI can "learn" the minimum energy required to maintain optimal conditions, rather than running systems at a constant level, reducing waste [1].
- Dynamic Lighting Schedules: Instead of running grow lights on a fixed schedule, use an IoT-driven system to adjust light spectrums and intensity based on the specific growth stage of the crop and real-time data, potentially saving significant energy [1] [2].
- HVAC Optimization: Ensure your HVAC system is correctly sized and modeled for your specific farm layout and local climate. An inefficient HVAC is a major energy drain [15].
Workflow Visualizations
ML System Workflow
Health Monitoring Logic
The Scientist's Toolkit: Research Reagent Solutions
Table 3: Essential Materials for Automated Farming ML Research
| Item / Solution | Function in Research |
|---|---|
| Satellite & Weather Data API | Provides real-time and historical data on crop health (e.g., NDVI), soil moisture, and weather forecasts, which are essential for training predictive yield models [31]. |
| Pre-trained Deep Learning Models (e.g., CNN) | Models pre-trained on large image datasets (e.g., ImageNet) can be adapted for specific agricultural tasks like disease detection, significantly reducing development time and computational resources required [33]. |
| IoT Sensor Networks | Deployable sensors that continuously monitor micro-climate conditions (temperature, humidity, CO2) within the vertical farm, providing the foundational data for AI-powered environmental control systems [1]. |
| Blockchain Traceability Platform | Creates a secure, immutable record of the product's journey. Useful for research on supply chain efficiency, post-harvest loss tracking, and verifying the provenance of data and produce [31] [1]. |
| Robotic Harvesting Simulator | Software that allows for the testing and refinement of robotic harvesting algorithms (e.g., computer vision, gripper force settings) in a virtual environment before costly physical implementation [31] [2]. |
Troubleshooting Guides
AGV Navigation and Routing Issues
Problem: AGV fails to find a path to its destination or gets stuck.
- Potential Cause 1: Broken path links in the AGV network.
- Solution: Manually refresh the path links. Right-click on the problematic path in the control software and select the option to refresh its path links. This forces the network to re-analyze the path's geometry and re-establish connections with neighboring paths [35].
- Potential Cause 2: AGV accumulation behavior conflicting with control area allocation.
- Solution: This deadlock occurs when allocation schemes for accumulation and control areas compete. Implement one of two solutions [35]:
- Create a specialized accumulation type for close-quarters intersections. Set the stop point based on the AGV's center with a distance of 0 meters.
- Disable accumulation on paths within complex intersections. Set the path accumulation setting to "No Accumulation" and use control points and areas with appropriate deallocation distances to manage traffic.
Problem: AGV cannot reach a specific control point or work station.
- Solution: Use the AGV system's routing accessibility tool. Right-click the destination control point and select "Show AGV Routing Accessibility." Path transfers highlighted in blue can reach the target; black ones cannot. This helps identify the exact location of the path break [35].
System Integration and Communication Failures
Problem: Robotic arm does not execute its task upon AGV arrival.
- Potential Cause: Failure in the software "handshake" between the AGV fleet manager and the robotic arm's controller.
- Solution: Verify the communication link. Ensure the task trigger (e.g., a signal from a presence detector or the AGV's own control point arrival message) is correctly sent via the agreed protocol (e.g., OPC UA, Modbus). Check the middleware or fleet management software for error logs related to this mission trigger [36] [37].
Problem: The overall system does not synchronize with the Warehouse Management System (WMS) or other enterprise software.
- Potential Cause: Incomplete or faulty integration between the AGV fleet software and the WMS/ERP.
- Solution: This often requires middleware. Ensure that the integration method (e.g., APIs, SQL database stored procedures, SAP IDocs) is correctly configured to allow for real-time data exchange on inventory levels and order status [38] [37].
Precision and Task Execution Errors
Problem: The robotic arm inaccurately places items delivered by the AGV.
- Potential Cause: Incorrect calibration between the AGV's final position and the robotic arm's coordinate system.
- Solution: Replicate the precise calibration process used in award-winning solutions. Have the robotic arm detect fiducial markers (tags) attached to the AGV or its transport table. This data enables precise calibration of the work object's position and orientation in relation to the robot's base coordinate system [39].
Problem: The arm fails to insert components with high precision.
- Potential Cause: Lack of force feedback for delicate operations.
- Solution: Integrate an external force-torque sensor. Implement a force-based search strategy where the robot uses the sensor to gather feedback, much like a human sense of touch. The robot should be programmed to control its Cartesian velocities proportionally to the measured force, allowing it to slow down and maneuver cautiously upon sensing resistance [39].
Frequently Asked Questions (FAQs)
Q1: What is the fundamental difference between an AGV and an AMR in an integrated system? A1: AGVs (Automated Guided Vehicles) follow fixed, predefined routes using wires, magnetic strips, or lasers, and have limited obstacle avoidance. AMRs (Autonomous Mobile Robots) use AI, real-time mapping, and sensors to navigate dynamically, avoiding obstacles and adjusting routes in real-time. AMRs generally offer greater flexibility for dynamic environments [40].
Q2: Our AGVs and robotic arms are from different manufacturers. What is the key to making them work together seamlessly? A2: The solution is often middleware or a central control system. This software layer acts as a bridge, translating communication between the AGV's fleet manager, the robotic arm's controller, and other systems like your WMS or MES. It automates mission triggers and ensures real-time orchestration, which is critical for a synchronized workflow [37].
Q3: What are the critical infrastructure requirements for a reliable AGV-robotic arm cell? A3: Key requirements include [38] [36]:
- Stable Network: Reliable Wi-Fi or wired network coverage throughout the facility to handle data traffic (approx. 7.5 KB per second per vehicle).
- Clear Pathways: Uncluttered, smooth floors for safe AGV navigation.
- Adequate Positioning: Defined pick-up/drop-off points with precise markers for the robotic arm to reference.
- Power Supply: Access to charging stations for the AGVs.
Q4: How can we ensure the safety of human researchers working near these automated systems? A4: Implement a multi-layered safety approach [36] [40]:
- Built-in Safety Tech: Ensure AGVs/AMRs are equipped with LiDAR, 3D cameras, and emergency stop buttons.
- Compliance: Verify systems comply with safety standards like ISO 3691-4.
- Staff Training: Train personnel on safe interaction protocols, emergency procedures, and how to interpret robot alerts.
Q5: For a vertical farming research context, what specific tasks can this integration automate? A5: In vertical farming, integrated AGVs and robotic arms can automate [1] [41]:
- Harvesting: AGVs transport growing trays to a station where robotic arms perform selective harvesting.
- Seedling and Transplanting: Robotic arms place seeds or seedlings into grow modules, which AGVs then transport to their growing locations.
- Logistics and Sorting: AGVs move harvested produce to packaging stations where robotic arms sort and pack them.
Performance Data and Methodologies
The following table summarizes quantitative data relevant to the performance and configuration of integrated AGV and robotic arm systems.
Table 1: Performance Metrics and System Configuration Data
| Metric / Component | Value / Specification | Context / Source |
|---|---|---|
| Task Cycle Time | 2 minutes 25 seconds [39] | Assembly of a partial wire harness (5 wires into 4 connectors) by two collaborative robots. |
| Required Time Reduction | 35 seconds [39] | Benchmark for economic efficiency award. |
| Force Control | Cartesian velocities controlled proportionally to measured force [39] | Enables human-like dexterity for insertion tasks. |
| Localization Method | 2D camera systems with optimized feature matching algorithms [39] | For 6D crimp pose detection (position + rotation). |
| AGV Network Data Usage | ~7.5 KB per second per vehicle [38] | For network infrastructure planning. |
| Projected Warehouse Automation Market Size | \$21.08 billion (by 2030) [42] | Indicates growing adoption and market confidence. |
| Vertical Farming Yield Increase | Up to 70% with automation [1] | Benefit of automated systems, including robotics, in vertical farming. |
| AGV Integration Planning Phase Duration | Multi-week or multi-month process [36] | Highlights the importance of thorough pre-commissioning. |
Experimental Protocol: Precision Assembly with Force Feedback
This methodology is derived from a winning solution in the Robotik Challenge 2025, which required handling flexible wires and inserting small contacts with high precision [39].
System Setup:
- Hardware: Two 7-axis robotic arms, 2D camera systems with ring lights, external force-torque sensors, and a fleet of AGVs for material transport (e.g., BÄR Automation's AGV ConTrax Module One).
- Software: A unified software platform (e.g., AgileCore) for programming, controlling, and monitoring the entire assembly process.
Calibration and Initialization:
- The AGV delivers a pre-assembled work table to the station.
- The robotic arms detect fiducial markers (tags) on the table surface. These tags reference a higher-level coordinate system, allowing the robots to precisely calibrate the table's position and orientation relative to their own bases.
Pose Localization:
- The robot's 2D camera captures an image of the object (e.g., a crimp or connector).
- Using AI-supported image processing, the system performs feature matching by comparing the live image against pre-defined templates created during calibration.
- The system calculates the object's precise 6D pose (position and rotation) relative to the target.
Force-Guided Insertion:
- The robot grips the object and approaches the insertion point.
- The force-torque sensor continuously monitors external forces.
- A control loop is engaged where the robot's Cartesian velocities are controlled proportionally to the measured force. If resistance is sensed, the robot slows down and adjusts its path to navigate the object into place, preventing damage and ensuring a successful insertion.
System Integration Workflow
The diagram below illustrates the logical workflow and data exchange for integrating AGVs with Robotic Arms, from task initiation to final verification.
The Scientist's Toolkit: Research Reagent Solutions
Table 2: Essential Components for an Integrated AGV-Robotic Arm Research Cell
| Item | Function / Explanation |
|---|---|
| Fleet Management Software (FMS) | The central nervous system. It coordinates AGV missions, manages traffic, assigns tasks, and serves as the primary interface for integration with other software [36] [40]. |
| Middleware | A critical software bridge. It enables communication between disparate systems (AGV FMS, Robotic Controller, WMS) using protocols like OPC UA, Modbus, or APIs [37]. |
| Force-Torque Sensor | Mounted between the robotic arm and its end-effector, it provides real-time force feedback, enabling delicate insertion tasks and contact-based operations [39]. |
| 2D/3D Vision System | Provides visual guidance for the robotic arm. Used for identifying fiducial markers for calibration, locating parts, and performing quality checks [39]. |
| Fiducial Markers (Tags) | Visual reference points placed on the AGV or work table. They allow the robotic vision system to precisely determine the position and orientation of the work object in 3D space [39]. |
| Simulation Software | Allows for the virtual modeling and testing of the entire integrated system before physical deployment. This is crucial for validating workflows and identifying potential issues [36]. |
| Standardized Communication Protocols | Predefined rules for data exchange (e.g., OPC UA, Modbus TCP/IP). Their consistent use is fundamental for ensuring reliable communication between all components [38] [36]. |
Navigating Implementation Hurdles: Energy, Scaling, and System Integration
Technical Support Center
Frequently Asked Questions (FAQs)
FAQ 1: What are the primary drivers of energy consumption in an automated vertical farm? The primary drivers are artificial lighting, climate control (HVAC), and automation systems. Lighting often accounts for up to 60% of total energy use, while HVAC systems are critical for maintaining temperature and humidity. Although automation has its own energy draw, it is a key tool for optimizing the other systems and reducing overall waste [43].
FAQ 2: What is the realistic benchmark for energy consumption per kilogram of lettuce in a modern vertical farm? Current specific energy consumption for lettuce production is reported to be between 10–18 kWh kg⁻¹ [44]. Leading facilities are targeting benchmarks as low as 150–250 kWh/kg (or 3.1–7.4 kWh kg⁻¹ for a future technical benchmark) for leafy greens through technological advances [43] [44].
FAQ 3: How can renewable energy be integrated into a vertical farm to reduce its carbon footprint? Solar power is the most widely adopted renewable technology [45]. Options include on-site solar PV arrays, purchasing green energy from the grid, and exploring agrivoltaics. Renewable integration can offset up to 60% of grid energy input in advanced scenarios [43].
FAQ 4: What are the most effective lighting strategies for reducing energy use without compromising yield? Two key strategies are Close-Canopy Lighting (reducing the distance between LEDs and plants to minimize wasted light) and Focused Lighting (targeting light only on small, young plants until they form a canopy). Using spectrum-tuned, high-efficacy LEDs (≥3.5 µmol/J) can also reduce lighting energy by 20-30% [46] [43].
FAQ 5: Our farm's labor costs remain high despite automation. What is the expected labor reduction from full automation? The operational expenditure (OpEx) for labor in a fully automated vertical farm can be reduced to less than 10% of total costs, down from 30-50% in traditional farming. This represents a shift from low-skill, high-volume labor to high-skill, low-volume technical roles focused on system stewardship [8].
Troubleshooting Guides
Issue 1: High Energy Consumption per Kilogram of Produce
- Problem: Energy use exceeds industry benchmarks, eroding profitability.
- Diagnosis:
- Check Lighting Efficacy: Verify that your LED systems have a photon efficacy of at least 3.0 µmol/J, with 3.5 µmol/J or higher being ideal for new installations [43].
- Analyze HVAC Load: Determine if dehumidification or heating/cooling is the dominant energy user. This is highly dependent on your local climate [47].
- Audit Automation Logic: Review if AI-controlled systems are dynamically adjusting lighting and climate based on real-time plant needs, or running on fixed, inefficient schedules [12].
- Resolution:
- Implement the close-canopy lighting strategy to improve photon capture efficiency [46].
- Install AI-driven, zoned HVAC systems with heat recovery to cut HVAC-related energy use by nearly 25% [43].
- Adopt machine learning (ML) algorithms to predict and optimize environmental settings, minimizing overuse [43].
Issue 2: Inconsistent Yields and Product Quality in an Automated Setup
- Problem: Automation is in place, but yield and quality are unpredictable, affecting data integrity for research.
- Diagnosis:
- Review Sensor Calibration: Faulty or uncalibrated IoT sensors for CO₂, humidity, or nutrients can lead the automated system to make incorrect adjustments [12].
- Evaluate "Light Recipes": Ensure that the spectrum, intensity, and photoperiod are specifically tuned for your crop and research goals (e.g., enhancing phytochemicals) [48].
- Check for System Brittleness: The automated system may lack the flexibility to adapt to minor, unforeseen stressors outside its programming [8].
- Resolution:
- Establish a rigorous schedule for sensor calibration and validation.
- Experiment with and validate dynamic light recipes. Research shows adjusting red:blue LED ratios can enhance lettuce yield and resource-use efficiency [49].
- Introduce human "Biocybernetic Steward" oversight to interpret data anomalies and adjust system parameters, adding resilience to the automated loop [8].
Issue 3: Poor Return on Investment from Automation and Renewable Energy
- Problem: The high capital expenditure (CapEx) on automation and renewables is not yielding the expected operational savings.
- Diagnosis:
- Assess Phasing: Determine if the facility was built out all at once without a phased approach, leading to over-investment in under-optimized systems [50].
- Analyze Renewable Integration: Check if the chosen renewable energy source (e.g., solar) is appropriately sized for the facility's location and energy grid [45].
- Review Crop Selection: Confirm you are growing high-value, fast-cycle crops (e.g., leafy greens, herbs) suitable for the automated environment, not energy-intensive staples [43] [47].
- Resolution:
- Adopt a phased build-out approach, starting with a few rooms to fine-tune Standard Operating Procedures (SOPs) before scaling [50].
- Conduct a detailed feasibility study for renewable integration, considering agrivoltaics for dual land use and potential revenue streams [45].
- Diversify into higher-value crops like strawberries or specialty herbs to improve revenue and better justify operational costs [48].
Quantitative Data and Benchmarks
Table 1: Evolution of Energy Consumption per kg in CEA Vertical Farming (2020-2025)
| Year | Sub-System | Estimated Energy Consumption per kg (kWh/kg) | Key Innovations / Efficiency Drivers |
|---|---|---|---|
| 2020 | LED Lighting | 350–500 | Standard LEDs (~2.5 µmol/J), manual schedules, high waste heat [43] |
| 2022 | LED Lighting | 250–400 | Improved efficacy LEDs (~3.0 µmol/J), some spectrum tuning [43] |
| 2025 | Advanced LEDs | 150–250 | AI-controlled, spectrum-tuned LEDs (≥3.5 µmol/J), minimal waste heat [43] |
| 2020 | HVAC | 150–250 | Static climate control, single-zone systems [43] |
| 2025 | AI-Driven HVAC | 80–140 | Full AI/IoT control, multi-zone microclimates, integrated heat recovery [43] |
| 2025 | Overall (Leafy Greens) | 150–350 (Highly optimized) | Integration of all advanced systems (Lighting, HVAC, Automation, Renewables) [43] |
| 2025 | Overall (Lettuce) | 10–18 (Current specific consumption) | Corresponds to an Energy Use Intensity of 850–1150 kWh m⁻² year⁻¹ [44] |
Table 2: Research Reagent Solutions for Energy Efficiency Experiments
| Reagent / Material | Primary Function / Explanation in Research Context |
|---|---|
| Tunable Full-Spectrum LEDs | Core reagent for light recipe experiments. Allows manipulation of plant morphology and phytochemical content via precise spectral control [49] [48]. |
| High-Efficacy LED (≥3.5 µmol/J) | The baseline standard for new lighting installations; critical for reducing the largest energy cost center [43]. |
| IoT Sensor Array | Measures real-time variables (humidity, pH, temperature, CO₂). Provides the data stream for AI/ML optimization and feedback control [12]. |
| AI/ML Control Platform | The "operating system" for the farm. Analyzes sensor data to execute predictive climate control and resource allocation, minimizing waste [12] [43]. |
| Hydroponic (NFT) / Aeroponic Growth System | A soilless growth medium for precise nutrient delivery experiments. Enables water recirculation, reducing usage by up to 90-95% [49] [48]. |
| On-Site Solar PV Array | A key reagent for renewable energy integration trials. Used to decouple farm energy use from the carbon-intensive grid [45] [43]. |
Experimental Protocols
Protocol 1: Validating Close-Canopy LED Lighting for Energy Utilization Efficiency
Objective: To determine the optimal separation distance between an LED light source and the plant canopy to maximize grams of biomass produced per kilowatt-hour of energy consumed (Energy Utilization Efficiency).
Materials:
- Tunable full-spectrum LED growth racks
- Lettuce (Lactuca sativa) seeds or plugs
- Hydroponic nutrient solution and system
- Precision scale (for fresh/dry biomass measurement)
- Power meter (to measure kWh consumption)
- Rulers/calipers for distance setting
Methodology:
- Setup: Establish three treatment groups with fixed LED-to-canopy separation distances (e.g., 10 cm, 20 cm, 30 cm). Ensure all other variables (light spectrum, photoperiod, temperature, nutrients) are kept constant.
- Cultivation: Grow lettuce from seed to harvest under each condition. Use a power meter to log the total kWh consumed by the LED lights in each treatment group over the growth cycle.
- Data Collection: At harvest, measure the total fresh and dry biomass yield for each treatment group.
- Analysis: Calculate the Energy Utilization Efficiency (EUE) for each group using the formula: EUE (g/kWh) = Total Biomass Yield (g) / Total LED Energy Consumed (kWh).
- Validation: The treatment with the highest EUE demonstrates the most energy-efficient configuration. This protocol validates the "close-canopy" strategy, where reduced distances typically show higher EUE due to reduced photon waste [46].
Protocol 2: Implementing an AI-Driven Feedback Loop for HVAC Optimization
Objective: To reduce HVAC energy consumption by implementing a machine learning algorithm that dynamically controls the climate system based on real-time sensor data and predictive models.
Materials:
- IoT sensors for temperature, humidity, and CO₂
- Programmable Logic Controller (PLC) or central farm computer
- AI/ML software platform (e.g., Python with scikit-learn or a commercial Agritech OS)
- Data logging system
Methodology:
- Baseline Measurement: Operate the HVAC system on a fixed schedule for one full crop cycle (e.g., lettuce). Record total HVAC energy consumption and the resulting environmental data (temperature, humidity).
- Model Training: Train a machine learning model on the collected data to predict the optimal HVAC settings needed to maintain the desired environment with minimal energy input. The model should learn from patterns, such as heat generated by lights.
- Intervention: For the next crop cycle, deploy the trained ML model to control the HVAC system in a closed-loop fashion. The system should dynamically adjust setpoints based on real-time sensor readings and predictions.
- Comparison: Compare the total HVAC energy consumption between the baseline fixed-schedule cycle and the AI-controlled cycle.
- Validation: A successful implementation will show a significant reduction (target ~25%) in HVAC energy use while maintaining or improving environmental stability [43] [12].
System Diagrams and Workflows
Lighting Efficiency Experiment
AI HVAC Control Logic
Technical Support Center: Troubleshooting Guides and FAQs
This technical support center provides resources for researchers and scientists scaling automated vertical farming systems. The content focuses on maintaining product quality and system reliability during expansion, supporting thesis research on automation and labor reduction in vertical farm harvesting.
Key System Components:
- Controlled Environment Agriculture (CEA) Technologies: AI-controlled systems managing lighting, temperature, humidity, and nutrient delivery [51] [1]
- Automated Robotics: Robotic arms and automated guided vehicles (AGVs) for planting, maintenance, and harvesting operations [1] [52]
- IoT Sensor Networks: Real-time monitoring of environmental parameters and equipment status [1]
- Data Analytics Platforms: AI-driven systems for predictive maintenance and quality control [5] [1]
Troubleshooting Guide: Common Scaling Challenges
FAQ 1: How do I address increasing defect rates in produce during system expansion?
Problem: Rising defect rates in output as farming operations scale.
Diagnostic Procedure:
- Implement Dynamic Sampling Inspection: Increase sampling frequency during early equipment use phases to catch manufacturing defects [53]
- Verify Sensor Calibration: Check all quality monitoring sensors (pH, EC, humidity, temperature) for proper calibration
- Analyze Equipment Degradation Patterns: Monitor for bathtub-shaped failure curves common in complex manufacturing equipment [53]
- Review Environmental Logs: Check for inconsistencies in climate control across new growing zones
Resolution Steps:
- Establish condition-based maintenance policies based on equipment deterioration levels [53]
- Implement joint optimization strategies that synchronize production, maintenance, and quality control parameters [53]
- Increase sampling ratio during early failure periods of new equipment [53]
FAQ 2: What troubleshooting steps address reliability degradation in expanded automated systems?
Problem: Decreasing system reliability and increased downtime during scaling operations.
Diagnostic Procedure:
- Perform Reliability Importance Analysis: Identify components with highest failure criticality index using the 80/20 rule [54]
- Conduct FRED Analysis: Generate Failure Reporting, Evaluation and Display reports to identify components with lowest MTBF and availability [54]
- Monitor Early Failure Indicators: Track components prone to early failures from manufacturing defects, design defects, or improper installation [53]
- Analyze Maintenance Histories: Identify patterns in preventive maintenance effectiveness
Resolution Steps:
- Focus improvement efforts on the 20% of components causing 80% of system failures [54]
- Implement condition-based maintenance policies triggered by equipment degradation thresholds [53]
- Establish safety stock levels to reduce shortage risks during maintenance downtime [53]
FAQ 3: How can I maintain consistent product quality across multiple expansion modules?
Problem: Inconsistent product quality between original systems and new expansion modules.
Diagnostic Procedure:
- Conduct Comparative Quality Analysis: Test output from original and new systems using standardized metrics
- Verify System Synchronization: Ensure all environmental control systems maintain identical parameters
- Check Nutrient Delivery Consistency: Validate fertigation units across all modules are delivering identical nutrient blends [52]
- Monitor Microclimate Variations: Identify differences in environmental conditions between modules
Resolution Steps:
- Implement blockchain traceability systems to track quality metrics across all production stages [1]
- Standardize automation protocols using platforms like iFarm's Growtune management system [52]
- Establish centralized monitoring with real-time adjustment capabilities for all modules
FAQ 4: What strategies address energy efficiency degradation during scaling?
Problem: Disproportionate energy consumption increases as system expands.
Diagnostic Procedure:
- Analyze Energy Consumption Patterns: Identify systems with abnormal energy usage
- Verify LED Lighting Efficiency: Check for degradation in lighting system performance [51]
- Monitor Climate Control Systems: Identify inefficient HVAC operations
- Calculate kWh per Kilogram Metrics: Track energy efficiency using standardized metrics [55]
Resolution Steps:
- Implement AI-powered environmental control systems that optimize energy usage based on real-time conditions [1]
- Integrate renewable energy sources to offset increased energy demands [55]
- Adopt hybrid lighting systems combining natural and artificial light where possible [55]
Table 1: Performance Metrics for Vertical Farming Scaling Operations
| Metric | Baseline Performance | Target During Scaling | Industry Benchmark |
|---|---|---|---|
| System Reliability | 99.5% uptime | Maintain >99% uptime | 98-99.5% [54] |
| Product Defect Rate | <2% | Maintain <3% during expansion | 2-5% [53] |
| Energy Consumption | 38.8 kWh/kg [55] | <40 kWh/kg | 35-45 kWh/kg [55] |
| Water Usage | 5% of traditional farming [51] | Maintain <10% of traditional | 5-10% of traditional [51] |
| Labor Requirements | 30% reduction vs. traditional [52] | 40-50% reduction at scale | 30-50% reduction [52] |
Table 2: Troubleshooting Response Protocols for Common Scaling Issues
| Issue Type | Immediate Response | Short-term Resolution | Long-term Prevention |
|---|---|---|---|
| Increasing Defect Rates | Increase sampling frequency [53] | Implement dynamic sampling strategy [53] | Joint optimization model deployment [53] |
| Equipment Reliability | Focus on vital 20% components [54] | Condition-based maintenance [53] | Reliability-centered maintenance program |
| Quality Inconsistency | Standardize checkpoints | Centralized monitoring system | Blockchain traceability implementation [1] |
| Energy Inefficiency | Peak usage optimization | AI-controlled systems [1] | Renewable energy integration [55] |
Experimental Protocols for Reliability Research
Protocol 1: Joint Optimization Model for Production, Maintenance, and Quality
Objective: Determine optimal safety stock level, production cycle length, preventive maintenance threshold, and inspection sampling ratio to minimize expected unit cost [53].
Methodology:
- Model equipment failure rate using bathtub curve shape accounting for early failures, stable failure period, and wear-out failures [53]
- Divide production process into six scenarios based on equipment deterioration, production time, and quality limits
- Develop condition-based maintenance policy based on degradation levels
- Solve model using Monte Carlo simulation and design of experiments
- Validate through sensitivity analysis and comparative study
Expected Outcomes: 8-11% improvement over existing methods in unit cost reduction [53]
Protocol 2: Reliability Importance Measurement for System Components
Objective: Identify the relative importance of each component in a system with respect to overall reliability [54].
Methodology:
- Calculate reliability importance (IR) of component i using: IRi = ∂Rs(t)/∂Ri(t) [54]
- Compute ReliaSoft's Failure Criticality Index (RS FCI): Percentage of times component failure causes system failure
- Determine ReliaSoft's Downing Event Criticality Index (RS DECI): Percentage of times component downing causes system downing
- Generate FRED (Failure Reporting, Evaluation and Display) reports
- Perform what-if analysis for sensitivity testing
Expected Outcomes: Identification of the "vital few" components (approximately 20%) responsible for majority (approximately 80%) of system failures [54]
System Workflow Visualization
Scaling Maintenance Workflow - This diagram illustrates the integrated approach to maintaining reliability and quality during vertical farm expansion, showing how diagnostic, maintenance, and optimization processes interact throughout the scaling lifecycle.
Research Reagent Solutions and Essential Materials
Table 3: Research Reagent Solutions for Vertical Farm Scaling Experiments
| Research Tool | Function | Application in Scaling Research |
|---|---|---|
| IoT Sensor Networks | Real-time monitoring of environmental parameters [1] | Tracking system performance across expanded operations |
| AI Analytics Platforms | Data analysis and predictive maintenance [1] | Identifying patterns in equipment failure and quality issues |
| Reliability Importance Software | Component criticality measurement [54] | Prioritizing maintenance efforts during expansion |
| Blockchain Traceability Systems | Supply chain transparency and quality tracking [1] | Maintaining quality consistency across scaled operations |
| Dynamic Sampling Algorithms | Adaptive quality control based on failure probability [53] | Optimizing inspection resources during scaling |
| Monte Carlo Simulation Tools | Stochastic modeling of system performance [53] | Predicting reliability outcomes of scaling strategies |
| Automated Robotics Systems | Labor reduction in harvesting operations [52] | Maintaining efficiency while scaling production |
| Energy Monitoring Systems | Tracking kWh per kg metrics [55] | Ensuring energy efficiency during expansion |
Advanced Diagnostic Protocols
Protocol 3: Bathtub Curve Failure Analysis for New Equipment
Objective: Account for early failures in new equipment during scaling operations.
Methodology:
- Model failure rate across three periods: early failures, stable failure period, and wear-out failures [53]
- Identify root causes: manufacturing defects, design defects, improper installation for early failures [53]
- Implement heightened monitoring during early operation of new systems
- Adjust maintenance schedules based on bathtub curve characteristics
Expected Outcomes: Reduced unqualified products through appropriate early-stage inspection protocols [53]
Protocol 4: Integrated Production, Maintenance, and Quality Control Optimization
Objective: Develop synchronized policies for complex manufacturing systems considering imperfect maintenance and dynamic inspection.
Methodology:
- Consider equipment failure rate with bathtub curve shape
- Develop dynamic sampling strategy based on failure probability
- Create maintenance policies based on equipment deterioration levels
- Optimize multiple parameters simultaneously using experimental design methods
Expected Outcomes: Flexible adaptation to production changes with fewer inspections and lower costs [53]
Troubleshooting Guides
AI Model Training Challenges
Problem: My AI model for yield prediction is performing poorly. What could be wrong? Poor model performance in vertical farming applications often stems from data quality issues or model configuration errors [56] [57].
- Troubleshooting Steps:
- Verify Training Data Quality: Inspect your dataset for common issues like class imbalance (e.g., insufficient data for a specific crop disease), missing values in sensor readings, or mislabeled plant health images [57]. Use data cleaning techniques like deduplication and filling in missing values [57].
- Check for Overfitting/Underfitting: If your model performs well on training data but poorly on validation data, it is likely overfitted. This can be caused by a model that is too complex for the amount of training data available [56]. Techniques like regularization (e.g., ridge or lasso regression) can help mitigate this [56].
- Audit Your Data Splits: Ensure your training, validation, and test datasets are independent and do not contain overlapping data or time periods, which can lead to overly optimistic performance metrics and poor real-world generalization [57]. A typical split is 70% training, 15% validation, and 15% testing.
- Validate Feature Set: Re-evaluate the features (e.g., spectral indices, temperature, humidity) used for training. Remove redundant or irrelevant features that could be misleading the model. Consider using feature selection techniques like correlation analysis or recursive feature elimination [57].
Problem: The AI model's predictions are biased towards certain plant phenotypes. Bias in model predictions is frequently a result of imbalanced or non-representative training data [56].
- Troubleshooting Steps:
- Conduct Data Balance Analysis: Profile your dataset to check if all relevant plant phenotypes, growth stages, and environmental conditions are equally represented [56] [57].
- Apply Data Balancing Techniques: For imbalanced classes, employ techniques like oversampling the minority class, undersampling the majority class, or using synthetic data generation methods like SMOTE (Synthetic Minority Over-sampling Technique) [57].
- Augment Your Data: If certain conditions are rare, use data augmentation to artificially expand your dataset. For image data, this can include rotations, flipping, or adjusting color and brightness [56].
- Review Annotation Guidelines: Inconsistent labeling of plant health or maturity by human annotators can introduce bias. Ensure detailed annotation guidelines are in place and that label quality is controlled [57].
Problem: Training the model is taking too long and consuming excessive computational resources. Slow training times can hinder research iteration speed in fast-paced vertical farming R&D [56].
- Troubleshooting Steps:
- Assess Computational Power: AI model training is computationally intensive. Verify that you have access to sufficient high-performance computing resources, such as cloud-based GPUs or servers [56].
- Investigate Transfer Learning: Instead of training a model from scratch, consider using transfer learning. This involves starting with a pre-existing model that has been trained on a similar, large-scale dataset and adapting it to your specific vertical farming task, which can significantly reduce training time and data requirements [56].
- Optimize Hyperparameters: Systematically tune model hyperparameters (e.g., learning rate, batch size) to find a more efficient configuration for convergence.
- Profile Data Pipeline: Ensure that your data loading and preprocessing pipeline is not creating a bottleneck during training.
Sensor Fusion Challenges
Problem: Fused sensor data from my harvesting robot is noisy and unreliable. Noise and inaccuracies in raw sensor data can severely impact the performance of AI systems in automated vertical farms [58].
- Troubleshooting Steps:
- Inspect Individual Sensors: Before fusion, diagnose each sensor (e.g., camera, LiDAR, hyperspectral imager) independently to ensure they are functioning correctly and are properly calibrated [58].
- Implement Data Preprocessing: Apply filtering and smoothing algorithms (e.g., Kalman filters) to raw sensor data to reduce noise. Kalman filtering is a mathematical method specifically designed for combining noisy sensor data to produce a more reliable estimate of the system's state [58].
- Check Data Synchronization: Ensure that data from all sensors is accurately timestamped and synchronized. Data from sensors with different sampling rates must be carefully aligned to create a coherent model of the environment [58].
- Validate Fusion Algorithm: Review the fusion technique being used (e.g., Kalman Filter, Bayesian Inference, Deep Learning-based fusion). The choice of algorithm depends on the type of sensors and the nature of the data being fused [58].
Problem: My sensor fusion system has high latency, causing delays in robotic actuator responses. High latency can make real-time control of automated harvesting systems impossible [58].
- Troubleshooting Steps:
- Evaluate Computational Load: Sensor fusion, especially with complex models or high data rates, demands significant computational resources. Profile your system to identify bottlenecks [58].
- Consider Edge Computing: Move the sensor fusion processing closer to the sensors themselves using edge computing devices. This reduces the latency associated with sending all data to a central cloud server for processing [58].
- Optimize Fusion Algorithm: A highly complex fusion algorithm may be too slow for real-time applications. Explore if a simpler, more efficient algorithm can meet the accuracy requirements for the specific task.
- Review Data Transmission: Check for network bandwidth limitations between the sensors and the processing unit that could be causing delays.
Frequently Asked Questions (FAQs)
FAQ: What are the most common data-related pitfalls in developing AI for vertical farming? The most common pitfalls include [57]:
- Insufficient Data Volume: Deep learning models are data-hungry and may fail to generalize without enough examples.
- Class Imbalance: The dataset has skewed distributions, causing the model to ignore rare but critical events (e.g., a specific nutrient deficiency).
- Annotation Errors: Incorrectly labeled data teaches the model the wrong patterns. Implementing quality control workflows in the annotation process is crucial.
- Improper Data Splits: Overlap between training and test sets leads to inflated performance metrics and a model that fails in production.
- Dataset Obsolescence: As growing conditions or plant varieties change, the model's performance can degrade if the training data is not updated.
FAQ: How can we reduce the cost and time associated with creating high-quality training data? Several strategies can help manage these costs [57]:
- Leverage Auto-Labeling Tools: Use AI-powered annotation platforms that can pre-label data (e.g., image segmentation), requiring human effort only for review and correction.
- Apply Transfer Learning: This reduces the volume of labeled data required to achieve high performance.
- Implement Data Augmentation: Artificially expand your dataset from existing samples.
- Use Incremental Learning: Build on fundamental knowledge from prior datasets instead of starting from scratch for every new task.
FAQ: What is the benefit of sensor fusion over using a single sensor type in a vertical farm? Sensor fusion creates a more accurate, reliable, and comprehensive understanding of the environment than any single sensor can provide [58]. For example, a camera can identify a tomato, but it may struggle to accurately judge its distance. A LiDAR sensor can precisely measure distance but might not distinguish a tomato from a leaf. By fusing data from both sensors, an AI system can reliably identify and locate the fruit for harvesting, overcoming the limitations of each individual sensor [58].
FAQ: Our sensor fusion system is computationally very expensive. What are the modern solutions to this? To address computational complexity [58]:
- Edge Computing: Process data on-device or on a local edge server to reduce latency and bandwidth.
- AI-Driven Fusion: Use efficient deep learning models to learn optimal ways to combine sensor data.
- Algorithm Optimization: Select and tune fusion algorithms for an optimal balance of accuracy and speed. Techniques like Kalman filtering are often chosen for their computational efficiency.
Experimental Protocols & Methodologies
Protocol: Evaluating a New Yield Prediction Model
1. Objective: To validate the performance of a new AI model for predicting harvest yield in a vertical farm lettuce crop.
2. Materials:
- Dataset: Historical data comprising multi-spectral images, daily environmental logs (temperature, humidity, CO2), and recorded harvest weights.
- Software: ML framework (e.g., TensorFlow, PyTorch), data analysis library (e.g., Pandas).
- Hardware: Server with GPU capability for model training.
3. Methodology: 1. Data Preparation: Clean the dataset by handling missing values and normalizing numerical features. Annotate images with corresponding yield values. Split the data chronologically, ensuring that the training set contains older data and the test set contains the most recent data to prevent temporal leakage [57]. 2. Model Training: Train the proposed model on the training set. Use the validation set for hyperparameter tuning and to monitor for overfitting. 3. Performance Evaluation: Test the final model on the held-out test set. Use metrics relevant to regression tasks, such as Mean Absolute Percentage Error (MAPE) and R-squared (R²). 4. Comparison: Compare the model's performance against a baseline model (e.g., a simple moving average or linear regression).
Protocol: Calibrating a Multi-Sensor System for Plant Health Monitoring
1. Objective: To calibrate and synchronize a camera and a hyperspectral sensor on a stationary rig for early disease detection.
2. Materials:
- Sensors: RGB Camera, Hyperspectral Imager.
- Calibration Target: Standardized color and spatial calibration chart.
- Software: Sensor fusion library (e.g., Robot Operating System - ROS), custom data synchronization scripts.
3. Methodology: 1. Spatial Calibration: Place the calibration target in the field of view of both sensors. Use algorithms to compute the intrinsic (lens distortion) and extrinsic (position and rotation relative to each other) parameters of both sensors to align their viewpoints. 2. Temporal Synchronization: Configure the sensors to use a common hardware trigger or a centralized software clock to ensure that data from both sensors for a single observation is captured at the same moment [58]. 3. Data Fusion & Validation: Fuse the aligned RGB and hyperspectral data. Validate the system by inspecting fused data outputs from known healthy and diseased plants to ensure the data streams are correctly integrated and can highlight the intended physiological features.
Workflow Diagrams
AI Model Training and Validation Workflow
AI Model Training and Validation Workflow
Sensor Fusion Process for Harvesting Robot
Sensor Fusion Process for Harvesting Robot
The Scientist's Toolkit: Research Reagent Solutions
Table 1: Key Components for AI and Sensor Fusion Research in Vertical Farming
| Item | Function & Purpose |
|---|---|
| Data Annotation Platform | A software platform (e.g., BasicAI Cloud) used to manually or semi-automatically label raw sensor data (images, point clouds) to create ground truth datasets for supervised learning [57]. |
| Auto-Labeling Tools | AI models integrated into annotation platforms to pre-label data, drastically reducing the time and cost of creating training datasets [57]. |
| Multi-Sensor Rig | A calibrated hardware setup co-locating different sensors (e.g., RGB-D Camera, LiDAR, Hyperspectral Imager) to capture synchronized, multi-modal data from the same scene [58]. |
| Kalman Filter Library | A software library implementing Kalman filters, a fundamental algorithm for sensor fusion that optimally estimates the state of a dynamic system from noisy observations over time [58]. |
| Edge Computing Device | A small, powerful computer (e.g., NVIDIA Jetson) placed near the sensors to run AI and fusion models locally, reducing latency for real-time control applications [58]. |
| Transfer Learning Models | Pre-trained, general-purpose AI models (e.g., on ImageNet) that can be adapted (fine-tuned) for specific vertical farming tasks, saving significant training time and data [56]. |
Troubleshooting Guide: CAPEX Justification & ROI Calculation
Problem: High initial automation costs are challenging to justify without clear, long-term financial projections.
- Check Initial Cost Assumptions: Verify that the Capital Expenditure (CAPEX) model includes all components: physical infrastructure (robotics, environmental controls), software (IoT, AI platforms), and integration costs. High upfront costs are a recognized sector barrier [5].
- Validate Labor Savings Data: Confirm that labor cost projections are based on realistic automation capabilities. Studies indicate automation can reduce agricultural labor requirements by up to 95% and cut labor costs by 40% [59].
- Audit Energy Consumption Figures: Ensure the financial model accounts for energy consumption, a significant and volatile operating cost. Mitigate this by factoring in energy-efficient LEDs and off-peak consumption strategies [5].
- Review Crop Selection & Revenue: The chosen crop significantly impacts ROI. High-margin, fast-cycle crops like herbs, microgreens, and leafy greens are most profitable in vertical farms and improve unit economics [5].
- Recalculate Payback Period: Use verified data to determine the payback period. Some analyses suggest advanced farming robots can pay for themselves in 2 to 3 years through reduced chemical usage, lower labor costs, and increased yield [59].
Frequently Asked Questions (FAQs)
Q1: What is the typical range of upfront CAPEX for an automated vertical farm? While exact figures vary, the sector is recognized as capital-intensive. Costs are driven by infrastructure, automation, and climate control systems. The key to managing CAPEX is a shift toward modular buildouts and phased expansion strategies, which help align capital deployment with revenue generation [5].
Q2: What percentage of labor costs can automation realistically save? Evidence from industry trends shows significant savings. Agricultural labor requirements can be reduced by up to 95% through automation [59]. Furthermore, autonomous robotics for planting, maintenance, and harvesting can dramatically reduce human intervention, lowering costs and enabling 24/7 operations [1].
Q3: Which specific technologies offer the best return on investment? Technologies that directly impact yield and operational efficiency offer the clearest ROI [5]. The table below summarizes the projected impact of key automation trends for 2025 [1]:
| Trend Name | Core Technology | Estimated Adoption Rate (2025) | Estimated Yield Increase (%) | Estimated Resource Savings (%) |
|---|---|---|---|---|
| AI-Powered Environmental Control & Precision Sensors | AI, IoT, Advanced Sensors | 70% | 30–45% | 35–50% |
| Autonomous Robotics for Planting, Maintenance, and Harvesting | Robotics, AGVs, Machine Vision | 55% | 20–35% | 20–40% |
| IoT-Driven Resource & Infrastructure Management | IoT Networks, Cloud Connectivity | 68% | 15–25% | 30–55% |
| Cloud-Based Management Platforms & Data Integration | Cloud Computing, Data Integration | 80% | 14–19% | 20–28% |
Q4: How can operational tweaks improve margins beyond major automation? Small, cost-conscious operational changes can significantly improve margins. Examples include optimizing packaging costs and even adjusting box sizes to reduce material and shipping expenses [5].
Q5: What are the biggest financial risks after the initial investment? Key risks include ongoing high energy consumption, technology integration complexity that fails to deliver returns, and consumer price sensitivity that could limit adoption of premium-priced produce [5].
Experimental Protocol: Calculating ROI for Automation Projects
Objective: To quantitatively assess the financial viability of an automation project in vertical farming by calculating the Return on Investment (ROI) and payback period.
Methodology:
- Define Project Scope: Clearly delineate the automation system to be analyzed (e.g., autonomous harvesting robots, AI-powered environmental control).
- Quantify Capital Expenditure (CAPEX):
- Hardware/Robotics: Obtain quotes for robotic arms, AGVs, or drone systems.
- Software & Integration: Include costs for Farm Management Platforms (e.g., Farmonaut), AI software, and system integration services [1].
- Infrastructure: Account for any necessary modifications to the growing facility.
- Estimate Operational Changes & Savings (OPEX):
- Labor: Calculate the reduction in personnel hours for tasks automated. Use industry data (e.g., 40-95% labor reduction) to model savings [59] [6].
- Resource Efficiency: Model savings from reduced water and fertilizer use, which automated systems can optimize by 30-55% [1].
- Yield Increase: Project revenue increase based on expected yield improvements from technologies like AI control systems (30-45%) and autonomous robotics (20-35%) [1].
- Energy & Maintenance: Estimate the increase in energy costs and ongoing maintenance for the new automated systems [5].
- Run Financial Analysis:
- Net Annual Savings = (Labor Savings + Resource Savings + Increased Revenue) - (Increased Energy/Maintenance Costs)
- Simple Payback Period (Years) = Total CAPEX / Net Annual Savings
- Sensitivity Analysis: Test the model by varying key assumptions (e.g., 10% lower yield boost, 15% higher energy costs) to understand the robustness of the ROI.
The Scientist's Toolkit: Research Reagent Solutions
| Item | Function in Research |
|---|---|
| Farm Management Platform (e.g., Farmonaut) | Provides satellite-based crop monitoring (NDVI, soil moisture) and AI-driven analytics (Jeevn AI) for data-driven decision-making on irrigation, fertilization, and pest control [1]. |
| IoT Sensor Network | Enables real-time, granular data collection on environmental variables (light, temperature, humidity, CO2, nutrient levels), forming the foundational dataset for any automation or AI system [1]. |
| AI & Machine Learning Algorithms | Used to "learn" optimal growth conditions from sensor data, predict harvest windows, diagnose crop health issues, and autonomously adjust the farm's environment to maximize productivity [1] [5]. |
| Robotics & AGVs (AutoStore) | Provides the physical automation for labor-intensive tasks (harvesting, weeding, tray movement), slashing labor needs and enabling 24/7 operations. Essential for testing scalability hypotheses [6] [59]. |
| Blockchain Traceability Tools | Allows researchers to create a tamper-proof record of the growth process (from seed to shelf), which is crucial for validating experimental protocols and ensuring data integrity in multi-phase trials [1]. |
Financial Analysis Workflow
Data-Driven Validation: Quantifying Labor Reduction and ROI
Frequently Asked Questions (FAQs)
Q1: What are the typical ranges of labor reduction achievable through automation in vertical farming? Labor reduction rates vary significantly depending on the specific technology applied. Documented results range from 40% for generalized harvesting robots to as high as 95% for specialized weeding robots [59]. The level of specialization and the task's repetitiveness are key factors influencing this range.
Q2: Our automated harvesting system is not meeting projected yield increases. What could be wrong? This is a common integration issue. First, verify that your data collection systems are fully operational and calibrated. A lack of or inaccurate data prevents AI systems from learning and optimizing effectively [15]. Second, ensure your automation is holistic. Isolating the harvester without connecting it to data analytics and environmental controls (lighting, nutrients) prevents you from achieving the 15-20% yield boost that integrated AI systems can deliver [60].
Q3: Why is the weeding accuracy of our robotic system lower than expected? Low weeding accuracy typically stems from two sources: sensor obstruction or software issues. Regularly clean the robot's vision and sensor systems, as dirt buildup can block critical data [61]. Furthermore, these systems rely on continuous machine learning; ensure the software is updated and has been trained on a sufficiently large and varied dataset of weed and crop images for your specific growing conditions [59].
Q4: How can we validate the labor reduction metrics reported in our research? To validate labor reduction, establish a clear pre-automation baseline. Track key performance indicators (KPIs) such as hours spent per kilogram harvested or square meters processed per shift before and after implementation. Use a Computerized Maintenance Management System (CMMS) to consistently track this equipment performance and labor data over time [61]. Compare your results against established benchmarks, like the 3.5 acres/hour weeding rate documented for the WeedSpider robot [59].
Troubleshooting Guides
Problem: Inefficient Robotic Picking Paths
Symptoms: Harvesting cycles take longer than projected, robots retrace paths, or travel time exceeds picking time.
Diagnosis and Resolution:
- Check for Static Routing: Confirm your system is using AI-powered dynamic routing, not a pre-set static path. Static systems cannot adapt to real-time changes in the farm layout or inventory [62].
- Validate Real-Time Data Inputs: The AI requires real-time data from across the farm. Ensure sensors that monitor restocking activities, congestion, and robot locations are functional and integrated. A failure here prevents the system from recalculating optimal paths to avoid bottlenecks [62].
- Audit the Algorithm's Learning Data: These systems typically need 30-60 days of operational data to show significant optimization. If the system is new, it may still be learning. If it's established, check that the machine learning models have been retrained on recent farm layout data [62].
Problem: Sub-Optimal Labor Cost Reduction
Symptoms: Overall labor costs have decreased but not reached the projected 30% or greater reduction.
Diagnosis and Resolution:
- Analyze Overtime and Shift Adherence: Use workforce analytics to track the Overtime Percentage and Schedule Adherence KPIs. High overtime indicates poor forecasting, while low adherence means schedules aren't being followed, leading to unexpected costs [63].
- Review Demand Forecasting: An AI system should integrate multiple data streams (historical sales, weather, local events) for forecasting. If it uses only basic historical data, it will lead to overstaffing or understaffing. Each 1% improvement in demand forecast accuracy can lead to a 0.5% reduction in labor costs [64].
- Implement Automated Schedule Optimization: Move beyond simple shift filling. Use an AI system that performs cost-weighted scheduling, which automatically generates schedules that minimize premium pay and match employee skills to specific tasks, typically reducing direct labor costs by 3-7% [63].
The following tables consolidate key performance metrics from industry reports and research.
Table 1: Labor Reduction Metrics of Agricultural Robots
| Robot Type | Task | Documented Labor Reduction | Key Metric | Source |
|---|---|---|---|---|
| General Harvesting Robots | Fruit & Crop Harvesting | Up to 40% | Labor cost reduction | [59] |
| Weeding Robots | Weed Elimination | Up to 95% | Labor cost reduction (e.g., 3.5 acres/hour) | [59] |
| AI Workforce Management | Labor Scheduling & Management | 25-35% | Overall labor cost reduction | [62] |
| Farm Automation | Various Production Tasks | ~25% | Production cost reduction | [41] |
Table 2: AI & Automation System Performance Metrics
| System Function | Performance Improvement | Measured As | Source |
|---|---|---|---|
| AI Route Optimization | 15-20% reduction in travel time | Travel time as percentage of shift | [62] |
| AI Environmental Control | 15-20% increase in crop yield | Yield improvement | [60] |
| AI Demand Forecasting | 0.5% labor cost reduction per 1% accuracy gain | Labor cost reduction | [64] |
| Automated Scheduling | 3-7% direct labor cost reduction | Cost reduction | [63] |
Experimental Protocols
Protocol 1: Measuring Task-Level Labor Reduction for a Weeding Robot
Objective: To empirically determine the labor reduction rate of an autonomous weeding robot compared to manual weeding.
Materials: Weeding robot (e.g., model with vision system & robotic arm), calibrated timing device, measurement wheel, field with defined crop rows and weed pressure.
Methodology:
- Baseline Establishment: Measure the time a skilled worker takes to manually weed a 100-meter crop row. Repeat across 10 different rows and calculate the average time per row.
- Robot Calibration: Deploy the weeding robot on a different but similar set of 10 rows. Allow the robot to complete its autonomous weeding cycle.
- Data Collection: Precisely record the active weeding time for the robot per row, excluding set-up or charging time.
- Efficiency Calculation:
- Manual Labor Time (Total): Average manual time per row × Number of rows.
- Robot Time (Total): Average robot time per row × Number of rows.
- Labor Reduction Rate =
[1 - (Robot Time / Manual Labor Time)] × 100%.
Protocol 2: Validating System-Wide Labor Cost Reduction via AI Scheduling
Objective: To quantify the reduction in farm labor costs after implementing an AI-powered workforce management system.
Materials: AI workforce management platform (e.g., Legion AI, Shyft), historical payroll and scheduling data, access to current operational data.
Methodology:
- Pre-Implementation Baseline: Analyze payroll data from the 6 months prior to implementation. Calculate total labor costs and the Labor Cost Percentage (total labor costs / total revenue).
- System Configuration: Implement the AI platform, integrating it with point-of-sale and inventory systems to enable demand-based forecasting.
- Experimental Period: Run the AI-generated optimized schedules for a minimum of 3 months.
- KPI Tracking: Monitor key performance indicators during this period:
- Overtime Percentage
- Labor Cost Variance (projected vs. actual)
- Schedule Adherence
- Impact Analysis: After the experimental period, calculate the Labor Cost Percentage again. Compare pre- and post-implementation figures to determine the overall cost reduction.
Research Reagent Solutions
Table 3: Essential Materials for Automation Research
| Item | Function in Research |
|---|---|
| Computerized Maintenance Management System (CMMS) | A digital platform to schedule maintenance, track equipment history, and create work orders. Critical for preventing downtime in automated systems and collecting long-term performance data [61]. |
| IoT Sensors (Temperature, Humidity, CO2) | Devices that provide real-time environmental data to AI control systems. This data is essential for optimizing growth conditions and achieving documented yield increases of 15-20% [61] [60]. |
| AI-Powered Workforce Management Platform | Software that uses machine learning to forecast labor demand and generate optimized schedules. It is a key tool for achieving system-wide labor cost reductions of 25-35% [62] [64]. |
| Machine Vision System | A camera and image analysis software that enables robots to identify ripe fruit, weeds, or navigational cues. The accuracy of this system directly impacts the performance of harvesting and weeding robots [59]. |
System Workflow Diagrams
Experimental Workflow for Labor Reduction Analysis
AI Optimization Feedback Loop
The following tables summarize key performance indicators for automated and manual vertical farming systems, based on current industry data and research. These metrics are critical for evaluating operational efficiency and return on investment in a research context.
Table 1: Core Performance Metrics Comparison
| Performance Indicator | Automated Vertical Farming Systems | Manual Vertical Farming Systems | Data Source / Context |
|---|---|---|---|
| Crop Yield Increase | Up to 70% higher than traditional methods [1]; Up to 300% per sq meter [11] | Baseline (Traditional yield) | Projected for 2025 [11] [1] |
| Labor Cost Reduction | Up to 25% reduction in production costs [65] | Standard labor costs | Through automation & robotics [65] |
| Water Usage Efficiency | Up to 95% less water than traditional farming [65]; 90% savings [11] | High water consumption | Closed-loop hydroponics/aeroponics [11] [65] |
| Land Use Efficiency | 10-20x more crops per square meter [65] | Single layer, low density | Stacked layer design [65] |
| Operational Consistency | 24/7 operation possible; unaffected by external climate [11] [66] | Limited by human shifts & seasons | Controlled Environment Agriculture (CEA) [66] |
Table 2: System Implementation & Cost Analysis
| Characteristic | Automated Vertical Farming Systems | Manual Vertical Farming Systems | Notes |
|---|---|---|---|
| Initial Investment (CAPEX) | $200 - $400 per sq ft [67] | Significantly lower | Highly dependent on automation level [67] |
| Annual Energy Costs | $15 - $25 per sq ft [67] | $2 - $5 per sq ft [67] | Lighting and HVAC are major costs [67] |
| Crop Suitability | Ideal for leafy greens, herbs (short, fast cycles) [67] [20] | Wider variety, including fruiting crops | Fruiting crops often need more light energy [67] |
| Data Output & Traceability | High; enables blockchain traceability [11] [1] | Low; reliant on manual records | AI and IoT are key enablers [11] |
Troubleshooting Guides and FAQs for Researchers
This section addresses common technical challenges encountered during experimental work with automated vertical farming systems.
FAQ 1: System Performance & Calibration
Q: Our automated nutrient dosing system is delivering inconsistent EC/pH levels, potentially compromising experiment reproducibility. What are the primary troubleshooting steps?
A: Follow this systematic protocol to isolate and resolve the issue:
Sensor Calibration Verification:
- Action: Manually check the EC and pH of the nutrient solution using a recently calibrated, lab-grade handheld meter.
- Comparison: Compare these values against the readings from the integrated sensors. A consistent offset indicates a need for in-line sensor calibration according to the manufacturer's specifications.
- Protocol: Establish a weekly sensor calibration schedule using standardized solutions to maintain data integrity.
Physical System Inspection:
- Action: Inspect all dosing lines, connectors, and the pump itself for signs of wear, clogging, or leakage.
- Procedure: Run each dosing pump individually into a graduated cylinder for a set time to verify the actual output volume matches the software command. Discrepancies suggest pump failure or obstruction.
Root Cause Analysis & Reagent Check:
- Hypothesis Testing: Inconsistencies may stem from concentrated nutrient stock solutions precipitating or degrading.
- Experimental Control: Prepare a fresh batch of stock solution and monitor if system stability improves. Document the age and storage conditions of all reagents.
FAQ 2: Data Acquisition & Integrity
Q: We are experiencing intermittent data dropouts from our IoT sensor network monitoring the plant growth environment. How can we diagnose the communication failure?
A: This is a common issue in electrically noisy environments. Use this diagnostic workflow:
Sensor Network Troubleshooting Diagram
- Inspect Power Supply: Confirm all sensors and gateway devices have stable power. Voltage fluctuations can cause resets.
- Check Network Connectivity: Verify the signal strength (Wi-Fi, LoRaWAN, Zigbee) at the sensor locations. Physical obstructions or new equipment can create dead zones. Use a network sniffer tool to check for packet loss.
- Test Individual Sensors: Isolate sensors by temporarily connecting them close to the gateway. If communication stabilizes, the issue is likely network range or interference.
- Review Data Logs: Analyze the timestamps of dropouts. Correlating them with the operation of high-power devices (e.g., HVAC compressors, large LED drivers) can identify sources of electromagnetic interference.
- Isolate Faulty Hardware/Software: If the above steps fail, replace one component at a time (sensor, cable, gateway) to identify the faulty hardware. Also, check for firmware updates from the manufacturer.
FAQ 3: Experimental Reproducibility
Q: Despite identical software settings, we observe significant phenotypic variation (e.g., growth rate, leaf size) in plants across different automated growth chambers. What environmental factors should we audit?
A: True controllability requires validation beyond setpoints. Implement this audit protocol:
Table 3: Environmental Parameter Audit for Reproducibility
| Parameter | Common Hidden Variances | Validation Method |
|---|---|---|
| Light Spectrum & Intensity | LED age/degradation, spatial PPFD (Photosynthetic Photon Flux Density) variation. | Use a calibrated quantum PAR meter to map light intensity at multiple canopy-level points. Verify spectrum with a spectrometer. |
| Airflow & Temperature | Microclimates within the chamber, sensor placement. | Place multiple data loggers at plant canopy height in different locations to identify gradients. |
| Nutrient Delivery | Drip emitter clogging, root zone temperature differences. | Manually measure and compare effluent from different irrigation lines. Monitor solution temperature. |
| CO₂ Concentration | Poor circulation or leaks leading to stratification. | Measure CO₂ levels at various heights and locations within the chamber during injection cycles. |
Experimental Protocols for Key Cited Experiments
Protocol 1: Quantifying Labor Efficiency in Automated vs. Manual Harvesting
Objective: To empirically measure and compare the time and labor costs associated with harvesting a standardized crop (e.g., lettuce) using automated robotics versus manual methods within a vertical farm setup.
Materials:
- Mature lettuce crop in a controlled growth environment.
- Automated harvesting robot (e.g., equipped with computer vision and a cutting mechanism).
- Dedicated workstations for manual harvesting.
- Calibrated timers.
- Data recording sheets or software.
- Digital scale for yield verification.
Methodology:
- Experimental Setup: Define two statistically identical growing areas with the same crop density and maturity.
- Manual Harvesting Trial:
- Assign trained personnel to harvest the crop using standard tools and techniques.
- Record the total time taken from the start of harvest until all product is cleared from the area.
- Weigh the total harvested yield and record any observable damage.
- Calculate labor time per unit of output (e.g., kg/hour/person).
- Automated Harvesting Trial:
- Program and initiate the automated harvesting robot for the same area.
- Record the total cycle time, including any human supervision or setup time.
- Weigh the total harvested yield and record the damage rate and success rate (percentage of correctly harvested plants).
- Calculate the effective output per hour of system operation.
- Data Analysis:
- Compare the throughput (kg/hour) of both systems.
- Factor in the labor costs (for manual) and the operational costs, including depreciation and energy (for automated).
- Perform a statistical analysis (e.g., t-test) to determine the significance of the difference in efficiency.
Protocol 2: Validating Yield Claims for a New AI-Powered Nutrient Recipe
Objective: To test the hypothesis that an AI-optimized nutrient delivery algorithm increases biomass yield by ≥15% compared to a standard hydroponic nutrient recipe over a full growth cycle.
Materials:
- Two independent, environmentally identical hydroponic growth chambers.
- Uniform plant seedlings (e.g., basil).
- Standard (control) hydroponic nutrient solution.
- AI-optimized (treatment) nutrient solution.
- Environmental data loggers (light, temp, humidity).
- Precision scales for biomass measurement.
Methodology:
- Baseline & Replication: Take initial biomass measurements of a sample of seedlings to establish baseline uniformity. Assign plants randomly to control and treatment chambers. Use multiple replicates.
- Environmental Control: Continuously monitor and log environmental data in both chambers to ensure they remain statistically identical throughout the experiment. This isolates the nutrient recipe as the independent variable.
- Solution Management: Prepare and administer the control and treatment nutrient solutions according to their respective protocols. Monitor and adjust EC/pH daily in both systems to their target levels.
- Data Collection: At harvest:
- Measure fresh weight for all plants in both groups.
- For a subset, also measure dry weight to account for water content variation.
- Document morphological data (e.g., leaf count, stem diameter).
- Statistical Analysis:
- Calculate the average yield and standard deviation for both control and treatment groups.
- Use an appropriate statistical test (e.g., ANOVA) to determine if the observed yield difference is statistically significant (p < 0.05).
The Scientist's Toolkit: Research Reagent Solutions
Table 4: Essential Materials for Vertical Farming Automation Research
| Research Reagent / Material | Function in Experimentation |
|---|---|
| Hydroponic Nutrient Solutions | Formulates the plant's root zone environment. Varying macro/micronutrient ratios (e.g., N:P:K) is fundamental to testing plant growth responses. |
| pH & EC Calibration Standards | Ensures the accuracy and reproducibility of the root zone chemical environment monitoring, which is critical for reliable data. |
| Sterilizing Agents (e.g., H₂O₂, Bleach) | Maintains aseptic conditions in closed-loop water systems to prevent algal and bacterial growth that can confound experimental results. |
| Sensor Calibration Solutions | Provides known reference points (e.g., for CO₂, O₂, humidity sensors) to validate the data acquired by the IoT network. |
| CRISPR-Cas9 / Gene Editing Kits | Allows for the genetic modification of plant cultivars to develop traits better suited for controlled environments, such as compact architecture or altered nutrient uptake [65]. |
| Specific Spectrum LED Arrays | Enables research into the effects of light quality (e.g., red:blue ratios, UV, far-red) on plant morphology, secondary metabolite production, and growth efficiency. |
Vertical farming represents a paradigm shift in agricultural production, utilizing stacked layers in controlled environments to maximize yield per unit area. Within this context, automation is indispensable for achieving economic viability, particularly in harvesting operations which are traditionally labor-intensive. This technical resource provides researchers with a structured framework for analyzing the Return on Investment (ROI), payback periods, and operational cost-benefits of integrating automation technologies into vertical farming research and development. The shift is driven by the need to address persistent challenges such as high labor costs, which can constitute up to 60% of operational expenditures, and the declining availability of agricultural workers [68] [2]. For scientists and drug development professionals, precise control over the production environment for consistent, high-quality plant material is not merely an economic concern but a fundamental research requirement.
Key Concepts and Quantitative Projections
Core Financial Metrics
Evaluating automation investments requires a clear understanding of two primary financial indicators:
- Return on Investment (ROI): A percentage measuring the profitability of an investment, calculated as
(Net Profit / Cost of Investment) x 100[69]. A positive ROI indicates a financially successful project. - Payback Period: The length of time required for the cumulative financial benefits of an investment to equal the initial investment cost [69] [70]. This metric indicates investment risk and liquidity.
Projected Performance of Automation Technologies
The following table synthesizes performance data for key automation technologies relevant to vertical farming, based on 2025 projections. These figures are essential for building preliminary cost-benefit models.
Table 1: 2025 Projected Impact of Automation Technologies in Vertical Farming
| Technology Trend | Core Technology | Estimated Adoption Rate (2025) | Estimated Labor Cost Reduction | Estimated Yield Increase |
|---|---|---|---|---|
| Autonomous Robotics (Harvesting & Weeding) | Robotics, AGVs, Machine Vision | 55% [1] | Up to 95% [59] | 20–35% [1] |
| AI-Powered Environmental Control | AI, IoT, Advanced Sensors | 70% [1] | Not Specified | 30–45% [1] |
| IoT-Driven Resource Management | IoT Networks, Cloud Connectivity | 68% [1] | Not Specified | 15–25% [1] |
Experimental Protocol for ROI Analysis
This protocol provides a methodology for empirically determining the ROI and payback period for an automated harvesting system in a research vertical farm setting.
Needs Analysis and Goal Definition
- Objective: Quantify the financial and operational impact of an autonomous harvesting robot compared to manual harvesting.
- Hypothesis: Integration of the autonomous system will reduce harvesting labor costs by at least 40% and increase effective yield by 15% through more precise and continuous operation, leading to a payback period of fewer than 5 years [59] [2].
- Parameters: Define key performance indicators (KPIs) including
Harvesting Throughput (kg/hour),Labor Hours per Harvest Cycle,Product Loss/Damage Rate (%), andEnergy Consumption (kWh per kg).
Data Collection and Baseline Establishment
- Duration: Conduct a 3-month pre-automation baseline study.
- Methodology:
- Manual Harvesting Baseline: Track all KPIs using existing manual harvesting protocols. Record total labor hours, wages, total yield, and graded quality of the harvest.
- System Cost Tracking: Meticulously document all costs associated with the automated harvesting system, including:
- Capital Expenditure (CapEx): Purchase price, installation, and integration costs.
- Operating Expenditure (OpEx): Ongoing costs for energy, software subscriptions, maintenance, and any specialized personnel [68].
Implementation and Operational Data Tracking
- Duration: A 12-month post-implementation evaluation period is recommended to account for seasonal variations and system optimization.
- Methodology:
- Integrate the automated harvesting system into the standard workflow.
- Continue tracking the same KPIs established in the baseline phase.
- Isolate the influence of the automation by controlling for other variables (e.g., crop type, nutrient formulas) to the greatest extent possible [69].
Data Analysis and KPI Calculation
- Labor Cost Savings: Calculate the reduction in labor hours and multiply by the fully-burdened labor rate.
- Yield Value Increase: Calculate the monetary value of any increase in yield or reduction in product loss/damage.
- ROI Calculation:
Net Profit = (Labor Cost Savings + Yield Value Increase) - Annual OpEx of AutomationROI = (Net Profit / System CapEx) x 100[69]
- Payback Period Calculation:
Payback Period (years) = System CapEx / (Labor Cost Savings + Yield Value Increase - Annual OpEx)[70]
Troubleshooting Guide & FAQs
FAQ 1: Our calculated payback period for a harvesting robot is longer than 5 years. What are the primary levers to improve this?
- Answer: A long payback period typically results from high upfront costs or insufficient utilization. Consider these levers:
- Scale and Utilization: The system's fixed cost is amortized over more output. Ensure the farm's production capacity fully utilizes the robot [68].
- Labor Cost Context: Automation provides a stronger ROI in regions with high labor costs. The same system may have a shorter payback in Western Europe versus Southeast Asia [68].
- Government Subsidies: Research grants, tax incentives, or subsidies for agricultural technology adoption can significantly reduce the net CapEx, shortening the payback period [41].
- Multi-Functionality: If the robotic platform can be used for multiple tasks (e.g., seeding, monitoring, and harvesting), the benefits are aggregated, improving the overall ROI [1] [59].
FAQ 2: How can we accurately isolate the yield increase attributable solely to the automated harvester versus other environmental factors?
- Answer: Isolating the variable requires a controlled experimental design:
- A/B Testing: Maintain a separate, identical growth chamber where harvesting is performed manually. Compare yield, quality, and loss rates between the automated and control groups [69].
- Precision Metrics: Use the robot's inherent data logging capabilities. Precisely measure metrics like
stem cut accuracy (mm)andproduct damage incidence (%), which are directly tied to the harvesting action and not broader growth conditions [59]. - Statistical Analysis: Employ time-series analysis to correlate the timing of automation implementation with changes in yield trends, while controlling for other consistent environmental data (e.g., light, CO2, nutrients) [12].
FAQ 3: We are experiencing higher-than-expected energy costs from our automated environmental control system. How can this be optimized?
- Answer: High energy costs are a common challenge. Optimization strategies include:
- Load Shifting: Program non-critical automation tasks (e.g., data uploads, diagnostic checks) to occur during off-peak electricity hours.
- LED Efficiency: Audit and upgrade to the most recent generation of LEDs. Red (660 nm) and blue (450 nm) LEDs have efficiencies of 81% and 93%, respectively, leaving little room for improvement, but system-level optics and placement can be optimized [7].
- Integrated Climate-Lighting Management: Use the waste heat from LEDs to supplement climate control heating needs, reducing the load on primary HVAC systems [71].
- Preventive Maintenance: Regularly clean robot vision systems and sensors. Calibration drift or dirty lenses can cause inefficiencies, leading to repeated actions and higher energy use [70].
The Scientist's Toolkit: Research Reagent Solutions
Table 2: Essential Materials for Automation and Analysis in Vertical Farming Research
| Item | Function in Research |
|---|---|
| IoT Sensor Network (Temperature, Humidity, CO2) | Provides real-time, high-resolution environmental data for correlating plant growth with automated system actions. Essential for isolating variables in ROI analysis [1] [12]. |
| Cloud-Based Data Management Platform | Aggregates operational data (energy use, robot uptime, yield) and financial data into a single system, enabling automated calculation of ROI and payback KPIs [1] [70]. |
| Machine Vision Calibration Target | Ensures the accuracy and repeatability of automated harvesting and inspection robots. Critical for maintaining experimental consistency and data integrity across trials [59]. |
| Hydroponic Nutrient Solution (Pre-Mixed Formulations) | Provides a consistent and reproducible plant growth medium. Using standardized reagents eliminates nutritional variability that could confound yield results attributed to automation [71]. |
| Spectral Radiometer | Measures the precise light output (PPFD, spectrum) from growth lights. Used to validate and optimize one of the largest operational costs, ensuring no energy is wasted [7]. |
Workflow Visualization
Diagram 1: Experimental workflow for automation ROI analysis, showing the sequence from baseline establishment through data analysis to final KPIs.
While the primary driver for automating vertical farm harvesting is often labor reduction, the implementation of these advanced systems yields profound secondary benefits. For researchers and scientists, these benefits—enhanced traceability, improved product safety, and unprecedented consistency—are critical for producing high-quality, reliable data and outcomes. This technical support center outlines the frameworks, common challenges, and experimental protocols for leveraging these secondary advantages in your automated vertical farming research.
Core Concepts: Quantifying the Benefits of Automation
The integration of automation in vertical farming brings measurable improvements across several key operational domains. The table below summarizes quantitative data on the impact of major automation trends as projected for 2025 [1].
Table 1: Projected Impact of Vertical Farming Automation Trends for 2025
| Trend Name | Core Technology | Estimated Yield Increase (%) | Estimated Resource Savings (%) |
|---|---|---|---|
| AI-Powered Environmental Control & Precision Sensors | AI, IoT, Advanced Sensors | 30–45% | 35–50% |
| Autonomous Robotics for Planting, Maintenance, and Harvesting | Robotics, AGVs, Machine Vision | 20–35% | 20–40% |
| IoT-Driven Resource & Infrastructure Management | IoT Networks, Cloud Connectivity | 15–25% | 30–55% |
| Blockchain for Product Traceability & Food Safety | Blockchain, Digital Ledgers | 5–12% | 12–20% |
| Cloud-Based Management Platforms & Data Integration | Cloud Computing, Data Integration | 14–19% | 20–28% |
System Architecture for a Fully Traceable Automated Farm
The following diagram illustrates the integrated flow of data and physical goods in an automated vertical farm, highlighting how the system ensures traceability, safety, and consistency from seeding to distribution. This closed-loop system is the foundation for the secondary benefits discussed in this guide.
Troubleshooting Guides & FAQs
Traceability and Data Integrity
Problem: Inconsistent or missing traceability data from harvest batches.
- Question: Why is my batch traceability data incomplete after a robotic harvest cycle?
- Investigation & Resolution:
- Verify Sensor Integration: Confirm that all IoT sensors (environmental, growth imaging) are logging data to the centralized cloud platform consistently. Check for network connectivity drops during high-load robotic operations [1].
- Check Data Handlers: Ensure the software script that links the physical batch ID (e.g., RFID on a tray) to the digital record is triggered successfully upon the robot's "harvest complete" signal. A missed signal can cause a record to remain open [1] [9].
- Validate Blockchain Entry: If using a blockchain for immutability, confirm the transaction (data entry) was successfully mined and added to the chain. A network fee issue or latency can cause a failure [1].
Problem: Inability to perform a rapid simulated product recall.
- Question: How can I test the effectiveness of my traceability system for a recall scenario?
- Investigation & Resolution:
- Isolate a Test Batch: Designate a single growth tray with a unique Batch ID (e.g., "RECALLTEST001") and track it through a full growth cycle.
- Trigger Recall Protocol: Once harvested, use your management software's traceability module to input the Batch ID and initiate a "trace back" command.
- Measure Results: The system should instantly retrieve all data for that batch: seed origin, nutrient dosing history, environmental conditions (CO2, temp, humidity), harvest datetime, and the specific robot that performed the harvest [1] [72]. A successful test confirms the system is recall-ready.
Product Safety and Contamination Control
Problem: Unexpected pathogen detection in a controlled environment.
- Question: My system is enclosed, yet a post-harvest test detected a potential contaminant. What are the likely vectors?
- Investigation & Resolution:
- Audit Human Access Points: Review sanitization protocols for personnel and any equipment entering the grow room. Humans remain the primary contamination vector, even in automated settings.
- Check Water and Nutrient Sources: Test the sterilization systems (e.g., UV, filtration) for the hydroponic or aeroponic nutrient solution. A failure can introduce pathogens directly to the plant roots [20].
- Analyze Robotic End-Effectors: Inspect and swab the grippers and cutting tools on harvesting robots. Residual plant material from a previous cycle can harbor and spread contaminants if not properly sanitized between batches [9].
Problem: Difficulty in maintaining optimal storage conditions post-harvest.
- Question: How can I ensure produce remains safe and fresh after automated harvesting and before processing?
- Investigation & Resolution:
- Validate Automated Storage Environment: Calibrate the sensors in the automated storage (e.g., AutoStore Grid) that monitor temperature and humidity. Drift in these sensors can lead to sub-optimal conditions that promote spoilage [9] [72].
- Review First-In-First-Out (FIFO) Logic: Audit the software algorithm that controls the robotic retrieval of harvested produce from storage. A logic error causing a "first-in-last-out" scenario can leave sensitive produce in storage for too long, increasing safety risks [9] [72].
Operational Consistency and Data Reproducibility
Problem: High variance in yield quality between identical growth cycles.
- Question: My experimental setup is the same, but the yield mass and quality are inconsistent. What systems should I check?
- Investigation & Resolution:
- Calibrate Nutrient Dosing Pumps: Over time, peristaltic pumps used in hydroponic systems can experience wear, leading to slight inaccuracies in nutrient concentration. Regular calibration is essential for reproducible plant nutrition [17].
- Profile LED Light Output: Use a PAR (Photosynthetically Active Radiation) meter to verify the actual light intensity and spectrum delivered by the LEDs at the plant canopy. Degradation of LEDs or driver failure can alter the light profile, significantly impacting growth [17] [20].
- Analyze Robotic Handling Force: If the harvesting robot uses force-sensitive grippers, check the calibration and log the force applied during harvest. Excessive force can cause bruising and stress, leading to inconsistent post-harvest quality and shelf-life data [9].
Problem: AI model for predicting harvest time is performing poorly.
- Question: The AI-driven health monitoring system is triggering harvests too early or too late. How can I improve its accuracy?
- Investigation & Resolution:
- Review Training Data: The model may have been trained on images or sensor data that is not representative of your current cultivar or specific growth conditions. Retraining the model with a larger, more relevant dataset is often necessary [1] [17].
- Clean Sensor Lenses: For computer vision systems, dust accumulation on camera lenses can distort the image data used to assess plant health and maturity, leading to erroneous predictions. Implement a regular automated cleaning schedule [1].
- Add Data Labels: Ensure that the outcomes (e.g., "optimal harvest," "sub-optimal harvest") of previous cycles are accurately labeled and fed back into the AI system to enable continuous learning and improvement [1].
Experimental Protocols for Validating Secondary Benefits
Protocol 1: Quantifying Traceability Resolution and Recall Speed
Objective: To measure the accuracy and speed of the traceability system in pinpointing the origin and pathway of a specific batch of produce.
- Materials: Automated vertical farming system, unique batch identifiers (e.g., RFID tags), blockchain or centralized database, a test batch of plants.
- Method:
- Introduce a test batch at the seeding stage, logging its unique ID into the system.
- As the batch moves through growth, harvesting, and storage, the system automatically records all touchpoints (e.g., nutrient schedules, environmental data, robotic harvester ID).
- Upon harvest completion, initiate a traceability query for the test batch ID.
- Data Analysis: Measure the Time-to-Resolution (TTR)—the time from query initiation to the presentation of a complete data history. Audit the data for completeness across all stages [1] [72].
Protocol 2: Assessing the Impact of Automated Handling on Product Consistency
Objective: To determine if robotic harvesting produces more consistent yield quality and size compared to a manual baseline.
- Materials: Two identical growth chambers, robotic harvesting system, manual harvesting tools, calibrated scales, and quality imaging system.
- Method:
- Grow the same cultivar in both chambers under identical environmental conditions.
- Harvest Chamber A using the predefined robotic harvesting protocol.
- Harvest Chamber B using skilled manual labor.
- Weigh and photograph all produce from both groups immediately after harvest.
- Data Analysis: Calculate the coefficient of variation (standard deviation/mean) for yield mass and size for both groups. A lower coefficient in the robotic group indicates higher consistency. Perform statistical analysis (e.g., t-test) to confirm the significance of the difference [9].
The Scientist's Toolkit: Key Research Reagent Solutions
Table 2: Essential Materials for Automated Vertical Farming Research
| Item | Function in Research |
|---|---|
| Precision Sensors (CO2, Temp, Humidity, Light) | Provides real-time, high-fidelity environmental data crucial for replicating experiments and linking conditions to outcomes [1]. |
| Hydroponic Nutrient Solutions | The standardized "growth media" for soilless agriculture. Precise control over composition is key to reproducible plant nutrition [20]. |
| RFID Tags & Scanners | Enables unique identification of plant batches throughout their lifecycle, forming the physical backbone of the traceability system [9] [72]. |
| Data Logging & Cloud Platform (e.g., Farmonaut, Cloud-based EMS) | Acts as the central nervous system, aggregating sensor, robot, and manual data for analysis, visualization, and ensuring data integrity [1] [17]. |
| Computer Vision Imaging System | Provides non-destructive, quantitative data on plant health (e.g., via NDVI), biomass, and maturity, often feeding AI models [1] [17]. |
Conclusion
The integration of automation in vertical farming is fundamentally altering its economic and operational viability, with proven labor reductions of up to 95% and significant yield increases. The synergistic combination of robotics, AI, and data analytics creates a resilient, scalable production model. For researchers, these advancements in controlled-environment systems offer a parallel framework for developing highly automated, precise processes in laboratory and production settings. Future progress hinges on overcoming energy intensity and high initial investment, with trends pointing toward more sophisticated AI, greater integration of renewable energy, and the rise of fully autonomous farming systems. The lessons learned in optimizing these biological production environments have profound implications for the future of automated, data-driven science.
References
- 1. Vertical Farming Automation: 7 Game-Changing Trends for ... [https://farmonaut.com/precision-farming/vertical-farming-automation-7-game-changing-trends-for-2025]
- 2. How Automation Is Changing the Future of Farming [https://convergixautomation.com/news-insights/how-automation-is-changing-the-future-of-farming]
- 3. Global farm productivity growth stalls, raising risks for food ... [https://news.vt.edu/articles/2025/10/cals-2025-gap-report.html]
- 4. Employment indicators 2000–2023 (July 2025 update) [https://www.fao.org/statistics/highlights-archive/highlights-detail/employment-indicators-2000-2023-(july-2025-update)/en]
- 5. Vertical Farming Playbook: Canada and US Market Report ... [https://alphabridge.co/venture-capital/vertical-farming-canada-us-2025/]
- 6. Vertical Farming: How Automation Transforms the Future [https://www.autostoresystem.com/de/insights/vertical-farming-the-future-is-automated]
- 7. Food for thought: Perspectives on the current state of Vertical ... [https://pmc.ncbi.nlm.nih.gov/articles/PMC12373847/]
- 8. Vertical Farm Automation and Labor Reduction → Scenario [https://prism.sustainability-directory.com/scenario/vertical-farm-automation-and-labor-reduction/]
- 9. Vertical Farming: How Automation Transforms the Future [https://www.autostoresystem.com/insights/vertical-farming-the-future-is-automated]
- 10. 8 challenges holding back vertical farming facilities [https://www.stantec.com/en/ideas/topic/buildings/8-challenges-holding-back-vertical-farming-facilities.html]
- 11. Mobile Vertical Farming Systems: Top 7 Innovations 2025 [https://farmonaut.com/blogs/mobile-vertical-farming-systems-top-7-innovations-2025]
- 12. Empowering vertical farming through IoT and AI-Driven ... [https://www.sciencedirect.com/science/article/pii/S2405844024110298]
- 13. IoT in Vertical Farming: Role of Sensors & Automation [https://www.hashstudioz.com/blog/iot-in-vertical-farming-the-role-of-sensors-and-automation-in-urban-agriculture/]
- 14. Reducing Labor and Advancing Precision Agriculture ... [https://www.ars.usda.gov/research/annual-report-on-science-accomplishments/fy-2020/reducing-labor-and-advancing-precision-agriculture-through-automation/]
- 15. 5 Mistakes Vertical Farms Make [https://www.agritecture.com/blog/2021/7/15/8-mistakes-vertical-farms-make]
- 16. How automation and farm robots are transforming agriculture [https://www.therobotreport.com/how-automation-farm-robots-are-transforming-agriculture/]
- 17. The 2025 State of Vertical Farming: What's Changed ... [https://commercial.justvertical.com/blogs/learning/the-2025-state-of-vertical-farming-whats-changed-whats-next]
- 18. Troubleshooting Common Indoor Farming Problems: Keep ... [https://myapartmentfarm.com/troubleshooting-common-indoor-farming-problems-keep-your-crops-thriving/]
- 19. Agri-Robotics 2025: Autonomous Machines Transforming ... [https://ijoear.com/agri-robotics-2025]
- 20. Vertical Farming – No Longer A Futuristic Concept [https://www.ars.usda.gov/oc/utm/vertical-farming-no-longer-a-futuristic-concept/]
- 21. Vertical farming's path to sustainable growth and profitability [https://www.lombardodier.com/insights/2025/november/growing-up.html]
- 22. A new look at how automation changes the value of labor [https://mitsloan.mit.edu/ideas-made-to-matter/a-new-look-how-automation-changes-value-labor]
- 23. Study: Automation drives income inequality [https://economics.mit.edu/news/study-automation-drives-income-inequality]
- 24. Intelligent robotics harvesting system process for fruits ... [https://www.nature.com/articles/s41598-024-52743-8]
- 25. Exploring the Future of Agriculture: A Deep Dive into Robots [https://www.agritecture.com/blog/exploring-the-future-of-agriculture-a-deep-dive-into-robots]
- 26. Implementation of fruit plucking robot in apple harvesting [https://www.sciencedirect.com/science/article/pii/S2590123025026441]
- 27. Sensing and Perception in Robotic Weeding [https://pmc.ncbi.nlm.nih.gov/articles/PMC11510896/]
- 28. FarmDroid | Advanced Agricultural Robots for Modern Farming [https://farmdroid.com/]
- 29. What weeding robots need to know about ecology [https://www.sciencedirect.com/science/article/pii/S0167880923005200]
- 30. Review article Applications of machine learning and deep ... [https://www.sciencedirect.com/science/article/pii/S2949736125000338]
- 31. AI For Harvest Optimization: 7 Shocking Crop Boost Hacks [https://farmonaut.com/precision-farming/ai-for-harvest-optimization-7-shocking-crop-boost-hacks]
- 32. VizML: A Machine Learning Approach to Visualization ... [https://medium.com/acm-chi/vizml-a-machine-learning-approach-to-visualization-recommendation-85b5affde473]
- 33. Monitoring and predicting cotton leaf diseases using deep ... [https://www.nature.com/articles/s41598-025-06985-9]
- 34. How to Do Model Visualization in Machine Learning? [https://neptune.ai/blog/visualization-in-machine-learning]
- 35. Troubleshooting AGVs [https://docs.flexsim.com/en/21.2/WorkingWithTasks/AGVNetworks/Troubleshooting/Troubleshooting.html]
- 36. AGVs AGV Integration Explained [https://insights.antdriven.com/agv-integration-guide]
- 37. Struggling with AGV & AMR Integration? Here's Why [https://lift.software/struggling-with-agv-amr-integration-heres-why/]
- 38. Integrating AGVs with Your Existing Systems: Tips and Best ... [https://www.weareaim.com/post/integrating-agvs-with-your-existing-systems-tips-and-best-practices]
- 39. Robotik Challenge 2025: The solution behind the award [https://www.agile-robots.com/en/news/detail/robotik-challenge-2025-the-solution-behind-the-award/]
- 40. Autonomous Mobile Robots (AMRs): How They Work & FAQs [https://modula.asia/zh/amr-robot/]
- 41. The role of modern agricultural technologies in improving ... [https://pmc.ncbi.nlm.nih.gov/articles/PMC12481170/]
- 42. Mobile Robots: What's ahead in 2025? [https://opteran.com/resources/Blogs/mobile-robots-whats-ahead-in-2025]
- 43. Vertical Farming Energy Consumption Per Kg: 2025 CEA [https://farmonaut.com/blogs/vertical-farming-energy-consumption-per-kg-2025-cea]
- 44. Benchmarking energy efficiency in vertical farming [https://www.sciencedirect.com/science/article/pii/S2451904924007832]
- 45. Renewable energy now a 'top priority' for indoor agriculture [https://agfundernews.com/renewable-energy-now-a-top-priority-for-indoor-agriculture-report]
- 46. New LED strategies could make vertical farming more ... [https://www.purdue.edu/research/features/stories/new-led-strategies-could-make-vertical-farming-more-productive-less-costly/]
- 47. The emergence of indoor agriculture as a driver of global ... [https://www.nature.com/articles/s44264-025-00091-z]
- 48. 2025 Commercial Vertical Farm Guide: Maximize Yields [https://growdirector.com/2024-guide-to-vertical-farming-optimize-light-temperature-nutrients-for-sky-high-yields/]
- 49. Vertical Farming Integration: The Future of Sustainable ... [https://gothicarchgreenhouses.com/vertical-farming-integration-the-future-of-sustainable-agriculture]
- 50. 5 Common Vertical Farming Challenges & How to Address ... [https://pipphorticulture.com/5-common-indoor-vertical-farming-challenges/]
- 51. Indoor Vertical Farming Solutions: Top 5 For 2025 [https://farmonaut.com/blogs/indoor-vertical-farming-solutions-top-5-for-2025]
- 52. Robotics Automated System - iFarm StackGrow Vertical Farming [https://ifarm.fi/technologies/stack-grow]
- 53. Integrated production, maintenance and quality control for ... [https://www.sciencedirect.com/science/article/abs/pii/S0951832025000997]
- 54. Reliability Importance Measures of Components in a Complex ... [https://help.reliasoft.com/articles/content/hotwire/issue66/relbasics66.htm]
- 55. The Future of Vertical Farming: Transforming Global Food ... [https://www.edengreen.com/blog-collection/future-of-vertical-farming]
- 56. 6 Common AI Model Training Challenges [https://www.oracle.com/artificial-intelligence/ai-model-training-challenges/]
- 57. Is Bad Training Data Hurting Your AI Models [https://www.basic.ai/blog-post/10-training-data-issues-for-ai-learners]
- 58. Sensor Fusion in AI: Merging Data for Smarter Decisions [https://focalx.ai/ai/ai-sensor-fusion/]
- 59. Farm Robots: An Agriculture Trend in 2025 [https://www.greyb.com/blog/farm-robots-in-agriculture/]
- 60. How Can 5 Strategies Maximize Profitability in Automated ... [https://startupfinancialprojection.com/blogs/profitability/automated-indoor-vertical-farming]
- 61. Vertical Farming Maintenance Guide (2025) [https://maintboard.com/vertical-farming-maintenance-guide]
- 62. Smart Picking: How AI-Powered Route Optimization Cuts Labor ... [https://www.linkedin.com/pulse/smart-picking-how-ai-powered-route-optimization-cuts-labor-jignesh-v-1jj8c]
- 63. Track Labor Costs With AI Scheduling Performance... - myshyft.com [https://www.myshyft.com/blog/labor-cost-reduction-tracking/]
- 64. Costs with Legion AI Workforce Reduce Labor Optimization [https://legion.co/blog/2025/07/02/workforce-management-labor-costs/]
- 65. The role of modern agricultural technologies in improving ... [https://www.frontiersin.org/journals/plant-science/articles/10.3389/fpls.2025.1675657/full]
- 66. 10 Key Benefits of Vertical Farming In 2025 [https://agtech.folio3.com/blogs/10-powerful-benefits-of-vertical-farming/]
- 67. Light Dep Greenhouse vs Indoor Farm: The Ultimate 2025 ... [https://cfgreenway.com/light-dep-greenhouse-vs-indoor-farm-the-ultimate-2025-comparison-cost-yield-quality/]
- 68. Vertical farming costs (2023 setup and operating costs) [https://ifarm.fi/blog/vertical-farming-costs]
- 69. How to Calculate ROI for a Project: Formula Explained [https://productive.io/blog/how-to-calculate-roi-for-a-project/]
- 70. ROI and Payback: KPIs to Unlock Business Growth [https://tractian.com/en/blog/roi-and-payback-maintenance-kpis]
- 71. Is Vertical Farming Profitable? A Comprehensive Analysis [https://www.edengreen.com/blog-collection/is-a-vertical-farming-business-profitable]
- 72. Transforming Food Safety and Traceability With Logistics ... [https://foodindustryexecutive.com/2025/09/transforming-food-safety-and-traceability-with-logistics-automation/]