Advanced Calibration Methods for In Planta H2O2 Monitoring: A Comprehensive Guide for Biomedical and Clinical Research
This article provides a detailed guide on calibration methods for in planta hydrogen peroxide (H2O2) monitoring, tailored for researchers, scientists, and drug development professionals.
Advanced Calibration Methods for In Planta H2O2 Monitoring: A Comprehensive Guide for Biomedical and Clinical Research
Abstract
This article provides a detailed guide on calibration methods for in planta hydrogen peroxide (H2O2) monitoring, tailored for researchers, scientists, and drug development professionals. It covers the foundational principles of H2O2 as a key redox signaling molecule in plant and biomedical models, explores established and emerging methodological approaches from biochemical assays to genetically encoded sensors, addresses critical troubleshooting and optimization challenges for data integrity, and offers a comparative analysis for method validation. By synthesizing current protocols and technological advancements, this resource aims to equip scientists with the knowledge to select, implement, and validate robust H2O2 quantification techniques, thereby enhancing research into oxidative stress mechanisms and therapeutic interventions.
Understanding H2O2 as a Signaling Molecule: Principles and Importance in Plant and Biomedical Models
FAQs: Fundamental Mechanisms of H₂O₂ Signaling
Q1: How can H₂O₂ function as both a damaging oxidant and an essential signaling molecule? The dual role of H₂O₂ is primarily determined by its concentration and spatial localization within the cell. At low to moderate concentrations (approximately 10 nM intracellular steady state), H₂O₂ acts as a crucial second messenger in redox signaling [1] [2]. It mediates physiological processes such as cell differentiation, proliferation, and immune response by reversibly oxidizing specific cysteine residues in target proteins like protein tyrosine phosphatases (PTPs) [1] [3]. However, at high concentrations, it causes irreversible oxidative modifications (sulfinic/sulfonic acids) to proteins, lipids, and DNA, leading to oxidative stress and activation of cell death pathways such as apoptosis [1] [4] [5]. The cellular redox state, controlled by antioxidant systems like peroxiredoxins and glutathione peroxidases, fine-tunes this balance [2] [3].
Q2: What are the primary enzymatic sources of H₂O₂ in eukaryotic cells? The major enzymatic generators of H₂O₂ are the NADPH oxidases (NOXs) and the mitochondrial electron transport chain [1]. NOX family proteins at the plasma membrane directly produce superoxide (O₂•⁻), which is rapidly converted to H₂O₂ by superoxide dismutase (SOD) enzymes [1] [3]. In mitochondria, complexes I and III of the respiratory chain are significant sources of O₂•⁻, which is dismutated to H₂O₂ by SOD2 in the matrix or, if released into the intermembrane space, can be converted by SOD1 after export to the cytosol [1] [3]. The SOD family is thus central to H₂O₂ generation, with SOD1 in the cytoplasm and nucleus, SOD2 in mitochondria, and SOD3 in the extracellular space [1].
Q3: How is H₂O₂ transported across cellular membranes to mediate signaling? H₂O₂ diffuses relatively poorly across pure lipid bilayers. Its transport across biological membranes is facilitated by specific aquaporin (AQP) water channels, sometimes termed "peroxiporins" [1] [2] [3]. Isoforms such as AQP3 and AQP8 have been shown to facilitate H₂O₂ transition, thereby influencing downstream signaling cascades. For instance, AQP8 overexpression increases intracellular H₂O₂ levels and can affect signaling stimulated by growth factors like EGF and VEGF [3]. This controlled transport helps establish subcellular H₂O₂ gradients, allowing for localized and specific signaling events [3].
Troubleshooting Guide: Experimental Challenges in H₂O₂ Research
This guide addresses common issues researchers face when studying H₂O₂, particularly in complex biological systems like plants (in planta).
Problem 1: Inconsistent or Irreproducible H₂O₂ Signaling Readouts
- Potential Causes:
- Fluctuating baseline ROS levels due to cell culture conditions or plant stress.
- Inadequate inhibition of H₂O₂-scavenging systems during detection.
- Variation in the activity of antioxidant enzymes (e.g., catalase, peroxiredoxins) between samples.
- Solutions:
- Standardize Growth Conditions: Strictly control environmental factors such as light, temperature, and humidity for plant studies to minimize unintended stress.
- Use Scavenger Inhibitors: When measuring specific H₂O₂ production, consider using inhibitors of scavenging enzymes (e.g., aminotriazole for catalase) with appropriate controls, acknowledging this may perturb physiology.
- Quantify Antioxidant Capacity: Measure the activity or expression of major antioxidants (e.g., catalase, ascorbate peroxidase) in your model system to account for natural variation.
Problem 2: Difficulty in Distinguishing H₂O₂ from Other ROS
- Potential Causes:
- Lack of specificity from commonly used fluorescent probes (e.g., DCFDA) which can react with other ROS and be influenced by cellular pH and metabolism.
- Cross-talk between different ROS-generating and scavenging pathways.
- Solutions:
- Employ Specific Genetically Encoded Sensors: Use sensors like HyPer for in vivo H₂O₂ measurement, which offer superior specificity and subcellular resolution.
- Utilize Pharmacological and Genetic Tools: Combine multiple approaches. Use specific NOX inhibitors (e.g., DPI, with caution for its lack of absolute specificity) or SOD mimetics, and validate findings with genetic knock-down or overexpression models (e.g., SOD1 siRNA) [6] [7].
- HPLC-Based Assays: For direct chemical measurement, use horseradish peroxidase (HRP)-dependent assays coupled with Amplex Red, which is more specific for H₂O₂.
Problem 3: Challenges in Real-Time, In Planta H₂O₂ Monitoring
- Potential Causes:
- Technical limitations in implanting and maintaining sensors within plant tissue without causing damage.
- Lack of power sources for continuous, long-term monitoring in growth environments.
- Solutions:
- Implantable Self-Powered Systems: Recent advancements include implantable microsensors integrated with photovoltaic (PV) modules that harvest ambient light for continuous, real-time monitoring of dynamic H₂O₂ levels in living plants [8]. This allows for the resolution of time- and concentration-specific H₂O₂ signals in response to abiotic stress.
- Non-Invasive Imaging: For whole-plant or tissue-level visualization, use sensitive CCD cameras or confocal microscopy with specific probes, though resolution and quantification can be challenging.
Problem 4: Sensor Calibration Drift and Inaccurate H₂O₂ Quantification
- Potential Causes:
- Fouling of electrode surfaces or optical sensors by biological compounds.
- Degradation of chemical detection reagents or sensor components.
- Changes in sensor sensitivity due to environmental conditions (e.g., temperature, pH).
- Solutions:
- Regular Calibration: Establish a strict calibration schedule using fresh H₂O₂ standards. For electrochemical sensors, perform in-situ calibration if the system allows it [9].
- Sensor Maintenance: Implement a cleaning protocol for electrodes. For optical systems, check the integrity of light sources and detectors.
- Internal Controls: Always include internal biological controls (e.g., untreated samples, samples with known stimulators like paraquat for plants) in each experiment to validate the sensor's performance. Rely on analyzers known for infrequent calibration needs and low maintenance [10].
Table 1: Troubleshooting Common H₂O₂ Experimental Issues
| Problem | Primary Cause | Recommended Solution |
|---|---|---|
| Irreproducible results | Variable cellular redox state | Standardize biological growth conditions; quantify antioxidant enzyme baseline. |
| Poor specificity for H₂O₂ | Probe cross-reactivity with other ROS | Use genetically encoded sensors (e.g., HyPer); employ HPLC-based assays. |
| Difficulty in live monitoring | Sensor damage & power constraints | Use implantable microsensors with integrated photovoltaic power [8]. |
| Sensor drift/Inaccuracy | Biofouling, reagent degradation | Adhere to a strict calibration schedule; use systems requiring minimal maintenance [10]. |
Essential Research Reagent Solutions
Table 2: Key Reagents and Tools for H₂O₂ Research
| Item | Function / Target | Example in Research | Considerations |
|---|---|---|---|
| ATN-224 (Tetrathiomolybdate) | SOD1 inhibitor [6] [7] | Used to dissect the role of SOD1-derived H₂O₂ in growth factor signaling (e.g., EGF, FGF) [7]. | Can increase superoxide while decreasing H₂O₂, creating a pro- and antioxidant mix. |
| SOD Mimetics (e.g., MnTBAP) | Catalyzes superoxide dismutation | Rescues phenotypes caused by SOD deficiency or inhibition; used to confirm the involvement of superoxide/H₂O₂ [7]. | Helps distinguish between effects of superoxide and H₂O₂. |
| Exogenous H₂O2 | Directly elevates intracellular H₂O₂ levels | Used to simulate oxidative stress or activate H₂O₂-dependent signaling pathways (e.g., to abrogate effects of SOD1 inhibition) [7]. | Concentration is critical; low (nM-μM) for signaling, high (mM) for stress. |
| Vanadate | PTP inhibitor | Used to bypass the need for H₂O₂ production; if vanadate restores signaling blocked by SOD1 inhibition, it suggests PTPs are the key target [7]. | Confirms the involvement of phosphatases in the pathway. |
| Aquaporin Modulators | Alter H₂O₂ membrane permeability | Genetic silencing/overexpression of AQP3 or AQP8 to study H₂O₂ influx and its impact on signaling (e.g., AKT phosphorylation) [3]. | Establishes the role of specific peroxiporins in a given context. |
Core Signaling Pathway & Experimental Workflow
The following diagram illustrates the central role of H₂O₂ in growth factor signaling, a key pathway often investigated in this field.
H₂O₂ in Growth Factor Signaling
The diagram shows that growth factor binding activates receptor tyrosine kinases (RTKs), which stimulate NADPH oxidases (NOXs) to produce superoxide. SOD1 converts superoxide to the signaling molecule H₂O₂, which can diffuse via aquaporins. A key action of H₂O₂ is the reversible oxidation and inactivation of Protein Tyrosine Phosphatases (PTPs). This shifts the balance towards kinase activity, allowing sustained phosphorylation and activation of downstream pathways like ERK1/2, promoting cell proliferation and survival [1] [6] [7].
The following diagram outlines a general workflow for investigating H₂O₂ signaling, for example in response to an abiotic stressor in plants.
H₂O₂ Investigation Workflow
Frequently Asked Questions (FAQs)
Q1: What are the primary enzymatic scavengers that control H₂O₂ levels in plants? The steady-state level of cellular H₂O₂ is primarily regulated by key antioxidant enzymes including Ascorbate Peroxidase (APX), Catalase (CAT), and Glutathione Peroxidase (GPX) [11]. APX and CAT are particularly responsive heme-containing enzymes, with APX having a high affinity for H₂O₂ and being central to the ascorbate-glutathione cycle [12] [11]. CAT, found predominantly in peroxisomes, has a very high turnover rate and is crucial for dissipating high concentrations of H₂O₂ [13] [14].
Q2: In which cellular compartments is H₂O₂ primarily produced? H₂O₂ is produced in several organelles with high oxidative metabolic activity [14]. Major production sites include:
- Peroxisomes: Through photosynthetic carbon oxidation and fatty acid β-oxidation.
- Chloroplasts: Primarily as a byproduct of photosynthetic electron transport.
- Mitochondria: Via the electron transport chain during respiration.
- Apoplast: By cell wall peroxidases and NADPH oxidases [14]. Peroxisomes and chloroplasts can accumulate H₂O₂ at levels 30-100 times higher than mitochondria [14].
Q3: My DAB staining results have high background or are inconsistent. What could be the cause? Inconsistent DAB staining can result from several factors:
- Inadequate Infiltration: Ensure thorough vacuum infiltration of the DAB solution into plant tissues to guarantee even contact with H₂O₂ [15].
- Light Exposure: DAB is light-sensitive. Always perform staining steps in the dark, such as by covering samples with aluminum foil [15].
- Wound-Induced H₂O₂: When working with large organs, the act of sectioning can rapidly produce wound-induced H₂O₂, which distorts the original in vivo distribution. Using a rapid tissue-printing protocol (within 15 seconds) can completely avoid this interference [16].
- Solution Freshness: Always prepare the DAB staining solution fresh on the day of use, as it degrades over time [15].
Q4: When measuring H₂O₂ spectrophotometrically, how should I handle my plant samples to avoid inaccurate quantification? Sample handling is critical for accurate H₂O₂ measurement due to its short half-life (approximately 1 ms) and high reactivity [16].
- Avoid Freezing and Thawing: Storage, even at -80°C, can lead to a significant loss (up to 60%) of H₂O₂ within a week [17] [16].
- Use Fresh Tissue: For the most accurate results, analyze non-frozen samples immediately after collection [17].
- Prevent Interference: During homogenization, H₂O₂ can react with released compounds like ascorbic acid (leading to underestimation) or endogenous phenolics (leading to overestimation) [16].
Q5: What are the advantages of using a near-infrared fluorescent probe for H₂O₂ detection? Traditional fluorescent probes can be limited by background autofluorescence and poor tissue penetration. A near-infrared (NIR) fluorescent probe offers several key advantages [18]:
- Reduced Autofluorescence: The longer emission wavelength (e.g., 665 nm) minimizes interference from plant autofluorescence, which is typically at shorter wavelengths.
- Improved Tissue Penetration: NIR light penetrates plant tissues more effectively.
- In Situ Monitoring: It enables non-invasive, real-time monitoring of H₂O₂ in living plant tissues with high spatial and temporal resolution [18].
Troubleshooting Guides
Troubleshooting H₂O₂ Localization Experiments
| Symptom | Possible Cause | Solution |
|---|---|---|
| No staining in DAB assay | • Inactive peroxidase• Incorrect pH of DAB solution• Insufficient H₂O₂ in sample | • Include a positive control (e.g., H₂O₂-treated tissue).• Ensure DAB solution is at pH 3.8 before use [15] [16].• Optimize vacuum infiltration time [15]. |
| High background or non-specific DAB staining | • Endogenous pigments• Wound-induced H₂O₂ from sectioning• Exposure to light during staining | • Clear chlorophyll with bleaching solution (ethanol:acetic acid:glycerol) after staining [15].• Use a rapid tissue-printing method (< 60 sec) for large organs [16].• Perform all staining steps in the dark [15]. |
| Unreliable H₂O₂ quantification with spectrophotometric methods | • Sample degradation• Interference from phenolic compounds | • Analyze fresh, non-frozen samples immediately [17] [16].• Include polyvinylpyrrolidone (PVP) in the extraction buffer to adsorb phenolics [17]. |
Troubleshooting Enzyme Activity Assays
| Symptom | Possible Cause | Solution |
|---|---|---|
| Low or no detected APX/CAT activity | • Enzyme degradation during extraction• Incorrect assay conditions (pH, substrate) | • Keep samples on ice during extraction; use pre-chilled buffers.• For APX, include ascorbate in the extraction buffer to maintain enzyme stability [12].• Verify optimal pH (e.g., ~7.0 for CAT assay) and substrate concentration [12]. |
| High variability in replicate GPx assays | • Inconsistent termination of reaction• Interference from other cellular thiols | • Use a precise, rapid method to stop the reaction (e.g., specific inhibitors) [19].• Employ a modified DTNB protocol that does not require protein precipitation for greater reliability [19]. |
| Inconsistent results between frozen and fresh samples | • Loss of enzyme activity upon freezing | • For critical assays, use fresh tissue. If freezing is necessary, optimize cryopreservation conditions and avoid repeated freeze-thaw cycles. |
Research Reagent Solutions
The following table details essential reagents used in the study of H₂O₂ in plant systems.
Table 1: Key Research Reagents for H₂O₂ Analysis
| Reagent | Function/Application | Key Considerations |
|---|---|---|
| 3,3'-Diaminobenzidine (DAB) | Histochemical staining for in situ H₂O₂ localization. Polymerizes as a brown precipitate in the presence of H₂O₂ and peroxidase [15] [16]. | Light-sensitive; prepare fresh for each use. Control for endogenous peroxidase activity is crucial [16]. |
| Titanium Sulfate (Ti(SO₄)₂) | Spectrophotometric quantification of H₂O₂, forming a yellow H₂O₂-Ti complex [17]. | Accessible method; shows good correlation with other assays like eFOX. Can be affected by interfering compounds [17]. |
| Modified Ferrous Oxidation-Xylenol Orange (eFOX) Assay | Spectrophotometric quantification of H₂O₂. Ferrous ions oxidized by H₂O₂, then ferric ions complex with xylenol orange [17]. | Highly sensitive, stable, and suitable for high-throughput analysis. Correlates well with Ti(SO₄)₂ assay [17]. |
| Salicylic Acid (SA) | Inhibitor of both APX and CAT activity; used to study the roles of these enzymes [12]. | Useful for dissecting individual contributions of scavenging enzymes in stress tolerance experiments [12]. |
| 3-Amino-1,2,4-Triazole (3-AT) | Suicide inhibitor of catalase (CAT) [12]. | Used in combination with other inhibitors to study the specific role of CAT in H₂O₂ scavenging [12]. |
| p-Aminophenol (p-AP) | Specific inhibitor of ascorbate peroxidase (APX) [12]. | Used to investigate the specific contribution of APX to antioxidant defense [12]. |
| Near-Infrared (NIR) Probe (e.g., NAPF-AC) | Fluorescent probe for in situ monitoring of H₂O₂ in living plant tissues [18]. | Reduces autofluorescence, improves tissue penetration, and allows for real-time, non-invasive imaging [18]. |
Experimental Protocols
Principle: DAB is oxidized by H₂O₂ in the presence of peroxidases, generating a dark brown precipitate that localizes H₂O₂ in situ.
Materials and Reagents:
- DAB powder (Sigma-Aldrich, D8001)
- Tween 20
- Sodium phosphate (Na₂HPO₄)
- HCl
- Bleaching solution: Ethanol:Acetic acid:Glycerol (3:1:1 v/v)
- 12-well microtiter plate
- Dessicator
- Shaker and water bath
Procedure:
- DAB Staining Solution Preparation: Dissolve 50 mg DAB in 45 mL sterile water. Adjust pH to 3.0 with 0.2 M HCl while stirring. Add 25 μL Tween 20 (0.05% v/v) and 2.5 mL of 200 mM Na₂HPO₄ to achieve a final 10 mM phosphate buffer. Protect from light. The solution should be used fresh.
- Leaf Sampling: Select mature rosette leaves and apply your experimental treatment. Sample at least 3 leaves per plant from multiple independent biological replicates.
- Staining: Place detached leaves in a 12-well plate. Immerse them in 2 mL of DAB staining solution. For control leaves, use 10 mM Na₂HPO₄ buffer instead.
- Infiltration: Place the plate in a dessicator and apply a gentle vacuum for 5 minutes to facilitate DAB uptake. Release the vacuum slowly.
- Incubation: Cover the plate with foil and incubate on a laboratory shaker (80-100 rpm) for 4-5 hours at room temperature. The incubation time can be extended to 8 hours for systems with lower H₂O₂ production.
- Destaining: Remove the DAB solution and replace it with bleaching solution. Place the plate in a boiling water bath (~90-95°C) for 15 minutes, or until chlorophyll is completely removed.
- Imaging: Replace the bleaching solution with a fresh aliquot and let stand for 30 minutes. Leaves can be stored in this solution at 4°C for several days. Photograph the leaves against a plain white background under uniform lighting.
Principle: For large plant organs (stems, fruits) where reagent penetration is problematic, this rapid protocol transfers H₂O₂ directly to a DAB-impregnated membrane, avoiding wounding artifacts.
Procedure:
- Membrane Preparation: Soak a nitrocellulose membrane (0.45 μm pore size) in 5 mg/mL DAB-HCl solution (pH 3.8). Air-dry for 30 minutes in the dark.
- Sectioning and Printing: Prepare a free-hand transverse section (1.0 mm thick) of the stem or fruit. Gently press the section onto the DAB-impregnated membrane for 10 seconds.
- Development: Carefully remove the tissue section with forceps. The entire process, from cutting to printing, should take no more than 15 seconds to prevent wound-induced H₂O₂ production. A brown precipitate will form on the membrane where H₂O₂ was present.
Data Presentation
Table 2: Comparison of Key H₂O₂-Scavenging Enzymes in Plants
| Enzyme | EC Number | Cofactor / Prosthetic Group | Primary Subcellular Localization | Key Functional Role |
|---|---|---|---|---|
| Ascorbate Peroxidase (APX) | 1.11.1.11 | Heme | Cytosol, Chloroplast, Mitochondria, Peroxisome [11] | Central player in ascorbate-glutathione cycle; crucial for H₂O₂ detoxification under stress [12] [11]. |
| Catalase (CAT) | 1.11.1.6 | Heme | Peroxisome [13] [14] | High-capacity enzyme for dissipating high H₂O₂ concentrations from photorespiration; high turnover rate [13] [14]. |
| Glutathione Peroxidase (GPX) | 1.11.1.9 / 1.11.1.12 | Selenocysteine (in some isoforms) | Cytosol, Chloroplast, Mitochondria, ER [11] [19] | Reduces H₂O₂ and lipid hydroperoxides using glutathione (GSH); involved in maintaining redox homeostasis [11] [19]. |
Table 3: Comparison of Common H₂O₂ Detection Methodologies
| Method | Principle | Key Advantages | Key Limitations / Considerations |
|---|---|---|---|
| DAB Staining [15] [16] | Peroxidase-mediated oxidation forms a brown precipitate. | Provides spatial localization; relatively inexpensive. | Qualitative/semi-quantitative; long incubation can cause artifacts; requires endogenous peroxidase. |
| Titanium Sulfate Assay [17] | Forms a colored complex with H₂O₂. | Accessible and straightforward spectrophotometric method. | Can be affected by interfering compounds in plant extracts. |
| eFOX Assay [17] | H₂O₂ oxidizes Fe²⁺; Fe³⁺ complexes with xylenol orange. | High sensitivity and stability; suitable for high-throughput. | Requires correlation with other methods for absolute quantification. |
| Near-Infrared Probes [18] | H₂O₂ activates a fluorescent NIR molecule. | In situ monitoring in live tissue; low background; high penetration. | Requires synthesis of specialized probes; potential photobleaching. |
Pathway and Workflow Visualizations
Why Accurate In Planta Monitoring is Crucial for Biomedical Research
In biomedical and pharmaceutical research, understanding fundamental biological signaling pathways is paramount for drug discovery and understanding disease mechanisms. Plant systems have emerged as crucial models for studying these processes, particularly oxidative stress responses mediated by hydrogen peroxide (H2O2). As a key reactive oxygen species (ROS), H2O2 functions as a critical signaling molecule in plant stress responses, including reactions to pathogens, drought, extreme temperatures, and wounding [17]. Accurate monitoring of H2O2 dynamics in plants provides invaluable insights that extend to mammalian systems, where oxidative stress plays a significant role in various pathological conditions.
The transition from traditional destructive sampling methods to advanced in situ monitoring technologies represents a transformative shift in how researchers approach plant-based biomedical research. Modern implantable sensors and real-time monitoring systems now enable continuous tracking of H2O2 and other signaling molecules, offering unprecedented temporal resolution and revealing dynamic physiological processes previously inaccessible to researchers [20] [8]. This technical support center addresses the critical calibration and methodological challenges researchers face when implementing these advanced monitoring approaches.
Technical FAQs: Resolving Key Experimental Challenges
Q1: What are the primary methodological challenges in achieving accurate in planta H2O2 measurements?
Several interconnected challenges affect accuracy in H2O2 monitoring:
Signal Cross-Sensitivity: Conventional detection methods like 3,3-diaminobenzidine (DAB) and DCFDA (Di chloro dihydro fluorescein diacetate) suffer from low specificity, often measuring generalized oxidative stress rather than H2O2 specifically [17]. This can lead to false positives or overestimated concentrations.
Sample Integrity Degradation: Research indicates H2O2 concentration can decrease by up to 60% after seven days of storage, even at optimal temperatures of -20°C or -80°C [17]. This degradation occurs because some plants experience chilling stress at moderately low temperatures (0-10°C), compromising sample integrity.
Mechanical Interface Mismatch: A fundamental theoretical gap exists between rigid, standardized electronics and the soft, dynamic, heterogeneous nature of plant surfaces [21]. This mismatch can cause unreliable data acquisition and potential tissue damage, skewing results.
Q2: How does sample processing affect H2O2 quantification accuracy?
Sample processing methodology significantly impacts measurement outcomes:
Preservation Method Efficacy: Both modified ferrous oxidation xylenol orange (eFOX) and titanium sulfate (Ti(SO4)2) assays show strong correlations between nonfrozen and frozen samples (r = 0.879 and r = 0.837 respectively, p < 0.001) [17]. However, the eFOX assay demonstrates superior sensitivity for detecting lower fluctuations in H2O2 concentration.
Interference Management: Adding polyvinylpyrrolidone (PVP) during sample preparation effectively prevents interference from phenolic compounds, a common source of measurement error in plant tissues [17].
Weight Independence: Sample weight (within tested parameters) does not significantly affect H2O2 quantification accuracy, simplifying standardized protocol development [17].
Q3: What calibration approaches ensure reliable H2O2 monitoring in long-term experiments?
For extended monitoring protocols:
Integrated Self-Powering Systems: Recent advancements incorporate photovoltaic (PV) modules that harvest environmental light to continuously power implantable microsensors [8]. This eliminates power source degradation as a confounding variable in long-term studies.
Multimodal Integration: Combining sensing modalities addresses individual method limitations. For instance, supplementing H2O2 monitoring with targeted UV irradiation can enhance sterilization efficacy by up to 30% in complex, shadowed areas [22].
Real-Time Monitoring Systems: Implantable sensors now enable continuous tracking of H2O2 signal transmission in vivo, resolving time and concentration specificity for abiotic stress responses [8].
Comparative Method Analysis: Selecting Appropriate Detection Assays
The following table summarizes performance characteristics of major H2O2 detection methodologies:
| Method | Detection Principle | Sensitivity Profile | Key Advantages | Common Limitations |
|---|---|---|---|---|
| eFOX Assay | Ferrous ion oxidation by H2O2 to ferric ions [17] | Detects lower H2O2 fluctuations [17] | High sensitivity, stability, adaptable to high-throughput [17] | Potential interference from other redox-active compounds [17] |
| Ti(SO4)2 Assay | Titanium-H2O2 color complex formation [17] | Moderate sensitivity [17] | Accessibility, established protocols [17] | Less sensitive than eFOX, interference issues [17] |
| Implantable Microsensors | Electrochemical detection [8] | Real-time, in vivo monitoring [8] | Continuous data, reveals dynamic responses [8] | Requires surgical implantation, potential tissue disruption |
| Amplex Red/Peroxidase Assays | Peroxidase-coupled fluorescence [17] | Variable depending on implementation | Commercial availability | Specificity issues, enzyme-dependent variability |
| DAB Staining | Peroxidase-dependent polymerization [17] | Spatial localization in tissues | Histological application | Destructive sampling, semi-quantitative only |
Experimental Protocol: Best Practices for In Planta H2O2 Monitoring
Standardized Sample Preparation Workflow
The following diagram illustrates the optimized workflow for plant sample preparation prior to H2O2 quantification:
Critical Protocol Steps:
Sample Collection: Collect fully expanded leaves from the middle portion of plants. Process immediately as nonfrozen samples or flash-freeze in liquid nitrogen for storage at -80°C [17].
Homogenization: Use a combination of 3mm and 10mm beads with a mechanical homogenizer (e.g., Shake Master) after liquid nitrogen freezing to create a fine powder without degrading H2O2 [17].
Interference Prevention: Include polyvinylpyrrolidone (PVP) in the extraction buffer to prevent phenolic compound interference, a crucial step for accurate spectrophotometric measurement [17].
Processing Consistency: Maintain consistent centrifugation parameters (5500 rpm for 10 minutes, repeated twice) to ensure reproducible supernatant quality across samples [17].
Research Reagent Solutions: Essential Materials for H2O2 Monitoring
| Reagent/Equipment | Function/Purpose | Specification Notes |
|---|---|---|
| Potassium Phosphate Buffer | Extraction medium | 50mM concentration, pH 6.0 optimal for H2O2 stability [17] |
| Polyvinylpyrrolidone (PVP) | Phenolic compound binding | Prevents oxidation interference during extraction [17] |
| Liquid Nitrogen | Sample preservation | Flash-freezing maintains H2O2 integrity prior to processing [17] |
| Titanium Sulfate (Ti(SO₄)₂) | H₂O₂ color complex formation | Forms yellow precipitate with H₂O₂ measurable at 410nm [17] |
| Ferrous Ammonium Sulfate | eFOX assay reagent | Oxidized by H₂O₂ to ferric ions that complex with xylenol orange [17] |
| Xylenol Orange | eFOX assay chromogen | Forms colored complex with ferric ions (measured at 560nm) [17] |
| Butylated Hydroxytoluene (BHT) | Oxidation inhibitor | Optional addition to minimize ex vivo H₂O₂ degradation [17] |
| Implantable Microsensors | In vivo H₂O₂ monitoring | Self-powered systems enable real-time signal tracking [8] |
Advanced Methodology: Integrating Real-Time Monitoring Systems
Implantable Sensor Technology
Recent advancements in implantable sensors represent a paradigm shift in plant H2O2 monitoring:
Self-Powered Design: Integrated photovoltaic (PV) modules harvest environmental light to power microsensors continuously, enabling long-term monitoring without external power sources [8].
In Vivo Signal Tracking: These systems successfully monitor transmission of H2O2 signals in living plants, resolving temporal dynamics and concentration specificity in response to abiotic stresses [8].
High-Resolution Data: Unlike endpoint assays, implantable sensors provide continuous, real-time data on H2O2 fluctuations, revealing previously inaccessible signaling patterns [8].
Future Directions and Technologies
The field is rapidly evolving toward more sophisticated monitoring approaches:
Genetically Encoded Sensors (GESs): Emerging technologies provide high-resolution, intracellular visualization of key signaling molecules including calcium, reactive oxygen species, and plant hormones [20].
Multimodal Integration: Combining multiple sensing modalities addresses the limitations of individual methods and provides more comprehensive physiological profiling [21].
AI-Assisted Validation: Advanced systems using artificial intelligence and machine learning algorithms can reduce false positives by up to 95% compared to traditional methods [22].
Accurate in planta H2O2 monitoring is not merely a technical exercise but a fundamental requirement for generating reliable, reproducible data in biomedical research. The methodological considerations outlined in this technical support center - from proper sample handling to assay selection and validation - directly impact research outcomes and the ability to draw meaningful biological conclusions. As the field advances toward increasingly sophisticated real-time monitoring technologies, maintaining rigorous attention to calibration protocols and methodological细节 will remain paramount for researchers seeking to unravel the complex roles of oxidative stress in both plant and mammalian systems.
A Practical Guide to Established and Emerging H2O2 Calibration Methodologies
Principle and Application
3,3'-Diaminobenzidine (DAB) staining is a fundamental histochemical technique for the in situ detection of hydrogen peroxide (H₂O₂) in biological samples, particularly in plant tissues [15]. The method relies on the oxidation of DAB by H₂O₂ in the presence of peroxidase enzymes, generating a dark brown polymerized precipitate that can be visualized microscopically [15]. This protocol is extensively used in plant pathology, oxidative stress research, and immune response studies to spatially localize H₂O₂ production during various stress responses [15].
Key Chemical Reaction
The underlying chemical reaction involves the peroxidase-catalyzed oxidation of the colorless DAB substrate by H₂O₂, resulting in the formation of an insoluble, dark brown oxidation product at the site of H₂O₂ generation. This precipitate provides a permanent record of H₂O₂ distribution within tissues.
Experimental Protocols
DAB Staining Protocol for Plant Leaves
The following protocol details the adaptation for mature Arabidopsis rosette leaves, which can be modified for different plant tissues [15]:
Preparation of DAB Staining Solution
- Add 50 mg DAB powder to 45 ml sterile H₂O (final concentration: 1 mg/ml) [15].
- Add a small magnetic stirrer and reduce pH to 3.0 with 0.2 M HCl to dissolve DAB [15].
- Cover the tube with aluminum foil as DAB is light-sensitive [15].
- Add 25 μl Tween 20 (0.05% v/v) and 2.5 ml of 200 mM Na₂HPO₄ [15].
- This generates a 10 mM Na₂HPO₄ DAB staining solution with adjusted pH [15].
- Note: Prepare the solution fresh on the day of use [15].
Staining Procedure
- Select appropriate plant leaves (e.g., pre-bolting Arabidopsis rosette leaves, 3-4 weeks old) [15].
- Apply experimental treatment (e.g., wounding, pathogen infiltration, or elicitor application) [15].
- Manually remove leaves and place in a 12-well microtiter plate [15].
- Immerse leaves in 2 ml DAB staining solution [15].
- Apply gentle vacuum infiltration for 5 minutes using a desiccator to ensure solution penetration [15].
- Cover the plate with foil and incubate on a laboratory shaker (80-100 rpm) for 4-5 hours [15].
- For low H₂O₂ production, incubation time can be extended up to 8 hours [15].
Post-Staining Processing
- Replace DAB solution with bleaching solution (ethanol:acetic acid:glycerol = 3:1:1) [15].
- Place the plate in a boiling water bath (~90-95°C) for 15 minutes to remove chlorophyll [15].
- Replace with fresh bleaching solution and allow to stand for 30 minutes [15].
- Store samples at 4°C for up to 4 days if necessary [15].
- Visualize staining against a plain white background with uniform lighting [15].
Immunohistochemistry DAB Staining Protocol
For immunohistochemical applications using DAB as a chromogen [23]:
Tissue Preparation
- Wash freshly sectioned tissue slices 2-3 times with 1X PBS to remove OCT compound [23].
Quenching and Blocking
Antibody Staining
DAB Development
- Transfer into ABC Kit solution (Vector Laboratories PK4000) containing 10μl of solution A and 10μl of solution B per 1ml of 1X PBS for 1 hour at room temperature [23].
- Wash sections 4-5 times in 1X PBS [23].
- Transfer sections to DAB working solution (Vector Laboratories SK-4100) under a fume hood [23].
- Monitor staining intensity development and stop the reaction by transferring to 1X PBS when optimal signal is achieved [23].
- Wash sections 3-5 times in 1X PBS [23].
Mounting and Dehydration
- Mount sections on microscope slides and dry overnight at room temperature [23].
- Dehydrate through graded ethanols: 2 baths in distilled water (2 minutes each), 70% ethanol (2x2 minutes), 95% ethanol (2x2 minutes), 100% ethanol (2x2 minutes) [23].
- Clear with 100% xylene (2x5 minutes) and cover with DPX mounting medium [23].
Troubleshooting Guides
Common DAB Staining Issues and Solutions
| Problem | Possible Cause | Solution |
|---|---|---|
| High background staining | Non-specific binding | Optimize blocking conditions; titrate primary antibody concentration; include appropriate controls [23] |
| Weak or no signal | Insufficient H₂O₂ or peroxidase activity | Extend staining incubation time (up to 8 hours); confirm tissue viability; check reagent freshness [15] |
| Patchy or uneven staining | Incomplete tissue infiltration | Ensure proper vacuum infiltration; add surfactant (Tween 20); check solution volume adequacy [15] |
| Poor chlorophyll removal | Inadequate bleaching | Extend boiling time in bleaching solution (±5 minutes); ensure fresh bleaching solution [15] |
| Non-specific precipitation | Spontaneous DAB oxidation | Protect from light; use fresh DAB solution; filter if particulate matter present [23] [15] |
Spectrophotometer Performance Issues
Proper spectrophotometer calibration is essential for accurate H₂O₂ quantification. Common errors include [24]:
- Stray light: Caused by scattering in the monochromator, leading to inaccurate absorbance readings, particularly critical at low transmittance levels [24]
- Wavelength inaccuracy: Results in measurements at incorrect wavelengths, significantly affecting results when measuring on absorption slopes [24]
- Photometric non-linearity: Causes deviation from Beer-Lambert law, especially at high absorbance values [24]
- Bandwidth errors: Excessive bandwidth can reduce apparent absorption peak height [24]
Comparative tests across 132 laboratories showed coefficients of variation in absorbance of up to 22%, highlighting the importance of proper instrument calibration [24].
Calibration Curve Construction for H₂O₂ Quantification
Standard Preparation and Measurement
Calibration Curve Workflow
Essential Quality Control Parameters
| Parameter | Target Value | Importance |
|---|---|---|
| Correlation coefficient (R²) | ≥0.995 | Indicates linearity of response [24] |
| Y-intercept | Close to zero | Validates method specificity [24] |
| Slope consistency | CV <5% between curves | Ensves assay reproducibility [24] |
| Blank absorbance | <0.02 AU | Confirms reagent purity [24] |
Frequently Asked Questions (FAQs)
DAB Staining Methodology
Q: What are the critical safety precautions when working with DAB? A: DAB is a known carcinogen and should be handled with extreme care. Always work in a fume hood, wear appropriate personal protective equipment (gloves, lab coat, eye protection), and dispose of waste according to institutional guidelines for hazardous chemicals [23].
Q: How can I optimize DAB staining for different plant species? A: The optimal staining time may vary between species and tissue types. Conduct a time-course experiment (1-8 hours) to determine the ideal incubation period. Tissues with higher peroxidase activity may require shorter incubation times [15].
Q: Why is vacuum infiltration necessary in the DAB staining protocol? A: Many plant leaves are naturally hydrophobic, which prevents proper penetration of the staining solution. Vacuum infiltration ensures the solution enters the apoplastic space where H₂O₂ accumulation typically occurs [15].
Spectrophotometer Calibration
Q: How often should I calibrate my spectrophotometer for H₂O₂ quantification? A: Performance verification should be conducted monthly for routine use, or before critical experiments. Daily checks of wavelength accuracy and photometric linearity are recommended for high-precision work [24].
Q: What are the most important spectrophotometer parameters to validate for accurate H₂O₂ measurement? A: The critical parameters are: wavelength accuracy (especially near the absorption maximum of your chromophore), stray light (particularly at low transmittance levels), photometric linearity across your expected absorbance range, and bandwidth appropriate for your assay [24].
Q: How can I verify my spectrophotometer's wavelength accuracy without specialized equipment? A: Holmium oxide solutions or filters provide characteristic absorption peaks at known wavelengths and can be used for verification. For precise work, emission lines from deuterium lamps offer the most accurate wavelength calibration [24].
Research Reagent Solutions
Essential Materials for DAB-based H₂O₂ Detection
| Reagent | Function | Example Sources |
|---|---|---|
| DAB (3,3'-diaminobenzidine) | Chromogenic substrate for H₂O₂ detection | Sigma-Aldrich, catalog number: D8001 [15] |
| Primary antibodies | Target specific antigens in IHC | anti-Tyrosine Hydroxylase (ab152), Millipore NFAB152 [23] |
| Biotin-conjugated secondary antibodies | Amplify signal in IHC applications | Anti-rabbit IgG Biotin Conjugate (Sigma B-6648) [23] |
| ABC Kit | Enzyme complex for signal amplification | Vector Laboratories (PK4000) [23] |
| Tween 20 | Surfactant to improve tissue penetration | Sigma-Aldrich, catalog number: P9416 [15] |
| Vector DAB substrate | Ready-to-use DAB solution for IHC | Vector Laboratories (SK-4100) [23] |
Advanced Technical Considerations
Spectrophotometer Calibration Protocols
Proper instrument calibration is fundamental to obtaining reliable quantitative data. Implement these procedures regularly [24]:
Wavelength Accuracy Verification
- Use holmium oxide solution or filters with known absorption peaks
- Alternatively, use emission lines from deuterium lamps (656.100 nm, 485.999 nm) [24]
- Verify at multiple points across the spectral range, especially near your measurement wavelength [24]
Stray Light Assessment
- Measure absorbance of solutions with known high absorbance at specific wavelengths
- Stray light ratio should be <0.1% at critical wavelengths [24]
- Particularly important when measuring high absorbance samples [24]
Photometric Linearity Testing
- Use certified neutral density filters or serial dilutions of stable absorbers
- Verify adherence to Beer-Lambert law across expected absorbance range [24]
- Critical for accurate calibration curves [24]
DAB-H₂O₂ Detection Pathway
Electrochemical sensors are analytical devices that convert a biological or chemical event into a quantifiable electrical signal. For researchers focused on in planta H₂O₂ monitoring, these sensors are crucial due to their high sensitivity, potential for miniaturization, and suitability for real-time analysis in complex biological environments [25]. The core of a reliable biosensor consists of a bioreceptor for specific analyte binding, an interface architecture where the biological event occurs, and a transducer that converts this event into an electrical signal [25].
Calibration is the foundational process that ensures these measurements are accurate and traceable to known standards. It establishes a relationship between the sensor's signal and the analyte concentration, accounting for the sensor's specific characteristics and the complex plant matrix [26] [27]. Proper calibration is not merely a technical step but a strategic practice that minimizes defects, enhances data reliability, and is a key requirement of quality management systems like ISO 9001 [27]. For in planta applications, where sensor readings can be affected by pH, ionic strength, and other interfering compounds, a robust calibration protocol is non-negotiable for generating credible scientific data.
Core Principles and Sensor Fabrication
Electrochemical Detection Principles
Most electrochemical sensors for H₂O₂ detection are amperometric, meaning they measure current generated when H₂O₂ is oxidized or reduced at a working electrode held at a constant potential. The direct conversion of this catalytic event into an electronic signal is a key advantage of electrochemical biosensors [25]. The general reaction can be summarized as: H₂O₂ → O₂ + 2H⁺ + 2e⁻
The signal transduction is heavily influenced by the sensor's surface architecture at the nanoscale. The choice of electrode material and its modification are critical for suppressing non-specific interactions and enhancing the signal from the desired biochemical event [25].
Fabrication of a Non-Enzymatic H₂O₂ Sensor
Enzyme-based sensors can suffer from high cost, easy inactivation, and sensitivity to environmental parameters like pH and temperature [28]. Non-enzymatic sensors using catalytic nanomaterials offer a robust alternative. Below is a detailed protocol for fabricating a polypyrrole (PPy)-based sensor modified with Ag and Cu nanoparticles, a composite that leverages the synergistic effect of bimetals for improved performance [28].
Detailed Fabrication Protocol:
- Electrode Pretreatment: Begin with a glassy carbon electrode (GCE). Polish it to a mirror finish using alumina slurries (e.g., 100 nm and 50 nm) on a microcloth pad. Subsequently, ultrasonicate the electrode in distilled water and then 50% ethanol for several minutes each to remove any adsorbed particles. Dry the cleaned electrode under a stream of high-purity nitrogen gas [28].
- Electropolymerization of Polypyrrole (PPy): Immerse the pretreated GCE in an aqueous solution containing pyrrole monomer (e.g., 0.1 M) and a supporting electrolyte (e.g., 0.1 M NaCl). Use a standard three-electrode system (GCE as working electrode, Ag/AgCl as reference, Pt wire as counter electrode). Perform electropolymerization using a cyclic voltammetry technique, scanning the potential between set limits for a specific number of cycles to deposit a thin, adherent film of PPy directly onto the GCE surface. This method provides better control over film thickness and superior conductivity compared to drip-coating [28].
- Electrodeposition of Ag/Cu Nanoparticles: Transfer the PPy/GCE to a new electrochemical cell containing a solution of metal salts, such as silver nitrate (AgNO₃) and copper nitrate (Cu(NO₃)₂), in a suitable electrolyte. Using techniques like chronoamperometry or cyclic voltammetry at a constant potential, co-deposit Ag and Cu nanoparticles onto the porous PPy surface. The PPy matrix facilitates the firm attachment of these metal nanoparticles, reducing the risk of them falling off during use [28].
- Characterization and Validation: Characterize the modified electrode (PPy–Ag/Cu/GCE) using scanning electron microscopy to confirm the uniform distribution of nanoparticles. Electrochemically validate the sensor in a standard phosphate buffer solution by recording its amperometric response to successive additions of standard H₂O₂ solution [28].
The Scientist's Toolkit: Essential Research Reagents
Table 1: Key Reagents and Materials for H₂O₂ Sensor Fabrication and Operation.
| Item | Function/Description | Application Example |
|---|---|---|
| Glassy Carbon Electrode (GCE) | A common working electrode substrate; provides an inert, conductive surface for modifications. | Base electrode for electropolymerizing PPy and depositing nanoparticles [28]. |
| Polypyrrole (PPy) | A conductive polymer; serves as a stable, porous matrix for anchoring catalytic nanoparticles. | Electropolymerized on GCE to create a 3D scaffold for Ag/Cu particles [28]. |
| Silver (Ag) & Copper (Cu) Nanoparticles | Catalytic nanomaterials that facilitate the electrochemical reduction or oxidation of H₂O₂. | Co-deposited on PPy to create a non-enzymatic, highly active sensing surface [28]. |
| Phosphate Buffered Saline (PBS) | A common electrolyte solution; maintains a stable pH and ionic strength during measurements. | Used as the supporting electrolyte for both sensor calibration and sample testing [28]. |
| Metal Hydrogels (e.g., Pt-Ni) | Self-supported, 3D porous nanomaterials with excellent peroxidase-like and electrocatalytic activity. | Can be used in colorimetric or electrochemical sensing strategies for H₂O₂ [29]. |
| Terephthalic Acid (TA) | A chemical probe used to detect the generation of hydroxyl radicals (•OH) during catalysis. | Used to investigate the catalytic mechanism of nanozymes like Pt-Ni hydrogel [29]. |
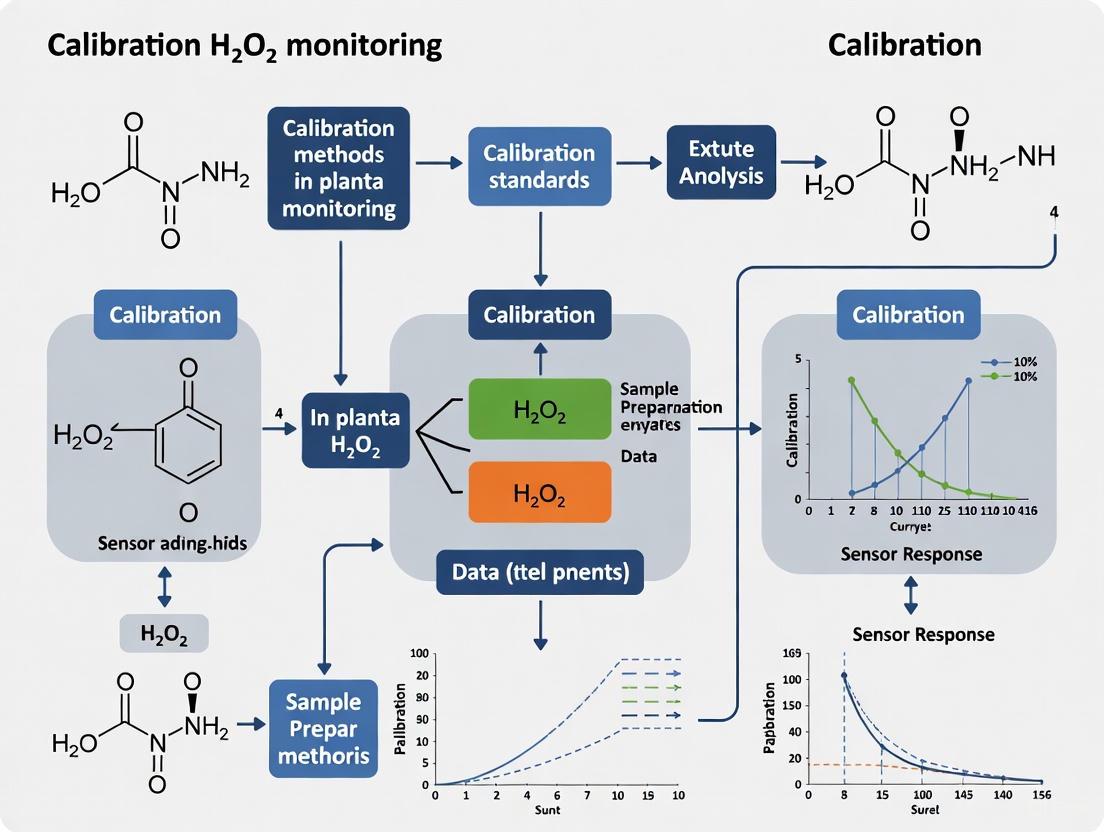
Calibration Methods and Performance Metrics
Establishing a Calibration Curve
A calibration curve is the primary link between your sensor's raw signal and the analyte concentration. To construct one for an H₂O₂ sensor:
- Prepare Standard Solutions: Create a series of H₂O₂ standard solutions in a phosphate buffer that matches the pH and ionic strength of your plant sample matrix as closely as possible.
- Record Sensor Response: Under controlled amperometric conditions, measure the steady-state current for each standard concentration.
- Plot and Model: Plot the measured current (or current density) against the corresponding H₂O₂ concentration. Typically, this relationship is linear over a specific range and can be fitted with a linear regression model to obtain the slope (sensitivity) and intercept.
Quantitative Sensor Performance Data
The performance of electrochemical sensors is quantified using several key metrics, as exemplified by data from recent studies.
Table 2: Performance Comparison of Selected Non-Enzymatic H₂O₂ Sensors.
| Sensor Architecture | Detection Principle | Linear Range | Detection Limit | Key Features |
|---|---|---|---|---|
| PPy–Ag/Cu on GCE [28] | Amperometry | 0.1–1 mM & 1–35 mM (Dual) | 0.027 μM | Cost-effective (non-precious metals), good reproducibility & stability, dual linear range. |
| Pt-Ni Hydrogel [29] | Colorimetry / Amperometry | 0.10 μM–10.0 mM / 0.50 μM–5.0 mM | 0.030 μM / 0.15 μM | Dual-mode sensing, excellent long-term stability (up to 60 days), high selectivity. |
| Implantable Microsensor [8] | Not Specified | Not Specified | Not Specified | Self-powered, implantable, designed for continuous monitoring in plants. |
The Calibration Workflow
The following diagram illustrates the critical steps in the sensor calibration and validation workflow, highlighting its cyclical nature.
Troubleshooting Common Experimental Issues
FAQ 1: Our sensor signal is unstable and drifts significantly during in planta measurements. What could be the cause?
- Potential Causes and Solutions:
- Biofouling: The sensor surface may be coated by proteins or other biological macromolecules from the plant sap. This is a common challenge in complex matrices.
- Solution: Incorporate anti-fouling membranes or surface coatings (e.g., Nafion, PEG) during probe fabrication. These can suppress non-specific interactions [25].
- Variation in Microenvironment: The local pH and ionic strength inside plant tissues can differ from your calibration buffer.
- Solution: Perform calibration in a matrix that more closely mimics the plant apoplast. Use a standard addition method for more accurate quantification in vivo.
- Sensor Degradation: The catalytic nanoparticles or the polymer matrix may be degrading or detaching.
- Solution: Ensure robust fabrication, such as using electropolymerization for strong adhesion of PPy and electrodeposition for firm attachment of nanoparticles [28]. Check the sensor's stability performance in its specification.
- Biofouling: The sensor surface may be coated by proteins or other biological macromolecules from the plant sap. This is a common challenge in complex matrices.
FAQ 2: The sensitivity of our fabricated H₂O₂ sensor is much lower than reported in the literature. How can we improve it?
- Potential Causes and Solutions:
- Insufficient Active Surface Area: The electrode surface may not be properly modified with the catalytic material.
- Solution: Optimize the parameters for electropolymerization and electrodeposition (e.g., concentration, potential, duration). Characterize the surface with SEM to confirm a uniform and porous nanostructure, which provides a large surface area for reaction [28].
- Improper Electrode Preparation: A poorly polished electrode can hinder electron transfer.
- Solution: Strictly follow the electrode pretreatment protocol, including polishing and ultrasonic cleaning, to ensure a fresh, clean surface [28].
- Suboptimal Applied Potential: The working potential may not be at the peak efficiency for H₂O₂ oxidation/reduction on your specific catalytic material.
- Solution: Use cyclic voltammetry to identify the optimal working potential for your modified electrode.
- Insufficient Active Surface Area: The electrode surface may not be properly modified with the catalytic material.
FAQ 3: What does "traceable calibration" mean and why is it critical for our thesis research?
- Answer: Traceable calibration means that the calibration of your sensor was performed using reference standards that are themselves calibrated against higher-level standards, in an unbroken chain that leads back to a primary national or international standard (e.g., from NIST) [26]. This is critical for your thesis because:
- It Ensures Data Validity: Traceability provides a verifiable "pedigree" for your measurements, allowing other scientists to trust and reproduce your data.
- It Meets Quality Standards: Adherence to traceability is a key requirement in quality management systems and is often mandatory for research published in high-impact journals [27] [26].
- It Allows Comparability: It ensures that your measurements of H₂O₂ in plants are consistent and comparable with those made by other researchers in different labs.
FAQ 4: Our sensor shows a high response to interfering agents like ascorbic acid. How can we enhance its selectivity?
- Potential Causes and Solutions:
- Lack of Selective Coating: The sensor surface may be equally accessible to both H₂O₂ and interfering compounds.
- Solution: Apply a selective permselective membrane (e.g., chitosan, cellulose acetate) that allows H₂O₂ to diffuse through while blocking larger or differently charged molecules like ascorbic acid [25] [28]. The use of bimetallic composites like Ag/Cu can also improve selectivity through their specific catalytic properties [28].
- Lack of Selective Coating: The sensor surface may be equally accessible to both H₂O₂ and interfering compounds.
Advanced: Calibration in Predictive Models and Machine Learning
Beyond sensor-level calibration, the concept of "calibration" is also vital for the predictive models that might interpret sensor data. In this context, calibration refers to the agreement between the predicted probabilities of an event and the actual observed frequencies [30].
A model can have good discrimination (ability to rank high-risk and low-risk events) but poor calibration, meaning its predicted probabilities are inaccurate. For example, a model might consistently predict a 80% probability for events that only occur 50% of the time [30]. Evaluating calibration involves techniques like calibration plots and metrics. This is an advanced consideration for researchers who may be developing algorithms to predict plant stress levels based on multiplexed sensor data, including H₂O₂ fluxes. Ensuring your predictive model is well-calibrated is as important as the initial sensor calibration for making accurate inferences about plant health.
Non-Invasive Live Imaging with Genetically Encoded Fluorescent Sensors (roGFP2-Orp1, Grx1-roGFP2)
Sensor Fundamentals and Calibration Principles
Frequently Asked Questions
What are the fundamental operating principles of roGFP2-based sensors? roGFP2-based sensors function through a redox-sensitive mechanism. The roGFP2 protein is engineered with two cysteine residues inserted into adjacent β-strands on its surface. Upon oxidation, these cysteines form a disulfide bond, inducing a conformational change that alters the chromophore's fluorescence properties. This change differentially affects the two main excitation peaks (405 nm and 488 nm) while the emission spectrum remains unchanged, creating a ratiometric response that is independent of sensor concentration [31] [32].
How do Grx1-roGFP2 and roGFP2-Orp1 differ in their sensing targets and mechanisms?
- Grx1-roGFP2: This sensor is fused to human glutaredoxin 1 (Grx1), which catalyzes the equilibrium between the sensor and the glutathione (GSSG/2GSH) redox couple. It therefore reports on the glutathione redox potential (E_GSH) of the cellular compartment where it is localized [31].
- roGFP2-Orp1: This sensor is fused to the yeast peroxidase Orp1, which acts as a specific H₂O₂-dependent thiol oxidase. Orp1 mediates the H₂O₂-dependent oxidation of roGFP2, making this sensor specifically responsive to H₂O₂. Its oxidation state reflects a balance between H₂O₂-driven oxidation and reduction by cellular systems like glutaredoxin or thioredoxin [31].
Why is a ratiometric measurement crucial for in planta imaging, and how is it performed? Ratiometric measurements are essential because they minimize artifacts caused by variations in sensor expression levels, sample thickness, or movement. The standard procedure involves sequentially exciting the sensor at two wavelengths—405 nm (Ex405) and 488 nm (Ex488)—and collecting the emission at approximately 513 nm. The ratio of fluorescence intensities (F₄₈₈/F₄₀₅) indicates the sensor's oxidation state, which can be correlated to the specific redox parameter being measured [31].
Key Sensor Characteristics and Calibration Data
Table 1: Characteristics of roGFP2-Based Biosensors
| Sensor Feature | Grx1-roGFP2 | roGFP2-Orp1 |
|---|---|---|
| Primary Measurand | Glutathione redox potential (E_GSH) [31] | H₂O₂-dependent oxidation [31] |
| Sensing Mechanism | Equilibrium with GSSG/2GSH pool, catalyzed by Grx1 [31] | Orp1-mediated, H₂O₂-specific oxidation [31] |
| Excitation Peaks | 405 nm & 488 nm [31] | 405 nm & 488 nm [31] |
| Emission Peak | ~513 nm [31] | ~513 nm [31] |
| Response Type | Ratiometric (F₄₈₈/F₄₀₅) [31] | Ratiometric (F₄₈₈/F₄₀₅) [31] |
| Key Consideration | Reports thermodynamic redox potential | Dynamics depend on both H₂O₂ levels and reductase activity [31] |
Table 2: Recommended In Vivo Calibration Treatments for Determining Dynamic Range
| Treatment | Concentration | Purpose | Effect on Ratio (F₄₈₈/F₄₀₅) |
|---|---|---|---|
| Dithiothreitol (DTT) | 10 mM (in vivo) [31] | Full reduction | Maximizes ratio (F₄₈₈) [31] |
| Hydrogen Peroxide (H₂O₂) | 10 mM (in vivo) [31] | Full oxidation | Minimizes ratio (F₄₀₅) [31] |
| Validation Note | Treatments should be applied to a separate sample or at the experiment endpoint. The specific concentration may require optimization for your plant system and tissue type. |
Diagram 1: Signaling pathways and mechanisms of roGFP2-based sensors.
Experimental Setup and Workflow
Frequently Asked Questions
What are the best practices for growing plants for non-invasive imaging? The protocol supports mature Arabidopsis thaliana plants (3-4 weeks old) grown in either soil or hydroponic systems [31]. For hydroponic culture, specialized seed-holders (e.g., from Araponics) are recommended. Plants should be grown in a controlled environment chamber with regulated temperature, light, and humidity to minimize physiological variability before imaging [31].
What is the basic workflow for a live imaging session? A standard workflow involves:
- Preparation: Mount the intact, potted plant under the stereo fluorescence microscope without detaching leaves or causing damage [31] [32].
- Setup: Define the imaging area and focus on the region of interest (e.g., a specific leaf).
- Image Acquisition: Sequentially capture fluorescence images using Ex405 and Ex488 filters, ensuring identical settings across all samples and time points [31].
- Post-processing: Use image analysis software to calculate the ratiometric image (F₄₈₈/F₄₀₅) on a pixel-by-pixel basis.
How can I validate that my sensors are functioning correctly during an experiment? At the end of an imaging time series, you can perform an in vivo validation by treating the imaged tissue with 10 mM H₂O₂ and 10 mM DTT and acquiring a final set of images. This confirms that the sensor is responsive and establishes the dynamic range for your specific experimental setup [31].
Essential Research Reagent Solutions
Table 3: Essential Materials for Non-Invasive In Planta Imaging
| Reagent / Material | Function / Description | Example / Note |
|---|---|---|
| Transgenic Seeds | Expressing Grx1-roGFP2 or roGFP2-Orp1 in desired compartment [31] | Arabidopsis Col-0 is commonly used; various subcellular targeting available [31] |
| Growth Medium | For plant cultivation | 0.5x Murashige and Skoog (MS) medium, pH 5.8, solidified with 0.8% plant agar [31] |
| Hydroponic System | For controlled nutrient delivery | Araponics-style seed-holders and boxes [31] |
| H₂O₂ Stock Solution | For sensor oxidation and calibration [31] | 1 M stock in deionized water [31] |
| DTT Stock Solution | For sensor reduction and calibration [31] | 1 M stock in deionized water [31] |
| Stereo Fluorescence Microscope | Primary imaging equipment | Must have filters for 405 nm and 488 nm excitation and ~513 nm emission [31] [32] |
Diagram 2: Non-invasive plant imaging workflow.
Troubleshooting Common Experimental Issues
Frequently Asked Questions
I am getting a weak or no fluorescence signal. What could be wrong?
- Check Sensor Expression: Confirm the presence of the transgene via genotyping and check expression levels with standard epifluorescence before ratiometric imaging.
- Verify Microscope Settings: Ensure the microscope light path is correctly configured for the sensor's excitation and emission wavelengths. Check for filter block compatibility.
- Focus and Magnification: Stereo microscopes have a limited depth of field. Ensure the tissue is in sharp focus. Use low magnification for an initial survey.
My ratio values are not changing during a treatment that should induce oxidative stress. How should I debug this?
- Validate Sensor Responsiveness: Perform a positive control experiment by applying a bolus of H₂O₂ (e.g., 1-10 mM) at the end of your time series and check for a ratio change [31].
- Check Treatment Efficacy: Ensure your stress treatment (e.g., salt stress) is properly administered and is physiologically relevant.
- Consider Compartmentalization: Verify the subcellular localization of your sensor. A stressor might primarily affect a different compartment than the one your sensor is targeted to.
The fluorescence ratio is unstable or noisy. What are the potential causes?
- Minimize Movement Artifacts: Ensure the plant is securely mounted to prevent movement between the two excitation image captures.
- Optimize Exposure Times: Use exposure times that yield a strong signal without saturating the camera's pixel depth.
- Account for Autofluorescence: Acquire images from wild-type (non-transgenic) plants under identical settings and subtract this background if necessary.
How do I interpret a change in the roGFP2-Orp1 ratio, given it is influenced by both oxidation and reduction? An increase in the roGFP2-Orp1 oxidation state (decreased F₄₈₈/F₄₀₅ ratio) indicates that the rate of H₂O₂-driven oxidation via Orp1 is exceeding the rate of reduction by cellular systems like glutaredoxin/thioredoxin. It is a direct measure of H₂O₂-dependent oxidation, but the steady-state level is a balance of both processes. Correlative measurements with Grx1-roGFP2 can help dissect the contribution of the reductive capacity of the cell [31].
Advanced Applications and Technique Integration
Can this technique be combined with other imaging modalities? Yes, the non-invasive nature of this stereo microscopy approach makes it compatible with other techniques. For example, the protocol was paired with immunohistochemistry (IHC) assays like pimonidazole staining to validate findings and gain spatial resolution at the cellular level, complementing the real-time dynamics provided by live imaging [33].
Is this method applicable beyond Arabidopsis? The principle is generalizable. The roGFP2-based sensors have been successfully expressed and imaged in other species, including Solanum tuberosum (potato) and barley, and even in bacteria like Sinorhizobium meliloti for studying symbiosis [31] [34]. The imaging setup would need to be adapted to the size and morphology of the new organism.
Troubleshooting Guides
Guide 1: Addressing Low Sensitivity and High Variability
Problem: Measurements show low sensitivity or inconsistent results between replicates.
| Possible Cause | Diagnostic Steps | Recommended Solution |
|---|---|---|
| Improper Calibration | Check calibration curve linearity (R² value); verify calibrator concentration coverage. | Perform a two-point calibration in duplicate, using calibrators that bracket the expected sample concentration range [35]. |
| Sample Degradation | Compare fresh vs. frozen sample results; note sample storage duration. | For plant tissues, analyze samples immediately (nonfrozen) when possible. If freezing is necessary, store at -80°C and analyze within a short, consistent timeframe [17]. |
| Interfering Compounds | Test sample recovery by spiking with a known H₂O₂ standard. | Include polyvinylpyrrolidone (PVP) in the extraction buffer to precipitate phenolic compounds that can cause interference in plant tissue extracts [17]. |
Guide 2: Handling Sample Preparation and Storage Issues
Problem: Uncertainty about optimal sample handling procedures for plant tissues.
| Possible Cause | Diagnostic Steps | Recommended Solution |
|---|---|---|
| Enzyme Activity in Fresh Tissue | Measure H₂O₂ concentration immediately after extraction and again after 30 minutes. | Grind plant tissue in liquid nitrogen and use potassium phosphate buffer (e.g., 50 mM, pH 6.0) for extraction to stabilize H₂O₂ [17]. |
| H₂O₂ Loss During Storage | Compare H₂O₂ concentrations in samples analyzed fresh versus after frozen storage. | For the eFOX assay, fresh (nonfrozen) samples are preferred. A strong correlation exists between fresh and frozen samples (r=0.879), but H₂O₂ can degrade over time, even at -80°C [17]. |
| Inconsistent Tissue Grinding | Visually inspect the homogenate for large, unground particles. | Use a bead-based homogenizer with a combination of 3 mm and 10 mm beads in a centrifuge tube to ensure a fine, consistent powder is achieved after grinding in liquid nitrogen [17]. |
Frequently Asked Questions (FAQs)
1. Which assay is more sensitive for detecting lower concentrations of H₂O₂ in plant tissues?
The modified Ferrous Oxidation-Xylenol Orange (eFOX) assay is generally more sensitive for detecting lower fluctuations in H₂O₂ concentration. It can reliably measure lipid hydroperoxide concentrations as low as 5 µM, whereas the iodometric assay (another common method) has difficulty quantifying levels below 11 µM. While the Titanium Sulfate (Ti(SO₄)₂) assay is effective, the eFOX assay is better suited for capturing small changes [36] [17].
2. Can I use frozen plant samples for these assays, or must they be analyzed fresh?
You can use both, but with important considerations. A strong correlation has been observed between H₂O₂ concentrations measured in nonfrozen and frozen plant samples for both the eFOX (r = 0.879) and Ti(SO₄)₂ (r = 0.837) assays. However, H₂O₂ concentration can decrease significantly after a week of storage, even at -80°C. For the most accurate results, it is recommended to prepare and analyze samples soon after collection. If freezing is necessary, standardize the storage duration and conditions across all samples [17].
3. Why are my calibration curves inconsistent, and how can I improve them?
Inconsistent calibration is often due to an insufficient number of calibration points or a lack of replicate measurements. Using only a single calibrator does not define a reliable linear relationship. To improve reliability:
- Perform a blank measurement (e.g., with distilled water or reagent blank) with every batch.
- Use at least two calibrators of different concentrations that cover your expected linear range.
- Measure each calibrator in duplicate to account for measurement variation [35]. This two-point calibration in duplicate enhances linearity assessment, improves accuracy, and helps detect errors.
4. How do the eFOX and Ti(SO₄)₂ assays correlate with each other?
Substantial correlations between the eFOX and Ti(SO₄)₂ assays have been demonstrated across multiple riparian plant species in nonfrozen conditions. Correlation coefficients (r) are: Ambrosia trifida (r = 0.767), Solidago altissima (r = 0.583), Artemisia princeps (r = 0.672), and Sicyos angulatus (r = 0.828). This indicates that both methods can be utilized to reliably quantify oxidative stress via H₂O₂, though they may not be directly interchangeable without a validation study for your specific samples [17].
Experimental Protocols for Key Experiments
Protocol 1: Standardized H₂O₂ Extraction from Plant Leaves
This protocol is foundational for both the eFOX and Ti(SO₄)₂ assays [17].
- Weighing: Precisely weigh approximately 40-50 mg of plant leaf tissue.
- Grinding: Place the tissue into a 15 mL centrifuge tube containing a combination of 3 mm and 10 mm beads. Submerge the tube in liquid nitrogen to flash-freeze the sample, then immediately grind it to a fine powder using a bead homogenizer (e.g., a ShakeMaster).
- Extraction: Add 5 mL of ice-cold Potassium Phosphate Buffer (50 mM, pH 6.0) to the tube. Include a small amount of polyvinylpyrrolidone (PVP) to adsorb interfering phenolic compounds.
- Clarification: Centrifuge the homogenate twice at 5500 rpm for 10 minutes each time. Carefully collect the clear supernatant for H₂O₂ analysis.
Protocol 2: Performing the Modified Ferrous Oxidation-Xylenol Orange (eFOX) Assay
This method is sensitive, stable, and not sensitive to ambient O₂ or light levels [36] [17].
Principle: Ferrous ions (Fe²⁺) are oxidized by H₂O₂ to ferric ions (Fe³⁺). The ferric ions then form a colored complex with xylenol orange, which can be measured spectrophotometrically.
- Reagent Preparation: Prepare the FOX reagent, which typically contains xylenol orange, ferrous ammonium sulfate, and an acid (like sulfuric acid) in an aqueous solution.
- Reaction: Mix a known volume of your plant extract supernatant with the FOX reagent.
- Incubation: Allow the reaction mixture to incubate at room temperature for a specified period (e.g., 30 minutes).
- Measurement: Measure the absorbance of the solution at an appropriate wavelength (e.g., 550-560 nm).
- Quantification: Determine the H₂O₂ concentration in your sample by comparing its absorbance to a standard curve prepared with known concentrations of H₂O₂.
Protocol 3: Performing the Titanium Sulfate (Ti(SO₄)₂) Assay
This is a classic colorimetric method for H₂O₂ detection [17] [37].
Principle: Titanium ions react with H₂O₂ to form a yellow-colored peroxo-complex.
- Reagent Preparation: Prepare a solution of Titanium Sulfate in a diluted sulfuric acid or water.
- Reaction: Mix the plant extract supernatant with the Titanium Sulfate reagent.
- Incubation: Allow the yellow color to develop fully.
- Measurement: Measure the absorbance of the complex at its absorption maximum, typically around 400-415 nm.
- Quantification: Calculate the H₂O₂ concentration using a standard curve.
Data Presentation: Quantitative Comparisons
Table 1: Comparative Performance of eFOX and Ti(SO₄)₂ Assays
This table summarizes key performance characteristics based on empirical data from plant tissue analysis [36] [17].
| Feature | Modified Ferrous Oxidation-Xylenol Orange (eFOX) | Titanium Sulfate (Ti(SO₄)₂) |
|---|---|---|
| Typical Measurement Range | Can measure LOOH as low as 5 µM [36]. | Effective for a wide range but may be less consistent at low µM levels [36]. |
| Correlation (Fresh vs. Frozen) | r = 0.879 (Substantial) [17]. | r = 0.837 (Substantial) [17]. |
| Inter-Species Correlation with other Method | A. trifida: r=0.767; S. altissima: r=0.583; A. princeps: r=0.672; S. angulatus: r=0.828 [17]. | (This data demonstrates correlation of each method to the other) [17]. |
| Key Advantage | Measures initial oxidation products; less variable results; high sensitivity [36]. | Relatively accessible and straightforward methodology [17]. |
| Reported Interference | Less variable results in the presence of plant tissue matrices [36]. | Can be affected by other redox-active compounds [17]. |
Visualization of Workflows and Relationships
Diagram 1: Plant H₂O₂ Assay Selection
Diagram 2: H₂O₂ Assay Chemical Principles
The Scientist's Toolkit: Essential Research Reagent Solutions
Table 2: Key Reagents and Materials for H₂O₂ Quantification
| Item | Function in the Experiment | Specific Example / Note |
|---|---|---|
| Potassium Phosphate Buffer | Extraction medium to stabilize pH and prevent H₂O₂ degradation during tissue homogenization. | Typically used at 50 mM concentration, pH 6.0 [17]. |
| Polyvinylpyrrolidone (PVP) | Added to the extraction buffer to bind and precipitate phenolic compounds from plant tissues, reducing interference. | A small amount is used during the grinding/extraction step [17]. |
| Liquid Nitrogen | Used for flash-freezing plant tissues to halt metabolic activity and for facilitating grinding into a fine powder. | Essential for preserving the in-vivo H₂O₂ levels at the moment of sampling [17]. |
| Bead Homogenizer | Equipment used to mechanically disrupt frozen plant tissue in a centrifuge tube, ensuring complete and uniform homogenization. | Using a combination of 3 mm and 10 mm beads improves efficiency [17]. |
| Xylenol Orange | The chromogenic compound that forms a colored complex with ferric ions (Fe³⁺) in the eFOX assay. | The intensity of the resulting color is proportional to the original H₂O₂ concentration [36]. |
| Titanium Sulfate (Ti(SO₄)₂) | The reagent that directly reacts with H₂O₂ to form a yellow-colored complex in the Ti(SO₄)₂ assay. | The absorbance of this complex is measured at 400-415 nm for quantification [37]. |
| Calibrators | Solutions with known concentrations of H₂O₂ used to construct a standard curve for quantifying the H₂O₂ in unknown samples. | Using at least two calibrators at different concentrations in duplicate is recommended for a reliable calibration curve [35]. |
Overcoming Common Pitfalls: A Troubleshooting Guide for Robust H2O2 Quantification
The integrity of your research data, particularly in sensitive applications like calibrating in planta H₂O₂ monitoring systems, is fundamentally dependent on the initial steps of sample preparation. The choice between frozen and non-frozen (FFPE) tissue handling methods dictates the quality and type of biological information you can reliably extract. Each method preserves different aspects of the sample with varying efficiencies, making the selection process critical for experimental success. FFPE tissue is preserved through formalin fixation and paraffin embedding, which excels at maintaining morphological structure but compromises biomolecular integrity [38] [39]. In contrast, fresh frozen tissue, preserved through rapid cooling to ultra-low temperatures, is the gold standard for preserving native biomolecules like DNA, RNA, and proteins, making it ideal for molecular analyses [40].
For research focused on reactive oxygen species like H₂O₂, where understanding native protein conformations and enzymatic activities is paramount, the preservation method can significantly impact the calibration of monitoring systems and the interpretation of experimental results.
Direct Comparison: Frozen vs. FFPE Tissue
The table below summarizes the core characteristics of each preservation method to guide your selection.
| Feature | Fresh Frozen Tissue | FFPE (Formalin-Fixed Paraffin-Embedded) Tissue |
|---|---|---|
| Preservation Method | Rapid freezing (e.g., liquid nitrogen) [39] [40] | Formalin fixation & paraffin embedding [38] [40] |
| Biomolecule Integrity | High: Intact, native DNA, RNA, and proteins. Gold standard for molecular analysis [40]. | Lower: Fragmented DNA/RNA; proteins are denatured and cross-linked [38] [40]. |
| Morphology Quality | Good, but can have freezing artifacts [40]. | Excellent: Superior cellular/tissue architecture for diagnosis [38] [40]. |
| Primary Applications | Genomics, transcriptomics, proteomics, enzymatic assays, drug testing [39] [40]. | Routine histopathology, immunohistochemistry (IHC), retrospective studies [38] [39]. |
| Storage Requirements | Ultra-cold freezers (-80°C) or liquid nitrogen; high maintenance [38] [40]. | Room temperature; highly stable and easy to store for decades [38] [40]. |
| Relative Cost & Logistics | Complex, expensive, requires specialized equipment [40]. | Simpler, less expensive, and widely established [40]. |
Troubleshooting Guides
Poor Nucleic Acid Yield or Quality from Frozen Tissue
- Problem: Isolated DNA or RNA is degraded or yields are low.
- Solutions:
- Ensure Rapid Freezing: Slow freezing leads to ice crystal formation, which physically shears cellular structures and nucleic acids. Use a pre-chilled metal block or immerse the sample in liquid nitrogen-cooled isopentane for rapid, vitreous freezing [41].
- Prevent Thawing During Handling: Always keep samples on dry ice when cutting or pulverizing tissue. Use pre-chilled tools to prevent thawing, which activates nucleases that degrade DNA and RNA [42].
- Pulverize Tissue Under Liquid Nitrogen: For more efficient lysis, grind frozen tissue into a powder under liquid nitrogen using a pre-cooled mortar and pestle. This creates a homogeneous sample and increases the surface area for lysis buffer action [42].
- Start Lysis Immediately: Once tissue powder or pieces are aliquoted, add lysis buffer and Proteinase K immediately and begin the incubation step. Do not process all samples in a batch before starting lysis [42].
Freezing Artifacts and Tissue Damage
- Problem: Tissue morphology is compromised with "swiss cheese"-like holes, making histological analysis difficult [41].
- Solutions:
- Optimize Freezing Rate: As with nucleic acid preservation, a rapid freezing rate is critical to form vitreous ice instead of damaging crystalline ice [41].
- Use a Cryoprotectant: For sensitive tissues, permeate with a cryoprotectant solution like sucrose, glycerol, or polyethylene glycol before freezing. These compounds disrupt ice crystal formation and reduce freezing damage [41].
- Avoid Liquid Nitrogen Immersion for Large Samples: Direct immersion of large tissue blocks in liquid nitrogen can cause a vapor barrier to form, leading to uneven freezing and internal cracking. For samples larger than a few cubic millimeters, use a chilled metal surface surrounded by powdered dry ice or isopentane cooled to -80°C [41].
- Section at Optimal Temperature: When cutting frozen sections in a cryostat, allow the tissue block to warm just enough to be sectionable. If it is too cold, it will shatter; if too warm, it will become gummy and smear. Tissue should not be left in the cryostat for long periods, as vitreous ice can slowly convert to expanding crystalline forms [41].
Challenges with FFPE Tissue for Molecular Work
- Problem: Difficulty extracting high-quality, amplifiable DNA or RNA from FFPE samples.
- Solutions:
- Use Specialized Kits for FFPE: Employ DNA/RNA purification kits specifically designed to reverse formalin-induced cross-links and recover fragmented nucleic acids [38].
- Optimize Antigen Retrieval for IHC: For protein detection via IHC, you may need to experiment with different antigen retrieval protocols (e.g., heat-induced or enzymatic epitope retrieval) to unmask antibody-binding sites that were cross-linked during formalin fixation [38] [40].
Frequently Asked Questions (FAQs)
Q1: For calibrating H₂O₂ monitoring sensors, which tissue preservation method is more suitable?
A1: Fresh frozen tissue is overwhelmingly more suitable. The calibration of in planta H₂O₂ monitoring relies on accurately measuring native biochemical states and molecular interactions. Fresh frozen tissue preserves proteins, including peroxidases and other enzymes involved in H₂O₂ metabolism, in their native and active conformations. This ensures that analytical results, such as those from immunodetection or mass spectrometry, reflect the true in vivo state, leading to more reliable sensor calibration [8] [40].
Q2: What is the "flash freezing" protocol, and why is it critical? A2: Flash freezing (or snap freezing) is the process of rapidly immersing a fresh tissue sample in liquid nitrogen or a cryogen like isopentane cooled by liquid nitrogen. This rapid cooling is critical because it causes water within the cells to solidify into a glass-like, non-crystalline state (vitreous ice). Slow freezing allows water to form large, sharp hexagonal ice crystals, which expand and pierce cell membranes and organelles, leading to biomolecular degradation and the "swiss cheese" artifact in histology. Flash freezing minimizes this damage, preserving cellular ultrastructure and the integrity of labile molecules like RNA [39] [41].
Q3: Can I use stabilized solutions like RNAlater as an alternative to immediate freezing? A3: Yes, chemical stabilizers like RNAlater are an excellent alternative, especially when immediate access to liquid nitrogen or a -80°C freezer is impractical. These solutions rapidly penetrate tissue to stabilize and protect RNA (and to some extent, DNA and proteins) at room temperature for a period, allowing for safe transport or short-term storage at 4°C. It is important to note that for long-term storage, samples in RNAlater should still be moved to -20°C or -80°C. Stabilized tissues are often easier to handle than brittle frozen blocks when aliquoting [42].
Q4: My frozen tissue block cracked. What went wrong? A4: Cracking is a classic sign of thermal stress, often caused by non-uniform freezing. In larger tissue blocks, the outer layer freezes rapidly and contracts, while the inner core freezes more slowly and expands as it forms crystalline ice. This differential expansion creates immense stress, cracking the block. To prevent this, ensure rapid and uniform freezing by reducing sample size, using a cryoprotectant, and avoiding direct immersion of large samples in liquid nitrogen [41].
Essential Experimental Protocols
Protocol for Optimal Fresh Frozen Tissue Preparation
This protocol is designed to maximize the preservation of biomolecules for downstream in planta H₂O₂ research.
Title: Workflow for Preparing Fresh Frozen Tissue Powder
Materials and Equipment:
- Liquid nitrogen in a dewar
- Pre-cooled mortar and pestle
- Pre-cooled metal spatula or scoop
- Cryogenic vials
- Forceps
- Styrofoam box or cooler
- -80°C freezer
Procedure:
- Preparation: Pre-cool the mortar, pestle, spatula, and forceps by submerging them in liquid nitrogen. Keep cryogenic vials on dry ice.
- Harvesting: Quickly harvest the plant tissue using a clean tool and immediately submerge it in liquid nitrogen in the mortar to halt all metabolic activity.
- Pulverization: While keeping the tissue submerged, use the pestle to grind the brittle tissue into a fine, homogeneous powder. Continue adding liquid nitrogen as needed to keep the sample frozen.
- Aliquoting: Using the pre-chilled spatula, quickly transfer a measured amount of the frozen powder into a pre-labeled, pre-chilled cryogenic vial. Keep the vial on dry ice throughout this process to prevent thawing.
- Storage: Immediately place the sealed vial into a -80°C freezer for long-term storage. Avoid freeze-thaw cycles.
Protocol: DAB Staining for In-Planta H₂O₂ Detection
This established histochemical protocol is used to visualize spatial and temporal patterns of H₂O₂ accumulation in plant tissues, a key technique for validating monitoring sensors [43].
Title: Workflow for DAB Staining to Detect H₂O₂
Research Reagent Solutions:
| Reagent | Function in Experiment |
|---|---|
| DAB (3,3'-Diaminobenzidine) | Chromogenic substrate that polymerizes as a brown precipitate in the presence of H₂O₂ and peroxidases [43]. |
| Sodium Phosphate Buffer | Provides a stable pH environment for the peroxidase enzyme reaction to occur [43]. |
| Tween 20 | A surfactant that helps the staining solution evenly penetrate the waxy plant leaf surface [43]. |
| Bleaching Solution (Ethanol:Acetic Acid:Glycerol) | Removes chlorophyll to eliminate green background pigmentation, making the brown DAB precipitate clearly visible [43]. |
Procedure:
- Treatment: Apply your chosen abiotic or biotic stress (e.g., wounding, pathogen elicitor) to the plants and incubate for the desired time.
- DAB Solution Preparation: In a 50 mL Falcon tube, add 50 mg of DAB powder to 45 mL of sterile water. Adjust the pH to 3.0 using HCl to dissolve the DAB. Then, add 25 μl of Tween 20 and 2.5 ml of 200 mM Na₂HPO₄ to achieve a final 10 mM phosphate buffer. Protect this solution from light as DAB is light-sensitive. The solution must be used fresh [43].
- Infiltration: Manually remove leaves and place them in a multi-well plate. Cover the leaves with the DAB staining solution. Place the plate in a desiccator and apply a gentle vacuum for about 5 minutes to ensure the solution infiltrates the leaf air spaces.
- Incubation: Cover the plate with foil and incubate on a laboratory shaker (80-100 rpm) for 4 to 8 hours to allow the stain to develop.
- Destaining: Replace the DAB solution with bleaching solution (3:1:1 = Ethanol:Acetic Acid:Glycerol). Place the plate in a boiling water bath for approximately 15 minutes, or until the leaves are completely cleared of chlorophyll.
- Storage and Imaging: Replace the bleaching solution with a fresh batch and let stand for 30 minutes. The cleared leaves can be stored at 4°C for a few days. Photograph the samples on a white background under uniform lighting to document the location and intensity of the brown DAB stain, which indicates H₂O₂ production [43].
Mitigating Interference from Other Redox-Active Compounds
Frequently Asked Questions (FAQs)
Q1: Why is it critical to distinguish between different reactive oxygen species (ROS) when measuring H2O2? The term "ROS" covers a wide range of chemical species with vastly different reactivities, lifetimes, and biological roles. For instance, superoxide (O2•−) is a precursor to H2O2, while the hydroxyl radical (•OH) is extremely reactive and non-specifically damages biomolecules [44]. Using a method or probe that generically detects "ROS" without specificity for H2O2 can lead to misleading data, as the signal may be confounded by these other species. Progress in understanding specific signaling or damage pathways requires identifying the actual chemical species involved [44].
Q2: What are the major limitations of common fluorescent probes like DCFH-DA for intracellular H2O2 measurement? Dichlorodihydrofluorescein diacetate (DCFH-DA) is notoriously nonspecific and should not be used as a reliable measure of H2O2 for several key reasons [45]:
- It does not react directly with H2O2 but is oxidized by various one-electron oxidizing species.
- The oxidized product, DCF, can itself produce O2•− and H2O2, artificially inflating the very signals it is meant to measure.
- Its oxidation can be catalyzed by transition metals, cytochrome c, and heme peroxidases, independent of H2O2 levels.
Q3: How can endogenous reductants in plant tissue samples interfere with H2O2 quantification? Many assays, particularly peroxidase-based methods, rely on the generation of an oxidized, detectable reporter molecule. Endogenous reductants (e.g., ascorbate or glutathione) present in complex biological samples can chemically reduce this oxidized reporter back to its colorless form after the enzymatic reaction has occurred [46]. This leads to a lower measured signal and a significant underestimation of the true H2O2 concentration [46].
Q4: Does the sample preparation method (fresh vs. frozen) affect H2O2 measurements? Yes, sample handling is crucial. Research on riparian plant species has shown that while H2O2 levels can be correlated between freshly analyzed (nonfrozen) samples and those frozen at -80°C for 25 days, the act of freezing and storing can alter the absolute concentrations [17]. For the most accurate snapshot of in planta H2O2 levels, immediate analysis of fresh samples is preferable. However, if storage is necessary, consistent handling protocols are essential for comparative studies.
Troubleshooting Guides
Problem 1: Inconsistent or Artificially Low H2O2 Readings in Peroxidase-Based Assays
Potential Cause: Interference from endogenous reductants (e.g., ascorbate, glutathione) in the plant tissue extract [46].
Solutions:
- Pre-oxidation Treatment: Prior to initiating the H2O2-peroxidase reaction, selectively pre-oxidize the interfering reductants. This can be done by adding the reporter molecule (e.g., ABTS) to your sample extract and allowing it to incubate. The reductants will react with and reduce the reporter, which can then be accounted for or its effect exhausted before the actual H2O2 quantification begins [46].
- Assay Selection: Consider switching to a non-peroxidase-based method. The Ferrous Oxidation Xylenol Orange (FOX) assay, which is based on the oxidation of Fe2+ by H2O2, may be less susceptible to this specific type of interference, though it has its own set of potential interferences [17].
Problem 2: Lack of Specificity for H2O2 and Signal Crosstalk
Potential Cause: The chosen method or chemical probe is reacting with other ROS or redox-active compounds present in the sample.
Solutions:
- Use a Genetically Encoded Biosensor: For live-cell or subcellular measurements, employ genetically encoded sensors like HyPer7. HyPer7 is highly specific to H2O2 due to its engineered H2O2-sensitive domain (OxyR-RD) and is less sensitive to other ROS and redox changes. It also allows for rationetric measurement, minimizing artifacts [47].
- Validate with Multiple Assays: Correlate your findings using two or more fundamentally different assay principles. For example, if you use a titanium sulfate (Ti(SO4)2) assay [17], confirm the trend with a modified ferrous oxidation xylenol orange (eFOX) assay [17]. A substantial correlation between methods increases confidence that you are accurately tracking H2O2 and not an interfering substance.
- Employ Scavenging Enzymes: Use enzymes to selectively remove specific ROS. Adding catalase to a parallel sample will degrade H2O2. If the signal disappears, it confirms the signal was due to H2O2. Similarly, superoxide dismutase (SOD) can be used to rule out interference from O2•−.
Problem 3: Choosing an Inappropriate Assay for the Research Context
Potential Cause: The selected method does not align with the experimental goals regarding sensitivity, spatial resolution, or sample type.
Solution: Select the appropriate tool from the assay comparison table below.
Table 1: Comparison of H2O2 Measurement Methods and Their Handling of Interference
| Method | Principle | Key Advantages | Common Interferences & Limitations | Best for Mitigating Interference |
|---|---|---|---|---|
| Ti(SO4)2 Assay [17] | Forms a yellow complex with H2O2. | Relatively accessible, direct complex formation. | Other peroxides, sample turbidity. | Correlate with another method (e.g., eFOX) for confirmation [17]. |
| eFOX Assay [17] | H2O2 oxidizes Fe²⁺; Fe³⁺ binds xylenol orange. | High sensitivity, adaptable. | Other oxidants, metal chelators. | Correlate with another method (e.g., Ti(SO4)2) for confirmation [17]. |
| Amplex Red [45] | Peroxidase-dependent oxidation to fluorescent resorufin. | Highly sensitive and specific when optimized. | Reductants, O2•− (can inhibit peroxidase). | Add SOD to convert O2•− to H2O2; use pre-oxidation to remove reductants [45] [46]. |
| HyPer7 Biosensor [47] | H2O2 causes disulfide formation, altering GFP fluorescence. | Subcellular resolution, high specificity, rationetric. | Requires genetic transformation, pH-sensitive (though HyPer7 is improved). | The primary choice for specific, compartmentalized H2O2 dynamics in live cells [47]. |
| Dihydroethidium (DHE) | Oxidation to fluorescent products. | Detects O2•−. | Not for H2O2. Non-specific oxidation; requires HPLC for specificity to O2•− [45]. | Use HPLC to separate the specific O2•− product (2-OH-E+) from non-specific products [45]. |
The following workflow outlines a logical decision process for selecting and validating an H2O2 measurement method to minimize interference:
Problem 4: Signal Instability and Low Sensitivity
Potential Causes: Auto-oxidation of the probe, light sensitivity, or the presence of competing enzymatic activities.
Solutions:
- Control for Auto-oxidation: Always include a "no-enzyme" or "no-sample" control to measure the background oxidation rate of the probe (e.g., Amplex Red) itself. Perform assays in the dark or in low-light conditions to prevent photo-oxidation [45].
- Optimize Sample Weight: Research indicates that H2O2 quantification using methods like eFOX and Ti(SO4)2 can be robust across a range of sample weights (e.g., 40-50 mg), but it is crucial to keep the weight consistent across replicates and treatments to avoid dilution or concentration effects [17].
- Include Scavenger Controls: As part of your experimental design, run parallel samples with added catalase. This serves as a critical negative control, confirming that the measured signal is truly derived from H2O2.
The Scientist's Toolkit: Key Research Reagents
Table 2: Essential Reagents for H2O2 Research and Interference Mitigation
| Reagent / Tool | Function / Description | Role in Mitigating Interference |
|---|---|---|
| Catalase | Enzyme that specifically decomposes H2O2 into water and oxygen. | Essential negative control. Its addition should abolish the H2O2-specific signal, confirming assay specificity. |
| Superoxide Dismutase (SOD) | Enzyme that converts superoxide (O2•−) into H2O2 and oxygen. | Used in assays like Amplex Red to convert interfering O2•− into the measurable H2O2, standardizing the signal source and preventing O2•−-mediated assay inhibition [45]. |
| Polyvinylpyrrolidone (PVP) | A polymer used in plant extract preparation. | Binds to phenolic compounds in plant tissues, preventing them from interfering with the assay chemistry [17]. |
| ABTS (2,2'-azino-bis(3-ethylbenzothiazoline-6-sulfonic acid)) | A chromogenic reporter molecule for peroxidase-based assays. | Can be used in a pre-oxidation step to quench endogenous reductants before H2O2 measurement begins [46]. |
| HyPer7 Plasmid [47] | A genetically encoded, rationetric fluorescent biosensor for H2O2. | Provides high specificity for H2O2 over other ROS and allows measurement in specific cellular compartments, avoiding interference from the overall cellular environment. |
| Potassium Phosphate Buffer | A common buffering system for biological extracts. | Maintains a stable pH during extraction, preventing artifactual H2O2 production or degradation that can occur at non-physiological pH levels. |
Experimental Protocol: Pre-oxidation Method for Peroxidase-Based Assays
This protocol is adapted from a method designed to overcome reductant interference in complex biological matrices [46].
Application: Quantifying H2O2 in plant tissue homogenates using horseradish peroxidase (HRP) and a chromogenic reporter like ABTS.
Principle: Endogenous reductants in the sample can reduce the oxidized colored product (ABTS•⁺) back to its colorless form, leading to underestimation of H2O2. This method pre-oxidizes these reductants before the H2O2 measurement reaction.
Materials:
- Plant tissue extract in potassium phosphate buffer (with PVP)
- Hydrogen Peroxide (H2O2) standard solution
- Horseradish Peroxidase (HRP)
- ABTS solution
- Microplates or cuvettes
- Spectrophotometer
Procedure:
- Prepare Samples: Generate a clear plant tissue supernatant by homogenizing tissue in a suitable buffer (e.g., 50 mM potassium phosphate buffer, pH 6.0) containing Polyvinylpyrrolidone (PVP) to absorb phenolics, followed by centrifugation [17].
- Pre-oxidation Step: In a well or cuvette, mix the following:
- A known volume of your plant extract or standard.
- A working concentration of the ABTS reporter.
- Incubate this mixture for a predetermined time (e.g., 15-30 minutes) at room temperature. During this incubation, interfering reductants will react with and reduce ABTS.
- Initiate H2O2 Reaction: After the pre-oxidation period, add Horseradish Peroxidase (HRP) to the mixture to start the H2O2-specific reaction.
- Measure and Quantify: Immediately monitor the development of the colored product (ABTS•⁺) spectrophotometrically at the appropriate wavelength (e.g., 405-420 nm). The rate or endpoint of this reaction, after the pre-oxidation period, is proportional to the genuine H2O2 concentration in the sample.
- Validation: Always run a standard curve of known H2O2 concentrations through the entire pre-oxidation and measurement process to ensure accurate quantification.
Ensuring Sensor Specificity and Addressing Photobleaching in Fluorescent Methods
Core Concepts in Fluorescence Sensing
Fluorescence sensing is a highly sensitive detection method based on the emission changes of a fluorophore when it interacts with a specific target analyte [48]. The process is cyclical: a fluorophore absorbs high-energy photons, elevating its electrons to an excited state; after a finite lifetime, the electrons return to the ground state, emitting lower-energy, longer-wavelength photons [49]. This difference between excitation and emission wavelengths is known as the Stokes shift and is fundamental for isolating the signal from background noise [49].
Mechanisms for Ensuring Specificity
A fluorescent sensor's specificity—its ability to respond to a single target—is achieved through designed molecular interactions. The main mechanisms include:
- Förster Resonance Energy Transfer (FRET): This mechanism requires significant overlap between the absorption spectrum of the analyte (acceptor) and the emission spectrum of the sensor (donor). When this condition is met, energy transfer from the sensor to the analyte occurs, resulting in measurable luminescence quenching of the sensor [48].
- Donor-Acceptor Electron Transfer: This mechanism involves the transfer of a photoexcited electron from the sensor's highest occupied molecular orbital (HOMO) to the lowest unoccupied molecular orbital (LUMO) of the target analyte. This electron transfer quenches the sensor's emission and relies on strong host-guest interactions, typically between an electron-rich donor and an electron-deficient acceptor [48].
- Inner Filter Effect and Absorption Competition Quenching: These are static processes where the analyte's absorption of light reduces the energy available to excite the fluorophore. This can happen if the analyte absorbs the excitation light or the emission light, leading to a decrease in the detected fluorescence signal without changing the fluorophore's excited-state lifetime [48].
Figure 1: This diagram illustrates the logical workflow for achieving sensor specificity through different molecular mechanisms after analyte binding.
Troubleshooting Guide: FAQs
Sensor Specificity
Q1: How can I improve my fluorescent sensor's selectivity for H₂O₂ over other reactive oxygen species? The key is molecular-level design of the recognition element. Choose or synthesize a fluorophore whose chemical structure undergoes a specific, reversible reaction with H₂O₂. This often involves incorporating a functional group that is selectively oxidized by H₂O₂, leading to a predictable change in the fluorescence signal. Testing the sensor against a panel of potential interferents, such as superoxide or nitric oxide, under physiologically relevant conditions is essential for validating selectivity [48] [50].
Q2: What are the primary causes of non-specific signal quenching in my experiments? Non-specific quenching can arise from several factors:
- Collisional Quenching: Dynamic encounters with other molecules in the solution, such as halide ions or oxygen, can deactivate the excited state [49].
- Energy Transfer to Non-Targets: If other components in the sample have absorption spectra overlapping with your sensor's emission, FRET can occur unintentionally [48].
- High Fluorophore Concentration: At high concentrations, fluorophores can quench each other's signal through a mechanism called self-quenching [49].
- Sample Autofluorescence: Endogenous molecules in biological samples can fluoresce, creating a high background that obscures the specific signal [51].
Photobleaching
Q3: What is photobleaching and why is it a problem for quantitative measurements? Photobleaching is the photochemical destruction of a fluorophore, leading to an irreversible loss of fluorescence signal over time under illumination [52] [49]. For quantitative measurements, this fading is problematic because it causes the signal intensity to decay not due to changes in the target analyte concentration, but because of the decreasing number of functional fluorophores. This can skew time-course data and lead to inaccurate conclusions about dynamic biological processes [52].
Q4: What practical steps can I take to minimize photobleaching during live-cell imaging? Implementing the following strategies can significantly extend the useful imaging window:
- Reduce Light Exposure: Use neutral-density filters to lower excitation light intensity and minimize exposure time by only illuminating the sample when acquiring an image [52] [53].
- Use Anti-fade Reagents: For fixed cells, use commercial mounting media containing anti-fade compounds. For live cells, oxygen-scavenging systems (e.g., glucose oxidase/catalase) or antioxidants can be explored, though their compatibility with cell health must be verified [52] [53].
- Choose Stable Fluorophores: Opt for newer, more photostable dyes (e.g., Alexa Fluor, DyLight dyes) over traditional ones like FITC [52] [51].
- Optimize Imaging Protocol: Focus the microscope using transmitted light or on a different field of view to avoid unnecessary light exposure to the area of interest [52].
Quantitative Data and Protocols
Comparison of Fluorescence Microscopy Techniques
The table below summarizes the performance characteristics of various fluorescence microscopy techniques, highlighting the inherent trade-offs between resolution, speed, and photobleaching risk [54].
Table 1: Performance Comparison of Fluorescence Microscopy Techniques
| Technique | XY Resolution | Z Resolution | Temporal Resolution | Imaging Depth | Photobleaching/Phototoxicity Risk |
|---|---|---|---|---|---|
| Wide-field | Diffraction limited (~200 nm) | Weak | Best (milliseconds/frame) | Worst | Lowest (usually μWatts) [54] |
| Laser-Scanning Confocal (LSC) | Diffraction limited | Good (>700 nm) | Typically slow (1 sec/frame) | Better (< 100 μm) | Can be high (μWatts focused to a spot) [54] |
| TIRF | Diffraction limited | Best (but only first 200-300 nm) | Good | < 300 nm | Better (evanescent field limits excitation) [54] |
| Two-Photon (TPFM) | Diffraction limited | Good | Typically slow (1 sec/frame) | Best (hundreds of μm) | Can be high (mWatts power, but limited to focal plane) [54] |
| STED | Super-resolution (<70 nm) | Good | Slowest | Not Specified | Worst (second depletion beam with mWatts of power) [54] |
Experimental Protocol: Creating a Photobleach Curve for Signal Normalization
For quantitative experiments where photobleaching is unavoidable, creating a photobleach curve allows you to correct your data for signal loss over time [52].
Objective: To characterize the rate of fluorescence signal decay under constant illumination for normalization purposes.
Materials:
- Your fluorescent sensor or stained sample
- Fluorescence microscope with a stable light source and a camera
- Image acquisition software capable of quantifying intensity over time
Method:
- Prepare Control Sample: Use a sample with a constant concentration of the fluorophore that will not be perturbed during the experiment (e.g., a fixed slide).
- Set Acquisition Parameters: Define a time-lapse protocol with constant exposure time, light intensity, and time intervals between acquisitions. Use the same settings you plan to use in your actual experiment.
- Acquire Time-Series Data: Expose the sample to continuous illumination and acquire images at regular intervals over a total duration that matches or exceeds your planned experimental timeline.
- Measure Intensity: Using the analysis software, measure the average fluorescence intensity within a consistent Region of Interest (ROI) in each frame of the time-lapse series.
- Plot and Fit the Curve: Plot the measured intensity versus time. Fit an exponential decay curve (e.g., ( I(t) = I0 e^{-t/τ} )) to the data points, where ( I0 ) is the initial intensity and ( τ ) is the decay time constant.
Data Analysis: During your actual experiment, the photobleach curve serves as a calibration. You can normalize your experimental intensity measurements (( I{exp} )) at time ( t ) using the formula: ( I{corrected} = I{exp} / (I0 e^{-t/τ}) ). This corrects the signal for losses due to photobleaching, revealing intensity changes due to the analyte alone.
The Researcher's Toolkit: Essential Reagents and Materials
Table 2: Key Research Reagent Solutions for Fluorescence Sensing
| Item | Function/Description | Example Use-Case |
|---|---|---|
| Photostable Fluorophores | Synthetic dyes engineered for high fluorescence quantum yield and resistance to photobleaching. | Alexa Fluor or DyLight dyes for long-term live-cell imaging [52] [51]. |
| Anti-fade Mounting Media | Reagents that contain antioxidants or oxygen scavengers to slow fluorophore degradation. | Prolong or Vectashield for preserving fluorescence in fixed samples [52] [53]. |
| Oxygen Scavenging Systems | Enzyme-based systems (e.g., Glucose Oxidase/Catalase) that deplete oxygen to reduce photobleaching. | Extending fluorescence longevity in anaerobic or compatible biological samples [53]. |
| Hydrogel Microneedle (MN) Patch | A device for rapid extraction of sap from plant tissues with minimal damage. | In-field extraction of plant interstitial fluid for H₂O₂ sensing [50]. |
| Neutral-Density (ND) Filters | Optical filters that uniformly reduce the intensity of excitation light. | Mitigating photobleaching and phototoxicity without altering microscope settings [52]. |
Figure 2: This diagram outlines a strategic approach to addressing photobleaching, connecting high-level strategies to specific, actionable experimental steps.
Application in In Planta H₂O₂ Monitoring
Advanced Calibration for H₂O₂ Sensors
In the context of in planta H₂O₂ research, regular calibration of sensing systems is critical for data accuracy and reliability. For commercial gas-phase H₂O₂ sensors used in process validation, professional calibration services are recommended [55] [56]. These services use controlled laboratory conditions to generate defined H₂O₂ concentrations for accurate adjustment, a process superior to surrogate calibration [55]. The calibration includes functional testing, sensor adjustment, replacement of consumables like filters, and the provision of a certificate documenting "as-found" and "as-left" results [56]. For novel in-plant sensing platforms, such as hydrogel microneedle patches, establishing a robust and rapid calibration method is a fundamental part of method development to enable precise, in-field quantification of H₂O₂ [50].
Troubleshooting Guides and FAQs
Common Experimental Issues and Solutions
FAQ: My roGFP2 sensor shows a poor signal-to-noise ratio. What could be the cause? A poor signal often stems from sensor expression levels or improper imaging settings. Ensure your transgenic lines have strong, stable expression. During imaging, use the correct excitation wavelengths (405 nm and 488 nm) and ensure your microscope is properly calibrated. Avoid sample movement and allow the sensor to reach a stable state before recording measurements [31].
FAQ: How can I distinguish between a true change in H₂O₂ levels and a change in the cellular reduction capacity? This is a critical challenge when using reducible sensors like roGFP2-Orp1. The redox state of roGFP2-Orp1 is influenced by both the rate of H₂O₂-dependent oxidation and the rate of reduction by glutaredoxin/thioredoxin systems. To interpret your data correctly, you must perform parallel control experiments:
- Use Grx1-roGFP2: This sensor reports specifically on the glutathione redox potential (E_GSH), giving you an independent measure of the cellular reduction capacity.
- Apply Chemical Treatments: Use exogenous H₂O₂ and DTT treatments on your samples to define the fully oxidized (Rₘᵢₙ) and fully reduced (Rₘₐₓ) ratio limits for your specific experimental setup. This in vivo calibration is essential for accurate interpretation [31].
FAQ: I am observing inconsistent redox potentials in my differentiated tissues. Is this normal? Yes, this is not only normal but expected. Research in Marchantia polymorpha has demonstrated that a glutathione redox gradient is a key feature of proper development. The meristematic region typically exhibits a more reduced glutathione state (more negative E_GSH), while differentiated tissues become more oxidized. The maintenance of this gradient, rather than absolute values, is crucial for proper growth and development [57].
FAQ: What are the best practices for storing plant samples for H₂O₂ quantification? For destructive biochemical methods like the eFOX or Ti(SO4)₂ assays, the handling of samples significantly impacts results. A 2023 study found that while H₂O₂ concentrations can decrease during frozen storage, a strong correlation exists between measurements from nonfrozen and frozen samples. For the most accurate absolute quantification, analyze samples immediately as nonfrozen. If storage is necessary, flash-freeze in liquid nitrogen and store at -80°C, but be consistent with your method across all samples in an experiment and note that values might be lower than in fresh tissue [17].
Troubleshooting Table: roGFP Sensor Issues
| Problem | Potential Cause | Solution |
|---|---|---|
| No fluorescence signal | Low sensor expression, incorrect filter sets, photobleaching. | Check transgenic lines, verify microscope settings, reduce exposure time [31]. |
| Erratic ratio values | Sample movement, unstable environmental conditions during imaging. | Secure sample properly, conduct imaging in a temperature-stable environment. |
| Incomplete oxidation or reduction | Chemical treatments are not penetrating tissue effectively. | Optimize concentration and duration of H₂O₂/DTT treatments; consider using surfactants for improved penetration [31]. |
| Unexpected oxidation in meristems | Potential biological response to stress or altered development. | Confirm plant health; note that a small oxidized zone in the center of the meristem can be a normal feature in some species [57]. |
Experimental Protocols for Validation and Calibration
Protocol: In Vivo Calibration of roGFP Sensors
This protocol is essential for converting the raw 405/488 nm excitation ratio into a meaningful, quantitative value of oxidation [31].
Key Reagents:
- Hydrogen Peroxide (H₂O₂), 1 M stock solution
- Dithiothreitol (DTT), 1 M stock solution
- Potassium Phosphate Buffer, pH 6.0, 50 mM
Methodology:
- Sample Preparation: Select healthy transgenic plant tissue (e.g., a leaf or gemma) expressing the roGFP sensor and mount it for live imaging under the microscope.
- Baseline Measurement: Capture the baseline fluorescence ratio (Rˢᵃᵐᵖˡᵉ) by imaging with 405 nm and 488 nm excitation.
- Full Oxidation: Gently apply a solution of 10-20 mM H₂O₂ (diluted from stock in buffer) to the tissue. Incubate until the fluorescence ratio stabilizes at its maximum value. Record this ratio as Rₘₐₓ.
- Wash: Gently rinse the tissue with buffer to remove the H₂O₂.
- Full Reduction: Apply a solution of 10-20 mM DTT (diluted from stock in buffer) to the tissue. Incubate until the fluorescence ratio stabilizes at its minimum value. Record this ratio as Rₘᵢₙ.
- Calculation: Calculate the degree of sensor oxidation (OxD) using the formula: OxD = (Rˢᵃᵐᵖˡᵉ - Rₘᵢₙ) / (Rₘₐₓ - Rₘᵢₙ)
Protocol: Validating H₂O₂ Specificity with the eFOX Assay
This biochemical assay can be used to independently validate H₂O₂ levels measured with genetically encoded sensors [17].
Key Reagents:
- Ferrous Ammonium Sulfate ((NH₄)₂Fe(SO₄)₂·6H₂O)
- Xylenol Orange
- Sorbitol
- Sulfuric Acid (H₂SO₄)
- Potassium Phosphate Buffer (pH 6.0, 50 mM)
Methodology:
- Tissue Extraction: Grind approximately 50 mg of plant leaf tissue in liquid nitrogen.
- Homogenization: Add 5 mL of ice-cold Potassium Phosphate Buffer (with a small amount of polyvinylpyrrolidone to absorb phenolics) to the powder.
- Centrifugation: Centrifuge the homogenate at 5500 rpm for 10 minutes. Collect the supernatant.
- Reaction Setup:
- Prepare the eFOX reagent: 100 µM Ferrous Ammonium Sulfate, 250 µM Xylenol Orange, 25 mM H₂SO₄, and 100 mM sorbitol.
- Mix 100 µL of the plant extract supernatant with 900 µL of the eFOX reagent.
- Incubate the mixture in the dark for 30-60 minutes.
- Measurement: Measure the absorbance of the solution at 560 nm. The ferrous-oxygen-xylenol orange complex formed is proportional to the H₂O₂ concentration.
- Quantification: Determine the H₂O₂ concentration by comparing the absorbance against a standard curve prepared with known concentrations of H₂O₂.
The Scientist's Toolkit: Essential Research Reagents
Table: Key Reagents for In Planta Redox and H₂O₂ Sensor Validation
| Reagent | Function / Purpose | Key Details / Considerations |
|---|---|---|
| roGFP2-hGrx1 / Grx1-roGFP2 | Genetically encoded sensor for glutathione redox potential (EGSH). | Ratios reflect the GSSG/2GSH equilibrium; requires in vivo calibration with H₂O₂/DTT [57] [31]. |
| roGFP2-Orp1 | Genetically encoded sensor for H₂O₂. | Specific oxidation by H₂O₂ via Orp1; its state is also influenced by cellular reduction systems [31]. |
| HyPer7 | Improved genetically encoded H₂O₂ biosensor. | Offers higher dynamic range and pH stability compared to earlier versions; used for high-resolution mapping of H₂O₂ [57]. |
| Hydrogen Peroxide (H₂O₂) | Chemical oxidant for in vivo sensor calibration and stress induction. | Used to define the Rₘₐₓ of roGFP sensors and to experimentally elevate cellular H₂O₂ levels [31]. |
| Dithiothreitol (DTT) | Reducing agent for in vivo sensor calibration. | Used to define the Rₘᵢₙ of roGFP sensors by fully reducing the disulfide bond [31]. |
| eFOX Assay Reagents | Spectrophotometric quantification of H₂O₂ concentration from tissue extracts. | A sensitive and stable method for independent, biochemical validation of H₂O₂ levels; correlates well with other methods like Ti(SO₄)₂ assay [17]. |
Visualization of Workflows and Signaling Pathways
Sensor Calibration and Validation Workflow
Redox Signaling in Plant Meristem Development
Relationship Between Key Redox Couples
Benchmarking Performance: A Comparative Analysis of H2O2 Monitoring Methods
Troubleshooting Guides
Troubleshooting Common Cross-Validation Issues
Issue 1: Discrepant results between spectrophotometric and fluorescent assay readings
| Possible Cause | Solution | Preventive Measure |
|---|---|---|
| Photometric Linearity Error [24] | Verify instrument's photometric linearity using calibrated neutral density filters. | Perform regular instrument calibration. |
| Stray Light Interference [24] | Use solutions with sharp cutoff filters (e.g., potassium dichromate) to measure stray light at critical wavelengths. | Ensure monochromator is clean and aligned; use double-monochromators for low stray light. |
| Incorrect Wavelength Calibration [24] | Check wavelength accuracy using holmium oxide solution or glass filters with known absorption peaks. | Establish a routine wavelength verification schedule. |
| Fluorescent Assay Interference [58] | Dilute the sample in a compatible buffer or use protein precipitation to remove interfering substances. | Test sample buffer compatibility with the assay beforehand. |
Issue 2: High variance in replicate measurements across both assay types
| Possible Cause | Solution | Preventive Measure |
|---|---|---|
| Unstable Light Source | Allow the spectrophotometer lamp to warm up for the recommended time before use. | Follow manufacturer's guidelines for lamp replacement and instrument maintenance. |
| Pipetting Inaccuracies [58] | Use reverse-pipetting techniques for viscous fluids and ensure pipettes are regularly calibrated. | Pipette at least 5 µL volumes when possible for better accuracy [58]. |
| Fluorescent Dye Instability [58] | Prepare fresh working reagents and ensure dye is stored protected from light at the correct temperature. | Aliquot reagents to avoid repeated freeze-thaw cycles. |
Issue 3: Fluorescent assay shows low signal intensity or "Standards Incorrect" error
| Possible Cause | Solution | Preventive Measure |
|---|---|---|
| Expired or Improperly Stored Kit [58] | Replace the assay kit with a new, in-date one. Store components as instructed (often 4°C or -20°C, protected from light). | Upon receipt, immediately store reagents according to the manufacturer's data sheet. |
| Incompatible Sample Buffer [58] | Dialyze or desalt the sample into a compatible buffer. Check for interfering substances like detergents or reducing agents. | Use the assay's standard test tube protocol to test buffer compatibility before running critical samples. |
| Contaminated Buffer [58] | Replace the buffer and all working solutions. | Use high-purity water and reagents to prepare buffers. |
Frequently Asked Questions (FAQs)
Q1: What are the primary advantages of using fluorescent roGFP2-based sensors over traditional spectrophotometric assays for in planta H₂O₂ measurement?
A1: The key advantage is the ability to perform noninvasive, live measurements in specific tissues or cells of mature plants, such as Arabidopsis thaliana, providing high-resolution spatial and temporal data on hydrogen peroxide and glutathione redox potential dynamics. In contrast, traditional spectrophotometric methods often require tissue homogenization, which destroys cellular context and provides only an average concentration for the entire sample [32].
Q2: Our lab's spectrophotometer was calibrated with a holmium oxide filter and shows accurate wavelength. Why do we still see inconsistent absorbance readings?
A2: Wavelength accuracy is just one parameter. You may be experiencing photometric non-linearity or stray light [24]. Test for photometric linearity using a series of calibrated neutral density filters across the absorbance range you use. Stray light, especially at higher absorbance values, can cause significant errors and should be quantified using appropriate cutoff filters.
Q3: When performing a protein assay with a fluorescent readout, what are the critical steps to minimize pipetting-related error?
A3: For fluorescent assays, which are often highly sensitive, follow these steps:
- Use reverse-pipetting for viscous liquids or detergent-containing solutions to prevent bubble formation [58].
- Avoid very low volumes (1-2 µL); if possible, pipette at least 5 µL for more consistent results [58].
- Spin down tubes in a centrifuge before reading to remove bubbles or particulates that can scatter light [58].
Q4: How can we confirm that an interfering substance in our plant sample is affecting the fluorescent assay result?
A4: A reliable method is a spike-and-recovery test. Prepare duplicate sets of calibration standards. Into one set, spike an equivalent amount of your sample buffer (without the protein). Run both sets as samples. If the measured values for the spiked standards deviate by more than 10% from the pure standards, the buffer components are likely interfering [58].
Research Reagent Solutions
Essential materials for cross-validating H₂O₂ assays in plant research.
| Reagent/Kit | Function & Application |
|---|---|
| roGFP2-Orp1 & Grx1-roGFP2 Sensors [32] | Genetically encoded fluorescent sensors for noninvasive, live imaging of H₂O₂ and glutathione redox potential in Arabidopsis thaliana. |
| Holmium Oxide (Ho₂O₃) Solution/Filter [24] | Wavelength calibration standard for spectrophotometers, providing sharp absorption peaks at known wavelengths. |
| Potassium Dichromate Solution [24] | A chemical standard used for checking photometric accuracy and stray light in spectrophotometers. |
| Neutral Density Filters [24] | Calibrated filters for verifying the photometric linearity of a spectrophotometer across a range of absorbance values. |
| Qubit Protein Assay Kit [58] | A fluorescent dye-based assay for highly specific protein quantitation, less susceptible to interference from non-protein compounds. |
| Pierce Bradford Protein Assay [58] | A colorimetric (spectrophotometric) protein assay method based on Coomassie dye binding; sensitive to detergents. |
Experimental Workflow Visualization
Cross-Validation Experimental Workflow
Analyzing Sensitivity, Specificity, and Dynamic Range Across Platforms
A technical guide for resolving key experimental challenges in plant science research
This technical support center provides targeted guidance for researchers working on the calibration of sensors for in planta hydrogen peroxide (H2O2) monitoring. The content is structured to help you troubleshoot common experimental challenges and optimize your measurement systems for greater accuracy and reliability.
Troubleshooting Guides
Troubleshooting Dynamic Range Issues in H2O2 Sensing
Problem: Measurements of H2O2 concentration in plant tissues are inaccurate. The sensor either fails to detect low concentrations or saturates at high concentrations, providing no meaningful data during critical oxidative stress events. [8] [59]
Background The dynamic range is the concentration range over which your sensor provides accurate and linear measurements. If the H2O2 concentration in your plant samples falls outside this range, your data will be unreliable. [59]
- Lower Limit: The lowest concentration the sensor can detect, where the signal distinguishes itself from background noise. [59]
- Upper Limit: The highest concentration the sensor can measure before the signal no longer increases (saturation). [59]
Investigation Steps
- Define Your Expected Range: Review literature for your plant species and stress conditions to estimate the H2O2 concentrations you might encounter. For example, studies using riparian plants have reported concentrations measurable with assays like eFOX and Ti(SO4)2. [17]
- Calibrate Your System: Establish a standard curve using known concentrations of H2O2. Ensure your standards cover a range that extends below and above the concentrations you expect to find in your samples. [59] [60]
- Analyze the Calibration Curve: Plot the data and determine the linear range. The dynamic range is the concentration interval where this relationship is linear and accurate. [59] [60]
Solutions
If Concentration is Too High (Signal Saturation)
- Dilute the Sample: A simple sample dilution can bring the concentration back within the measurable range. Ensure the dilution buffer is appropriate for your assay. [59] [17]
- Switch the Sensor: Use a sensor with a higher saturation point or an assay known for a wider dynamic range if your plant species consistently produces high H2O2 under stress. [59]
If Concentration is Too Low (Signal Undetectable)
- Sample Concentration: Techniques like lyophilization (freeze-drying) and reconstitution in a smaller volume can increase the concentration of your analyte. [17]
- Increase Sample Size: Using a larger mass of plant tissue for extraction can help, provided it does not introduce new interferents. [17]
- Use a More Sensitive Assay: Explore different detection methods. For instance, the modified ferrous oxidation xylenol orange (eFOX) assay has been shown to detect lower fluctuations in H2O2 than the titanium sulfate (Ti(SO4)2) assay. [17]
Optimizing Assay Specificity for In Planta H2O2 Measurement
Problem: The measurement system produces false positive results for H2O2, likely due to interference from other redox-active compounds present in complex plant tissue extracts. [17]
Background Specificity refers to the ability of an assay to detect only the target analyte (H2O2) and not respond to other substances. Plant tissues are rich in compounds like phenolics, ascorbic acid, and pigments that can interfere with many chemical assays. [59] [17]
Investigation Steps
- Identify Potential Interferents: Consider the composition of your plant extract. Common interferents include anthocyanins, tannins, and other antioxidants. [17]
- Perform a Spike-Recovery Test: Add a known amount of H2O2 standard to your plant sample extract and measure the recovery. A recovery significantly different from 100% indicates interference. [17]
- Run a Negative Control: Perform the assay on a sample where H2O2 has been quenched (e.g., by adding catalase). Any remaining signal indicates non-specific detection. [17]
Solutions
- Refine Sample Preparation:
- Add Polyvinylpyrrolidone (PVP): Including PVP in your extraction buffer is a common and effective method to bind and remove phenolic compounds from plant extracts. [17]
- Use Clean-up Columns: Solid-phase extraction columns can help purify the sample before analysis.
- Validate with a Second Method: Correlate your results with a different analytical technique. For example, if using a colorimetric assay like Ti(SO4)2, validate your findings with another method like the eFOX assay, as a strong correlation between methods increases confidence in specificity. [17]
- Choose a Different Assay: If interference persists, consider switching to a more specific method. Enzymatic assays or implantable microsensors designed for in vivo use may offer higher specificity in complex matrices. [8] [17]
Addressing Signal Instability in Implantable H2O2 Sensors
Problem: An implantable H2O2 sensor provides stable power and continuous monitoring of H2O2 in living plants, but the signal drifts over time, compromising data integrity. [8]
Background Long-term implantation in a plant involves a challenging environment that can cause sensor drift due to factors like biofouling, passivation of the electrode surface, or changes in the local microenvironment at the implantation site.
Investigation Steps
- Check Power Stability: For self-powered systems, verify that the integrated photovoltaic module is consistently providing adequate power under the growth environment's light conditions. [8]
- Inspect Calibration Status: Sensor sensitivity can change over time. Regular calibration is essential to ensure continuous measurement accuracy. [56]
- Review Implantation Technique: Physical damage to the plant tissue during sensor insertion can trigger a localized H2O2 burst, creating an abnormal initial signal.
Solutions
- Implement Regular Calibration:
- Follow Manufacturer Guidelines: Services like the Dräger H2O2 Calibration Service or Vaisala's standard calibration use target gas in controlled laboratories to provide accurate adjustments and certificates, which is superior to surrogate methods. [55] [56]
- Establish a Schedule: Perform regular calibration checks based on the sensor's stability and the demands of your application. [56]
- Protect the Sensor: Research and apply biocompatible coatings that can minimize biofouling and protect the sensor surface from passivation without inhibiting H2O2 diffusion.
- Optimize Implantation: Standardize the implantation protocol to minimize tissue damage, including using the smallest possible sensor and sharp, sterile tools.
Frequently Asked Questions
1. How do I determine the dynamic range of my H2O2 standard curve? The dynamic range is determined by analyzing the standard curve. Prepare a series of standard solutions across a wide concentration range and measure the analytical signal (e.g., absorbance, voltage). The dynamic range is the concentration interval where the curve is linear and the signal-to-noise ratio is acceptable. The lower limit is the limit of detection, and the upper limit is the point where the curve deviates from linearity due to sensor saturation. [59] [60]
2. What can I do if my analyte concentration falls outside the dynamic range of my assay? You have two main options:
- Modify the Sample: Dilute the sample if the concentration is too high, or concentrate it if the concentration is too low. [59]
- Choose a Different Assay: Select an assay or sensor whose validated dynamic range encompasses the expected concentrations in your plant samples. You may need a more sensitive method for low concentrations or one with a higher saturation point. [59]
3. My research requires continuous monitoring of H2O2 in living plants. What are my options? Recent advances include implantable and self-powered sensing systems. These systems typically integrate a microsensor with a miniature photovoltaic module, which uses ambient light from the growth environment for power. This allows for real-time, in vivo monitoring of H2O2 dynamics, resolving time and concentration-specific responses to abiotic stress. [8]
4. How does sample handling affect H2O2 quantification in plant leaves? Sample handling is critical. Studies show that H2O2 concentrations can degrade over time, even in frozen storage. For the most accurate results, analyze nonfrozen samples soon after collection. If freezing is necessary (e.g., at -80°C), be aware that a significant decrease in H2O2 can occur, and ensure all samples in a comparative study are handled identically. The eFOX assay has shown a strong correlation between nonfrozen and frozen samples, making it a robust choice for studies where immediate analysis is not possible. [17]
5. What is the difference between direct and indirect calibration methods?
- Direct Calibration: Involves measuring the parameter of interest (e.g., the geometry of an indenter) using a traceable instrument like an atomic force microscope (AFM). It is highly accurate but can be complex and time-consuming. [61]
- Indirect Calibration: Relies on the statistical analysis of data collected from testing one or more reference materials with known properties. It is more practical and faster but may introduce larger measurement uncertainties. Many standards, such as those for nanoindentation, describe indirect methods for routine use. [61]
Experimental Data & Protocols
Quantitative Comparison of H2O2 Assay Performance
The following table summarizes key characteristics of two common spectrophotometric assays used for H2O2 quantification in plant tissues, based on a correlation study using riparian plant species. [17]
Table 1: Comparison of eFOX and Ti(SO4)2 Assays for Plant H2O2 Measurement
| Feature | Modified Ferrous Oxidation Xylenol Orange (eFOX) Assay | Titanium Sulfate (Ti(SO4)2) Assay |
|---|---|---|
| Basic Principle | Measures ferric ions produced by H2O2 oxidation of ferrous ions, complexed with xylenol orange. [17] | Forms a colored complex directly with H2O2. [17] |
| Reported Sensitivity | Can measure lower fluctuations in H2O2 concentration. [17] | Less sensitive to low concentration fluctuations compared to eFOX. [17] |
| Correlation between Assays | Substantial correlation observed for nonfrozen samples across multiple species (r = 0.583 to 0.828, p < 0.001). [17] | Substantial correlation observed for nonfrozen samples across multiple species (r = 0.583 to 0.828, p < 0.001). [17] |
| Sample State | Strong correlation between nonfrozen and frozen samples (r = 0.879, p < 0.001). [17] | Strong correlation between nonfrozen and frozen samples (r = 0.837, p < 0.001). [17] |
| Key Advantage | High sensitivity, stability, and adaptability to high-throughput techniques. [17] | A well-established and accessible method. [17] |
Protocol: H2O2 Extraction from Plant Leaves for Spectrophotometric Assay
This protocol is adapted from a study comparing eFOX and Ti(SO4)2 assays. [17]
Materials Needed:
- Fresh plant leaf tissue
- Liquid nitrogen
- Mortar and pestle or bead mill (e.g., Shake Master)
- Centrifuge tubes (15 mL)
- Combination beads (3 mm and 10 mm)
- Refrigerated centrifuge
- Potassium phosphate buffer (pH 6.0, 50 mM)
- Polyvinylpyrrolidone (PVP)
Procedure:
- Weighing: Weigh approximately 40-50 mg of plant leaf tissue.
- Grinding: Place the tissue in a 15 mL centrifuge tube with beads. Flash-freeze with liquid nitrogen and grind to a fine powder using the bead mill.
- Extraction: Add 5 mL of ice-cold potassium phosphate buffer and a small amount of PVP to the powdered tissue.
- Clarification: Centrifuge the mixture at 5500 rpm for 10 minutes. Carefully collect the supernatant.
- Second Centrifugation: Centrifuge the supernatant again at 5500 rpm for 10 minutes to ensure it is clear. The resulting supernatant is the extract for H2O2 analysis.
- Assay: Use this extract immediately in your chosen H2O2 assay (e.g., eFOX or Ti(SO4)2).
Protocol: Establishing a Calibration Curve for H2O2
This general protocol is fundamental for quantifying H2O2 in any sample. [60]
Materials Needed:
- H2O2 standard solution of known concentration
- Spectrophotometer or other analytical instrument
- Assay reagents (e.g., for eFOX or Ti(SO4)2 assay)
Procedure:
- Prepare Standard Solutions: Create a series of standard solutions that cover a range of concentrations below and above the expected concentration in your unknown samples.
- Measure Analytical Signal: Analyze each standard solution using your chosen technique and record the analytical signal (e.g., absorbance).
- Plot and Fit the Curve: Plot the instrument response (y-axis) against the standard concentration (x-axis). Use linear regression analysis to fit a straight line to the data points that show a linear relationship. The equation will be in the form y = mx + b, where m is the slope and b is the y-intercept. [60]
- Calculate Unknowns: Measure the signal of your unknown sample and use the calibration curve equation to calculate its concentration.
The Scientist's Toolkit
Table 2: Essential Reagents and Materials for H2O2 Research in Plants
| Item | Function in the Experiment |
|---|---|
| Potassium Phosphate Buffer | Provides a stable pH environment during plant tissue extraction, preserving the integrity of H2O2. [17] |
| Polyvinylpyrrolidone (PVP) | Added during extraction to bind and remove phenolic compounds from plant tissues, reducing interference in the assay. [17] |
| Hydrogen Peroxide Standard | A solution of known concentration used to create the calibration curve, which is essential for quantifying H2O2 in unknown samples. [60] |
| Certified Reference Materials (CRMs) | Samples with certified properties used in indirect calibration methods to ensure the traceability and accuracy of measurements. [61] |
| Photovoltaic (PV) Module | Integrated into implantable sensing systems to harvest light energy from the plant's environment, enabling self-powered, continuous operation. [8] |
Workflow Visualization
H2O2 Measurement Workflow
Calibration Methods Overview
Technical Support Center
Troubleshooting Guides and FAQs
This guide addresses common experimental challenges in calibrating and executing methods for in planta H₂O₂ monitoring, helping you choose the right technique and ensure data reliability.
FAQ 1: How do I choose between a destructive and a non-invasive technique for my H₂O₂ monitoring experiment?
Answer: The choice depends on your experimental priorities: whether you need to preserve sample integrity for longitudinal studies or require absolute quantification from homogenized tissue.
The table below compares the core characteristics of each approach:
| Feature | Destructive Techniques | Non-Invasive Techniques |
|---|---|---|
| Sample Integrity | Sample is destroyed and cannot be reused [62]. | Sample remains intact and can be monitored over time [62]. |
| Primary Application | Provides data on material properties and failure points; used for research, material characterization, and failure analysis [62]. | Used for in-service inspection, quality control, and preventive maintenance without damaging the component [62]. |
| Cost & Resources | Often more costly due to the need for a continuous supply of fresh samples and their subsequent replacement [62]. | Generally more cost-effective as it avoids sample destruction [62]. |
| Temporal Data | Provides a single time-point measurement (e.g., from a harvested leaf) [17]. | Enables continuous, live monitoring of dynamic processes (e.g., stress response) [63]. |
| Data Type | Typically offers absolute quantification of H₂O₂ concentration (e.g., in μmol/gFW) [17]. | Often provides relative or qualitative data on H₂O₂ presence and localization [64]. |
| Spatial Resolution | Lacks cellular spatial context as tissue is homogenized [17]. | Can achieve high-resolution localization of H₂O₂ within specific cells or tissues [63] [64]. |
FAQ 2: My H₂O₂ measurements are inconsistent between replicates. What could be the cause?
Answer: Inconsistent results often stem from issues in sample handling, calibration, or protocol adherence. Here is a troubleshooting guide:
| Problem | Possible Causes | Solutions |
|---|---|---|
| Drift in Readings | Sensor aging, membrane fouling, or temperature fluctuations [65]. | Regularly clean the sensor; replace aged sensors (typical lifespan 2-3 years); ensure proper temperature compensation [65] [66]. |
| Calibration Failure | Expired calibration solutions, improperly prepared solutions, or debris on the sensing surface [65]. | Use fresh, in-date calibration solutions; prepare solutions precisely per manufacturer instructions; clean sensor thoroughly before calibration [65]. |
| Low Spatial Resolution in Imaging | Use of an inappropriate microscope objective or imaging modality for the sample thickness [63]. | For thick plant samples (e.g., leaves), use confocal microscopy instead of widefield to reject out-of-focus light and create clean optical sections [63]. |
| Inaccurate Sample Quantification | Improper sample preservation leading to H₂O₂ degradation [17]. | For destructive assays, analyze samples immediately (nonfrozen) or use consistent, ultra-cold (-80°C) storage for frozen samples, noting that concentration may decrease over time [17]. |
FAQ 3: How does the resolution of my imaging system affect the analysis of H₂O₂ localization?
Answer: Spatial and temporal resolution are critical and often competing factors that directly impact the reliability of your quantitative data [67].
- Spatial Resolution is the ability to distinguish two close objects as separate. Low spatial resolution can obscure fine details, preventing accurate localization of H₂O₂ signals to specific cellular compartments [68] [63].
- Temporal Resolution is the ability to resolve events over time. Low temporal resolution (slow frame rate) may cause you to miss rapid, transient bursts of H₂O₂, which are common in signaling [67].
The workflow below outlines the key decision points for optimizing your experimental setup for reliable resolution:
Experimental Protocols for Key H₂O₂ Monitoring Techniques
Protocol 1: Destructive Spectrophotometric Quantification (eFOX and Ti(SO₄)₂ Assays)
This protocol is adapted for the precise, absolute quantification of H₂O₂ from harvested leaf tissue [17].
- Key Reagents: Potassium phosphate buffer (pH 6, 50 mM), Polyvinylpyrrolidone (PVP), liquid nitrogen.
- Sample Preparation:
- Weigh approximately 40-50 mg of leaf tissue.
- Flash-freeze the sample with liquid nitrogen and grind it to a fine powder using a bead homogenizer.
- Add 5 mL of cold potassium phosphate buffer and a small amount of PVP (to bind phenolic compounds).
- Centrifuge the mixture at 5,500 rpm for 10 minutes. Repeat centrifugation if necessary.
- Collect the supernatant for immediate analysis or store at -80°C (noting potential concentration degradation over time) [17].
- Analysis: Follow specific methodologies for the eFOX or Ti(SO₄)₂ assay. The eFOX assay is reported to have higher sensitivity for detecting lower fluctuations in H₂O₂ [17]. A strong correlation exists between the two methods, validating either for rapid oxidative stress quantification [17].
Protocol 2: Non-Invasive In Situ Detection and Quantification (DAB Staining)
This protocol allows for the spatial visualization and relative quantification of H₂O₂ in intact plant leaves [64].
- Key Reagents: 3,3'-Diaminobenzidine (DAB) solution (1 mg/mL), H₂O₂ standard solutions for calibration.
- Step-by-Step Workflow:
- Infiltrate the leaf tissue with DAB solution using a needless syringe.
- Incubate the stained leaves in the dark for several hours. A brown precipitate will form in the presence of H₂O₂.
- Destain by placing leaves in boiling ethanol (96%) to remove chlorophyll.
- Digitalize the leaves using a flatbed scanner or microscope.
- Calibrate by creating a standard curve with filter disks impregnated with known H₂O₂ concentrations treated with DAB [64].
- Analyze the digital images using software like Fiji/ImageJ. Use the "Color Deconvolution" tool to separate the DAB stain and relate the stain intensity to H₂O₂ concentration using your calibration curve [64].
The Scientist's Toolkit: Key Research Reagent Solutions
The following table details essential materials for the featured H₂O₂ monitoring experiments.
| Item | Function / Application |
|---|---|
| Potassium Phosphate Buffer | Provides a stable pH environment for extracting and preserving H₂O₂ from homogenized plant tissue in destructive assays [17]. |
| Polyvinylpyrrolidone (PVP) | Added during tissue homogenization to bind and remove phenolic compounds that can interfere with the spectrophotometric quantification [17]. |
| 3,3'-Diaminobenzidine (DAB) | A chromogenic substrate that reacts with H₂O₂ in the presence of peroxidases to produce a brown polymer, allowing for in situ histochemical staining [64]. |
| Calibration Gas/Solutions | Certified standard solutions with known concentrations of H₂O₂ are essential for calibrating both sensors (e.g., dissolved oxygen probes) and chemical assays (e.g., DAB staining) to ensure accurate quantification [65] [64]. |
| Sensor Membranes | A critical component of electrochemical sensors (e.g., dissolved oxygen sensors). They are prone to fouling and aging and require regular cleaning and replacement every 2-3 years [65] [66]. |
Navigating Regulatory and Industry Standards for Method Validation
FAQs: Method Validation in Regulatory Context
What is method validation and why is it required?
Method validation is the documented process of ensuring a pharmaceutical test method is suitable for its intended use. This is achieved by performing a series of experiments on the procedure, materials, and equipment that comprise the method being validated [69]. It is a critical regulatory requirement for entities testing biological samples and pharmaceutical products for drug exploration, development, and manufacture [69]. The process provides documented evidence that a test method is selective, accurate, precise, and linear over a stated range, ensuring the scientific validity of results produced during routine sample analysis [69] [70]. This is an essential part of Good Manufacturing Practice (GMP) and is necessary to support the identity, strength, quality, purity, and potency of drug substances and drug products [70].
Which guidelines govern analytical method validation?
The International Council for Harmonisation (ICH) provides the harmonized framework that is the global gold standard, primarily through ICH Q2(R2): Validation of Analytical Procedures [71]. The U.S. Food and Drug Administration (FDA), as a key member of ICH, adopts and implements these guidelines [71]. For bioanalytical methods, the FDA has also issued specific guidance, such as the "Bioanalytical Method Validation for Biomarkers – Guidance for Industry" [72]. Following the latest ICH guidelines is the key to meeting FDA requirements for most new drug submissions [71].
What are the core validation parameters required by ICH Q2(R2)?
ICH Q2(R2) outlines a set of fundamental performance characteristics that must be evaluated to demonstrate a method is fit for purpose [71]. The core parameters are summarized in the table below.
Table 1: Core Validation Parameters per ICH Q2(R2) [71] [70]
| Parameter | Definition |
|---|---|
| Accuracy | The closeness of test results to the true value. |
| Precision | The degree of agreement among individual test results from repeated samplings. Includes repeatability, intermediate precision, and reproducibility. |
| Specificity | The ability to assess the analyte unequivocally in the presence of other components like impurities or matrix components. |
| Linearity | The ability of the method to obtain test results directly proportional to the analyte concentration. |
| Range | The interval between upper and lower analyte concentrations for which linearity, accuracy, and precision are demonstrated. |
| Limit of Detection (LOD) | The lowest amount of analyte that can be detected, but not necessarily quantitated. |
| Limit of Quantitation (LOQ) | The lowest amount of analyte that can be determined with acceptable accuracy and precision. |
| Robustness | A measure of the method's capacity to remain unaffected by small, deliberate variations in method parameters. |
What is the new "lifecycle" approach introduced in ICH Q2(R2) and Q14?
The simultaneous release of ICH Q2(R2) and the new ICH Q14 (Analytical Procedure Development) represents a significant modernization. It is a shift from a prescriptive, "check-the-box" approach to a more scientific, lifecycle-based model [71]. This approach emphasizes that validation is not a one-time event but a continuous process beginning with method development. A key concept is the Analytical Target Profile (ATP), a prospective summary of a method's intended purpose and desired performance criteria, defined at the beginning of development to guide a risk-based approach [71].
Diagram 1: Method Validation Lifecycle
When is method re-validation required?
Re-validation is needed when a previously-validated method undergoes changes sufficient to merit further validation activities [69]. This is usually partial validation, involving a subset of the original experiments, and is driven by the extent of the changes [69]. Common triggers include:
- Changes in the process for the synthesis of the drug substance [70].
- Changes in the composition of the finished product [70].
- Changes in the analytical procedure or major pieces of equipment [70].
- Transfer of methods from one laboratory to another [70].
Troubleshooting Guide: H2O2 Monitoring and Sensor Calibration
Why is my H2O2 sensor not reaching the target concentration?
This is a common issue in systems like Vaporized Hydrogen Peroxide (VHP) chambers, where accurate concentration is critical for sterilization efficacy [9]. The problem often stems from several potential causes.
Table 2: Troubleshooting H2O2 Concentration Issues
| Component | Check Point | Corrective Action |
|---|---|---|
| H2O2 Sensors | Calibration status and drift. | Recalibrate sensors monthly or as manufacturer recommends. Sensor drift of 2-5% per month is common [73]. |
| Chamber Seals | Integrity of door gaskets and seals. | Replace damaged seals. Leaks can allow vapor to escape, lowering concentration [9]. |
| Injection System | Nozzle cleanliness and pump function. | Clean or replace clogged nozzles. Check for inconsistent flow rates due to pump head wear [73]. |
| H2O2 Supply | Concentration and volume. | Replenish or replace the H2O2 supply if it is degraded or insufficient [73]. |
How can I address uneven distribution of H2O2 vapor or solution?
Uneven distribution creates "cold spots" and leads to inconsistent results [9]. For troubleshooting:
- Conduct a distribution study: Use chemical indicators placed throughout the area to identify cold spots [9].
- Inspect circulation systems: Ensure fans and airflow management systems are functioning correctly to ensure even vapor circulation [9].
- Review loading procedures: Ensure items or samples are placed to allow for optimal vapor or fluid circulation and are not obstructing flow [9].
What are the best practices for calibrating H2O2 sensors and analytical systems?
Calibration is the cornerstone of reliable quantitative measurement, yet guidelines for proper procedures are often minimal [35]. The following protocol is recommended for robust calibration.
Experimental Protocol: Recommended Calibration for Linear Assays [35]
- Blanking: First, perform blanking with a sample that contains all components except the analyte (e.g., distilled water for a reagent blank). This establishes a baseline and eliminates background noise.
- Two-Point Calibration: Use at least two calibrators with different concentrations covering the analytical linear range. This anchors the direction and magnitude (slope) of the relationship between signal and concentration.
- Replicate Measurements: Measure each calibrator in duplicate. A single measurement has larger uncertainty; replicates reduce between-calibration variation and the risk of an analytical shift.
- Frequency: Calibration should be performed whenever modifications are made to reagents (e.g., new batch/lot) or the instrument (after maintenance or servicing) [35].
Diagram 2: Robust Calibration Workflow
What should I do if my analytical cycle keeps aborting prematurely?
Premature cycle aborts in automated systems are often related to sensor malfunctions, pressure irregularities, or software glitches [9]. To diagnose:
- Review error logs: Identify patterns or recurring error codes [9].
- Check sensor functionality: Verify all sensors (H2O2, temperature, pressure, humidity) are properly calibrated and functioning [9] [73].
- Verify chamber pressure: Ensure pressure is maintained within specified limits throughout the cycle [9].
- Inspect the VHP generator: Ensure it is functioning correctly and supplying the appropriate amount of vapor [9].
The Scientist's Toolkit: Essential Research Reagent Solutions
This table details key materials and technologies used in modern H2O2 monitoring and method validation.
Table 3: Key Reagents and Technologies for H2O2 Research & Method Validation
| Item / Technology | Function & Application |
|---|---|
| Hybrid Hydrogen Peroxide | An innovative sterilization agent that combines hydrogen peroxide with synergistic components to enhance effectiveness at lower concentrations, improving material compatibility and penetration [22]. |
| Stabilized H2O2 Solutions | Certified reference solutions of known concentration are critical for calibrating sensors and preparing standards for analytical methods [73] [35]. |
| Nanosensors | Advanced sensors capable of detecting H2O2 at the molecular level, providing unprecedented accuracy for monitoring in complex environments, including plants [22] [74]. |
| Chemical Indicators | Used in vapor distribution studies to visually identify "cold spots" or areas with insufficient H2O2 concentration during validation of sterilization cycles [9]. |
| Certified Reference Materials | Materials with defined concentrations and traceability to a higher order standard. Essential for establishing the accuracy of a method during validation and for regular calibration [35] [70]. |
| Third-Party Quality Controls | Independent control materials are recommended to detect reagent or calibrator variation that might be obscured by manufacturer-supplied controls, thereby mitigating the risk of accepting an erroneous calibration [35]. |
| AI-Assisted Validation Systems | Tools that use artificial intelligence to analyze vast amounts of validation data in real-time, identifying patterns and anomalies to minimize false positives and optimize performance [22]. |
Conclusion
The accurate calibration and monitoring of in planta H2O2 is paramount for advancing our understanding of redox biology, with significant implications for biomedical and clinical research. This guide has synthesized key insights from foundational principles to cutting-edge methodologies, highlighting that the choice of technique—from destructive spectrophotometric assays to non-invasive genetically encoded sensors—must align with specific research goals regarding sensitivity, spatial resolution, and real-time monitoring. The future of this field lies in the continued integration of interdisciplinary approaches, leveraging nanotechnology and artificial intelligence to develop next-generation, highly sensitive, and multiplexed sensors. These advancements will not only refine our grasp of plant physiology but also accelerate the translation of redox biology discoveries into novel therapeutic strategies for human diseases linked to oxidative stress.
References
- 1. The Role of Hydrogen Peroxide in Redox-Dependent Signaling [https://pmc.ncbi.nlm.nih.gov/articles/PMC6211135/]
- 2. Role of Metabolic H2O2 Generation: REDOX SIGNALING ... [https://www.sciencedirect.com/science/article/pii/S0021925820419520]
- 3. Hydrogen peroxide – production, fate and role in redox ... [https://biosignaling.biomedcentral.com/articles/10.1186/s12964-015-0118-6]
- 4. Signaling pathways in reactive oxygen species-induced ... [https://pubmed.ncbi.nlm.nih.gov/10359739/]
- 5. Activation of apoptosis signalling pathways by reactive ... [https://www.sciencedirect.com/science/article/pii/S0167488916302324]
- 6. Superoxide dismutase 1 (SOD1) is essential for H2O2- ... [https://pubmed.ncbi.nlm.nih.gov/18480265/]
- 7. Superoxide dismutase 1 (SOD1) is essential for H2O2 ... [https://pmc.ncbi.nlm.nih.gov/articles/PMC2438219/]
- 8. An Implantable and Self-Powered Sensing System for the ... [https://www.sciencedirect.com/science/article/pii/S2095809924000626]
- 9. VHP Chamber Troubleshooting: 10 Common Issues - Youth [https://youthfilter.com/news/vhp-chamber-troubleshooting-10-common-issues/]
- 10. H2O2 Analyzer - PI2114 (Service Manual) [https://www.picarro.com/environmental/h2o2_analyzer_pi2114_service_manual]
- 11. Scavenging Enzymes (Ascorbate Peroxidase and ... [https://www.frontiersin.org/journals/plant-science/articles/10.3389/fpls.2016.00301/full]
- 12. The Role of H2O2-Scavenging Enzymes (Ascorbate ... [https://pmc.ncbi.nlm.nih.gov/articles/PMC8772849/]
- 13. Hydrogen peroxide detoxifying enzymes show different ... [https://pmc.ncbi.nlm.nih.gov/articles/PMC8484409/]
- 14. Cross Talk between H2O2 and Interacting Signal ... [https://www.frontiersin.org/journals/plant-science/articles/10.3389/fpls.2016.00570/full]
- 15. Detection of Hydrogen Peroxide by DAB Staining in ... [https://pmc.ncbi.nlm.nih.gov/articles/PMC4932902/]
- 16. A simple, rapid, and reliable protocol to localize hydrogen ... [https://www.frontiersin.org/journals/plant-science/articles/10.3389/fpls.2014.00745/full]
- 17. Hydrogen Peroxide Measurement Can Be Used to Monitor ... [https://www.mdpi.com/2037-0164/14/3/43]
- 18. An activatable near-infrared probe for in situ monitoring of ... [https://www.sciencedirect.com/science/article/abs/pii/S0308814625019430]
- 19. Rapid and effective protocol to measure glutathione ... [https://bnrc.springeropen.com/articles/10.1186/s42269-024-01250-x]
- 20. In Situ Plant Sensors: Toward Real-Time, High-Resolution ... [https://pubmed.ncbi.nlm.nih.gov/40830763/]
- 21. A review on real-time plant monitoring sensors for smart ... [https://www.sciencedirect.com/science/article/abs/pii/S1385894725097104]
- 22. Hybrid Hydrogen Peroxide Validation Guide 2025 - QUALIA [https://qualia-bio.com/blog/hybrid-hydrogen-peroxide-validation-guide-2025/]
- 23. DAB Staining [https://www.protocols.io/view/dab-staining-c8sjzwcn.html]
- 24. Errors in Spectrophotometry and Calibration Procedures to ... [https://pmc.ncbi.nlm.nih.gov/articles/PMC5293527/]
- 25. Electrochemical Biosensors - Sensor Principles and ... [https://pmc.ncbi.nlm.nih.gov/articles/PMC3663003/]
- 26. What Is Calibration? Understanding the Basics [https://www.fluke.com/en-us/learn/blog/calibration/about-calibration?srsltid=AfmBOopX_6imTX-bjrMCU3aMupE2Rw3zpxMwotJNuabZaZOZ8n4T2GuW]
- 27. Calibration Methods and Best Practices Ensuring Quality ... [https://www.tek.com/en/blog/calibration-methods-and-best-practices-ensuring-quality-and-efficiency]
- 28. Hydrogen Peroxide Electrochemical Sensor Based on Ag ... [https://pmc.ncbi.nlm.nih.gov/articles/PMC10611109/]
- 29. Portable visual and electrochemical detection of hydrogen ... [https://www.nature.com/articles/s41378-023-00623-y]
- 30. A tutorial on calibration measurements and ... [https://pmc.ncbi.nlm.nih.gov/articles/PMC7075534/]
- 31. Noninvasive In Planta Live Measurements of H2O2 and ... [https://link.springer.com/protocol/10.1007/978-1-0716-3826-2_4]
- 32. Noninvasive In Planta Live Measurements of H2O2 and ... [https://pubmed.ncbi.nlm.nih.gov/38587735/]
- 33. Real-time hypoxia monitoring using live cell imaging [https://www.revvity.com/blog/real-time-hypoxia-monitoring-using-live-cell-imaging]
- 34. Redox-sensitive fluorescent biosensors detect ... [https://www.sciencedirect.com/science/article/pii/S0891584922001332]
- 35. Calibration – an under-appreciated component in the ... [https://pmc.ncbi.nlm.nih.gov/articles/PMC11206179/]
- 36. Using a modified ferrous oxidation-xylenol orange (FOX) ... [https://pubmed.ncbi.nlm.nih.gov/11782190/]
- 37. Spectrophotometric Determination of Hydrogen Peroxide in ... [https://www.sciencedirect.com/science/article/pii/S0022030267874472]
- 38. FFPE vs Frozen Tissue Samples [https://www.biochain.com/blog/ffpe-vs-frozen-tissue-samples/]
- 39. FFPE vs. Fresh Frozen Tissue: Which is Better? [https://superiorbiodx.com/blog/ffpe-vs-frozen-tissue/]
- 40. How is Cryopreserved Tissue Different from Standard ... [https://specicare.com/how-is-cryopreserved-tissue-different-from-standard-tumor-preservation-ffpe/]
- 41. Freezing Biological Tissue Samples [https://www.leicabiosystems.com/us/knowledge-pathway/freezing-biological-samples/]
- 42. Guidelines for Handling Tissue Samples when using the ... [https://www.neb.com/en-us/tools-and-resources/usage-guidelines/guidelines-for-handling-tissue-samples-with-the-monarch-genomic-dna-purification-kit?srsltid=AfmBOoo7IMM7nEnf-TSpYQ2gLje0YAeV_fTNMwgSc4PLx36h-fQPD2mp]
- 43. Detection of Hydrogen Peroxide by DAB Staining in ... [https://bio-protocol.org/en/bpdetail?id=263&type=0]
- 44. Guidelines for measuring reactive oxygen species and ... [https://www.nature.com/articles/s42255-022-00591-z]
- 45. Methods for Detection of Mitochondrial and Cellular ... [https://pmc.ncbi.nlm.nih.gov/articles/PMC3887411/]
- 46. Overcoming Reductant Interference in Peroxidase-Based ... [https://pubmed.ncbi.nlm.nih.gov/28805389/]
- 47. Construction of genetically encoded biosensors for ... [https://pmc.ncbi.nlm.nih.gov/articles/PMC12602114/]
- 48. Fluorescent Sensing - an overview [https://www.sciencedirect.com/topics/materials-science/fluorescent-sensing]
- 49. Fluorescence Fundamentals | Thermo Fisher Scientific - US [https://www.thermofisher.com/us/en/home/references/molecular-probes-the-handbook/introduction-to-fluorescence-techniques.html]
- 50. Rapid and In-Field Sensing of Hydrogen Peroxide in Plant ... [https://pubmed.ncbi.nlm.nih.gov/38766989/]
- 51. “Where the hell did my signal go?” AKA The Problems (and ... [https://bitesizebio.com/19623/where-the-hell-did-my-signal-go-aka-the-problems-and-uses-of-photobleaching-in-microscopy-and-imaging/]
- 52. Photobleaching in Fluorescence Imaging [https://www.thermofisher.com/us/en/home/life-science/cell-analysis/cell-analysis-learning-center/molecular-probes-school-of-fluorescence/imaging-basics/protocols-troubleshooting/troubleshooting/photobleaching.html]
- 53. How to Minimize Photobleaching [https://www.enzo.com/note/how-to-minimize-photobleaching/]
- 54. Fluorescence Microscopy: A Concise Guide to Current ... [https://pmc.ncbi.nlm.nih.gov/articles/PMC3805368/]
- 55. Dräger H2O2 Calibration Service [https://www.draeger.com/en-us_us/Safety/Services/H2O2-Calibration-Service]
- 56. Hydrogen peroxide calibration [https://www.vaisala.com/en/services/calibration-services/hydrogen-peroxide-calibration]
- 57. Redox buffering and H2O2 orchestrate the vegetative ... [https://pmc.ncbi.nlm.nih.gov/articles/PMC12274077/]
- 58. Protein Assays and Quantitation Support—Troubleshooting [https://www.thermofisher.com/us/en/home/technical-resources/technical-reference-library/protein-assays-analysis-support-center/protein-assays-quantitation-support/protein-assays-quantitation-support-troubleshooting.html]
- 59. The Importance of Knowing the Dynamic Range of Your ... [https://www.stackwave.com/antibody-discovery-faqs/the-importance-of-knowing-the-dynamic-range-of-your-standard-curve]
- 60. Calibration curve [https://en.wikipedia.org/wiki/Calibration_curve]
- 61. Metrological Comparison of Indirect Calibration Methods ... [https://www.mdpi.com/1996-1944/18/18/4382]
- 62. Destructive vs Non‑Destructive Testing: Types & Examples [https://ndtblog-us.fujifilm.com/blog/destructive-versus-non-destructive-testing/]
- 63. Best practices in plant fluorescence imaging and reporting [https://pmc.ncbi.nlm.nih.gov/articles/PMC12284399/]
- 64. An Optimized in situ Quantification Method of Leaf H2O2 ... [https://pmc.ncbi.nlm.nih.gov/articles/PMC7344315/]
- 65. Troubleshooting Common Issues with Dissolved Oxygen ... [https://www.boquinstrument.com/a-news-troubleshooting-common-issues-with-dissolved-oxygen-sensors.html]
- 66. Common Gas Detector Issues and How to Troubleshoot ... [https://pksafety.com/blogs/pk-safety-blog/common-gas-detector-issues-and-how-to-troubleshoot-them?srsltid=AfmBOopWdRwZM8AMSPiO8iuVACVgVrbNkeESWet_bhadJjRX8ToVWrL4]
- 67. The influence of spatial and temporal resolutions on ... [https://www.nature.com/articles/s41598-019-42475-5]
- 68. What are the basic concepts of temporal, contrast ... [https://pmc.ncbi.nlm.nih.gov/articles/PMC4752333/]
- 69. Frequently Asked Questions about Method Validation [https://www.ofnisystems.com/services/method-validation/frequently-asked-questions-about-method-validation/]
- 70. Analytical Method Validation Questions and Answers [https://www.complianceonline.com/resources/analytical-method-validation-questions-and-answers.html]
- 71. ICH and FDA Guidelines for Analytical Method Validation [https://www.labmanager.com/ich-and-fda-guidelines-for-analytical-method-validation-34252]
- 72. FDA Guidance for Industry on Bioanalytical Method ... [https://labs.iqvia.com/blog/fda-guidance-bioanalytical-method-validation-biomarkers]
- 73. Troubleshooting VHP Generators | Common Issues and ... [https://qualia-bio.com/blog/troubleshooting-vhp-generators-common-issues-and-solutions/]
- 74. Nanosensors Convert H2O2 to Machine-Learnable ... [https://www.sciencedirect.com/science/article/pii/S2773237125000784]